prometheus is good for your small startup - shuttlecloud corp. - 2016
TRANSCRIPT

Prometheus Is Good for Your Small Startup ShuttleCloud Corp. 2016

Nacho Carretero @carretops@ShuttleCloud@ShuttleCloudEng

ShuttleCloud
• Techstars 2011
• Chicago & Madrid
• Email & contacts import API
• ISPs and email & address book providers

ShuttleFacts
• Gmail: 3 million users with our API
• High availability HA SLA 99.5%
• 6 TB/h
• +18k migrations per day
• ~30 million emails per day
• ~3 million contacts per day
• 247 providers around the world

What to expect from this presentation
• Disclaimers
• In the beginning…
• A new dawn
• Middle Ages
• Modern History
• Back to the Future

Disclaimers

Disclaimer #1

Disclaimer #2

Disclaimer #3

In the beginning…
(What we had)

Automatic Scripts

Pingdom
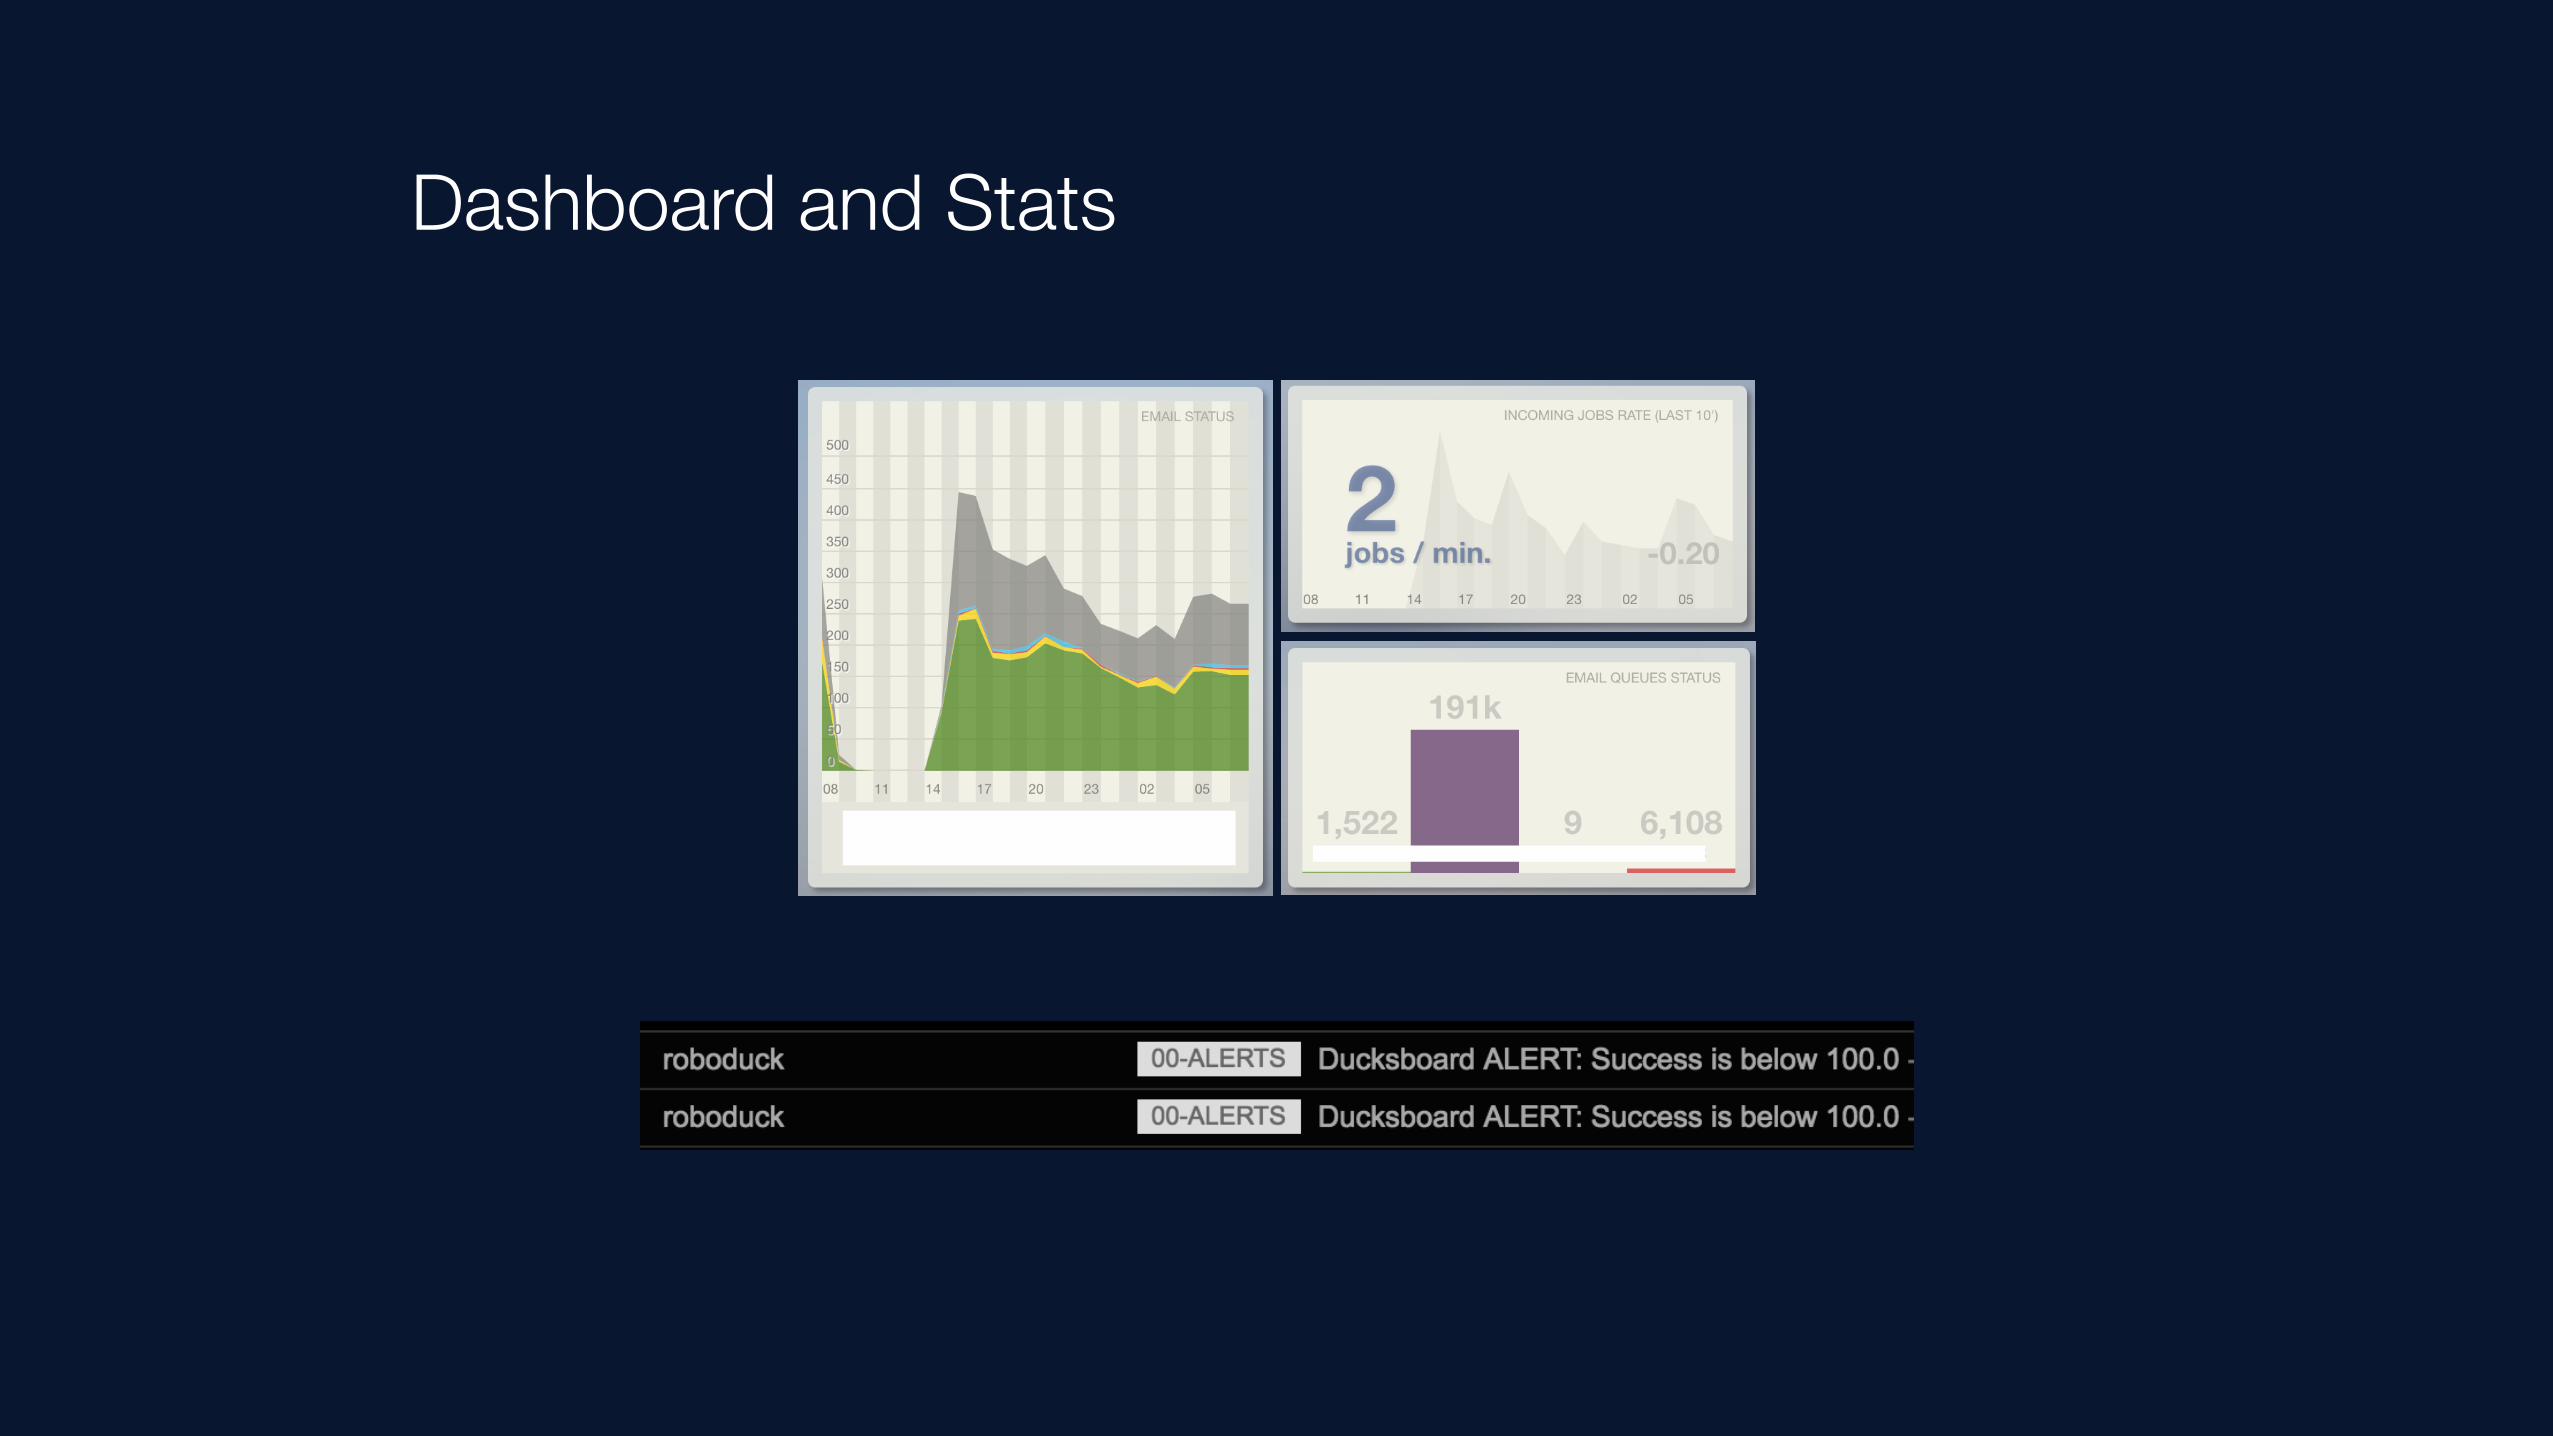
Dashboard and Stats

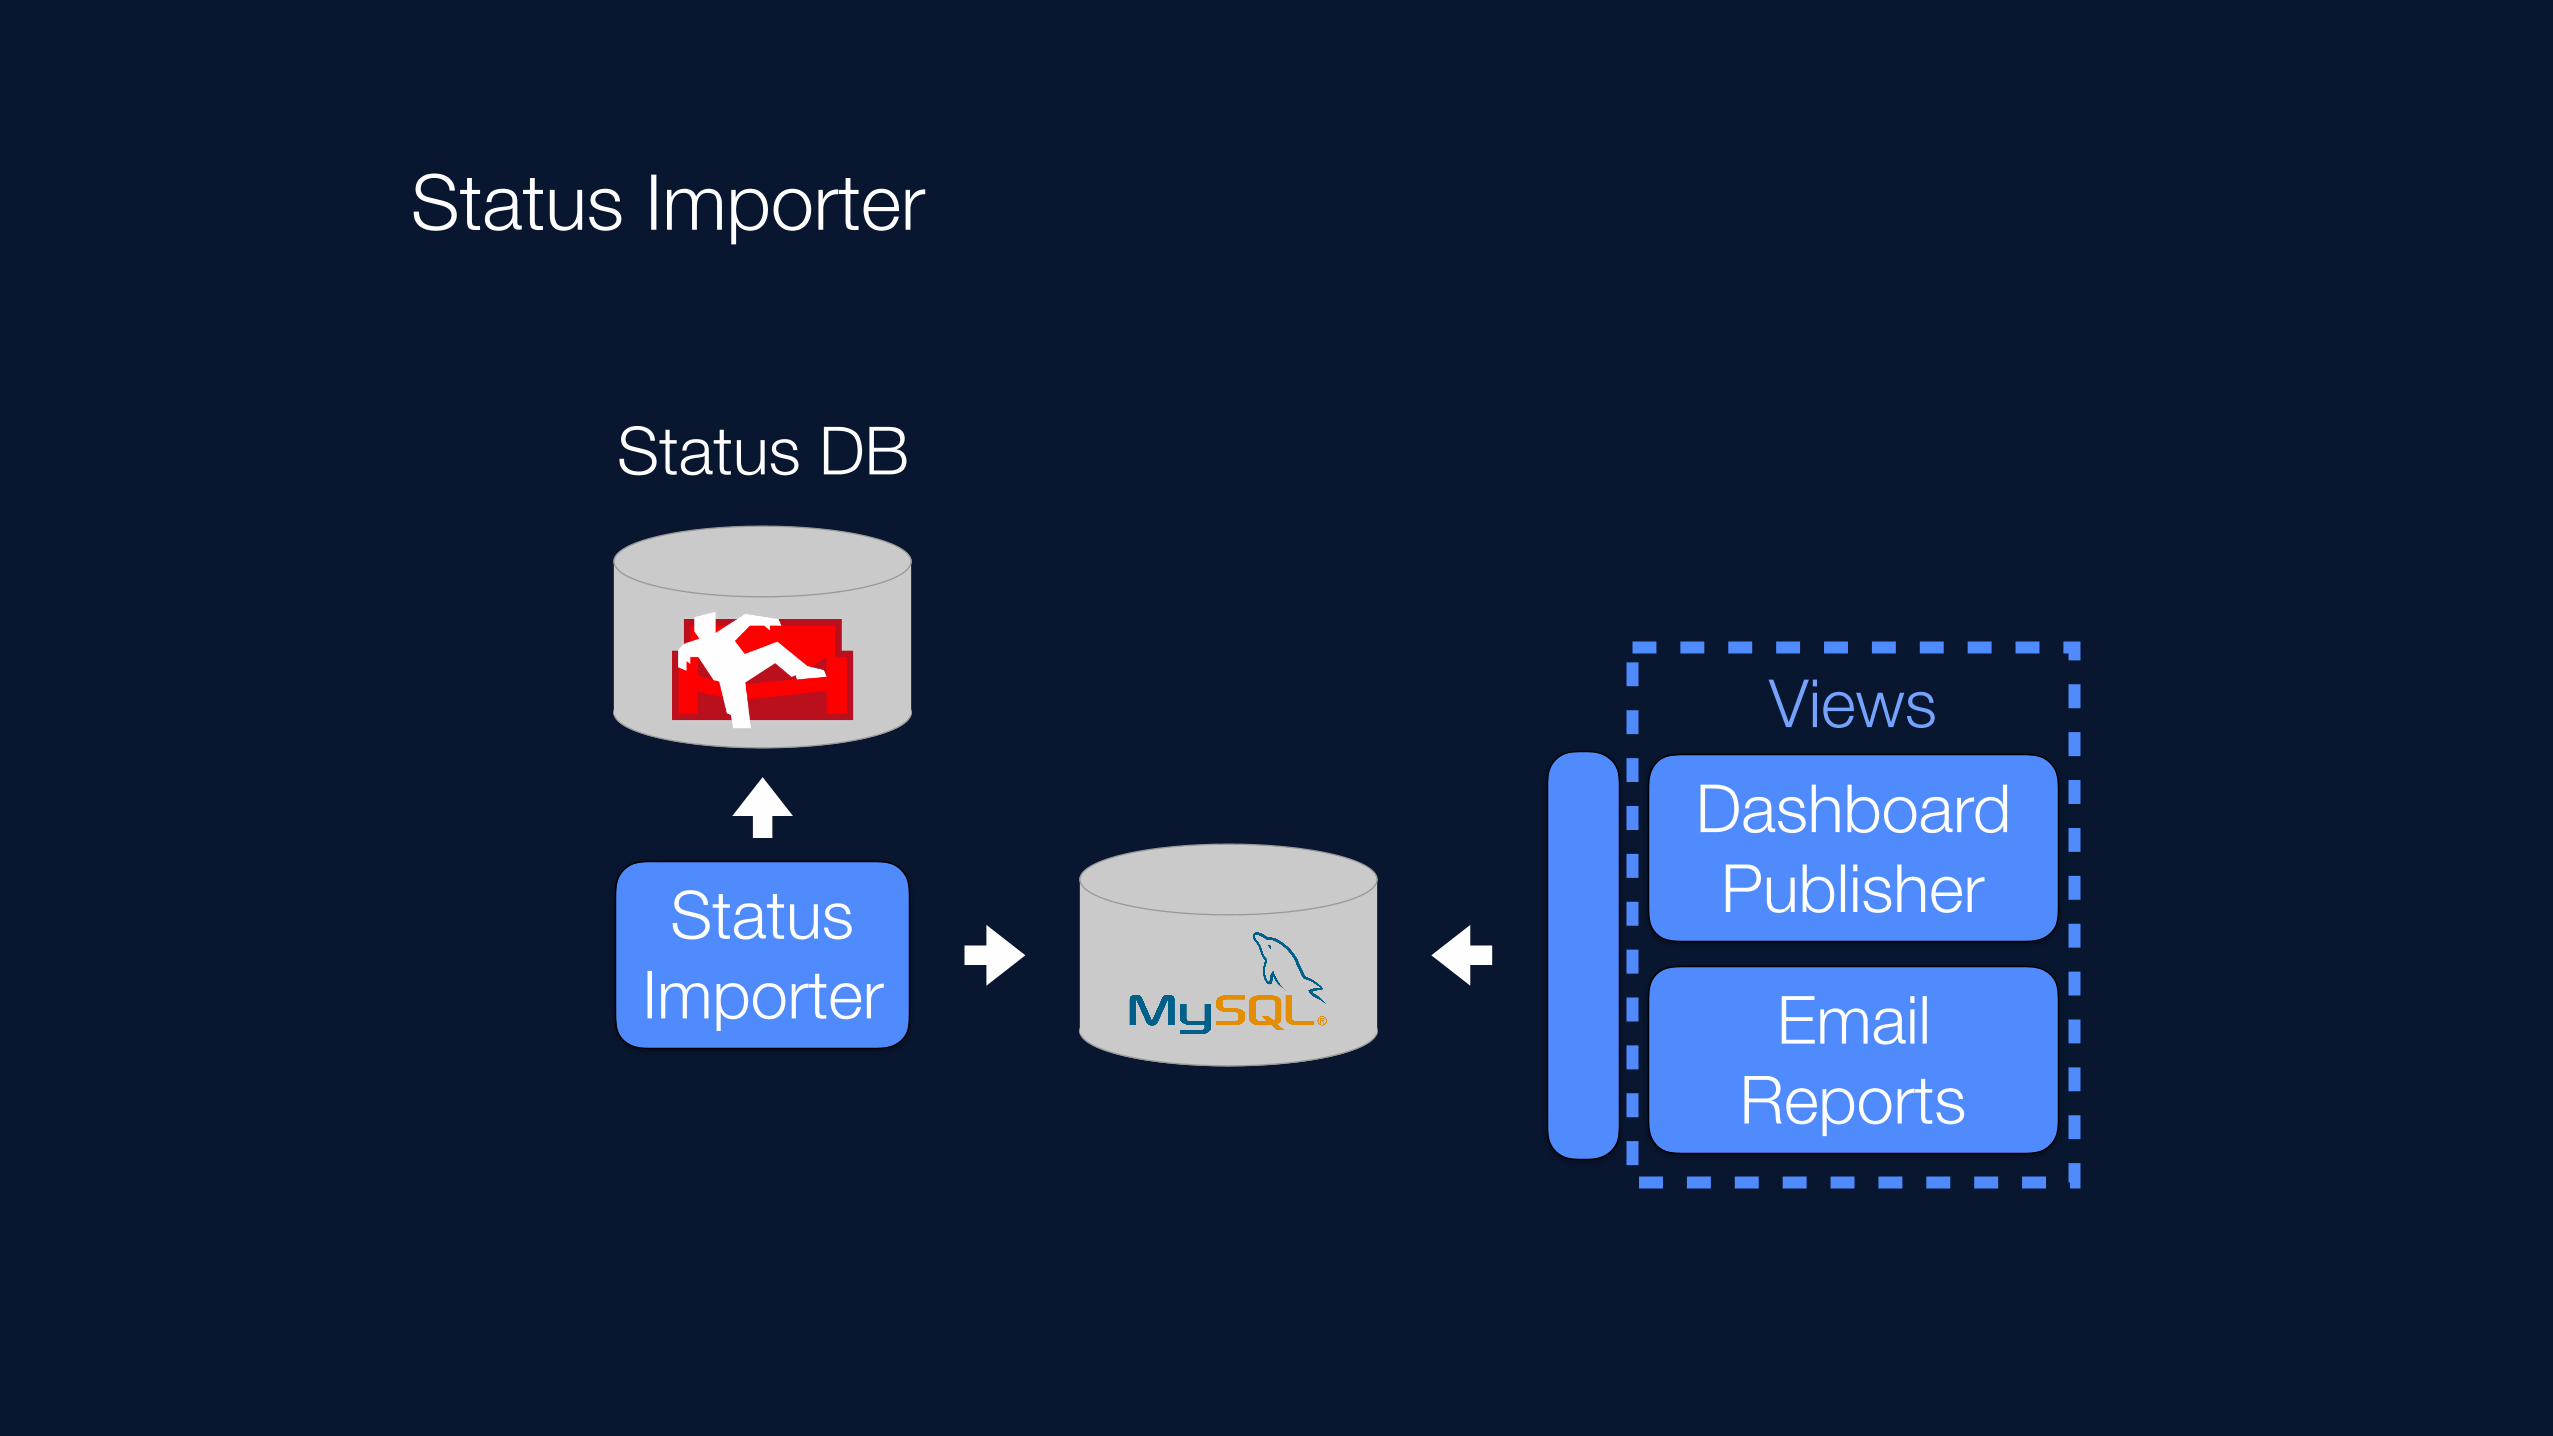
Status Importer
Status Importer
Status DB
Dashboard Publisher
Email Reports
Views


A new dawn
(New metric and alert systems)


Why Prometheus?
• Metrics have labels - flexibility (can be added/changed)
• No need of external services (i.e. Sensu with RabbitMQ)
• Service Discovery from our DNS
• Easy to install and test
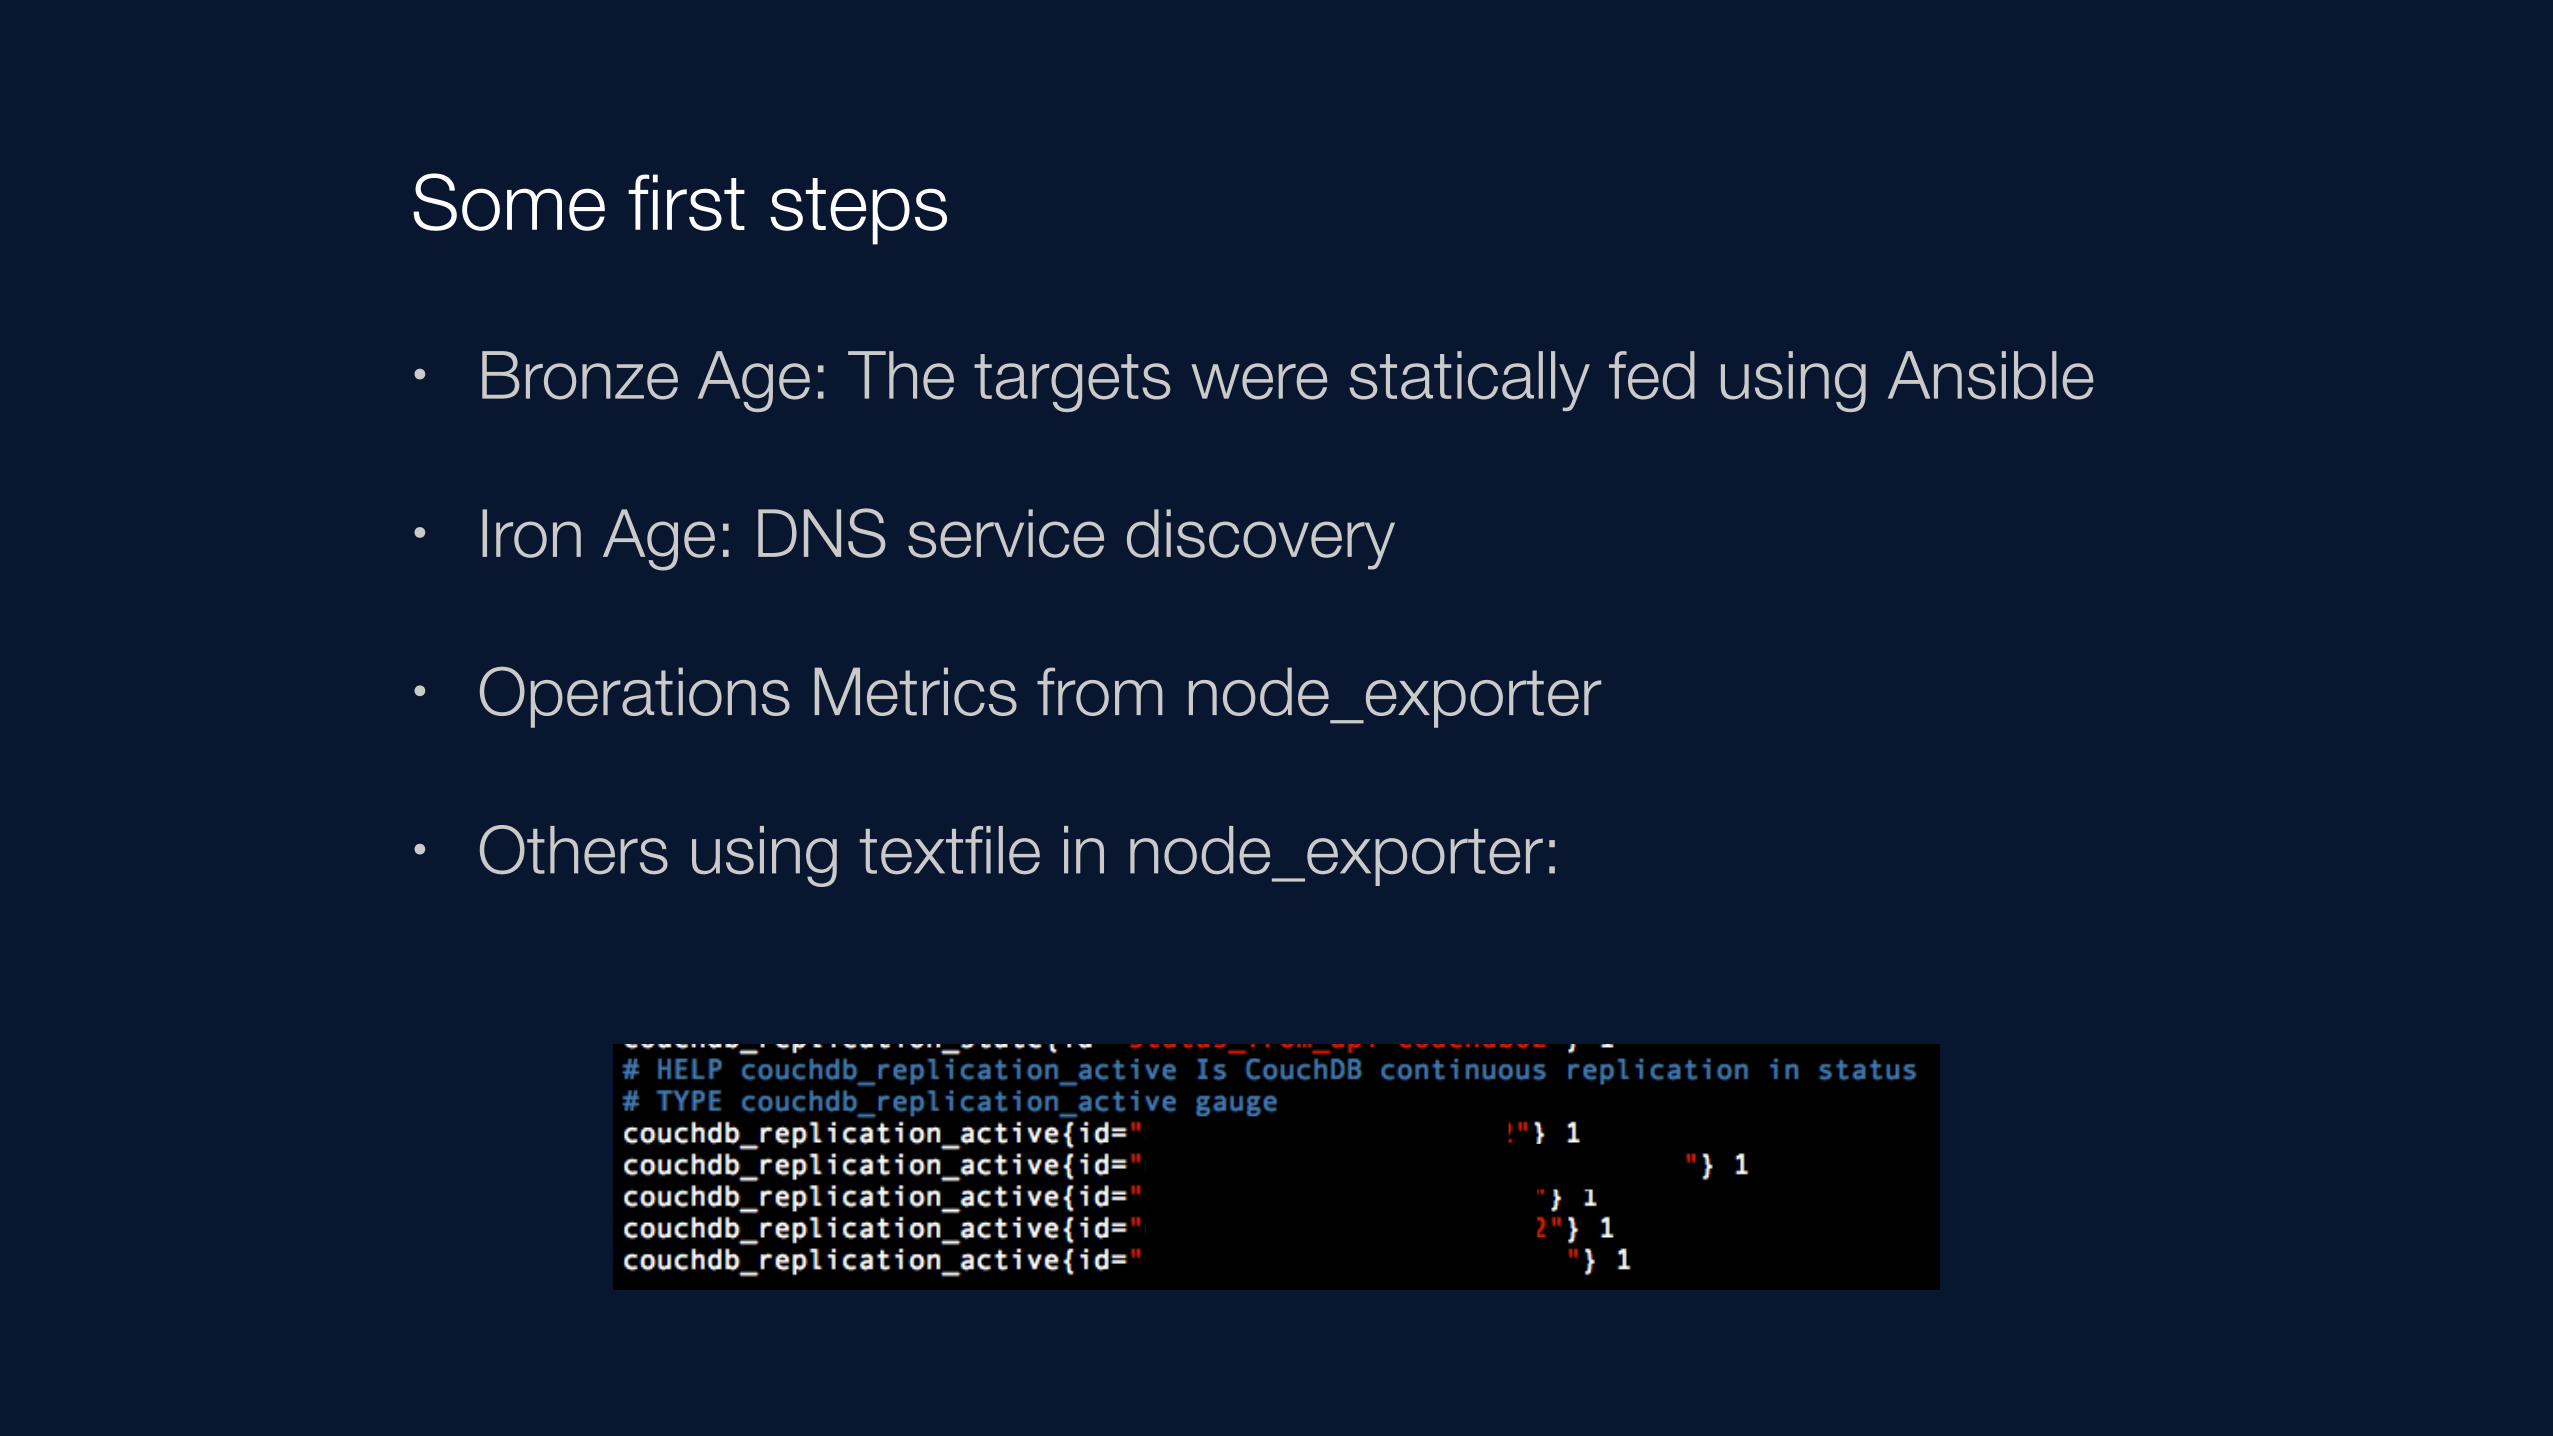
Some first steps
• Bronze Age: The targets were statically fed using Ansible
• Iron Age: DNS service discovery
• Operations Metrics from node_exporter
• Others using textfile in node_exporter:

Some first alerts
• Only Operations Alerts:
• Hard drive usage
• InstanceDown
• Absolute thresholds HD 85% capacity — Send email HD 90% capacity — Page


Middle Ages
(Business Metrics: Operation Exporter)
Status Importer
Status Importer
Dashboard Publisher
Email Reports
Status DB
Views

Replicating behaviour
Status Importer
Dashboard Publisher
Email Reports
Status DB
Prometheus Publisher

Push vs Pull
Prometheus Publisher
?

Push Gateway
• Prometheus Pushgateway (https://github.com/prometheus/pushgateway)
• Metrics Cache
• Publisher frequency vs Prometheus scraping time
Prometheus Publisher
Push Gateway

Metrics
• 3 main metrics:
• incoming_operations_last_10_min*
• incoming_status_last_10_min*
• migrations_last_5_min
• Gauges (and we were wrong!)

Gauges consequences
• Alerts kept fired unnecessarily
10mint=now
10mint=now


HA
• Publisher code is not ready to have two instances of itself
• Publisher operations are not atomic
Prometheus Publisher
Push Gateway
Prometheus Publisher

Clusterize
• Clustering solution because of other services in the same ecosystem
Prometheus Publisher
Push Gateway
Prometheus Publisher


Modern History
(Business Metrics: Revamp)
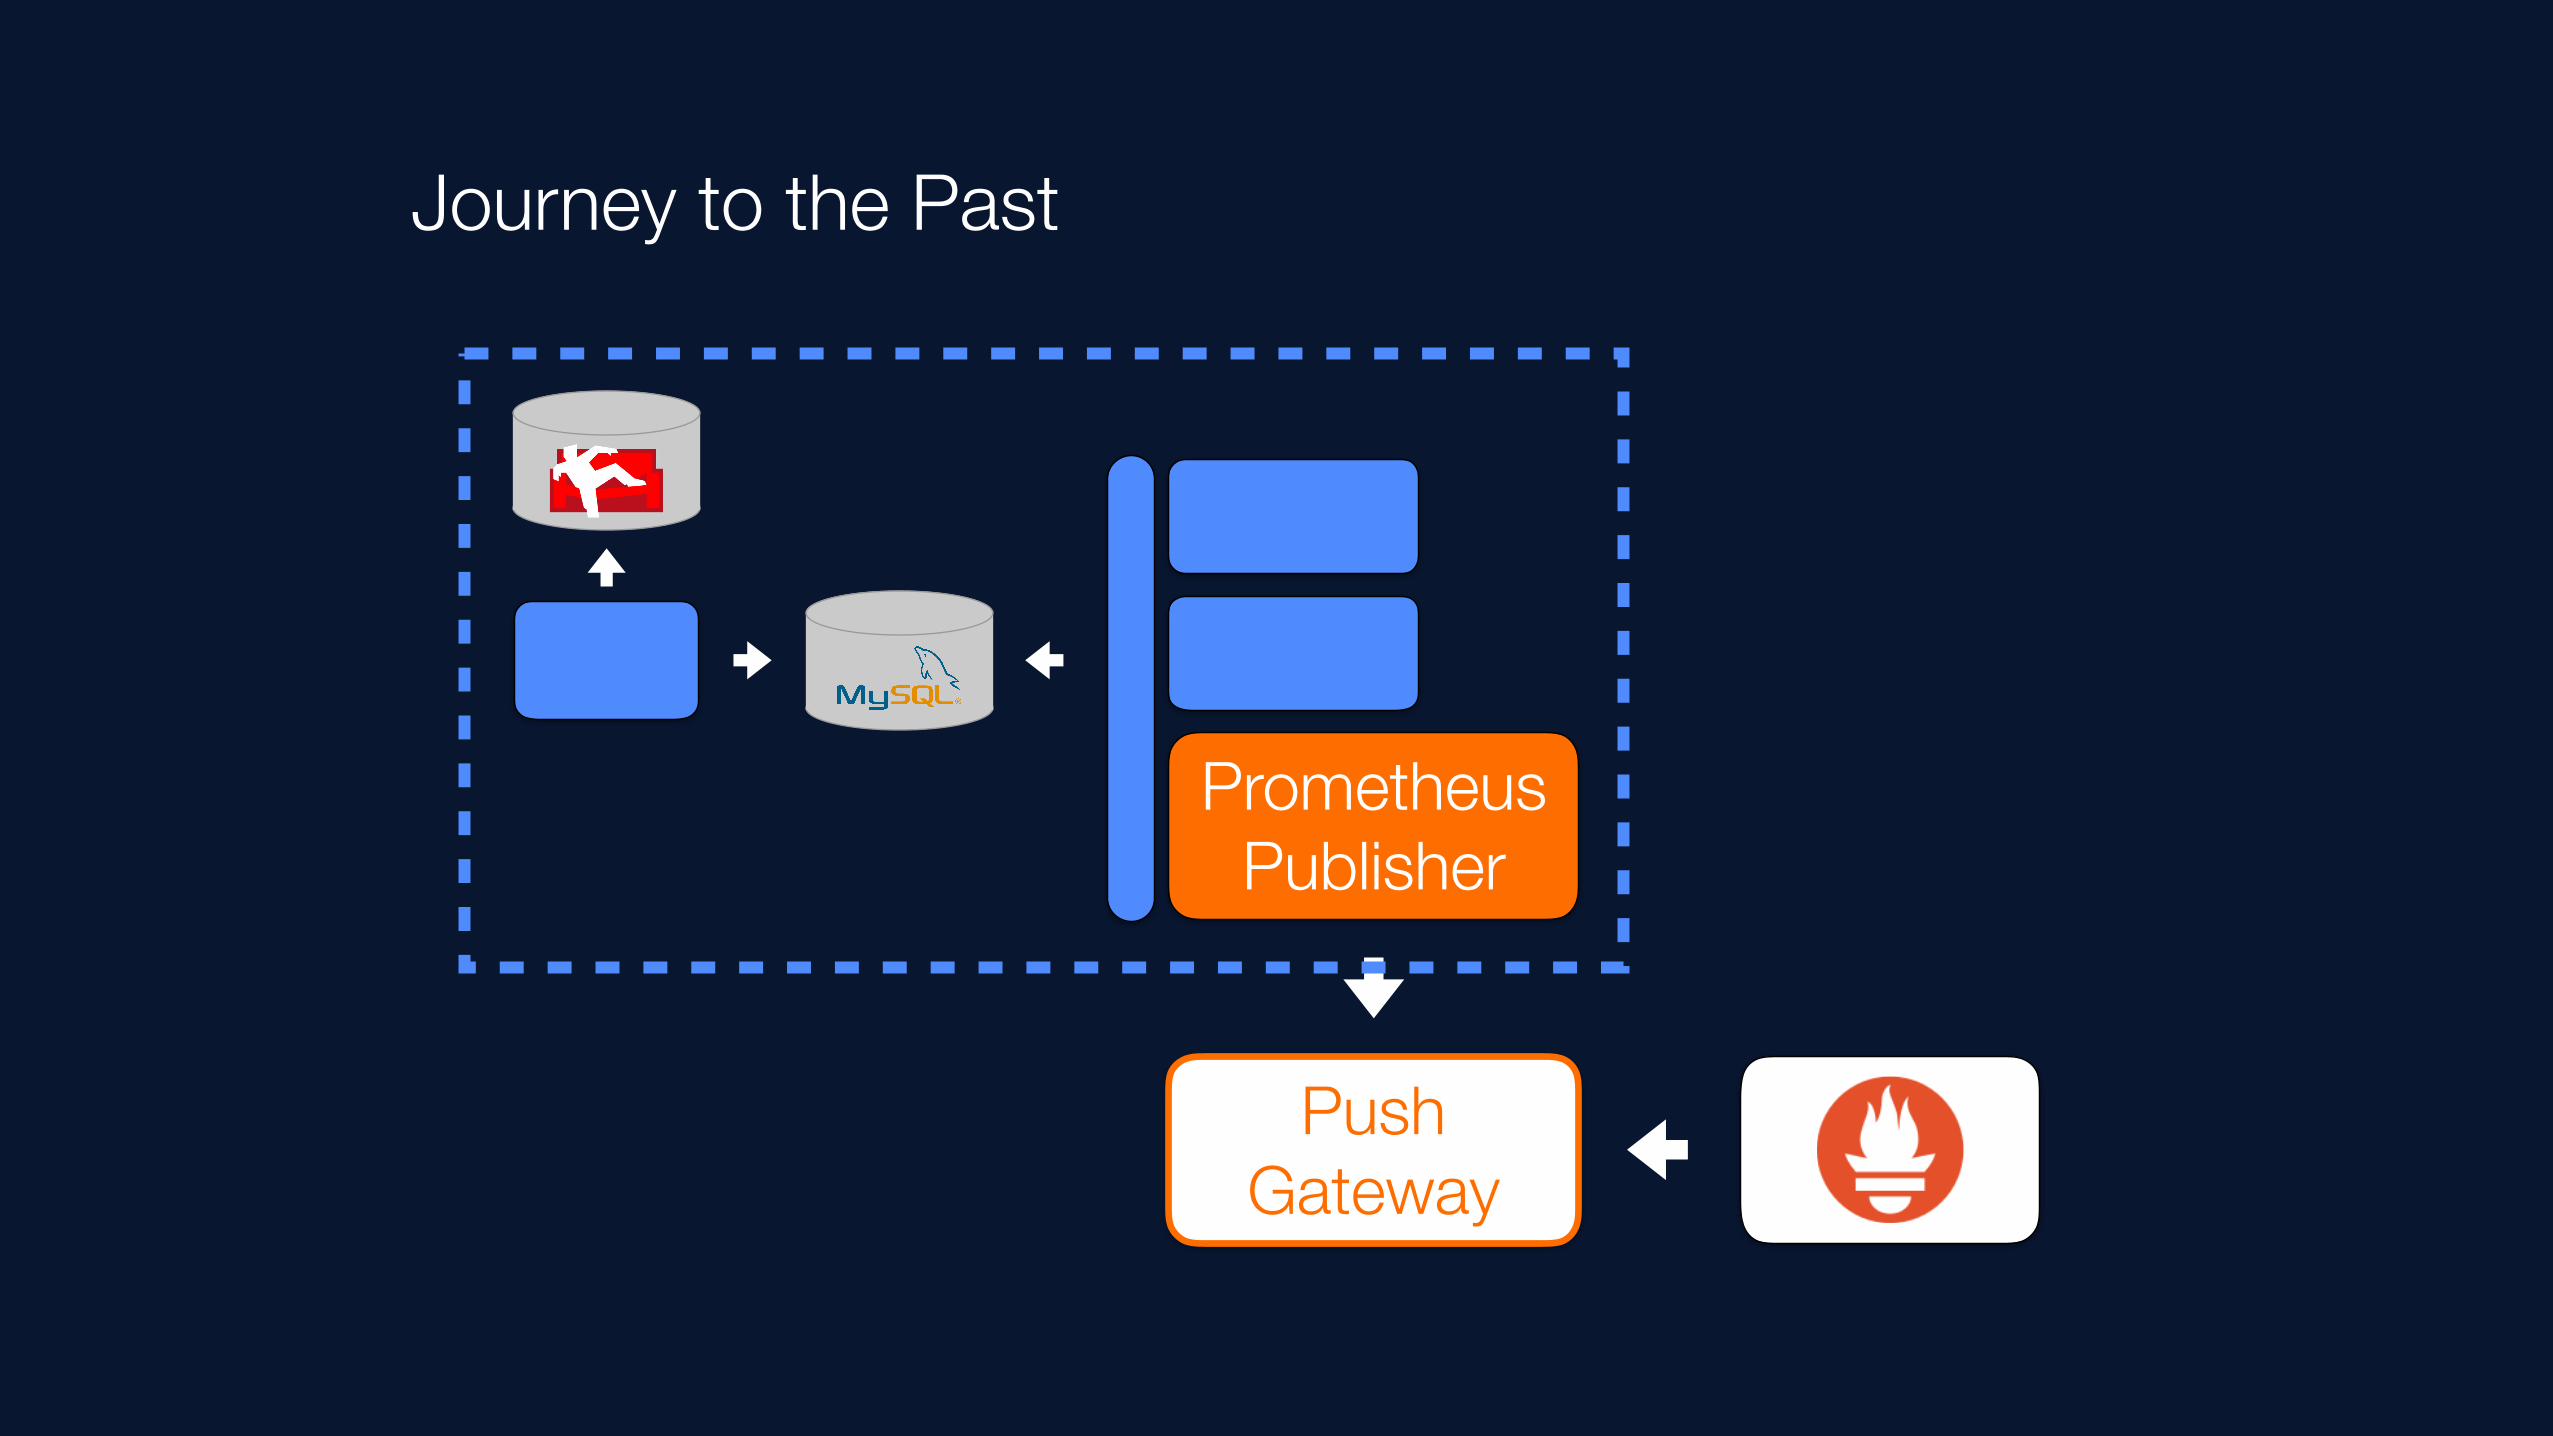
Journey to the Past
Prometheus Publisher
Push Gateway

New Architecture
Operation Exporter
Status DB

From Publisher to Exporter
• Cron based script
• Gauges
• Aggregation in Publisher
• Stateful
Operation Exporter
• Standalone App (Dockerized)
• Counters
• Aggregation in Prometheus
• Prometheus handles resets
• Stateless
Prometheus Publisher

From Publisher to Exporter
Prometheus Publisher
Operation Exporter

HA
• Operation Exporter is Stateless
• Aggregation in Prometheus:
• max(…) without(instance)
Operation Exporter
Operation Exporter

Metrics
• 3 metrics:
• operation_requests_total
• operation_statuses_total
• operation_errors_total
• Counters \ (^_^) /


Alerts
• Predict Linear vs Absolute Threshold

Alert Manager
• 0.0.4 0.1.1(now 0.5)
• Alerts as a condition-based tree vs condition-based list
• Similar alerts are grouped when notified
• Pagerduty integration improved

Current Architecture?
Operation Exporter
Status DB


Dashboard
Operation Exporter
Status DB
Dashboard Publisher

Grafana
Operation Exporter
Status DBz

Our new fancy Dashboard

Anything missing?
Operation Exporter
Status DBz
Status Importer
Email Reports

Blackbox Exporter
• Metrics on certificates expiring date
• Kudos to:
(http://www.robustperception.io/get-alerted-before-your-ssl-certificates-expire/)

Finally
Operation Exporter
Status DBz
Status Importer
Email Reports
Blackbox Exporter


Approximate usage
• Monitor 200 instances with:
• 1 Prometheus instance in GCE (n1-standard-2)
• 1 HD (used ~30GB with default retention period 15d)
• 1 Meta-monitoring instance (f1-micro)

Back to the future
(Next Steps)

CouchDB Exporter
• Currently exporting metrics with textfile via node_exporter

Prometheus in HA
Operation Exporter
Operation Exporter
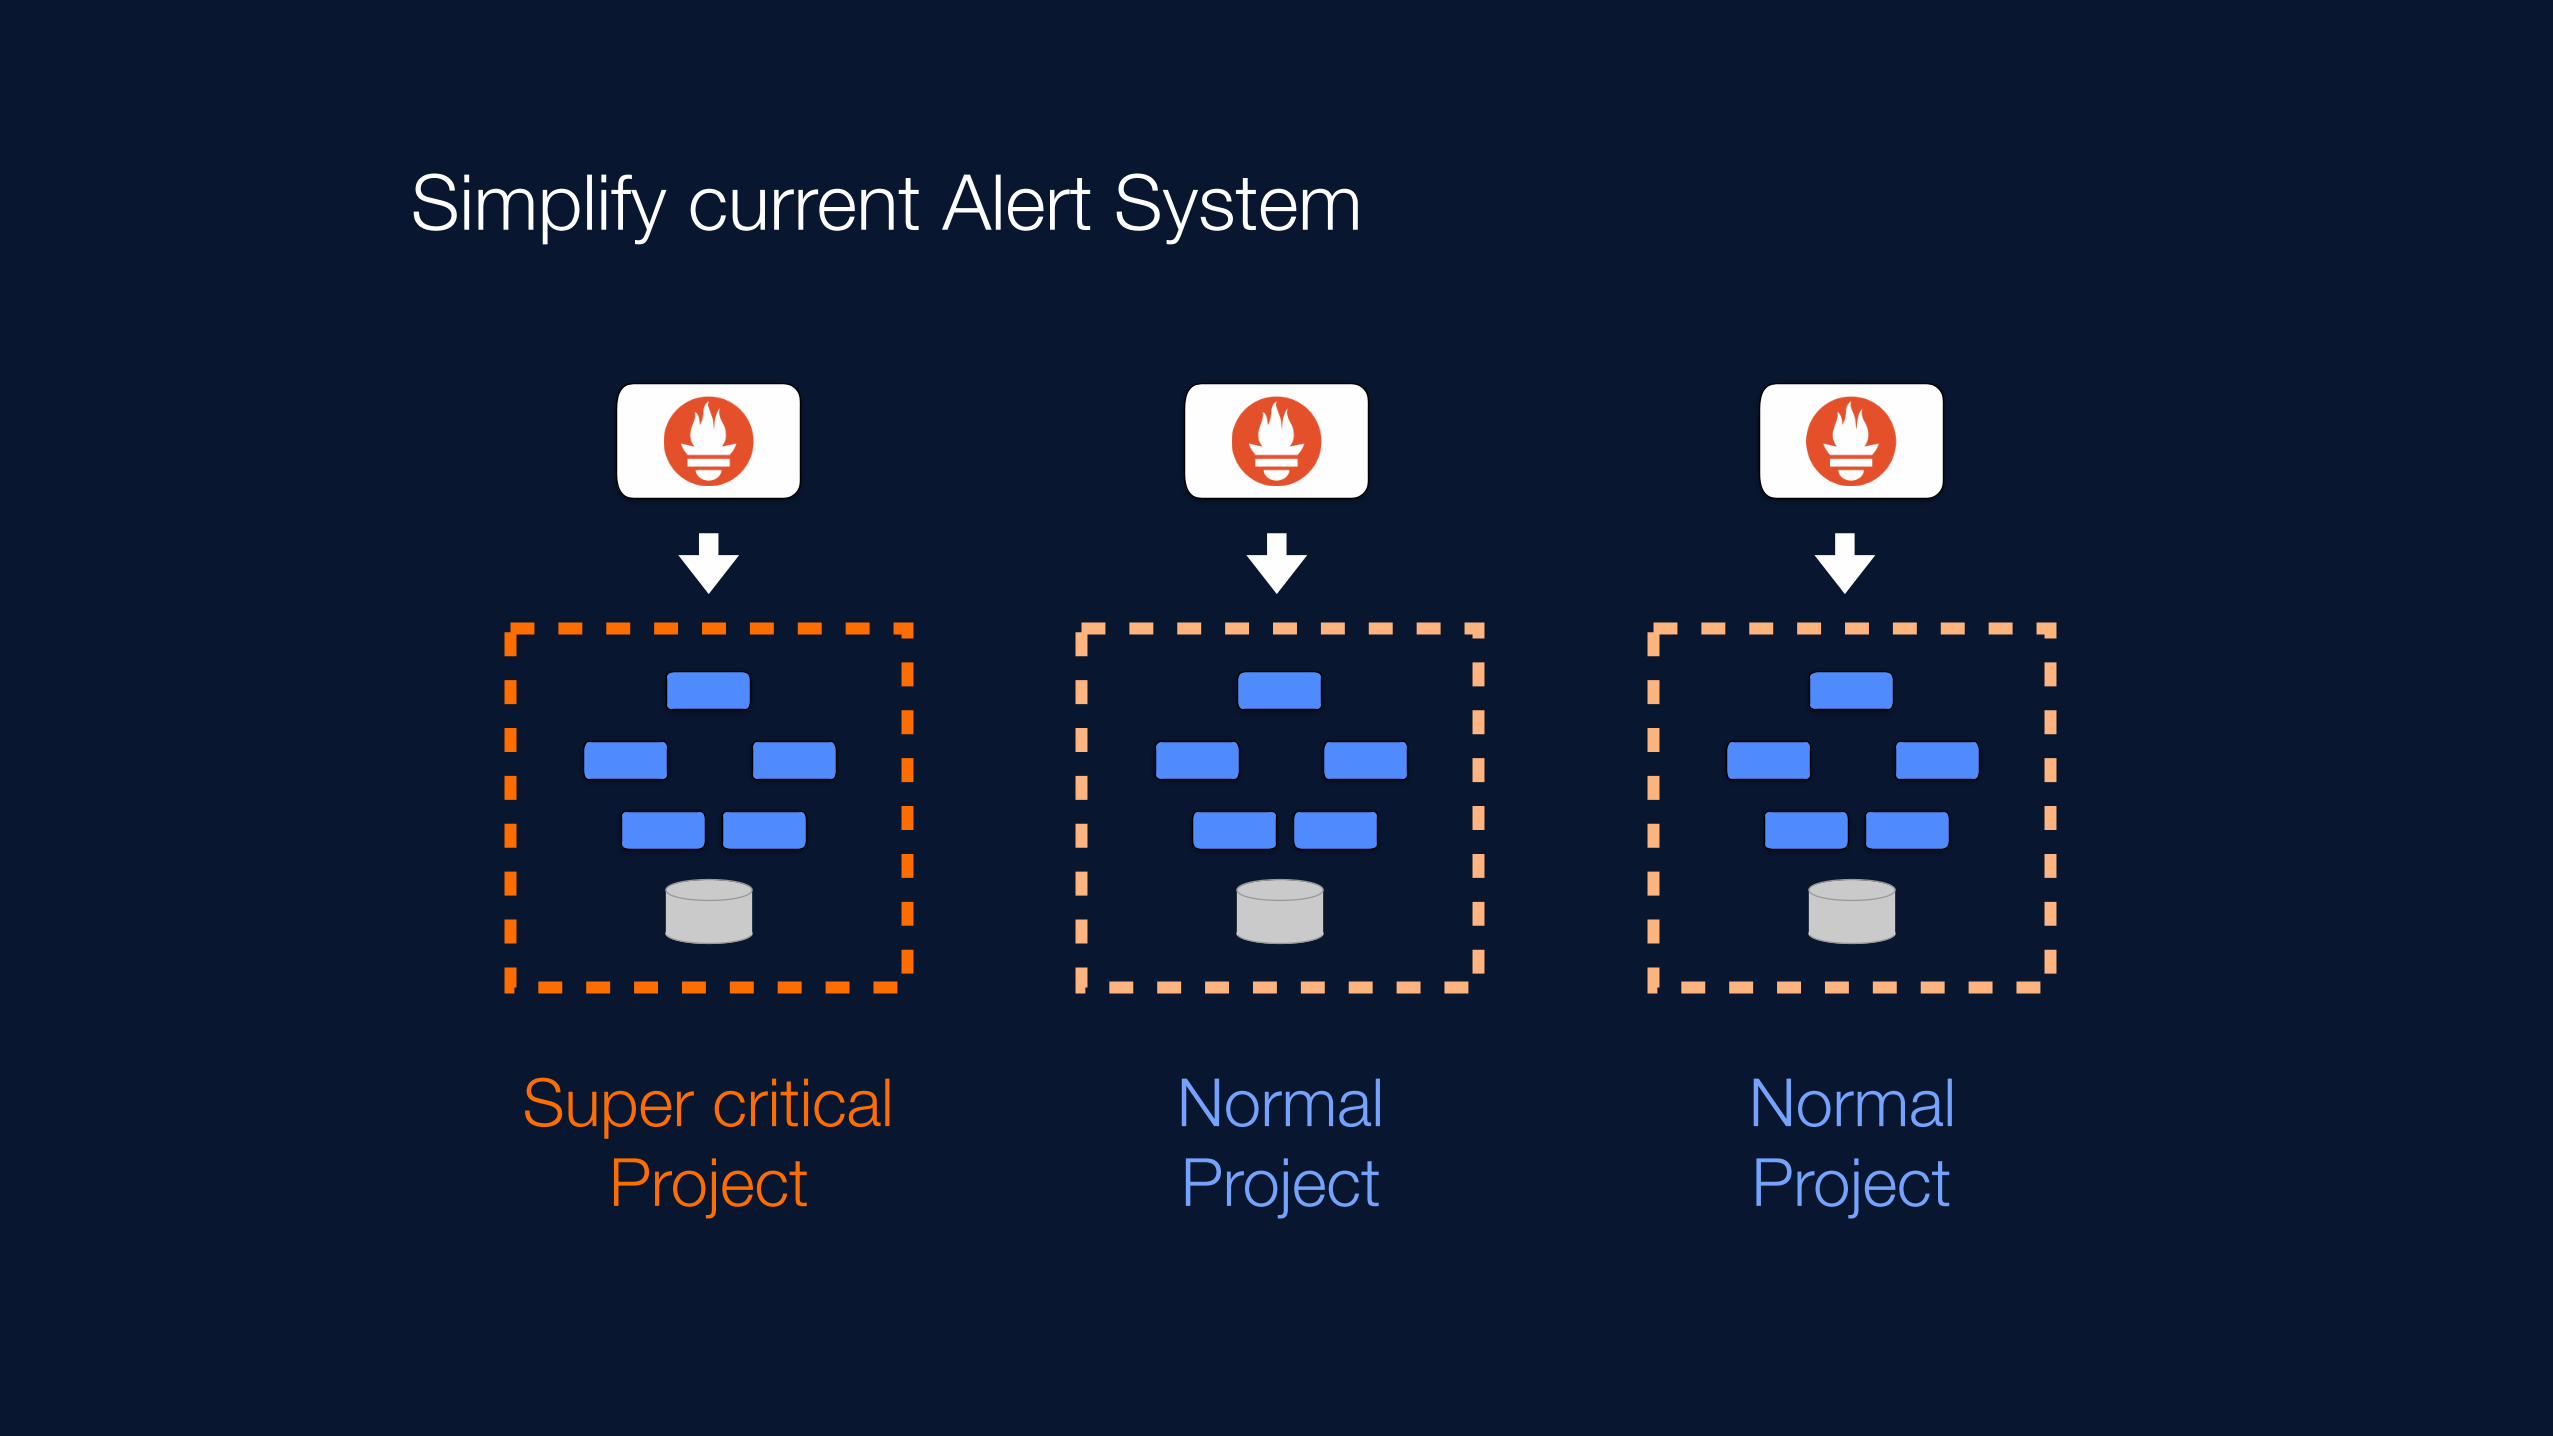
Simplify current Alert System
Super critical Project
Normal Project
Normal Project

Instrumenting Code
• Currently:
• Operation Metrics
• Business Metrics (~Blackbox Monitoring)
• Missing Metrics from Services


THANK YOU! @ShuttleCloud
@ShuttleCloudEng
