profiling a warehouse-scale computerskanev/papers/isca15wsc.pdfprofiling a warehouse-scale...
TRANSCRIPT

Profiling a warehouse-scale computer
Svilen Kanev†
Harvard UniversityJuan Pablo Darago†
Universidad de Buenos AiresKim Hazelwood†
Yahoo LabsParthasarathy Ranganathan
GoogleTipp Moseley
GoogleGu-Yeon Wei
Harvard UniversityDavid Brooks
Harvard University
AbstractWith the increasing prevalence of warehouse-scale (WSC)
and cloud computing, understanding the interactions of serverapplications with the underlying microarchitecture becomesever more important in order to extract maximum performanceout of server hardware. To aid such understanding, this paperpresents a detailed microarchitectural analysis of live data-center jobs, measured on more than 20,000 Google machinesover a three year period, and comprising thousands of differ-ent applications.
We first find that WSC workloads are extremely diverse,breeding the need for architectures that can tolerate appli-cation variability without performance loss. However, somepatterns emerge, offering opportunities for co-optimizationof hardware and software. For example, we identify com-mon building blocks in the lower levels of the software stack.This “datacenter tax” can comprise nearly 30% of cyclesacross jobs running in the fleet, which makes its constituentsprime candidates for hardware specialization in future serversystems-on-chips. We also uncover opportunities for classicmicroarchitectural optimizations for server processors, espe-cially in the cache hierarchy. Typical workloads place signifi-cant stress on instruction caches and prefer memory latencyover bandwidth. They also stall cores often, but compute heav-ily in bursts. These observations motivate several interestingdirections for future warehouse-scale computers.
1. IntroductionRecent trends show computing migrating to two extremes:software-as-a-service and cloud computing on one end, andmore functional mobile devices and sensors (“the internet ofthings”) on the other end. Given that the latter category is oftensupported by back-end computing in the cloud, designing next-
† The work was done when these authors were at Google.
Permission to make digital or hard copies of part or all of this workfor personal or classroom use is granted without fee provided that copiesare not made or distributed for profit or commercial advantage and thatcopies bear this notice and the full citation on the first page. Copyrights forthird-party components of this work must be honored. For all other uses,contact the Owner/Author. Copyright is held by the owner/author(s).ISCA’15, June 13-17, 2015, Portland, OR USAACM 978-1-4503-3402-0/15/06.http://dx.doi.org/10.1145/2749469.2750392
generation cloud and datacenter platforms is among the mostimportant challenges for future computer architectures.
Computing platforms for cloud computing and large inter-net services are often hosted in large data centers, referred toas warehouse-scale computers (WSCs) [4]. The design chal-lenges for such warehouse-scale computers are quite differentfrom those for traditional servers or hosting services, and em-phasize system design for internet-scale services across thou-sands of computing nodes for performance and cost-efficiencyat scale. Patterson and Hennessy, for example, posit thatthese warehouse-scale computers are a distinctly new classof computer systems that architects must design to [19]: “thedatacenter is the computer”[41].
At such scale, understanding performance characteristicsbecomes critical – even small improvements in performanceor utilization can translate into immense cost savings. De-spite that, there has been a surprising lack of research onthe interactions of live, warehouse-scale applications withthe underlying microarchitecture. While studies on isolateddatacenter benchmarks [14, 49], or system-level characteriza-tions of WSCs [5, 27], do exist, little is known about detailedperformance characteristics of at-scale deployments.
This paper presents the first (to the best of our knowledge)profiling study of a live production warehouse-scale computer.We present detailed quantitative analysis of microarchitectureevents based on a longitudinal study across tens of thousandsof server machines over three years running workloads andservices used by billions of users. We highlight important pat-terns and insights for computer architects, some significantlydifferent from common wisdom for optimizing SPEC-like oropen-source scale-out workloads.
Our methodology addresses key challenges to profilinglarge-scale warehouse computers, including breakdown analy-sis of microarchitectural stall cycles and temporal analysis ofworkload footprints, optimized to address variation over the36+ month period of our data (Section 2). Even though ex-tracting maximal performance from a WSC requires a carefulconcert of many system components [4], we choose to focuson server processors (which are among the main determinantsof both system power and performance [25]) as a necessaryfirst step in understanding WSC performance.
From a software perspective, we show significant diversityin workload behavior with no single “silver-bullet” applicationto optimize for and with no major intra-application hotspots(Section 3). While we find little hotspot behavior within appli-
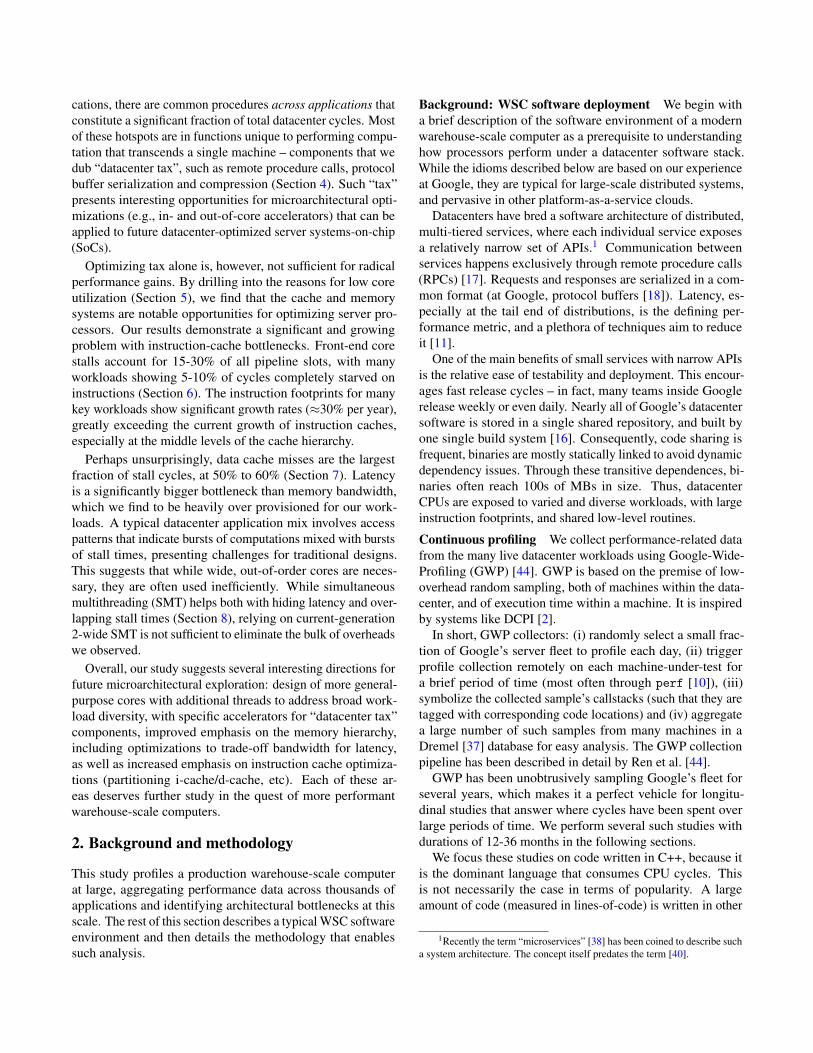
cations, there are common procedures across applications thatconstitute a significant fraction of total datacenter cycles. Mostof these hotspots are in functions unique to performing compu-tation that transcends a single machine – components that wedub “datacenter tax”, such as remote procedure calls, protocolbuffer serialization and compression (Section 4). Such “tax”presents interesting opportunities for microarchitectural opti-mizations (e.g., in- and out-of-core accelerators) that can beapplied to future datacenter-optimized server systems-on-chip(SoCs).
Optimizing tax alone is, however, not sufficient for radicalperformance gains. By drilling into the reasons for low coreutilization (Section 5), we find that the cache and memorysystems are notable opportunities for optimizing server pro-cessors. Our results demonstrate a significant and growingproblem with instruction-cache bottlenecks. Front-end corestalls account for 15-30% of all pipeline slots, with manyworkloads showing 5-10% of cycles completely starved oninstructions (Section 6). The instruction footprints for manykey workloads show significant growth rates (≈30% per year),greatly exceeding the current growth of instruction caches,especially at the middle levels of the cache hierarchy.
Perhaps unsurprisingly, data cache misses are the largestfraction of stall cycles, at 50% to 60% (Section 7). Latencyis a significantly bigger bottleneck than memory bandwidth,which we find to be heavily over provisioned for our work-loads. A typical datacenter application mix involves accesspatterns that indicate bursts of computations mixed with burstsof stall times, presenting challenges for traditional designs.This suggests that while wide, out-of-order cores are neces-sary, they are often used inefficiently. While simultaneousmultithreading (SMT) helps both with hiding latency and over-lapping stall times (Section 8), relying on current-generation2-wide SMT is not sufficient to eliminate the bulk of overheadswe observed.
Overall, our study suggests several interesting directions forfuture microarchitectural exploration: design of more general-purpose cores with additional threads to address broad work-load diversity, with specific accelerators for “datacenter tax”components, improved emphasis on the memory hierarchy,including optimizations to trade-off bandwidth for latency,as well as increased emphasis on instruction cache optimiza-tions (partitioning i-cache/d-cache, etc). Each of these ar-eas deserves further study in the quest of more performantwarehouse-scale computers.
2. Background and methodology
This study profiles a production warehouse-scale computerat large, aggregating performance data across thousands ofapplications and identifying architectural bottlenecks at thisscale. The rest of this section describes a typical WSC softwareenvironment and then details the methodology that enablessuch analysis.
Background: WSC software deployment We begin witha brief description of the software environment of a modernwarehouse-scale computer as a prerequisite to understandinghow processors perform under a datacenter software stack.While the idioms described below are based on our experienceat Google, they are typical for large-scale distributed systems,and pervasive in other platform-as-a-service clouds.
Datacenters have bred a software architecture of distributed,multi-tiered services, where each individual service exposesa relatively narrow set of APIs.1 Communication betweenservices happens exclusively through remote procedure calls(RPCs) [17]. Requests and responses are serialized in a com-mon format (at Google, protocol buffers [18]). Latency, es-pecially at the tail end of distributions, is the defining per-formance metric, and a plethora of techniques aim to reduceit [11].
One of the main benefits of small services with narrow APIsis the relative ease of testability and deployment. This encour-ages fast release cycles – in fact, many teams inside Googlerelease weekly or even daily. Nearly all of Google’s datacentersoftware is stored in a single shared repository, and built byone single build system [16]. Consequently, code sharing isfrequent, binaries are mostly statically linked to avoid dynamicdependency issues. Through these transitive dependences, bi-naries often reach 100s of MBs in size. Thus, datacenterCPUs are exposed to varied and diverse workloads, with largeinstruction footprints, and shared low-level routines.
Continuous profiling We collect performance-related datafrom the many live datacenter workloads using Google-Wide-Profiling (GWP) [44]. GWP is based on the premise of low-overhead random sampling, both of machines within the data-center, and of execution time within a machine. It is inspiredby systems like DCPI [2].
In short, GWP collectors: (i) randomly select a small frac-tion of Google’s server fleet to profile each day, (ii) triggerprofile collection remotely on each machine-under-test fora brief period of time (most often through perf [10]), (iii)symbolize the collected sample’s callstacks (such that they aretagged with corresponding code locations) and (iv) aggregatea large number of such samples from many machines in aDremel [37] database for easy analysis. The GWP collectionpipeline has been described in detail by Ren et al. [44].
GWP has been unobtrusively sampling Google’s fleet forseveral years, which makes it a perfect vehicle for longitu-dinal studies that answer where cycles have been spent overlarge periods of time. We perform several such studies withdurations of 12-36 months in the following sections.
We focus these studies on code written in C++, because itis the dominant language that consumes CPU cycles. Thisis not necessarily the case in terms of popularity. A largeamount of code (measured in lines-of-code) is written in other
1Recently the term “microservices” [38] has been coined to describe sucha system architecture. The concept itself predates the term [40].

languages (mostly Java, Python and Go), however such code isresponsible for a small fraction of cycles overall. Focusing onC++ also simplifies symbolizing callstacks with each collectedsample. The aggregated set of these symbolized callstacksenables analyses that transcend application boundaries, andallows us to search for hotspots at true warehouse scale.
Architecture-specific collection To analyze more subtle in-teractions of warehouse-scale applications with the underlyinghardware, we use processor performance counters that go be-yond attributing cycles to code regions. We reuse the majorityof GWP’s infrastructure to collect performance counters andask microarchitecture-specific questions. Since counters areintricately tied to a specific microarchitecture, we limit suchstudies to machines with Intel Ivy Bridge processors.
In more detail, for each such dedicated collection, we ran-domly select ≈ 20,000 Ivy Bridge machines, and profile alljobs running on them to gather 1-second samples of the respec-tive performance counters. For per-thread measurements, wealso collect the appropriate metadata to attribute the samplesto the particular job executing the thread, and its respectivebinary (through perf’s container group support). We alsotake special care to validate the performance counters that weuse with microbenchmarks (errata in more exotic performancecounters can be common), and to only use counter expressionsthat can fit constraints of a core’s performance monitoringunit (PMU) in a single measurement (time-multiplexing thePMU often results in erroneous counter expressions). The lastrequirement limits the analyses that we perform. A commonpractice for evaluating complex counter expressions that donot fit a single PMU is to simply collect the necessary countersduring multiple runs of the same application. In a samplingscenario, this is not trivially applicable because different partsof the counter expression can come from different samples,and would require special normalization to be comparable toone another.
All expressions that we do collect in single-PMU chunksare ratios (normalized by cycles or instructions) and do not re-quire such special treatment. Their individual samples can be
Binary Descriptionads Content ad targeting – matches ads with web pages based
on page contents.bigtable Scalable, distributed, storage [7].disk Low-level distributed storage driver.flight-search
Flight search and pricing engine.
gmail Gmail back-end server.gmail-fe Gmail front-end server.indexing1,indexing2
Components of search indexing pipelines [5].
search1,search2,search3
Search leaf nodes [36].
video Video processing tasks: transcoding, feature extraction.
Table 1: Workload descriptions
0 10 20 30 40 50# Binaries
020406080
100
Dist
ribut
ion
of c
ycle
s (C
DF %
)
Hottest: 9.9 %
Figure 1: There is no “killer application” to optimize for. Thetop 50 hottest binaries only cover ≈60% of WSC cycles.
compared against each other and aggregated without any addi-tional normalization. We typically show the distributions ofsuch samples, compressed in box plots. Boxes, drawn aroundthe median value, represent the 25-th and 75-th percentiles ofsuch distributions, while whiskers (in the plots where shown) –the 10-th and 90-th.
Performance counter analysis We use a performance anal-ysis methodology, called Top-Down, recently proposed byYasin [48]. Top-Down allows for reconstructing approximateCPI stacks in modern out-of-order processors, a task con-sidered difficult without specialized hardware support [13].The exact performance counter expressions that we use areidentical with the ones listed in the Top-Down work [48].
Similar to other cycle counting methodologies [6, 13], Top-Down calculates the cost of microarchitectural stall events incycles, as opposed to in more conventional metrics (e.g. missrates, misses per kilo-instruction – MPKI), quantifying theend cost in performance for such events. This is especiallyimportant for modern complex out-of-order processors whichhave a wide range of latency hiding mechanisms. For example,a high value for MPKI in the L1 instruction cache can raisea false alarm for optimizing instruction footprint. In fact, amodern core’s front end has sufficient buffering, and misses inthe L1 alone cause very little end-performance impact.
Workloads While we do make the observation that work-loads are getting increasingly diverse, we focused on 12 bi-naries (Table 1) for in-depth microarchitectural analysis. Themain selection criterion was diversity. Thus, we ended up withjobs from several broad application classes – batch (video,indexing) vs. latency-conscious (the rest); low-level ser-vices (disk, bigtable) through back-ends (gmail, search)to front-end servers (gmail-fe). We strived to include variedmicroarchitectural behaviors – different degrees of data cachepressure, front-end bottlenecks, extracted IPC, etc. We alsoreport averages aggregated over a significantly larger numberof binaries than the hand-picked 12.
Finally, we make the simplifying assumption that one appli-cation equals one binary and use the two terms interchange-ably (Kambadur et al. [24] describe application delineationtradeoffs in a datacenter setting). This has no impact on anyresults for the 12 workloads described above, because they arecomposed of single binaries.

Aug
Y1N
ov Y
1Fe
b Y2
May
Y2
Jul Y2
Oct
Y2
Jan Y
3Apr
Y3
Jul Y3
Sep
Y3
Dec
Y3
Mar
Y4
Jun Y
4Aug
Y4
0
20
40
60
80
100
Cyc
les
in50 h
ott
est
bin
arie
s (%
)
Trend: -4.97 % / year; R2 =0.67
Figure 2: Workloads are getting more diverse. Fraction of cy-cles spent in top 50 hottest binaries is decreasing.
3. Workload diversity
The most apparent outcome of this study is the diversity ofworkloads in a modern warehouse-scale computer. WhileWSCs were initially created with a “killer application” inmind [5], the model of “the datacenter is the computer” hassince grown and current datacenters handle a rapidly increas-ing pool of applications.
To confirm this point, we performed a longitudinal study ofapplications running in Google’s warehouse-scale computersover more than 3 years. Figure 1 shows the cumulative dis-tribution of CPU cycles among applications for the last weekof the study. It is clear that no single application dominatesthe distribution – the hottest one accounts for ≈10% of cycles.Furthermore, it takes a tail of 50 different applications to buildup to 60% of cycles.
Figure 1 is just a single slice in time of an ongoing diversifi-cation trend. We demonstrate that in Figure 2, which plots thefraction of CPU cycles spent in the 50 hottest binaries for eachweek of the study. While at the earliest periods we examined,50 applications were enough to account for 80% of executiontime, three years later, the same number (not necessarily thesame binaries) cover less than 60% of cycles. On average,the coverage of the top 50 binaries has been decreasing by5 percentage points per year over a period of more than 3years. Note that this data set does not include data related topublic clouds, which give orders of magnitude more program-mers access to warehouse-scale resources, further increasingapplication diversity.
Applications exhibit diversity as well, having very flat ex-ecution profiles themselves. We illustrate this point with aCPU profile from search3, aggregated over a week of execu-tion on a typically-sized cluster for that particular application.Figure 3 shows the distribution of CPU cycles over leaf func-tions – the hottest single function is responsible for only 6.3%of cycles, and it takes 353 functions to account for 80% ofcycles. This tail-heavy behavior is in contrast with previousobservations. For example, another scale-out workload, Dataanalytics from CloudSuite has been shown to contain sig-nificant hotspots – with 3 functions responsible for 65% ofexecution time [49].
From a software engineer’s perspective, the absence of im-mediately apparent hotspots, both on the application and func-
0 500 1000 1500 2000# Leaf functions
020406080
100
Dist
ribut
ion
of c
ycle
s (C
DF %
)
353
Figure 3: Individual binaries are already optimized. Examplebinary without hotspots, and with a very flat execution profile.
tion levels, implies there is no substitute for datacenter-wideprofiling. While there is value in optimizing hotspots on aper-application basis, the engineering costs associated with op-timizing flat profiles are not always justified. This has drivenGoogle to increasingly invest effort in automated, compiler-driven feedback-directed optimization [8]. Nevertheless, tar-geting the right common building blocks across applicationscan have significantly larger impact across the datacenter.
From an architect’s point of view, it is similarly unlikelyto find a single bottleneck for such a large amount of codes.Instead, in the rest of the paper, after aggregating over manythousands of machines running these workloads, we point outseveral smaller-scale bottlenecks. We then tie them back tosuggestions for designing future WSC server systems.
4. Datacenter taxDespite the significant workload diversity shown in Section 3,we see common building blocks once we aggregate sampledprofile data across many applications running in a datacenter.In this section, we quantify the performance impact of thedatacenter tax, and argue that its components are prime can-didates for hardware acceleration in future datacenter SoCs.
We identify six components of this tax, detailed below,and estimate their contributions to all cycles in our WSCs.Figure 4 shows the results of this characterization over 11months – “tax cycles” consistently comprise 22-27% of allexecution. In a world of a growing number of applications(Figure 2), optimizing such inter-application common buildingblocks can lead to significant performance gains, more so thanhunting for hotspots in individual binaries. We have observedservices that spend virtually all their time paying tax, andwould benefit disproportionately from reducing it.
The components that we included in the tax classificationare: protocol buffer management, remote procedure calls(RPCs), hashing, compression, memory allocation and datamovement. In order to cleanly attribute samples between themwe only use leaf execution profiles (binning based on pro-gram counters, and not full call stacks). With leaf profiles, ifthe sample occurs in malloc() on behalf of RPC calls, thatsample will be attributed to memory allocation, and not toRPC. This also guarantees that we always under-estimate thefraction of cycles spent in tax code.
While some portions of the tax are more specific to WSCs(protobufs and RPCs), the rest are general enough to be used

Jan Y
1
Feb
Y1
Mar
Y1
Apr
Y1
May
Y1
Jun Y
1
Jul Y1
Aug
Y1
Sep
Y1
Oct
Y1
Nov
Y1
05
101520253035
Cyc
les
in t
ax c
ode
(%)
compression
allocation
hashprotobufrpcmemmove
Figure 4: 22-27% of WSC cycles are spent in different compo-nents of “datacenter tax”.
in various kinds of computation. When selecting which inter-application building blocks to classify as tax, we opted for gen-erally mature low-level routines, that are also relatively smalland self-contained. Such small, slowly-changing, widely-usedroutines are a great match for hardware specialization. In thefollowing paragraphs, we sketch out possible directions foraccelerating each tax component.
Protobuf management Protocol buffers [18] are the linguafranca for data storage and transport inside Google. One ofthe the most common idioms in code that targets WSCs is seri-alizing data to a protocol buffer, executing a remote procedurecall while passing the serialized protocol buffer to the remotecallee, and getting a similarly serialized response back thatneeds deserialization. The serialization/deserialization code insuch a flow is generated automatically by the protobuf com-piler, so that the programmer can interact with native classesin their language of choice. Generated code is the majority ofthe protobuf portion in Figure 4.
The widespread use of protocol buffers is in part due to theencoding format’s stability over time. Its maturity also impliesthat building dedicated hardware for protobuf (de)serializationin a server SoC can be successful, similarly to XML pars-ing accelerators [9, 46]. Like other data-intensive accelera-tors [28], such dedicated protobuf hardware should probablyreside closer to memory and last-level caches, and get itsbenefits from doing computation close to memory.
Remote procedure calls (RPCs) RPCs are ubiquitous inWSCs. RPC libraries perform a variety of functions, suchas load balancing, encryption, and failure detection. In ourtax breakdown, these are collectively responsible for approxi-mately a third of RPC tax cycles. The rest are taken up by sim-ple data movement of the payloads. Generic data movementaccelerators have been proposed [12] and would be beneficialfor the latter portion.
Data movement In fact, RPCs are by far not the only codeportions that do data movement. We also tracked all calls to thememcpy() and memmove() library functions to estimate theamount of time spent on explicit data movement (i.e., exposedthrough a simple API). This is a conservative estimate becauseit does not track inlined or explicit copies. Just the variants ofthese two library functions represent 4-5% of datacenter cycles.
Recent work in performing data movement in DRAM [45]could optimize away this piece of tax.
Compression Approximately one quarter of all tax cyclesare spent compressing and decompressing data.2 Compres-sion is spread across several different algorithms, each ofwhich stresses a different point in the compression ratio/speedspectrum. This need not be the case for potential hardware-accelerated compression. For example, the snappy algorithmwas designed specifically to achieve higher (de)compressionspeeds than gzip, sacrificing compression ratios in the pro-cess. Its usage might decrease in the presence of sufficientlyfast hardware for better-compressing algorithms [30, 39].
Memory allocation Memory allocation and deallocationmake up a substantial component of WSC computation (asseen by allocation in Figure 4), despite significant effortsin optimizing them in software [15, 29]. Current softwareimplementations are mostly based on recursive data structures,and interact with the operating system, which makes themnon-trivial to implement in hardware. However, the poten-tial benefits suggest that an investigation in this direction isworthwhile.
Hashing We also included several hashing algorithms in ourdefinition of tax cycles to estimate the potential for cryptogra-phy accelerators. Hashing represents a small, but consistentfraction of server cycles. Due to the large variety of hashes inuse, this is a conservative estimate.
Kernel The kernel as a shared workload component de-serves additional mention. It is obviously ubiquitous, andit is not surprising that WSC applications spend almost a fifthof their CPU cycles in the kernel (Figure 5). However, wedo not consider it acceleratable tax – it is neither small, norself-contained, and certainly not easy to replace with hardware.This is not to say it would not be beneficial to further optimizeit in software. As an example, consider the scheduler in Fig-ure 5, which has to deal with many diverse applications, eachwith even more concurrent threads (a 90-th percentile machineis running about 4500 threads concurrently [50]). Even after
Jan Y
1
Feb
Y1
Mar
Y1
Apr
Y1
May
Y1
Jun Y
1
Jul Y1
Aug
Y1
Sep
Y1
Oct
Y1
Nov
Y1
05
101520253035
Cyc
les
in k
ernel
code
(%)
kernel
kernel/sched
Figure 5: Kernel time, especially time spent in the scheduler,is a significant fraction of WSC cycles.
2We only include general-purpose lossless compression in this category,not audio/video coding.

0 20 40 60 80 100 120Pipeline slot breakdown (%)
433.milc471.omnetpp
429.mcf445.gobmk
400.perlbench
videosearch3search2search1
indexing2indexing1
gmail-fegmail
flight-searchdisk
bigtableads
RetiringFront-end bound
Bad speculationBack-end bound
Figure 6: Top-level bottleneck breakdown. SPEC CPU2006benchmarks do not exhibit the combination of low retirementrates and high front-end boundedness of WSC ones.
extensive tuning [47], the scheduler alone accounts for morethan 5% of all datacenter cycles.
5. Microarchitecture analysis
Similar to the smaller components of the “datacenter tax” thattogether form a large fraction of all cycles, we expect multi-ple performance bottlenecks on the microarchitectural level.In order to easily identify them, we use the Top-Down [48]performance analysis methodology, which we incorporated inour fleet measurement infrastructure.
Top-Down chooses the micro-op (µop) queue of a modernout-of-order processor as a dividing point between a core’sfront-end and back-end, and uses it to classify µop pipelineslots (i.e. potentially committed µops) in four broad cate-gories: Retiring, Front-end bound, Bad speculation,Back-end bound. Out of these, only Retiring classifies as“useful work” – the rest are sources of overhead that preventthe workload from utilizing the full core width.
Because of this single point of division the differentcomponents of this overhead are additive, very much likethe components of a traditional CPI stack. The detailedmethodology recursively breaks each overhead category intomore concrete subcategories (e.g., Back-end bound intoCore-bound, L1-bound, etc.), driving profiling in the direc-tion of increasingly specific microarchitectural bottlenecks.We mostly focus on the top-level breakdown and several of itsdirect descendants – deeper subcategories require more com-plex counter expressions that are harder to collect accuratelyin sampled execution, as described in Section 2.
The breakdown in the four top categories can be sum-marized in a simple decision tree. If a µop leaves theµop queue, its slot can be classified as either Retiring orBad speculation, depending on whether it makes it throughto the commit stage. Similarly, if a µop-queue slot does notbecome empty in a particular cycle, there can be two reasons:it was either empty to begin with (Front-end bound), or the
back-end was not ready for another µop (Back-end bound).These can be distinguished simply by a back-end stall signal.Intuitively, Front-end bound captures all overheads asso-ciated with fetching, instruction caches, decoding and someshorter-penalty front-end resteers, while Back-end bound iscomposed of overheads due to the data cache hierarchy andthe lack of instruction-level parallelism.
We apply this approach to the overheads of datacenterworkloads in Figure 6. It includes several SPEC CPU2006benchmarks with well-known behaviors as reference points:400.perlbench – high IPC, largest i-cache working set;445.gobmk – hard-to-predict branches, highest IL1 MPKI;429.mcf, 471.omnetpp – memory-bound, stressing mem-ory latency; 433.milc – memory-bound, stressing memorybandwidth.
The first immediate observation from Figure 6 is the smallfraction of Retiring µops– similar, or often lower, than thelowest seen in SPEC (429.mcf). This implies that most dat-acenter workloads spend cores’ time stalled on various bot-tlenecks. The majority of these stall slots are clearly due toback-end pressures – except for search2 and search3, morethan 60% of µop slots are held up due to the back-end. We willexamine these more closely in Section 7. Bad speculationslots are within the range defined by the SPEC suite. Exam-ining more closely, the 12 WSC applications show branchmisprediction rates in a wide range from 0.5× to 2× those of445.gobmk and 473.astar, with the rest of SPEC below thelower bound of that interval.
Finally, one type of behavior that clearly stands out in com-parison with SPEC benchmarks is the large fraction of stallsdue to front-end pressure. We investigate them in the nextsection.
6. Instruction cache bottlenecksThe Top-Down cycle breakdown shown in Figure 6 suggeststhat WSC applications spend a large portion of time stalledin the front-end. Indeed, Front-end waste execution slotsare in the 15-30% range across the board (most often 2−3×higher than those in typical SPEC benchmarks) Note that theseindicate instructions under-supplied by the front-end – afterthe back-end has indicated it is able to accept more. We tracethese to predominantly instruction cache problems, due to lotsof lukewarm code. Finally, extrapolating i-cache working settrends from historical data, we see alarming growth rates forsome applications that need to be addressed.
For a more detailed understanding of the reasons for front-end stalls, we first measure front-end starvation cycles – thosewhen the µop queue is delivering 0 µops to the back-end.Figure 7 shows them to typically exceed 5% of all cycles. Thisis especially significant in the presence of deep (40+ instruc-tions) front-end buffers, which absorb minor fetch bubbles.The most probable cause is a non-negligible fraction of long-latency instruction miss events – most likely instruction missesin the L2 cache.

0 2 4 6 8 10 12Fetch latency cycles (%)
videosearch3search2search1
indexing2indexing1
gmail-fegmail
flight-searchdisk
bigtableads
Figure 7: Cycles completely starved on front-end bottlenecksaccount for more than 5% of execution.
Such a hypothesis is confirmed by the high exhibited L2 in-struction miss rates from Figure 8. WSC applications typicallymiss in the range of 5-20 MPKI, an order of magnitude morefrequently than the worst cases in SPEC CPU2006, and, at thehigh end of that interval, 50% higher than the rates measuredfor the scale-out workloads of CloudSuite [14].
The main reason for such high miss rates is simply the largecode footprint of WSC applications. Binaries of 100s of MBare common and, as seen in Section 3, without significanthotspots. Thus, instruction caches have to deal with large codeworking sets – lots of “lukewarm instructions”. This is madeworse in the L2 cache, where instructions have to compete forcache capacity with the data stream, which typically also hasa large working set.
There are several possible directions for architects to ad-dress instruction cache bottlenecks. Larger instruction cachesare an obvious one, although higher capacity has to be bal-anced with increased latency and die constraints. More com-plex instruction prefetchers are another, which have been suc-cessful for private i-caches under non-trivial instruction missrates [3, 26]. Finally, cache partitioning is another alternative,especially in light of high miss rates in the L2 and lukewarmcode. While partitioning has been extensively studied for mul-tiple applications’ access streams in shared last-level caches(Qureshi and Patt [43], among many others), relatively littleattention has been paid to treating the instruction and datastreams differently, especially in private, mid-level caches. Re-cently, Jaleel et al. proposed modifying replacement policiesto prioritize code over data [21], and the SPARC M7 designteam opted for an architecture with completely separate L2instruction and data caches [30].
A problem in the making Large instruction working setsare a widespread and growing issue. To demonstrate that, weuse profiling data to estimate i-cache footprints of datacenterbinaries over a period of 30 months. For some applications,such estimates grow by more than 25% year-over-year, signifi-cantly out-pacing i-cache size growth.
The canonical method to estimate a workload’s working setsize is simulation-based. It involves simply sweeping the cachesize in a simulator, and looking for the “knee of the curve” –the size at which the miss rate drops to near zero. This iscumbersome, especially if performed over a large number of
0 5 10 15 20 25 30L2 cache instruction MPKI
433.milc471.omnetpp
429.mcf445.gobmk
400.perlbench
videosearch3search2search1
indexing2indexing1
gmail-fegmail
flight-searchdisk
bigtableads
Figure 8: Instruction misses in the L2 cache are usually high.
versions of the same binary to capture a growth trend. Instead,we developed a different, non-invasive approach to estimate it.
With only profiling data available, one can use unorderedinstruction pointer samples, and measure how many uniquecache lines cover a large fraction (e.g. 99%) of all samples,when ranked by hotness. The rationale behind such a met-ric is that an infinite-size cache would obviously contain allunique lines. In a limited-size one, over a large enough timewindow, the LRU replacement policy eventually kicks out lessfrequently-used lines, until the hottest lines are left.
However, such a strategy is contingent on consistent sam-pling over time. In a long-term historical study, both the frac-tion of machines that get profiled and the amount of machinesserving the same application can vary significantly, often inways that are hard to control for. Under such variance, it is un-fair to compare the absolute number of cache lines that covera fixed fraction of samples for two time periods – 99% of 10×more samples are more likely to capture larger portions of thetail of instruction cache lines.
We compensate with yet another layer of sampling. For aparticular binary version, we select a fixed number of randomsamples in post-processing a week’s worth of data (in resultsshown below, this number is 1 million), and count the absolutenumber of unique cache lines that cover that new sample set.This is the equivalent of constructing a hotness ranking with astable number of samples across measurement periods.
Figure 9 shows the results of applying this approach to 30months of instruction pointer samples. It plots our estimate ofthe instruction cache working set size – the number of uniquecache lines in 1M randomly-selected weekly samples for aspecific binary. For calibration, we include 400.perlbench,which has the largest measured i-cache working set in SPECCPU2006 (≈172 KB) [20].
First, compared to SPEC, all workloads demonstrated sev-eral fold larger i-cache working sets. Figure 9 illustrates thatfor search2 and bigtable – their i-cache footprints are 4×those of 400.perlbench, which amounts to 688 KB or more.Note that such a size is significantly larger than the L2 cachein current architectures (Intel: 256 KB, AMD: 512 KB, IBM:512 KB), which also has to be shared with the data stream.
More importantly, this estimate is growing over time, at

Jul Y
1
Oct Y
1
Jan
Y2
Apr Y
2
Jun
Y2
Sep
Y2
Dec
Y2
Mar
Y3
May
Y3
Aug
Y3
Nov
Y3
01020304050
# u
niqu
e ic
ache
line
sin
1M
sam
ples
(K)
Growth: 27.77 % / year; R2 =0.66
400.perlbench
search2
Jul Y
1
Oct Y
1
Jan
Y2
Apr Y
2
Jun
Y2
Sep
Y2
Dec
Y2
Mar
Y3
May
Y3
Aug
Y3
Nov
Y3
01020304050
# u
niqu
e ic
ache
line
sin
1M
sam
ples
(K)
Growth: 3.23 % / year; R2 =0.16
400.perlbench
bigtable
Figure 9: Large instruction cache footprints. Getting progressively larger for some applications.
alarming rates for some applications. Consider search2 inFigure 9, whose footprint has almost doubled during the dura-tion of the study, at 27% per year. Other workloads are morestable – for example, bigtable only sees a 3% year-to-yeargrowth.
While the exact reasons for this disparity are unclear, wehypothesize it is related to development velocity. Productslike search are under constant development, and often seea variety of new features added, which leads to simply morecode. bigtable, on the other hand, is a relatively mature codebase with a well-defined feature set that sees less development.A more quantitative study, correlating development speed withinstruction footprint would make for interesting future work.
7. Core back-end behavior: dependent accessesWhile the negative impact of large instruction working setsis likely to continue growing, the current dominant source ofoverhead identified by the Top-Down decomposition (Figure 6)is clearly in the core’s back-end.
Overall, the combined influence of a large amount of front-end and back-end stalls results in very few instructions percycle (IPC) on average (Figure 10) – almost 2x lower than theSPECint geomean and close to that of the most memory-boundbenchmarks in SPEC (429.mcf, 471.omnetpp, 433.milc).This result is in line with published data on classical datacenterworkloads [22], and has led researchers to investigate thepotential of small cores for warehouse-scale applications [1,22, 31]. We show a more nuanced picture, with bimodalextracted ILP, frequently low, but also with periods of moreintense computation.
As a reminder, there are two very broad reasons forBack-end bound µop slots: time spent serving data cacherequests, and lack of instruction-level parallelism (ILP). Of thetwo, data cache behavior is the dominant factor in our measure-ments. This is somewhat unsurprising, given the data-intensivenature of WSC workloads. Figure 11 serves as confirmation,showing the amount of back-end cycles, stalled due to pendingloads in the cache hierarchy, or due to insufficient store buffercapacity. At 50-60% of all cycles, they account for morethan 80% of Back-end bound pipeline slots shown earlier(Figure 6).
However, not all cycles are spent waiting on data caches. Wedemonstrate this in Figure 12, which measures the distributionof extracted ILP. By extracted ILP, we refer to the number
0.0 0.5 1.0 1.5 2.0 2.5Instructions per cycle (IPC)
433.milc471.omnetpp
429.mcf445.gobmk
400.perlbench
videosearch3search2search1
indexing2indexing1
gmail-fegmail
flight-searchdisk
bigtableads
Figure 10: IPC is universally low.
0 10 20 30 40 50 60 70 80Cache-bound cycles (%)
videosearch3search2search1
indexing2indexing1
gmail-fegmail
flight-searchdisk
bigtableads
Figure 11: Half of cycles are spent stalled on caches.
of simultaneously executing µops at each cycle when someµops are issued from the out-of-order scheduler to executionunits. We see that 72% of execution cycles exhibit low ILP (1or 2 on a 6-wide Ivy Bridge core), consistent with the fact thatthe majority of cycles are spent waiting on caches. However,for the other 28% of cycles, 3 or more functional units are keptbusy each cycle.
One explanation consistent with such behavior is that WSCapplications exhibit a fine-grained mix of dependent cacheaccesses and bursty computation. The bursts of computationcan either be dependent on the cache references, or indepen-dent and extractable as ILP. The difference between these twovariants – whether intense compute phases are on the criticalpath of execution – could be detrimental for the amount of endperformance degradation of “wimpier” cores, and requires adedicated simulation study.
Memory bandwidth utilization Notice that in the previ-ous paragraph, we immediately diagnose dependent cache ac-cesses. We hypothesize this because of the very low memorybandwidth utilization that we observed, shown in Figure 13.

[1,2] [3,4] [5,6]0
33
67
100
Cycl
es w
ith e
xtra
cted
ILP
(%)
Figure 12: Extracted ILP. 28% of cycles utilize 3 or more exe-cution ports on a 6-wide machine.
0 20 40 60 80 100Samples (%)
010203040506070
Dist
ribut
ion
of
band
wid
th (C
DF %
)
95 %
31%
Figure 13: Memory bandwidth utilization is universally low.
The plot is a cumulative histogram of measured DRAM band-width across a sufficiently large number of machines.3 The95-th percentile of utilization is at 31%, and the maximummeasured – 68%, with a heavy tail at the last percentile. Someportion of the low bandwidth usage is certainly due to lowCPU utilization. However this is not a sufficient explanation –Barroso et al. show median CPU utilization in the 40%–70%range (depending on the type of cluster) [4], while we mea-sure a significantly lower median bandwidth utilization at 10%.Note that the low bandwidth requirement is not very differentfrom measurements on CloudSuite [14] and other emergingdatacenter workloads [33].
One consequence of the low bandwidth utilization is thatmemory latency is more important than bandwidth for the setof the applications running in today’s datacenters. In light ofWSC server design, this might pose tradeoffs between memorybandwidth (or then number of memory controllers) and otheruses of freed up silicon area (for example, more cores oraccelerators).
Note that the large amount of unused bandwidth is alsocontrary to some typical benchmarking practices that focus oncapacity. For example, SPECrate as commonly run (N copieson N cores) can shift several benchmarks’ memory bottlenecksfrom latency to bandwidth [48], causing architects to optimizefor a less relevant target.
8. Simultaneous multi-threadingThe microarchitectural results shown so far did not accountfor simultaneous multi-threading (SMT), even though it is
3Measured through the sum of the UNC_M_CAS_COUNT:RD andUNC_M_CAS_COUNT:WR IvyTown uncore performance counters.
[1,2] [3,4] [5,6]0
33
67
100
Cycl
es w
ith e
xtra
cted
ILP
(%)
0 10 20 30 40 50Front-end bound cycles (%)
per-coreper-thread
0 2 4 6 8 10 12Fetch latency cycles (%)
per-coreper-thread
0.0 0.2 0.4 0.6 0.8 1.0 1.2 1.4Instructions per cycle (IPC)
per-coreper-thread
Figure 14: SMT effects on architectural behavior. From top tobottom: (i) more ILP extracted compared to Figure 12; (ii) front-end bound cycles decrease, but (iii) instruction starvation stillexists; (iv) core throughput doubles with two hyperthreads.
enabled on the Ivy Bridge machines profiled. For example,the top-level cycle breakdown in Figure 6 was done on a per-hyperthread basis, assuming each hyperthread has the fullmachine width to issue µops.
Broadly speaking, SMT is most efficient when workloadshave different performance bottlenecks, and multiple threadscan complement each other’s deficiencies. WSC applications,with inefficiencies in both the front-end and the back-end,as well as suspected fine-grained phase behavior, fit such adescription well, and we expect them to benefit from SMT.
While we cannot perform at-scale measurements of coun-terfactuals without disturbing a large number of user-facingservices (i.e., disabling SMT and looking at workload perfor-mance), we can at least estimate the efficacy of SMT by com-paring specific per-hyperthread performance counters withones aggregated on a per-core basis. Note that this is verydifferent from measuring the speedup that a single applica-tion experiences from SMT. When a thread is co-run on acore, its performance naturally drops compared to when it hasthe full core available – mostly due to capacity effects, i.e.having to share microarchitectural units and caches. On theother hand, core utilization increases simply because multiplethreads share it. While we cannot measure the first effectat-scale without turning SMT off, we can and do measure thelatter.
As expected, functional unit utilization in the back-endincreases when accounting for SMT. The first plot in Figure 14shows that 3 or more of the 6 execution ports are used during
34% of cycles when counting both hyperthreads, as opposed to28% in Figure 12, when counting each hyperthread separately.
While such improvements from SMT are expected and well-understood, the effects on front-end performance are less clear.On the one hand, SMT can increase instruction cache pressure– more instructions need to be fetched, even if hyperthreadsshare the same code, exacerbating an already severe instructioncache capacity bottleneck (Section 6). On the other, long-latency fetch bubbles on one hyperthread can be absorbed byfetching from another.
Our profiling data suggests that the latter effect dominatesin WSC applications and SMT ends up improving front-endutilization. This is evident from the second and third plotsof Figure 14. Per-core Front-end bound cycles are signif-icantly lower than when measured per-hyperthread – 16%versus 22% on the medians, with drastically tighter distri-butions around them. Front-end starvation cycles (with noµops dispatched) also decrease from 5% to 4%, indicatingthat long-latency instruction cache misses are better absorbed,and SMT succeeds in alleviating some front-end inefficiencies.
Note however, that, even after we account for 2-wide SMT,75% of collected fleet samples show an IPC value of 1.2 orless (last plot of Figure 14), compared to a theoretical machinewidth of 4.0. Adding this to the fact that latency bottlenecks(both due to fetching instructions from the L3 cache, andfetching data from main memory) are still far from eliminatedsuggests potential for wider SMT: with more threads per core,as seen in some server chips [30]. This case is strengthened bythe low memory bandwidth utilization shown earlier – evenwith more threads per core bandwidth is unlikely to become abottleneck. These results warrant further study of balancingthe benefits of wider SMT with the potential costs, both in per-formance from potentially hitting capacity bottlenecks, and inpower from the duplication or partitioning of core resources.
9. Related workIn recent years, research interest in developing new architec-tural support for datacenters has increased significantly. Theconcept of deploying “wimpy cores” or microservers to op-timize datacenters has been well-explored [1, 22, 31], andrecent efforts have investigated specialized interconnects [32]and customized hardware accelerators [42]. While our cyclebreakdown finds opportunities for specialization, microarchi-tectural analysis suggests that “brawny” out-of-order super-scalar cores provide sufficient performance to be justified,especially when coupled with wide SMT. As prior researchhas observed, “wimpy” cores and some forms of specializa-tion excel in cost- and power-efficiency, often at the cost ofperformance.
Architecture research in datacenter processor design hasspurred multiple academic efforts to develop benchmark suitesfor datacenter computing. Most notably, CloudSuite is a mix-ture of scale-out cloud service workloads, characterized ona modern server system [14]. Recent efforts have provided
in-depth microarchitectural characterization of portions ofCloudSuite [49]. Some of our findings (very low bandwidthutilization) are well-represented in CloudSuite benchmarks,others – to a lesser extent (large i-cache pressure), while yetothers are markedly different (very flat execution profiles ver-sus hotspots). Many follow-up architectural studies unjustlyfocus only on the Web Search portion of CloudSuite. Thiscan lead to false conclusions, because: (i) websearch is not thesole “killer workload” in the datacenter; and (ii) CloudSuiteWeb Search is the least correlated with our findings from alive WSC (it sees very low stall times, has a tiny L2 instruc-tion working set, and, as a result, achieves very high IPC morerepresentative of a compute-bound workload [14]). Similarly,DCBench focuses in more depth on cloud data analytics [23].These suites are vital for experimentation, though they can-not be as comprehensive as observing production applicationsevolve at scale over the years.
Other researchers have also taken the approach of profilinglive datacenters. Kozyrakis et al. present data on internet-scale workloads from Microsoft – Hotmail, Cosmos, and Bing,but their study focuses more on system-level Amdahl ratiosrather than microarchitectural implications [27]. Another pa-per [5] similarly focuses on system issues for Google web-search. While it has some discussion of microarchitecture,this study is now more than a decade old. A large body ofwork profiles production warehouse-scale applications withthe explicit purpose of measuring [24] and reducing [35, 50]contention between co-scheduled jobs, or of scheduling themin accordance with machine characteristics [34]. Such studiescan benefit from microarchitectural insights provided here.
Finally, our work builds on top of existing efforts to profileand analyze applications on modern hardware. Google-Wide-Profiling provides low-overhead performance sampling acrossGoogle’s datacenter fleet and has been deployed for manyyears to provide the capability for longitudinal studies [44].We also leverage recent advances in Top-Down performanceanalysis [48] that allow us to estimate CPI stacks withoutspecialized hardware support [13].
10. ConclusionsTo better understand datacenter software performance proper-ties, we profiled a warehouse-scale computer over a period ofseveral years. In this paper, we showed detailed microarchitec-tural measurements spanning tens of thousands of machines,running thousands of different applications, while executingthe requests of billions of users.
These workloads demonstrate significant diversity, both interms of the applications themselves, and within each indi-vidual one. By profiling across binaries, we found commonlow-level functions (“datacenter tax”), which show potentialfor specialized hardware in a future server SoC. Finally, at themicroarchitectural level, we identified a common signaturefor WSC applications – low IPC, large instruction footprints,bimodal ILP and a preference for latency over bandwidth –

which should influence future processor designs for the data-center. These observations motivate several interesting direc-tions for future warehouse-scale computers. The table belowbriefly summarizes our findings and potential implications forarchitecture design.
Finding Investigation directionworkload diversity Profiling across applications.flat profiles Optimize low-level system functions.datacenter tax Datacenter specific SoCs
(protobuf, RPC, compression HW).large (growing)i-cache footprints
I-prefetchers, i/d-cache partitioning.
bimodal ILP Not too “wimpy” cores.low bandwidthutilization
Trade off memory bandwidth for cores.Do not use SPECrate.
latency-boundperformance
Wider SMT.
Summary of findings and suggestions for future investigation.
AcknowledgmentsWe would like to thank the anonymous reviewers and Ah-mad Yasin for their constructive feedback. We reserve specialthanks for our colleagues at Google, and especially: the GWPteam for developing and maintaining large-scale profiling in-frastructure; David Levinthal and Stephane Eranian for theirinvaluable help with performance counters; and Luiz Barroso,Artur Klauser and Liqun Cheng for commenting on drafts ofthis manuscript.
Svilen Kanev’s academic work was partially supported byC-FAR, one of six centers of STARnet, a SemiconductorResearch Corporation program sponsored by MARCO andDARPA. Juan Pablo Darago’s academic work was supportedby the LICAR lab in Departamento de Ciencias de la Com-putación, Universidad de Buenos Aires.
References[1] David G Andersen, Jason Franklin, Michael Kaminsky, Amar Phan-
ishayee, Lawrence Tan, and Vijay Vasudevan. FAWN: A fast array ofwimpy nodes. In Operating systems principles (SOSP), 2009.
[2] Jennifer Anderson, Lance Berc, George Chrysos, Jeffrey Dean, SanjayGhemawat, Jamey Hicks, Shun-Tak Leung, Mitch Lichtenberg, MarkVandevoorde, Carl A Waldspurger, et al. Transparent, low-overheadprofiling on modern processors. In Workshop on Profile and Feedback-Directed Compilation, 1998.
[3] Murali Annavaram, Jignesh M. Patel, and Edward S. Davidson. Callgraph prefetching for database applications. Transactions of ComputerSystems, 2003.
[4] Luiz André Barroso, Jimmy Clidaras, and Urs Hölzle. The datacen-ter as a computer: an introduction to the design of warehouse-scalemachines. Synthesis Lectures on Computer Architecture, 2013.
[5] Luiz André Barroso, Jeffrey Dean, and Urs Hölzle. Web search for aplanet: The google cluster architecture. IEEE Micro, 2003.
[6] Paolo Calafiura, Stephane Eranian, David Levinthal, Sami Kama, andRoberto Agostino Vitillo. GOoDA: The generic optimization dataanalyzer. In Journal of Physics: Conference Series, 2012.
[7] Fay Chang, Jeffrey Dean, Sanjay Ghemawat, Wilson C. Hsieh, Debo-rah A. Wallach, Mike Burrows, Tushar Chandra, Andrew Fikes, andRobert E. Gruber. Bigtable: A distributed storage system for structureddata. In Operating Systems Design and Implementation (OSDI), 2006.
[8] Dehao Chen, Neil Vachharajani, Robert Hundt, Shih-wei Liao, VinodhaRamasamy, Paul Yuan, Wenguang Chen, and Weimin Zheng. Taminghardware event samples for FDO compilation. In Code generation andoptimization (CGO), 2010.
[9] Zefu Dai, Nick Ni, and Jianwen Zhu. A 1 cycle-per-byte XML parsingaccelerator. In Field Programmable Gate Arrays, 2010.
[10] Arnaldo Carvalho de Melo. The new linux ‘perf’ tools. In Slides fromLinux Kongress, 2010.
[11] Jeffrey Dean and Luiz André Barroso. The tail at scale. Communica-tions of the ACM, 2013.
[12] Filipa Duarte and Stephan Wong. Cache-based memory copy hardwareaccelerator for multicore systems. IEEE Transactions on Computers,2010.
[13] Stijn Eyerman, Lieven Eeckhout, Tejas Karkhanis, and James E Smith.A top-down approach to architecting cpi component performance coun-ters. IEEE Micro, 2007.
[14] Michael Ferdman, Babak Falsafi, Almutaz Adileh, Onur Kocberber,Stavros Volos, Mohammad Alisafaee, Djordje Jevdjic, Cansu Kaynak,Adrian Daniel Popescu, and Anastasia Ailamaki. Clearing the clouds.In Architectural Support for Programming Languages and OperatingSystems (ASPLOS), 2012.
[15] T.B. Ferreira, R. Matias, A. Macedo, and L.B. Araujo. An experi-mental study on memory allocators in multicore and multithreadedapplications. In Parallel and Distributed Computing, Applications andTechnologies (PDCAT), 2011.
[16] Google. Bazel. http://bazel.io/.[17] Google. gRPC. http://grpc.io/.[18] Google. Protocol buffers. https://developers.google.com/
protocol-buffers/.[19] John L Hennessy and David A Patterson. Computer architecture: a
quantitative approach. 2012.[20] Aamer Jaleel. Memory characterization of workloads using
instrumentation-driven simulation–a Pin-based memory characteriza-tion of the SPEC CPU2000 and SPEC CPU2006 benchmark suites.Intel Corporation, VSSAD, 2007.
[21] Aamer Jaleel, Joseph Nuzman, Adrian Moga, Simon C Steely Jr, andJoel Emer. High Performing Cache Hierarchies for Server Workloads.In High-Performance Computer Architecture (HPCA), 2015.
[22] Vijay Janapa Reddi, Benjamin C Lee, Trishul Chilimbi, and KushagraVaid. Web search using mobile cores: quantifying and mitigating theprice of efficiency. Computer Architecture (ISCA), 2010.
[23] Zhen Jia, Lei Wang, Jianfeng Zhan, Lixin Zhang, and Chunjie Luo.Characterizing data analysis workloads in data centers. In Workloadcharacterization (IIWSC), 2013.
[24] Melanie Kambadur, Tipp Moseley, Rick Hank, and Martha A Kim.Measuring interference between live datacenter applications. In HighPerformance Computing, Networking, Storage and Analysis (SC),2012.
[25] Svilen Kanev, Kim Hazelwood, Gu-Yeon Wei, and David Brooks.Tradeoffs between Power Management and Tail Latency in Warehouse-Scale Applications. In Workload Characterization (IISWC), 2014.
[26] Aasheesh Kolli, Ali Saidi, and Thomas F. Wenisch. RDIP: Return-address-stack Directed Instruction Prefetching. In Microarchitecture(MICRO), 2013.
[27] Christos Kozyrakis, Aman Kansal, Sriram Sankar, and Kushagra Vaid.Server engineering insights for large-scale online services. IEEE Micro,2010.
[28] Snehasish Kumar, Arrvindh Shriraman, Viji Srinivasan, Dan Lin, andJordan Phillips. SQRL: Hardware Accelerator for Collecting SoftwareData Structures. In Parallel architectures and compilation (PACT),2014.
[29] Sangho Lee, Teresa Johnson, and Easwaran Raman. Feedback directedoptimization of tcmalloc. In Proceedings of the workshop on MemorySystems Performance and Correctness, 2014.
[30] Penny Li, Jinuk Luke Shin, Georgios Konstadinidis, Francis Schu-macher, Venkat Krishnaswamy, Hoyeol Cho, Sudesna Dash, RobertMasleid, Chaoyang Zheng, Yuanjung David Lin, et al. A 20nm 32-Core 64MB L3 cache SPARC M7 processor. In Solid-State CircuitsConference (ISSCC), 2015.
[31] Kevin Lim, Parthasarathy Ranganathan, Jichuan Chang, ChandrakantPatel, Trevor Mudge, and Steven Reinhardt. Understanding and de-signing new server architectures for emerging warehouse-computingenvironments. In Computer Architecture (ISCA), 2008.
[32] Pejman Lotfi-Kamran, Boris Grot, Michael Ferdman, Stavros Volos,Onur Kocberber, Javier Picorel, Almutaz Adileh, Djordje Jevdjic,Sachin Idgunji, Emre Ozer, et al. Scale-out processors. In ComputerArchitecture (ISCA), 2012.

[33] Krishna T Malladi, Benjamin C Lee, Frank A Nothaft, ChristosKozyrakis, Karthika Periyathambi, and Mark Horowitz. Towardsenergy-proportional datacenter memory with mobile DRAM. Com-puter Architecture (ISCA), 2012.
[34] Jason Mars and Lingjia Tang. Whare-map: Heterogeneity in "homoge-neous" warehouse-scale computers. In Computer Architecture (ISCA),2013.
[35] Jason Mars, Lingjia Tang, Robert Hundt, Kevin Skadron, and Mary LouSoffa. Bubble-up: Increasing utilization in modern warehouse scalecomputers via sensible co-locations. In Microarchitecture (MICRO),2011.
[36] David Meisner, Christopher M Sadler, Luiz André Barroso, Wolf-Dietrich Weber, and Thomas F Wenisch. Power management of onlinedata-intensive services. In Computer Architecture (ISCA), 2011.
[37] Sergey Melnik, Andrey Gubarev, Jing Jing Long, Geoffrey Romer,Shiva Shivakumar, Matt Tolton, and Theo Vassilakis. Dremel: interac-tive analysis of web-scale datasets. Very Large Data Bases (VLDB),2010.
[38] Dmitry Namiot and Manfred Sneps-Sneppe. On micro-services archi-tecture. Open Information Technologies, 2014.
[39] Jian Ouyang, Hong Luo, Zilong Wang, Jiazi Tian, Chenghui Liu,and Kehua Sheng. FPGA implementation of GZIP compression anddecompression for IDC services. In Field-Programmable Technology(FPT), 2010.
[40] Mike P Papazoglou and Willem-Jan Van Den Heuvel. Service orientedarchitectures: approaches, technologies and research issues. The VLDBjournal, 2007.
[41] David A Patterson. The data center is the computer. Communicationsof the ACM, 2008.
[42] Andrew Putnam, Adrian M Caulfield, Eric S Chung, Derek Chiou,Kypros Constantinides, John Demme, Hadi Esmaeilzadeh, JeremyFowers, Gopi Prashanth Gopal, Jan Gray, et al. A reconfigurable
fabric for accelerating large-scale datacenter services. In ComputerArchitecture (ISCA), 2014.
[43] Moinuddin K Qureshi and Yale N Patt. Utility-based cache partitioning:A low-overhead, high-performance, runtime mechanism to partitionshared caches. In Microarchitecture (MICRO), 2006.
[44] Gang Ren, Eric Tune, Tipp Moseley, Yixin Shi, Silvius Rus, and RobertHundt. Google-Wide Profiling: A Continuous Profiling Infrastructurefor Data Centers. IEEE Micro, 2010.
[45] Vivek Seshadri, Yoongu Kim, Chris Fallin, Donghyuk Lee, RachataAusavarungnirun, Gennady Pekhimenko, Yixin Luo, Onur Mutlu,Phillip B. Gibbons, Michael A. Kozuch, and Todd C. Mowry. Row-Clone: Fast and Energy-efficient in-DRAM Bulk Data Copy and Ini-tialization. In Microarchitecture (MICRO), 2013.
[46] Jan Van Lunteren, Ton Engbersen, Joe Bostian, Bill Carey, and ChrisLarsson. XML accelerator engine. In Workshop on High PerformanceXML Processing, 2004.
[47] Abhishek Verma, Luis Pedrosa, Madhukar Korupolu, David Oppen-heimer, Eric Tune, and John Wilkes. Large-scale cluster managementat Google with Borg. In European Conference on Computer Systems(EuroSys), 2015.
[48] Ahmad Yasin. A Top-Down method for performance analysis andcounters architecture. Performance Analysis of Systems and Software(ISPASS), 2014.
[49] Ahmad Yasin, Yosi Ben-Asher, and Avi Mendelson. Deep-dive Anal-ysis of the Data Analytics Workload in CloudSuite. In Workloadcharacterization (IIWSC), 2014.
[50] Xiao Zhang, Eric Tune, Robert Hagmann, Rohit Jnagal, Vrigo Gokhale,and John Wilkes. CPI2: CPU performance isolation for shared computeclusters. In European Conference on Computer Systems (EuroSys),2013.