prokofiev, v. y., safonov, y. g., lüders, v., borovikov, a
TRANSCRIPT

Originally published as:
Prokofiev, V. Y., Safonov, Y. G., Lüders, V., Borovikov, A. A., Kotov, A. A., Zlobina, T. M., Murashov, K. Y., Yudovskaya, M. A., Selektor, S. L. (2019): The sources of mineralizing fluids of orogenic gold deposits of the Baikal-Patom and Muya areas, Siberia: Constraints from the C and N stable isotope compositions of fluid inclusions. - Ore geology reviews, 111.
DOI: http://doi.org/10.1016/j.oregeorev.2019.102988

The sources of mineralizing fluids of orogenic gold deposits of the Baikal-
Patom and Muya areas, Siberia: constraints from the C and N stable isotope
compositions of fluid inclusions Vsevolod Yu. Prokofiev1*, Yuri G. Safonov1, Volker Lüders2, Andrei A. Borovikov3, Aleksey A.
Kotov1, Tatiana M. Zlobina1, Konstantin Yu. Murashov1, Marina A. Yudovskaya1, and Sofiya L.
Selektor4.1Institute of Geology of Ore Deposits, Petrography, Mineralogy and Geochemistry, Russian
Academy of Sciences, Staromonetny per. 35, Moscow, 119117 Russia2GFZ German Research Centre for Geosciences, Telegrafenberg, 14473 Potsdam, Germany3V.S. Sobolev Institute of Geology and Mineralogy SB RAS; Novosibirsk, Russia4Frumkin Institute of Physical Chemistry and Electrochemistry, Moscow 119071, Russia
*Corresponding author: [email protected]
ABSTRACT
The compositions of fluid inclusions in quartz and sphalerite from five gold deposits of the
Baikal-Patom (Sukhoi Log, Verninsk and Dogaldyn) and Baikal-Muya (Uryakh and Irokinda)
foldbelts in the northern margin of the Central Asian Orogenic Belt, along its boundary with the
Siberian craton, indicate that the gold mineralization was formed predominantly from
heterogeneous CO2-H2O orogenic fluid. All deposits are structurally controlled and composed of
veinlet-disseminated and vein to stockwork types of ores that are hosted by rocks that underwent
regional metamorphism to the greenschist facies in Baikal-Patom and up to the granulite facies
in Baikal-Muya. The gold-quartz veins of all the Baikal-Patom deposits and the Uryakh were
formed by fluids of similar composition with salinity of 1.4-9.5 wt % NaCl equiv. and CO2
content of 1.4-8.6 mol/kg of solution, under comparable physical conditions, at temperatures of
128-385 ºC and pressures of 570-3290 bar. Fluids of the granulate-hosted Irokinda deposit are
distinguished for the highest temperatures and pressures and involve relics of medium- to high-
temperature (179-453ºC) brines with salinity of 4.6-46.3 wt % NaCl equiv. The temperature and
pressure of the mineralizing fluid increase roughly from north to south, which correlates with the
increase in the metamorphic grade of the host rocks. The increase is accompanied by the
simultaneous systematic shift in the C isotope composition of CO2 (released from the quartz by
the chrush-leach method) from –1.9 to –5.5 ‰ δ13CCO2 in the Baikal-Patom and Uryakh from –
0.6 to + 0.7 ‰ δ13CCO2 at Irokinda. The C and N isotope compositions of CO2 suggest that
Irokinda fluids were partly derived from decarbonated marine limestone, whereas the orogenic
gold-bearing fluids of the other deposits are interpreted to have been composed mostly of fluid
from a crustal magmatic (granitic?) source.
1234567891011121314151617181920212223242526272829303132333435363738394041424344454647484950515253545556575859

Key word: Orogenic gold deposits, fluid inclusions, carbon isotopes, CO2, Baikal-Patom
foldbelt, Muya foldbelt.
1. Introduction
The Baikal-Patom and the Muya areas (Fig. 1) north of Lake Baikal are among Russia's
largest gold mining areas, in which placer gold was mining starting in the 19th century and
which attracted attention of many researchers (e.g. Buryak, 1982; Distler et al., 1996; Wood and
Popov, 2006; Rusinov et al., 2008; Yakubchuk et al., 2014). Since the placer gold reserves tend
to be exhausted, vein- and stockwork-type primary gold deposits hosted by clastic rocks become
the leading gold producers.
Sukhoi Log is the most famous and largest deposit in Baikal-Patom. It is the best-studied
gold deposit in the area and has been intensely studied since its discovery in 1961 (e.g. Laverov
et al., 2000; Distler et al., 2004; Large et al., 2007; Kryazhev et al., 2009; Dubinina et al., 2014).
However, the genesis of Sukhoi Log, as well as other smaller deposits of the area, is still highly
debatable. There are two fundamentally different hypotheses for the sources of the gold. The first
one (metamorphic-sedimentary) implies gold leaching from crustal rocks with an elevated or
ordinary metal background concentrations and its focused re-deposition during metamorphism
(e.g. Nemerov, 1989; Buryak and Khmelevskaya, 1997; Large et al., 2007). The other hypothesis
suggests that the gold mineralization is related to an inflow of gold-bearing fluids from deep-
seated lower crustal or mantle sources (Sher, 1972; Rundqvist et al., 1992; Distler et al., 1996;
Lishnevsky, Distler, 2004; Safonov, 2006; Mitrofanov, 2006; Kucherenko et al., 2011;
Yudovskaya et al., 2016). There are a number of transitional models that try to reconcile the
shortages of the major hypothesis and to link the Sukhoi Log-type mineralization with the
complex and multistage geological history of the region (Meffre et al., 2008; Kryazhev et al.,
2009, Yudovskaya et al., 2011; Yakubchuk et al., 2014, among many others). The classification
of the deposits as orogenic ones (Groves et al., 1998; Goldfarb et al., 2005; 2014) is based
mainly on their structurally-controlled local setting and the high P-T parameters of their
mineralizing fluids, albeit the geochronological constraints also strongly support the
superimposed character of mineralization.
We have studied fluid inclusions in quartz and sphalerite from five gold deposits located
within the neighboring Baikal–Patom and Baikal–Muya belts (Fig. 1). The gold reserves of the
studied deposits range from very large (>1000 t Au), large (100 to 300 t Au) to medium-sized
and small (10–20 t Au). This study was focused on determining the physicochemical parameters
60616263646566676869707172737475767778798081828384858687888990919293949596979899100101102103104105106107108109110111112113114115116117118

of mineralizing fluids at the gold deposits of various scales and om conducting a comparative
analysis of the data to identify favorable characteristics of highly-endowed gold-bearing fluids.
2. Geological setting
Three of the studied gold deposits, including Sukhoy Log, Verninsk and Dogaldyn, are
located with the Mama-Bodaibo basin in the central part of the Baikal–Patom fold-and-thrust
belt that spatially coincides with the boundaries of the Lena gold province (Fig. 2). The Baikal–
Vitim–Barguzin and the Baikal–Muya foldbelts, as well as the Barguzin Superterrane, are
thought to be neighboring accretionary terrains, which share a geological history starting from
the Neoproterozoic (e.g Yarmolyuk et al., 2006; Rytsk et al., 2011). Two of the studied gold
deposits, the Uryakh and the Irokinda, are located in the Muya gold district in the eastern margin
of the Baikal-Muya foldbelt (Fig. 2). The geological evolution of these terrains is related to the
evolution of the Central Asian Orogenic Belt (CAOB), one of the world's largest accretionary
orogens (Kröner et al., 2014) that was produced by the multi-stage collision of the Siberian,
Tarim and North China cratons (Yarmolyuk et al., 2006; Rytsk et al., 2011). The Baikal–Patom
foldbelt is considered to have developed mostly as a passive continental margin of the Siberian
craton whereas the Baikal-Muya belt is one of the CAOB earliest collisional terrains composed
of ophiolitic and island-arc complexes (Bulgatov and Gordienko, 1999; Skuzavatov et al., 2019).
Therefore, the gold deposits of the Baikal-Patom foldbelt were formed in a geological and
geodynamic framework different from those of gold-quartz deposits of the Baikal-Muya block.
2.1 Deposits of the Baikal-Patom foldbelt
The geological description of the Sukhoi Log deposit is given in several earlier and recent
papers (e.g. Distler et al., 1996, 2004; Yudovskaya et al., 2016 and references therein). The most
comprehensive characteristics of the Baikal-Patom geological sequences are given in the
collective monograph “The Precambrian of the Patom Highland” published in Russian (Ivanov et
al., 1995). Data from it are mostly referred to below.
The Sukhoi Log, Verninsk and Dogaldyn deposits are hosted by metamorphosed
terrigenous black shales to sandstones of the Neoproterozoic sequences within the Bodaibo
Synclinorium (Fig. 2). Geochronological data indicate that the deposition of the host sedimentary
rocks started in the early Ediacaran and ended prior to an age of ~520 Ma, with the younger
formations straddling the Ediacaran-Cambrian boundary (see the summary in Yudovskaya et al.,
2016). A Rb-Sr whole-rock isochron age of 447± 6 Ma for the host metashales of Sukhoi Log
(Laverov et al., 2007), a U-Th-Pb isotopic age of 440-460 Ma for the newly-formed crystalline
monazite and zircon (Yudovskaya et al., 2011), and a roughly coeval Re-Os isochron age of the
119120121122123124125126127128129130131132133134135136137138139140141142143144145146147148149150151152153154155156157158159160161162163164165166167168169170171172173174175176177

ore sulfides are interpreted to be the age of metamorphism and related syn- and post-
metamorphic mineralization. A Rb-Sr isotopic age of 321± 14 Ma for vein quartz (Laverov et al.,
2007) and similar U-Th-Pb isotopic ages of hydrothermal monazite (Meffre et al., 2008) are
believed to reflect the influence of the plume-related multiphase Angara-Vitim magmatic event
(Tsygankov et al., 2007).
All gold deposits within the Bodaibo Synclinorium are confined to the axial zone of the
northeast trending Patom–Vilyui paleorift. Safonov (2006) suggested that the west-northwest
trend of the mineralization, which seems to be typical of all deposits and occurrences of the area,
is defined by transform normal faults related to the mosaic-block structure of the paleorift.
Conversely, according to local exploration interpretations, it is the local west-east fold-thrust
system that dominantly controls the ore mineralization (Ivanov et al., 1995).
The Sukhoi Log deposit is confined to the axial part of an overturned anticline that occurs
within the larger high-order Marakan-Tunguska syncline (Fig. 3). The axial plane of the fold
coincides with a fault, which is as a zone of both ductile deformation and cataclasis. The
thickness of host shale of the Ediacaran Khomolkho Formation is significantly reduced in the
core of the fold in comparison to its flanks. Numerous minor plicative structures of different
scale are selectively developed in the fine-grained metashales, whereas the rigid sandstones and
quartz-sulfide aggregates show brittle deformation and boudinage.
The Verninsk deposit is also confined to an overturned anticline complicated by a sub-
latitudinal shallow dipping thrust. The orebody is hosted in metamorphosed black shales and
sandstones with minor limestones of the Ediacaran Aunakit Formation. The anticline is
complicated by numerous plicative and brittle structures of several orders, including a number of
sub-parallel minor thrusts, which are generally parallel to the major thrust (Fig. 3).
The Dogaldyn (or Dogaldyn Zhila, which means Dogaldyn Vein in Russian) deposit is
constrained within the Dogaldyn thrust zone. It consists of a single 15 km-long quartz vein
crosscutting metamorphosed shales of the Dogaldyn Formation, one of the topmost
Neoproterozoic stratigraphic units, which also hosts several other small gold deposits and
occurrences (Fig. 3).
The orebodies of the Sukhoi Log and Verninsk deposits include superimposed zones of
veinlet, stockworks and disseminated types of quartz-sulfide mineralization (Fig. 4). The outlines
of the orebodies are defined in terms of off-cut grades. Along with the main veinlet-disseminated
bodies, both deposits contain massive quartz veins that are controlled by roughly E–W trending
steeply (50º-70º) dipping fault zones. The high-grade parts of the Sukhoi Log quartz veins were
developed in the 19th century, whereas the remaining veins of the so-called Central vein zone
178179180181182183184185186187188189190191192193194195196197198199200201202203204205206207208209210211212213214215216217218219220221222223224225226227228229230231232233234235236

show a poor grade. The massive quartz veins of the Verninsk deposit also form the similar
steeply-dipping Pervenets vein orebody, which locally contains conditional mineralization.
The mineralization is dominated by native gold in association with quartz, sulfides and
carbonates (dolomite and ankerite), although the ore also contains a long list of minor and
accessory minerals (Distler et al., 2004). The Sukhoi Log and Verninsk deposits contain
mineralization of two types: qold-quart-sulfide veinlet-disseminated and gold-quartz veins. The
gold is predominantly associated with several generations of pyrite, minor pyrrhotite and
arsenopyrite in Sukhoi Log ores, whereas arsenopyrite and pyrite are major sulfides in the
Verninsk deposit (Fig. 5). Mineralisation of the Dogaldyn deposit is composed of gold–quartz–
sphalerite–galena assemblages with minor arsenopyrite and pyrite ± chalcopyrite, whose amount
increases with depth.
The reserves of the deposits are estimated as follows:
– Sukhoi Log: 1500 tonnes Au with average grade of 2.73 g/t (Migachev et al., 2008);
– Verninsk: 180 tonnes Au with average grade of 2.7 g/t (Polyus Gold Press Release,
2015);
– Dogaldyn– 18 tonnes Au with average grade of 1.7 g/t (Ivanov, 2014).
2.2 The deposits of the Baikal-Muya foldbelt
The Uryakh and Irokinda deposits are located at a distance of 160 km from each other in
the eastern part of the Baikal–Muya foldbelt, close to the boundary with the southwestern margin
of the Aldan–Stanovoy ancient block of the Siberian Craton (Figs. 2 and 6).
The Uryakh mineralization is spatially controlled by the steeply westward-dipping Syulban
deep-seated fault zone. The host rocks of Ediacaran age volcanic rocks of the Ust-Kelyana
Formation, black shales of the Vodorazdel Formation and limestones of the Ust-Uryakh
Formation. The Ediacaran host sequences are intruded by gabbroic and plagiogranite dykes and
stocks, which occur as lenses and chains of bodies concordant to the faults and general beddings.
All rocks are metamorphosed to the greenschists to amphibolite facies and are transformed into
blastomylonites and cataclasytes in the vicinities of faults. The oldest granitoid complexes have
supposedly Paleoproterozoic to Ediacaran ages, whereas the youngest dykes are ascribed to the
Late Paleozoic Kadali-Butuin and Kachoi complexes (Fig. 6).
The quartz–gold–silver–sulfide stockwork and vein mineralization (Fig. 4) extends over a
distance of 12 km along the major Syulban fault. The block structure of the deposit resulted from
tectonic motions along two duplex systems: the major Syulban fault and a related transverse
second-order fault system. The ore-hosting structures vary from stockworks to linear veins and
veinlet zones (Zlobina et al., 2016). Some newly formed mineralization is overprinted on the
237238239240241242243244245246247248249250251252253254255256257258259260261262263264265266267268269270271272273274275276277278279280281282283284285286287288289290291292293294295

youngest dolerite dykes. A Rb-Sr whole-rock isochron age of 281± 5 Ma for the mineralized
beresite metasomatites is identical, within the uncertainties, to the Ar-Ar plateau age of 275 ± 6
Ma for the same rocks (Chugaev et al., 2015). Therefore, the gold mineralization event is coeval
to the youngest granite phase of the giant Angara-Vitim batholith (Tsygankov et al., 2007),
whose intrusions are exposed north to the Uryakh orefield.
The sulfide assemblage makes up < 0.5-2.5 % of the vein mineralization and consists of
major pyrite, chalcopyrite, sphalerite, galena, and minor arsenopyrite, fahlore and pyrrhotite
(Fig. 5). The noble metal minerals are native gold, Au-Ag alloys, native silver, and minerals of
the acanthite–argentite group.
The Irokinda gold-quartz vein deposit is constrained to the so-called Muya block, which is
a cratonic-basement high surrounded by diverse Proterozoic rocks of the Baikal–Muya belt close
to the boundary with the eastern margin of the Siberian platform (Fig. 2). The Muya block is
bordered by the E–W-trending Northern and Southern Muya deep faults in the south and north
and by long-lived mobile zones in the west and east (Fig. 6). The mineralization is hosted mostly
by ancient highly metamorphosed rocks, such as gneiss, migmatites, amphibolites, schists and
marbles. The high-grade transformation of Muya rocks resulted from repeated metamorphic
events in the Tonian (764–754 Ma) and Ediacaran (622–608 Ma) (Skuzovatov et al., 2019),
whereas the age of the sedimentary protolith is highly debatable but is likely no older than ~1
Ga, as follows from the zircon U-Pb and Nd-Hf isotope data (Skuzovatov et al., 2019). The
younger host rocks are weakly metamorphosed Early Neoproterozoic plutonic and volcanic
rocks and Paleozoic granitic, dioritic and doleritic dykes. The ore-bearing veins are confined to
the lying side of the Vostochny Fault of the Kelyana fault zone. The veins fill the north-east to
north-northwest branching fractures and minor faults; and the vein distribution is also locally
controlled by low-angle dynamometamorphic schist zones that extends for several hundred
meters to several kilometers. The veins in the schist zones are discontinuous, show a linear or S-
shaped morphology (Fig. 4) and locally form up to a 1200 m-thick packages of the differently
oriented veins to stockwork (Zlobina et al., 2014).
The gold occurs in the carbonate–sulfide–quartz veins as native gold and, to some extent,
as "invisible" gold in pyrite. The gold distribution is highly heterogeneous, and grade of the ores
varies from an off-cut to over 1000 g/t Au. The orebody also includes veinlets and networks of
superimposed younger gold-sphalerite-galena mineralization with rare chalcopyrite, pyrrhotite,
arsenopyrite, and fahlore (Fig. 5). The total sulfide content is < 0.5 wt. %.
Gold resources of the studied deposits are estimated at:
– Uryakh: 56 tonnes Au (Ivanov, 2014) with an average grade of 4.3 g/t Au;
296297298299300301302303304305306307308309310311312313314315316317318319320321322323324325326327328329330331332333334335336337338339340341342343344345346347348349350351352353354

– Irokinda: >60 tonnes Au (Ananin et al., 2000) with an average grade of 4.7 g/t Au.
3. Methods
Fluid inclusions were studied in quartz samples from veins and veinlets of all gold deposits
under review. For this purpose doubly-polished 0.3-0.5 mm thick sections were prepared from
quartz samples for optical, thermometric, and cryometric studies of fluid inclusions. Fluid
inclusions were studied using a Olympus BX51 optical microscope. Microthermometric
measurements were performed with a THMSG-600 heating stage (Linkam, United Kingdom).
The salt components in the inclusions were derived from eutectic temperatures (Borisenko,
1977). Fluid salinity was determined from ice melting temperatures in two-phase inclusions
and/or from homogenization temperatures of halite daughter crystals in multi-phase inclusions,
all modelled in terms of the NaCl–H2O system (Bodnar and Vityk, 1994). Fluid salinity in
carbon dioxide–water inclusions was estimated from gas hydrate melting temperatures (Collins,
1979). Carbon dioxide concentrations in solutions were calculated from the volume and weight
ratios of fluid components (Prokof’ev and Naumov, 1987). To calculate the proportions of phase
volumes in inclusions of the regular shape, the linear dimensions of the fluid inclusion and the
phase of liquid CO2 were measured (in three axes, using Fedorov's table). The volumes of fluid
inclusion and the phase of liquid CO2 were calculated according the formulas for the volume of
an ellipsoid or a sphere.
In cases where minerals contained co-genetically trapped carbon dioxide–water and CO2
gas inclusions, pressure was determined from the intersection of the isochores, calculated on gas
inclusions, and the line of homogenization temperature of carbon dioxide-water inclusions
(Kalyuzhny, 1982). Fluid inclusions that trapped coexisting heterogeneous fluids within the two-
phase equilibrium line, do not require pressure corrections and, homogenized at the highest
temperature (Roedder, 1984). The average temperature of homogenization of carbon dioxide-
water inclusions was determined from the groups of fluid inclusions with the same phase
relationships and the same homogenization temperature. The composition of the inclusions in
this group corresponds to the composition of the aqueous phase of the heterogeneous fluid. Fluid
inclusions with variable phase ratios that trapped different phases of the heterogeneous fluid
were excluded from consideration. Fluid inclusion data for CO2-CH4-N2 gas were interpreted
with reference to the published literature (Kerkhof, 1988 and Thiery et al., 1994).
Salt concentration, fluid density, and fluid pressure were calculated using the FLINCOR
software (Brown, 1989).
Aqueous and gas extracts from fluid inclusions were analyzed on a 0.5 g sample of 0.50–
0.25 mm size fraction) using the technique described by Kryazhev et al. (2006). The basic flow
355356357358359360361362363364365366367368369370371372373374375376377378379380381382383384385386387388389390391392393394395396397398399400401402403404405406407408409410411412413

sheet of the bulk analysis of fluid inclusions included sample cleaning, fluid inclusions
breaching, and determination of the composition of the released components by various methods.
The sample was cleaned first with 50 vol. % (1+1) HNO3 solution and then exposed to
electrolytic cleaning in a water flow using an ultrasonic bath. The dried sample was placed into a
disposable glass reactor, which was vacuumed at 110°С and filled with helium. A crushing stage
enabled fluid inclusions to be breached mechanically or thermally depending on the problem to
be solved. Thermal breaching was performed by heating up to 400°С. Mechanical breaching was
carried out by means of small corundum balls and a vibrator at a temperature of 120°С in order
to suppress gas sorption and to permit quantitative analysis of H2O. The released gases were fed
by a dosing valve into a TSVET-100 gas chromatograph equipped with a flow divider for the
simultaneous determination of H2O, CO2, CH4, and other gases. The reactor with the crushed (or
decrepitated) sample was filled with deionized water (7 ml) and placed in an ultrasonic bath for
15 min. The extracted solution was separated by centrifuging and subjected to ion
chromatography on the TSVET-3006 liquid chromatograph to determine Cl–, F–, SO42–, and
HCO3-– concentrations with a detection limit of 0.01 mg/l and to ICP mass spectrometry on an
Elan 6100 device, for other components. Thus, gases, salts, and the solvent (water) were
extracted simultaneously from bulk fluid inclusion samples during analysis, enabling reliable
calculation of concentrations in solutions. Minimization of the number of analytical operations
reduced the probability of sample contamination with foreign admixtures in the course of
analysis. The standardization procedure ensured highest possible error compensation and raised
the reliability of detected differences between fluid compositions of the studied sample series.
The data on blank extracts were subtracted from the results obtained. The remaining useful
signal represents the contents of fluid inclusions with a high probability. Therefore, we may
conclude that bulk analysis data reflect the bulk concentrations of fluid inclusion components.
Compositions of the gas and solid phases in individual fluid inclusions were studied by
Raman spectroscopy using a Jobin Yvon LabRAM HR800 spectrometer.
The carbon isotopic compositions of fluid inclusion gases were measured at the GFZ
Potsdam, Germany using a sample crusher, GC-column, EA, a ConFloIII interface and a Thermo
DeltaplusXL mass spectrometer according to the online method described by Plessen and Lüders
(2012). Variations in δ13C values of CO2 of quartz-hosted gas-rich fluid inclusion assemblages in
previously studied quartz chips from the Ashanti gold mine (GH-172 and GH-151, Plessen and
Lüders (2012) show excellent reproducibility in the range between 0.5 and 0.4‰, respectively.
4. Fluid inclusion characteristics
4.1. Sampling
414415416417418419420421422423424425426427428429430431432433434435436437438439440441442443444445446447448449450451452453454455456457458459460461462463464465466467468469470471472

This study presents data on fluid inclusions (FI), which are hosted mostly in quartz, from
ore veins and veinlets sampled in the mines (Fig. 4). Mineral paragenetic sequence of the main
ore stage for the studied deposits is compiled based on the previous studies (Distler et al., 1996,
2004; Yakubchuk et al., 2014) and our observations and shown in Figure 5. Quartz from the
veins and veinlets underwent partial recrystallization and deformation, and because of this only
about 10 % of our thin sections contain FI suitable for thermometric experiments. For the Sukhoi
Log deposit, 23 borehole samples of gold-sulfide-quartz ores were studied. For the Verninsk
deposit, 5 samples of gold-bearing quartz were taken from an open pit and exploration trenches.
Six samples were collected from an adit and trenches at the Digaldyn deposit. The Uryakh
mineralization was represented by samples form five borehole, and 10 Irokinda ore samples were
collected in underground mines. Visible grains of native gold were found in most of the studied
quartz samples (Fig. 7).
4.2. Description of the fluid inclusions
Fluid inclusions 2-25 µm have variable morphologies, including irregular ones and those
of negative crystals. In terms of phase composition at the room temperature, the following four
types of FI are distinguished (Fig. 8): type 1 (CO2-aqueous) is two- or three-phase CO2-aqueous
inclusions; type 2 (V) is predominantly gas inclusions with liquid CO2 (including subtype 2a
inclusions with high-density nitrogen); type 3 (L-V) is two-phase inclusions containing aqueous
solution and a gas bubble; and type 4 (L-V-S) is three- and multi-phase FI containing aqueous
solution, a gas bubble and at least one up to several crystals with the largest cubic crystal, which
were identified as halite based on its index of refraction. The type 2 (V) FI (Fig. 8e, f) were
commonly trapped simultaneously with the type 1 CO2-aqueous FI (Fig. 8a, b), likely indicating
that the mineralizing fluid was heterogeneous. The type 1 and type 2 FI were found in quartz
from all deposits, whereas the type 3 (L-V) FI occur in quartz from the Sukhoi Log, Verninsk,
Uryakh and Irokinda deposits. The type 4 (L-V-S) FI were detected only in some quartz samples
from the Irokinda deposit.
Quartz aggregates from the gold-bearing veins are composed of the equant or elongate,
commonly heavily fractured grains. Cathodoluminescence reveals the presence of re-crystallised
domains along the margins, whereas the cores of the grains are not re-crystallized. Most of the FI
are confined to internal fractures. However, the central unfractured parts of the quartz grains
sometimes enclose FI of types 1, 2 and 4 that are not related to any fractures. These inclusions
are asserted to be the primary FI (P) (Fig. 9). The FI of types 1 and 2, as well as 4 and 2, often
coexist with one another in quartz that reflect a heterogeneous state of the fluid and high
concentrations of carbonic acid in it. Specifically, these FI trapped the fluid that was responsible
473474475476477478479480481482483484485486487488489490491492493494495496497498499500501502503504505506507508509510511512513514515516517518519520521522523524525526527528529530531
for gold precipitation. These FI are locally confined to zones of crystal growth that also confirm
their primary origin (Fig. 9f).
The type 1 CO2-aqueous FI in the internal fractures restricted to grain boundaries
sometimes contain a phase of dense CO2 of relatively small volume. These inclusions are
referred to as pseudo-secondary (PS) FI, as compared to the secondary (S) L-V FI of aqueous-
salt solutions that are mostly confined to fractures across the quartz grains.
4.3. Microthermometric data
Microthermometric data on more than 2000 individual fluid inclusions are shown, along
with the calculated fluid densities and pressure of fluid entrapment, in Figure 10 and in Table 1.
The type-1 CO2-aqueous FI commonly decrepitate prior to homogenization at heating because of
the high fluid pressure. Thereby homogenization temperature was determined only for several
smaller inclusions within the studied association.
4.3.1. The Sukhoi Log deposit
Type 1 CO2-aqueous FI exhibit homogenization temperatures of 210–385°C; fluid salinity
of 5.0–8.1 wt% NaCl equiv; and CO2 concentration of 1.8–7.6 mol/kg. The eutectic temperatures
of –30 to –34°C suggest that Na, Mg, and Fe chlorides are the predominant solutes. The melting
temperature of CO2 in the gas phase of the type 1 CO2-aqueous FI varies from –57.2 to –82.2°C.
The fluid density is 0.82–1.09 g/cm3.
The presence of carbon dioxide in FI follows from the physical properties: the critical
temperature of +31.05°С and the triple point temperature of –56.6°С (Roedder, 1984). When
subjected to supercooling (at –100°С) CO2 freezes into numerous very small crystals, which is
seen as FI darkening. These crystals subsequently merge into a solitary crystal that melts when
heated above –56.6°С.
Carbon dioxide in the type 2 (V) FI homogenized into liquid at temperatures varying from
–11.9 to +18.6°C. Its melting temperature varies from –57.0 to –60.8°C and noticeably differs
from the melting point of pure CO2 (–56.6°C), which is interpreted as caused by admixtures of
gases with low boiling points CH4 or N2). The density of CO2 is within 0.71–0.92 g/cm3.
The subtype 2a (V) FI are filled with high-density gas mixture that unmixes at
supercooling at temperatures below –160°C. This suggests the prevalence of nitrogen in the gas
mixture. The homogenization temperatures of such inclusions vary from –153.5 (into gas) to –
158.6°C (into liquids). Sporadic solid carbon dioxide with melting point varying from –62.3 to –
83.5°C freezes out of the mixture. The density of the gas mixture is 0.12–0.57 g/cm3.
The two-phase type 3 (L-V) FI homogenize into liquid at 130-385°C and contain aqueous
solution with salinities of 3.7–9.5 wt% NaCl equiv. The predominant solutes in these inclusions
532533534535536537538539540541542543544545546547548549550551552553554555556557558559560561562563564565566567568569570571572573574575576577578579580581582583584585586587588589590

are also Na, Mg, and Fe chlorides (eutectic points of –25 to –34°C). The fluid density is 0.65–
0.97 g/cm3.
Therefore, gold-bearing mineralizing fluids of the Sukhoi Log contain high concentrations
of CO2 and other gases, and have a low salinity, which corresponds, based on their compositions,
to the typical fluids at orogenic gold deposits (Ridley, Diamond, 2000) .
4.3.2. The Verninsk deposit
The type 1 CO2-aqueous FI have homogenization temperatures of 252–356 °C; fluid
salinity of 1.4–8.1 wt% NaCl equiv.; CO2 concentration of 1.4–8.6 mol/kg. The eutectic points at
–25 to –32°C suggest that the predominant solutes are Na, Mg, and Fe chlorides. The melting
temperature of CO2 in the gas phase of the type 1 CO2-aqueous FI varies from –57.1 to –60.8 °C.
Fluid density is 0.84–1.05 g/cm3.
Carbon dioxide in the type 2 (V) FI homogenizes into liquid at temperatures varying from
–13.7 to +30.8°C. Its melting point varies from –56.9 to –64.7°C and differs noticeably from the
pure CO2 melting point of –56.6°C, suggesting admixtures of gases with low boiling point (CH4
or N2). The density of CO2 is 0.54–1.00 g/cm3.
The low-temperature type 1 CO2-aqueous PS FI have homogenization temperature of
179°C, fluid salinity of 5.0 wt% NaCl equiv., and CO2 concentration of 2.3 mol/kg. The eutectic
point of –31°C suggests the prevalence of Na, Mg and Fe chlorides in the solution. The melting
point of CO2 into gas is –58.0°C. The fluid density is 1.03 g/cm3.
The two-phase type 3 (L-V) FI homogenize into liquid at 136–261°C and contain aqueous
solution with salinity of 5.0–6.2 wt% NaCl equiv. The predominant solutes in these FI are also
Na, Mg, and Fe chlorides as followed from eutectic points varying within a range from –26 to –
33°C. The fluid density is 0.83–0.97 g/cm3.
The PT parameters and compositions of the Verninsk ore-bearing fluids are closely similar
to those of the Sukhoi Log and the other orogenic deposits (Ridley, Diamond, 2000).The
indicative features are the high content of CO2 and other gases as well as the low salinity.
4.3.3. The Dogaldyn deposit
The type 1 (CO2-aqueous) FI have homogenization temperatures of 265–339°C; fluid
salinity of 1.4–7.3 wt% NaCl equiv., and a CO2 concentration of 2.6–7.1 mol/kg. The eutectic
points of –30 to –39°C suggest that the predominant solutes are Na, Mg, and Fe chlorides. The
melting point of carbon dioxide in the gas phase of the type 1 CO2-aqueous FI varies from –56.8
to –60.2°C. The fluid density is 0.90–1.05 g/cm3.
Carbon dioxide in the type 2 (V) FI homogenizes into liquid at temperatures varying from
–14.1 to +22.1°C. Its melting point varies from –57.0 to –60.4°C and differs from the pure CO2
591592593594595596597598599600601602603604605606607608609610611612613614615616617618619620621622623624625626627628629630631632633634635636637638639640641642643644645646647648649

melting point of –56.6°C, which is likely explained by the presence of CH4 or N2. The density of
CO2 is 0.75–1.00 g/cm3.
The type 1 (CO2-aqueous) FI were also found in sphalerite. The sphalerite-hosted type FI
have homogenization temperatures of 267–283°C, fluid salinity of 6.7 wt% NaCl eq, and CO2
concentration of 3.7 mol/kg. The eutectic point of –39°C suggests the prevalence of Na, Mg, and
Fe chlorides in the solution. The melting point of CO2 in the gas phase is –60.2°C. The fluid
density is 1.05 g/cm3.
The low-temperature type 1 CO2-aqueous PS FI are characterized by homogenization
temperature of 128–236°C, fluid salinity of 3.7–7.3 wt% NaCl equiv., and CO2 concentration of
1.7–2.9 mol/kg. The eutectic point (–29 to –30°C) suggests the prevalence of Na, Mg and Fe
chlorides in the solution. The melting point of CO2 in the gas phase was not determined because
of the small sizes of the gas bubbles. The fluid density is 0.96–1.05 g/cm3.
Ore-bearing fluids of the Dogaldyn are characterized by a high content of CO2 and low
salinity, which are typical of orogenic gold mineralization (Ridley, Diamond, 2000). The PT
parameters of entrapment are close to those of the other deposits of the Baikal-Patom area.
4.3.4. The Uryakh deposit
The type 1 (CO2-aqueous) FI have homogenization temperatures of 289–361°C; fluid
salinity of 2.5–5.2 wt% NaCl equiv. and CO2 concentration of 3.8–7.7 mol/kg.). Sodium, Mg,
and Fe chlorides are the predominant solutes, as follows from the eutectic temperatures of –30
to–34°C. The melting point of CO2 in the gas phase varies from –57.3 to –58.0°C, and the fluid
density is 0.96–1.06 g/cm3.
Carbon dioxide in the type 2 (V) FI homogenizes into liquid at temperatures ranging from
–14.3 to +25.6°C. Its melting point varies from –57.0 to –59.1°C, indicating the presence of CH4
or N2. The density of CO2 is 0.70–1.01 g/cm3.
The low-temperature type 1 CO2-aqueous PS FI with homogenization temperature of
213°C, fluid salinity of 5.2 wt% NaCl equiv., and a CO2 concentration of 3.8 mol/kg were also
found. The eutectic temperature of –30°C points out the prevalence of Na, Mg and Fe chlorides
in the solution. The melting point of CO2 in the gas phase of FI is –58.1°C and fluid density is
1.08 g/cm3.
The two-phase type 3 L-V FI homogenize into liquid at 191°C and contain aqueous
solution with salinities of 9.1 wt% NaCl equiv. The predominant solutes in these inclusions are
also Na, Mg, and Fe chlorides based on eutectic temperature of –30°C. Fluid density is 0.94
g/cm3.
Therefore, the ore-bearing fluid of the Uryakh deposits from the Baikal-Muya belt are
similar to the mineralizing fluids of the Baikal-Patom deposits in terms of their compositions and
650651652653654655656657658659660661662663664665666667668669670671672673674675676677678679680681682683684685686687688689690691692693694695696697698699700701702703704705706707708

PT conditions. The fluids are characterized by a high CO2 content and low salinity, which are the
indicative features of orogenic gold mineralization (Ridley, Diamond, 2000).
4.3.5. The Irokinda deposit
The type 1 (CO2-aqueous) FI have homogenization temperatures of 270–384°C; fluid
salinity of 3.9–23.4 wt% NaCl equiv. and CO2 concentration of 2.4–7.7 mol/kg. The eutectic
points varies from –30 to –52°C and suggests that the predominant solutes are Na, Mg, and Ca
chlorides. The melting point of CO2 in the gas phase varies from –57.0 to –62.6°C, and the fluid
density is 0.98–1.15 g/cm3.
Carbon dioxide in the type 2 (V) FI homogenizes into liquid at temperatures varying from
–32.4 to +27.5°C. Its melting point varies from –56.7 to –61.0°C, indicating admixtures of gases
with low boiling points (CH4 or N2). The density of CO2 is 0.67–1.09 g/cm3.
The sphalerite contains type 1 (CO2-aqueous) FI with homogenization temperature of
270°C, fluid salinity of 7.5 wt% NaCl equiv, and a CO2 concentration of 1.5 mol/kg. The
eutectic point (–32°C) suggests the prevalence of Na, Mg, and Fe chlorides in the solution. The
melting point of CO2 in the gas phase is –62.6°C. The fluid density is 1.09 g/cm3.
The low-temperature type 1 (CO2-aqueous) PS FI have a homogenization temperature of
191°C; fluid salinity of 8.5 wt% NaCl eq and CO2 concentration of 1.5 mol/kg. The eutectic
point of –36°C suggests the prevalence of Na, Mg and Fe chlorides in the solution. The melting
point of CO2 in the gas phase was not determined because of the small sizes of the gas bubbles.
The fluid density is 1.06 g/cm3.
The type 3 two-phase L-V FI homogenize into liquid at 172–230°C and contain aqueous
solution with salinities of 11.7–18.9 wt% NaCl equiv. The predominant solutes in these
inclusions are also Na, Mg and Ca chlorides (eutectic point –34 to –60°C). The fluid density is
0.97–1.03 g/cm3.
Homogenization of the type 4 multiphase L-V-S FI in quartz with the complete dissolution
of all daughter phases was reached at 320–453°С. Salt concentrations of the chloride brine vary
within 39.8–46.3 wt% NaCl equiv. The brine is also dominated by Na, Mg and Ca chlorides, as
follows from the eutectic points of –40 to –55°C. The fluid density is 1.02-1.13 g/cm3.
The compositions and PT parameters of Irokinda auriferous fluids are different from those
of the Sukhoi Log, Verninsk, Dogaldyn and Uryakh deposits. The presence of chloride brines
distinguishes the latter from typical orogenic fluids as defined by Ridley and Diamond (2000),
although the high abundances of CO2 and other gases in the Irokinda inclusions are consistent
with the orogenic style of the mineralization. We envisage that Irokinda fluids were derived from
a reservoir different from the fluid source of the first four deposits.
709710711712713714715716717718719720721722723724725726727728729730731732733734735736737738739740741742743744745746747748749750751752753754755756757758759760761762763764765766767

The microthermometric study shows that quartz of all the studied deposits was formed
from CO2-rich fluids at the high pressure. The fluid pressure estimated by an isochoric P-T
projection for the type 1 and type 2 fluid inclusions varies within a wide range (Fig. 11): Sukhoi
Log 800-2630 bar (av. 1506 bar), Verninsk 570-2450 bar (av. 1828 bar), Dogaldyn 960-3230 bar
(av. 1952 bar), Uryakh 1050-3290 bar (av. 2015 bar), Irokinda 840-5030 bar (av. 2360 bar). In
general, both the average and the highest pressure values increase from northwest to southeast,
from the Sukhoi Log deposit to the Irokinda deposit (Fig. 2). The increase in pressure is
accompanied by an increase in temperatures: Sukhoi Log 210-385 ºC (av. 298 °C), Verninsk
246-356 ºC (av. 301 °C), Dogaldyn 265-339 ºC (av. 302 °C), Uryakh 289 -361 ºC (av. 325 °C),
Irokinda 270-453 ºC (av. 362 °C).
4.4. Raman data
Results of Raman spectroscopic analysis of the molecular compositions of gas-bearing
fluid inclusion are presented in Table 2.
For the Sukhoi Log deposit, the presence of 74.4–80.2 mol. % CO2 and 19.7–25.6 mol. %
N2 in the type 2 (V) FI is confirmed by Raman spectroscopy.
For the Verninsk deposit, the presence of (mol. %) 77.7–98.4 CO2, 1.6–22.2 N2, 0.0-0.04
H2S and 0.0-0.04 CH4 is established in the type 1 (CO2-aqueous) FI. The type 2 (V) FI contain
(mol. %) 91.5–93.2 CO2, 6.8–8.2 N2 and 0.00-0.01 CH4, according to the Raman spectroscopy
data.
For the Dogaldyn deposit, Raman spectroscopy data attest to a presence of 98.2–99.0 mol.
% CO2 and nitrogen 1.0–1.8 mol. % N2 in the type 2 (V) FI.
For the Uryakh deposit, Raman spectroscopy confirms the presence of 98.2 mol. % CO2
and 1.8 mol. % N2 in the type 1 (CO2-aqueous) FI and 96.1 mol. % CO2 and 3.9 mol. % N2 in the
type 2 (V) FI.
For the Irokinda deposit, 56.6–98.7 mol. % CO2, 0.0–43.4 mol. % N2 and 0.04-1.29 mol. %
CH4 are determined in the type-1 (CO2- aqueous) FI. The type-2 (V) FI contain 75.9–99.7 mol.
% CO2, 0–24.1 mol. % N2 and 0-0.28 mol. % CH4. Calcite and siderite were identified among
the solids in the type 4 multiphase FI (L-V-S) FI (Fig. 12) by Raman spectroscopy.
The confirmed presence of dense CO2 and associated N2 in the type 1 and 2 FI is among
the most significant findings of the Raman spectroscopic study, because these gases are believed
to be the major indicative components of the gold-bearing fluids in the studied area.
4.5. Crush-leach bulk analyses data
Quartz for crush-leach analysis was selected from least deformed samples. The method
requires ~1 g mineral separates that allows reliable separation of an undeformed quartz variety.
Results of crush-leach bulk analyses of fluid inclusions are presented in Table 3. Bulk analysis
768769770771772773774775776777778779780781782783784785786787788789790791792793794795796797798799800801802803804805806807808809810811812813814815816817818819820821822823824825826

data confirm the presence of carbon dioxide, chlorine, HCO3- ion, Na, K, Ca, Mg and some trace
components in the fluid. The gold content in the bulk leachates reaches 18-131 ppm Au,
exceeding the average ore grade. The bulk leachate data are consistent with the data on
individual FI and show good agreement between corresponded anion/cation ratios (Table 4). The
major cation is Na whereas the major anions are Cl- and HCO3- ion. The inferred total
concentrations of the solutes are also in good agreement with microthermometric data, indicating
concentrations of 2.3-3.7 wt. % in Sukhoi Log, 1.4-2.5 wt. % in Verninsk, 10.4 wt. % in Uryakh
and 25.5-41.1 wt. % in Irokinda solutions. The bulk analysis of the leachates reflects the
contributions of FI of different type. However, CO2 and N2 are certainly contributed by two
major gas-rich FI types: type 1 CO2-aqueous and type 2 (V) inclusions. Therefore, we envisage
that CO2 and N2 values in the crush-leach experiments are representative of the composition of
ore-related fluid. The presence of a high Au concentration supports this conclusion.
5. C and N isotope compositions of fluid inclusion gases
The δ13CCO2 isotope composition of gases in the fluid inclusions was measured in
samples from all studied deposits in order to constrain the possible sources of the auriferous
fluids (Plessen and Lüders, 2012). Although the different generations and fractions of
heterogeneous fluids are trapped in the FI, the δ13CCO2 values for the deposits fall into narrow
ranges (Table 5).
Quartz from all the studied samples, except only samples from Irokinda, hosts gas-rich
inclusions showing only negative δ13CCO2 values in the range from -1.9 to -5.9 ‰ (Table 5). In
contrast, gas-rich inclusions in quartz samples from the Irokinda deposit show both negative and
positive δ13CCO2 values in the narrow range between -0.6 and +0.6 ‰ (Table 5, Fig. 13). In
addition to CO2, traces of CH4 and/or N2 were detected in some of the samples (Table 5). Certain
Sukhoi Log inclusions with high-density CO2-N2-bearing gas mixtures provided high N2 gas
inflow that allowed combining online measurements of both N2 and CO2 isotopic composition
(Table 5). The measured δ15N values vary from +3.0 to +5.9 ‰ (Table 5).
These results well agree with the previous findings (Lüders et al., 2015) on the relatively
uniform C isotope compositions of CO2 in the gases of fluid inclusions from orogenic deposits,
which likely indicate the large-scale CO2 supply from an isotopically homogeneous source.
These CO2-dominated gas signatures are suggested to be among the major indicative features of
a fertile fluid systems in the area.
6. Discussion
6.1. Systematics of fluid chemical compositions
827828829830831832833834835836837838839840841842843844845846847848849850851852853854855856857858859860861862863864865866867868869870871872873874875876877878879880881882883884885

The large statistics of the study is still not sufficient with regard for the huge area of the gold-
bearing provinces. However, certain provisional constraints on the sources of the mineralization
can be suggested.
Ore-forming fluids of the Baikal–Patom gold deposits and the Uryakh deposit of Baikal-
Muya are characterized by the relatively low salinity (1.4–9.5 wt.% NaCl equiv.) and the
intermediate temperature. The high fluid pressure of 0.6-5.0 kbar corresponds to the lithostatic
pressure for depths of 2-19 km that indicates a deep crustal origin of the fluid. The observed
increase in the average pressure and temperature from the Sukhoi Log towards the Irokinda
depositcorrelates with the positive shift of the C isotope compositions of CO2 in the fluid
roughly from northwest to southeast (Fig. 14).
Our newly acquired data are in excellent agreement with earlier published
microthemrometric data on fluid inclusions in quartz from Sukhoi Log, Uryakh and Irokinda
(Lyakhov and Popivnyak, 1977; Laverov et al., 2000; Distler et al., 2004; Rusinov et al., 2008;
Yudovskaya et al., 2016; Zlobina et al., 2016). The new data on the large Verninsk and small
Dogaldyn deposits support the idea that gold mineralization of Baikal-Patom and Baikal-Muya
was deposited from fluid rich in CO2.
The gold deposits of these areas are regarded as orogenic deposits related to Paleozoic
orogenesis and metamorphism (Distler et al., 2004; Goldfarb et al., 2014; Yudovskaya et al.,
2016). The concept of orogenic-style mineralization includes the supply of gold by fluids under
high-pressure from deep-seated (lower crustal) reservoirs (Cox, 2005). According to this
concept, carbonic acid and low-salinity aqueous solutions, along with gold, are typical
components of orogenic fluids (Phillips, 1993; Ridley and Diamond, 2000; Bodnar et al., 2014;
et al.). Experimental evidence that CO2 may act as a ligand for associated metals is absent so far,
and it is generally thought that CO2 does not form chemical species with Au, albeit CO2 and Au
accompany each other in metamorphic to orogenic processes (Lowenstern. 2001). Perhaps, CO2
acts as a volatile agent in hydrothermal fluid and facilitates the unmixing and separation of a
vapor phase. The latter can transport an appreciable amount of gold as sulfide or chloride
complexes depending on temperature and fluid chemistry (Trigub et al., 2017; Zotov et al.,
2017). Phillips and Powell (2010) suggested that aqueous-carbonic low-salinity orogenic fluid
can efficiently dissolve and transport gold in the form of a gold-sulphide complex, with
subsequent precipitation, but is not effective to dissolve sufficient amounts of base metals, which
explains the general absence of base metals at orogenic deposits. The role of CO2 can be also
important at its percolation through gold-bearing hydrothermal aqueous solution (so-called gas
barbotage), which promotes gold deposition due to a decrease in the amount of dense liquid,
which is removed by the percolating gas phase (Prokofiev and Selector, 2014). The transport of
886887888889890891892893894895896897898899900901902903904905906907908909910911912913914915916917918919920921922923924925926927928929930931932933934935936937938939940941942943944

disperse gold nanoparticles by CO2-rich gaseous fluid (Prokofiev et al., 2016) is also possible,
whereas the subsequent mixing with aqueous fluid is suggested to result in gold precipitation.
Therefore, although CO2 itself does not play a role in gold transport, its involvement as a highly
permeable substance creates a necessary conditions for gold scavenging and deposition. The
important role of CO2 in ore-forming processes at the Sukhoi Log deposit is supported by the
CO2-rich composition of gases trapped in the native gold, which hosts carbon dioxide, nitrogen,
and methane without any traces of a liquid phase (Petrovskaya, 1973).
Three key papers overview substantial data on fluid inclusions in minerals from orogenic
gold deposits worldwide (Ridley and Diamond, 2000, Bodnar et al., 2014, and Goldfarb and
Groves, 2015). The compositions of fluids at Sukhoi Log, Verninsk, Dogaldyn and Uryakh are
approximated by the H2O–CO2–NaCl system, with generally low salinities typical of orogenic
fluids (Ridley and Diamond, 2000).
The fluids of the Irokinda deposit differ from fluids of the other studied deposits in
having high temperatures, pressures and salinity (Figs. 10, 11). Bulk crush-leach data for the
Irokinda deposit suggest that gold was precipitated from a fluid enriched in Cl, HCO3-, Br, Sr,
Ba, Rb, Sb, Cs and Cd (Table 3). The presence of chloride and carbonate solids in the multi-
phase type 4 fluid inclusions in Irokinda quartz supports the bulk crush-leach data (Table 4).
Bodnar et al. (2014) argued that the range of the salinity of orogenic fluids can be much wider
than that suggested in other overviews. Therefore, the Irokinda gas-rich brines also can belong to
the orogenic type under these constraints (Bodnar et al., 2014).
Goldfarb and Groves (2015) discuss a possible modification of fluid compositions during
the post-ore retrograde history of mineralization during cooling and decompression at
exhumation, emphasizing that caution is required in interpreting FI data. While fluid
overpressure during uplift may result in the expansion of FI and decrepitation, fluid
underpressure may result in shrinkage and also in decrepitation, Sharing this opinion, we failed
to find any evidence on superimposed fluid process that may affect the FI described above. We
do accept the possibility of the formation of secondary inclusion at expense and by modification
of primary ones, followed by CO2 losses, but other effects on the largely preserved primary
inclusions can be ruled out.
For the first time, we analyzed the gas composition of individual type 1 CO2-aqueous and
type 2 V FI in quartz from all the studied deposits by Raman spectroscopy. The analysis
identifies N2 as a predominant admixture in the CO2-dominant gas phase and confirms our
earlier detection of dense N2 in fluid inclusions in quartz from productive gold-quartz-sulfide
veinlets of the Sukhoi Log deposit (Dislter et al., 2004). The compositions of bulk fluids released
at crushing of gold-bearing quartz are in good agreement with the compositions of the individual
9459469479489499509519529539549559569579589599609619629639649659669679689699709719729739749759769779789799809819829839849859869879889899909919929939949959969979989991000100110021003

FI, with both showing similar cation/anion ratios. The high Au content in bulk crush-leach
samples add more confidence that the analyzed gas mixture is directly related to the ore-forming
process.
6.2. Stable isotope constraints
The analysis of the stable isotope compositions of CO2 and N2 in fluids was aimed at
defining the isotopic indicators of the possible sources of mineralizing fluids that can be of
different provenance at the ore regareaion and at a given deposit (Goldfarb and Groves, 2015).
For instance, Lowrence et al. (2013) identify a few different sources of orogenic fluids for the
gold deposits in West Africa.
Direct measurements of the C isotopic compositions of CO2 of the mineral-forming fluid
trapped as fluid inclusions in quartz were also the first for all the studied deposits. The C isotopic
composition of CO2 from Sukhoi Log, Verninsk, Uryakh and Dogaldyn is characterized by the
narrow range of δ13CCO2 values varying from –1.9 to –5.9‰, whereas Irokinda quartz contains
CO2 with an even narrower range of δ13CCO2 from +0.6 to –0.6 ‰ (Table 5, Fig. 13). Previous
studies provided the C isotope compositions of Mg-Fe carbonates from quartz-sulfide and
quartz-carbonate veins and veinlets of the Sukhoi Log deposits. The carbon of Sukhoi Log
carbonates has a C isotope compositions ranging from -0.1 to -6.1 ‰ δ13C according to Distler et
al., 2004), from –3.8 to –5.9 ‰ according to Kryazhev et al. (2009), and from –4.6 to –9.2 ‰
according to the latest study by Dubinina et al., 2014. The variations in the C isotope
composition of the fluid calculated from the δ13C values of the carbonate are even wider,
although both ranges are relatively narrow compared to the much broader range of -6.7 to -42 ‰
of the δ13Corg values for organic carbon from the host black shales of Sukhoi Log (Distler et al.,
2004).
The δ13CCO2 range of –4.8 до –5.5 ‰ determined for FI in Sukhoi Log quartz are very
close to the highest δ13C values for Sukhoi Log carbonates. Dubinina et al. (2014) reported that
carbonates in universalized host rocks have a C isotope composition in the range from –5.2 до –
10.5 ‰ δ13CCO2 and are depleted in the heavy C isotope compared to carbonates from the
orebody. Therefore, we can state that the C isotope composition of CO2 from FI corresponds to
the primary isotope composition of mineralizing fluid, whereas the C isotope characteristics of
carbonates from the ore veins reflect interaction between the fluid and the carbonate hosts. The
textural relationships (Fig. 5) suggest that carbonate crystallization in the vein significantly
postdates the crystallization of native gold. This post-ore fluid-rock interaction results in the
wide variations of the C isotope compositions of carbonates.
10041005100610071008100910101011101210131014101510161017101810191020102110221023102410251026102710281029103010311032103310341035103610371038103910401041104210431044104510461047104810491050105110521053105410551056105710581059106010611062

The C isotope compositions of orogenic fluids are discussed in many papers and reviews
(Kerrich, 1989; McCuaig and Kerrich, 1998 and references therein), which mention a rather
wide range of -11 to +2 ‰ δ13C. Recently, based on the published data, Goldfarb and Groves
(2015) suggested that the C isotope composition of orogenic fluids can vary more significantly
within the range of -30 to +4.1 ‰. However, all reported data on the isotope compositions of
fluids were obtained by recalculation of the isotope compositions of carbonates from mineralized
rocks and veins. This approach may provide significant bias because carbonate deposition was
not synchronous with but rather postdated gold mineralization, and the carbonate compositions
reflect fluid-rock interaction at relatively low temperatures that resulted to the observed wide
variations in their isotope characteristics. Therefore, we cannot compare our results of the direct
measurements of the CCO2 isotope compositions with data obtained by the different approach.
This range of the carbon isotopic composition of gases in fluid inclusions from Sukhoi
Log, Verninsk, Uryakh and Dogaldyn (–1.9 to –5.9‰ δ13C, (Fig. 13) can be interpreted to
account for a magmatic (granitic) or even a mantle source of CO2 (Hoefs, 2009). A magmatic
source of gold-bearing fluids has been discussed in many previous studies (e.g. Sher, 1972;
Rundqvist et al., 1992; Distler et al., 1996; Lishnevsky, Distler, 2004; Kucherenko et al., 2011;
Yudovskaya et al., 2016). However, the origin of CO2 from a mantle source can be ruled out due
to the positive δ15N values in high-density CO2-N2 inclusions in quartz (Fig. 15), because these
values univocally suggest a crustal provenance of the N2, although tehse data do not rule out
sedimentary, metamorphic or magmatic crustal origins. However, the whole dataset is not
consistent with that CO2 (and gold) were scavenged and concentrated from the host rocks by
metamorphic fluids, as was suggested in (Large et al., 2007; Dubinina et al., 2014; et al.).
The high carbonate concentrations in Irokinda fluids could be derived from marine
limestones, a hypothesis supported by the CO2 carbon isotopic composition of the fluids that
varies from +0.6 to –0.6 ‰ δ13CCO2 within the range typical of marine limestone decarbonization
(e.g., Hoefs, 2009).
Conclusions
We suggested that only Irokinda fluid inclusions reveal identifiable characteristics of two
distinct sources of orogenic fluid: (i) provisionally crustal magmatic and (ii) marine carbonates.
The fluid compositions of all the giant to small deposits of Baikal-Patom and Baikal-Muya belt
define a rougly north-south trend of the increasing temperature and pressure, which correlates
with the enrichment in heavy C isotope (Fig. 14). The Irokinda and Sukhoi Log fluids are two
end-members of this trend, whereas the other deposits show intermediate characteristics, which
likely reflect another contribution of the marine source to the fluid compositions. The trend is in
10631064106510661067106810691070107110721073107410751076107710781079108010811082108310841085108610871088108910901091109210931094109510961097109810991100110111021103110411051106110711081109111011111112111311141115111611171118111911201121

a good agreement with the geological setting and the lithologies of the host rocks of the deposits,
and the increase in the temperature and pressure also correlates with the metamorphic grades of
the host rocks. If this trend is confirmed by future studies at other gold deposits and ore
occurrences, then it can be interpreted as resulting from the same large-scale ore-forming event,
which was possibly synchronous throughout the whole Baikal-Patom-Muya area
Acknowledgements
This work was supported by the RFBR (projects 17-05-01167-a and 17-05-00387-a).
References
Ananin, V.A., Bakhtin, V.I., Doroshkevich, G.I., Maurishnin, E.S., Minin, V.V., Mironov, A.G.,
Roshchektayev, P.A., Osokin, A.P., and Yavirskaya, T.F., 2000. Gold of Buryatiya. Book
1. Structural–metallogenic zoning. Geological structure of ore deposits. Resource estimate.
Ulan-Ude. (in Russian).
Bodnar, R.J. and Vityk, M.O., 1994. Interpretation of microterhmometric data for H2O–NaCl
fluid inclusions, in Fluid Inclusions in Minerals: Methods and Applications, Ed. By
Benedetto De Vivo and Maria Luce Frezzotti, Pontignano: Sienna, pp. 117–130.
Bodnar, R.J., Lecumberri-Sanchez, P., Moncada, D., and Steele-Maclnnes, P., 2014. Fluid
inclusions in hydrothermal ore deposits. Reference Module in Earth Systems and
Environmental Sciences. Treatise on Geochemistry, 2nd Edition, Elsevier, pp. 119–142.
Borisenko, A.S. 1977., Cryometric study of the salt composition of solutions in mineral-hosted
gas–liquid inclusions in, Geol. Geofiz. 8, pp. 16–28 (in Russian).
Brown, P.E., 1989. Flincor: A microcomputer program for the reduction and investigation of
fluid inclusion data, Am. Mineral., 74, pp. 1390–1393.
Bulgatov, A.N., and Gordiyenko, I.V., 1999. Terranes of the Baikal Highland and spatial
distribution of gold deposits within them. Geologiya Rudnykh Mestorozhdeniy 41, pp.
230–240.
Burrows, D.A., Wood, P.C., Spooner, E.T.C., 1986. Carbon isotope evidence for a magmatic
origin for Archean gold-quartz vein ore deposits. Nature 321, pp. 851–854.
Buryak, V.A., 1982. Metamorphism and ore-forming processes. Nauka, Moscow (in Russian).
Buryak, V.A., Khmelevskaya, N.M. 1997. Sukhoy Log: One of the world’s largest gold deposit:
Genesis, localization of ore, and prediction criteria. Dal’nauka, Vladivostok, p. 156 (in
Russian).
Chugaev, A.V., Nosova, A.A., Abramov, S.S., Chernyshev, I.V., Bortnikov, N.S., Larionova,
Y.O., Goltsman, Y.V., Moralev, G.V., Volfson, A.A. Early Permian stage of formation of
11221123112411251126112711281129113011311132113311341135113611371138113911401141114211431144114511461147114811491150115111521153115411551156115711581159116011611162116311641165116611671168116911701171117211731174117511761177117811791180

gold-ore deposits of northeastern Transbaikalia: isotope-geochronological (Rb-Sr and
39Ar-40Ar) data for the Uryakh ore field. Doklady Earth Sciences. 2015. Т. 463. № 2. С.
855-859.
Collins, P.L.P., 1979. Gas hydrates in CO2 bearing fluid inclusions and the use of freezing data
for estimation of salinity, Econ. Geol., 74, pp. 1435–1444.
Cox S.F., 2005. Coupling between deformation, fluid pressures, and fluid flow in ore-producing
hydrothermal systems at depth in the crust. Economic Geology 100th Anniversary Volume.
Littleton, Colorado: Society of Economic Geologists, Inc., pp. 39-75.
Distler, V.V., Mitrofanov, G.L., Nemerov, V.K., Kovalenker, V.A., Mokhov, A.V., Semeikina,
L.K., Yudovskaya, M.A., 1996. Modes of occurrence of the platinum group elements and
their origin in the Sukhoi Log gold deposit (Russia). Geology of Ore Deposits 38 (6), pp.
413-428.
Distler, V.V., Yudovskaya, M.A., Mitrofanov, G.L., Prokof’ev, V.V., Lishnevsky, E.N., 2004.
Geology, composition, and genesis of the Sukhoi Log noble metals deposit, Russia. Ore
Geology Reviews 24, pp. 7-44.
Dubinina, E.O., Chugaev, A.V., Ikonnikova, T.A., Avdeenko, A.S., Yakushev, A.I., 2014.
Sources and fluid regime of quartz–carbonate veins at the Sukhoi Log gold deposit, Baikal-
Patom Highland. Petrology 22, pp. 329-358.
Goldfarb, R.J., Baker, T., Dube, B., Groves, D.I., Hart, C.J.R., Gosselin, P., 2005. Distribution,
character, and genesis of gold deposits in metamorphic terranes. Economic Geology 100,
pp. 407-450.
Goldfarb, R.J., Groves, D.I., 2015. Orogenic gold: Common or evolving fluid and metal sources
through time. Lithos 233 pp. 2-26.
Goldfarb, R.J., Taylor, R.D., Collins G.S., Goryachev N.A., Orlandini O.F., 2014. Phanerozoic
continental growth and gold metallogeny of Asia. Gondwana Research 25, pp. 48-102.
Groves, D.I., Goldfarb, R.J., Gebre-Mariam, M., Hagemann, S.G., Robert, F., 1998. Orogenic
gold deposits: A proposed classification in the context of their crustal distribution and
relationship to other gold deposit types. Ore Geology Reviews 13, pp. 7-27.
Hoefs J., 2009. Stable isotope geochemistry. Springer, p. 285.
Ivanov, A.I., 2014. Gold of the Baikal-Patom Highland (Geology, Mineralisation, Perspectives).
TSNIGRI, Moscow, p. 215 (in Russian).
Ivanov, A.I., Livshits, V.I., Perevalov, O.V., et al., Dokembrii Patomskogo nagor’ya
(Precambrian of the Patom Highland), Moscow: Nedra, 1995.
Kerkhof van den, A.M., 1988. The System CO2-CH4-N2 in Fluid Inclusions: Theoretical
Modeling and Geological Applications. Free University Press, Amsterdam.
11811182118311841185118611871188118911901191119211931194119511961197119811991200120112021203120412051206120712081209121012111212121312141215121612171218121912201221122212231224122512261227122812291230123112321233123412351236123712381239

Kerkhof van den, A.M., Touret, J.L.R., Kreulen, R., 1994. Juvenile CO2 in enderbites of Tromøy
near Arendal, southern Norway: a fluid inclusion and stable isotope study. Journal
Metamorphic Geology 12, pp. 301–310.
Kerrich, R., 1989. Geochemical evidence on the sources of fluids and solutes for shear zone
hosted mesothermal Au deposits. In: Bursnall, J.T. (Ed.), Mineralization and Shear Zones.
Geological Association of Canada Short Course 6, pp. 129–197.
Kerrich, R., Fryer, B.J., King, R.W., Willmore, L.M., van Hees, E., 1987. Crustal outgassing and
LILE enrichment in major lithosphere structures, Archean Abitibi greenstone belt:
evidence for the source reservoirs from strontium and carbon isotope traces. Contribution
to Mineralogy and Petrology 97, pp. 156–168.
Konstantinov M.M., 2010. Gold deposits of Russia. Akvarel, Moscow, p. 378 (in Russian).
Kröner, A., Kovach, V., Belousova, E., Hegner, E., Armstrong, R., Dolgopolova, A., Seltmann,
R., Alexeiev, D.V., Hoffmann, J.E., Wong, J., Sun, M., Cai, K., Wang, T., Tong, Y.,
Wilde, S.A., Degtyarev, K.E., Rytsk, E., 2014. Reassessment of continental growth during
the accretionary history of the Central Asian Orogenic Belt. Gondwana Research 25, pp.
103-125.
Kryazhev, S.G., Ustinov, V.I., Grinenko, V.A., 2009. Fluid regime at the Sukhoi Log gold
deposit: isotopic evidence. Geochemistry International 47, pp. 1041-1049.
Kucherenko, I.V., Gavrilov, R.Yu., Martunenko, V.G., Verchozin, A.V., 2011. Petrological-
geochemical features of wall-rock metasomatism at the Sukhoy Log gold deposit, Lena
Area. Part 2. In: Petrology of wall-rock metasomatism, Proceedings of Tomsky Technical
University, 320, pp. 28-37 (in Russian).
Large, R.R., Maslennikov, V.V., Robert, F., Danyushevsky, L., Chang, Z., 2007. Multistage
sedimentary and metamorphic origin of pyrite and gold in the giant Sukhoy Log deposit,
Lena Goldfield, Russia. Economic Geology 102, pp. 1233-1267.
Laverov, N.P., Prokof’ev, V.Yu., Distler, V.V., Yudovskaya, M.A., Spiridonov, A.M.,
Grebeshchikova, V.I., Matel, N.L., 2000. New data on conditions of ore deposition and
composition of ore-forming fluids in the Sukhoy Log gold-platinum deposit. Doklady
Earth Science 371, pp. 357-361.
Lawrence, D. M., Treloqr, P. J., Rankin, A. H,. Boyce, A., and Harbidge, P., 2013. A fluid
inclusion and stable isotope study at the Loulo mining district, Mali, West Africa:
Implications for multifluid sources in the generation of orogenic gold deposits. Economic
Geology 108, pp. 229–257.
12401241124212431244124512461247124812491250125112521253125412551256125712581259126012611262126312641265126612671268126912701271127212731274127512761277127812791280128112821283128412851286128712881289129012911292129312941295129612971298

Lishnevsky, E.N., Distler, V.V., 2004. Deep structure of the earth’s crust in the district of the
Sukhoi Log gold-platinum deposit (Eastern Siberia, Russia) based on geological and
geophysical data. Geology of Ore Deposits 46, pp. 76-90.
Lowenstern J.B. 2001. Carbon dioxide in magmas and implications for hydrothermal system.
Mineralium Deposita. 36 490-502.
Lüders V., Klemd R., Oberthür T., Plessen B., 2015. Different carbon reservoirs of auriferous
fluids in African Archean and Proterozoic gold deposits: Constraints from stable carbon
isotopic compositions of quartz-hosted CO2-rich fluid inclusions. Mineral. Deposita 50, pp.
449–454.
Lyakhov, Y.V., Popivnyak, I.V., 1977. O fisiko-khimicheskikh usloviyakh razvitiya zolotogo
orudeneniya Severnoy Buryatii. Izvestiya Akademii nauk SSSR. Seriya geologicheskaya 6,
pp. 5-17. (In Russian).
Mao, J.W., Zhang, Z., Wang, Y., Kerrich, R., 2003. Nitrogen isotope and content record of
Mesozoic orogenic gold deposits surrounding the North China craton. Science in China
(D) 46. pp. 231–245.
McCuaig, T.C., Kerrich, R., 1998. P–T–t–deformation-fluid characteristics of lode gold deposits:
evidence from alteration systematics. Ore Geology Reviews 12, pp. 381–454.
Meffre, S., Large, R.R., Scott, R., Woodhead, J., Chang, Z., Gilbert, S.E., Danyushevsky, L.V.,
Maslennikov, V., Hergt, J.M., 2008. Age and pyrite Pb isotopic composition of the giant
Sukhoi Log sediment-hosted gold deposit, Russia. Geochimica et Cosmochimica Acta 72,
pp. 2377-2391.
Migachev, I.F., Karpenko, I.A., Ivanov, A.I., 2008. The Sukhoi Log gold deposit: reappraisal
and estimation of the ore field and district. Otechestvennaya Geologiya 2, pp. 55-67 (in
Russian).
Mitrofanov, G.L., 2006. Tectonic basis of the localization and formation of noble metal deposits
in the Southern Surroundings of the Siberian Platform. Doctorate Dissertation at IGEM
RAS, Moscow (in Russian).
Nemerov, V.K., 1989. Geochemical Specialization of the Late Precambrian black shales of the
Baikal-Patom Highlands. PhD dissertation of the Vinogradov Institute of Geochemistry
RAS. Irkutsk (in Russian).
Petrovskaya N. V. 1973. Native Gold. Nauka, Moscow (in Russian).
Phillips, G.N., 1993. Metamorphic fluids and gold. Mineralogical Magazine 57, 365–374.
Plessen, B., Lüders, V., 2012. Simultaneous measurements of gas isotopic compositions of fluid
inclusion gases (N2, CH4, CO2) using continuous-flow isotope ratio mass-spectrometry.
Rap Comm Mass Spec 26, pp. 1157–1161.
12991300130113021303130413051306130713081309131013111312131313141315131613171318131913201321132213231324132513261327132813291330133113321333133413351336133713381339134013411342134313441345134613471348134913501351135213531354135513561357
Prokofiev, V.Yu., Akinfiev, N.N., Selektor, S.L., 2016. Gas Mixing with aqueous solution in the
ore-forming hydrothermal process: an example of gold. Geochemistry International 54 (5),
pp. 403–414.
Prokofyev, V. Yu., Naumov, V. B., 1987. Geochemical features of the mineralizing solutions at
the Zyryanov sulfide-polymetallic deposit, Rudnyy Altay. Geochemistry International
24(10), pp. 50-74.
Prokofiev V.Yu., Selector S.L., 2014. Fluid inclusion evidence for barbotage and its role in gold
deposition at the Darasun goldfield (eastern Transbaykalia, Russia). Cent. Eur. J. Geosci. 6
(2), pp. 131-138.
Ridley, J.R. and Diamond, L.W., 2000. Fluid chemistry of orogenic lode gold deposits and
implications for genetic models, Gold in 2000. SEG Reviews 13 pp. 141–162.
Roedder, E., 1984. Fluid inclusions. Review in Mineralogy, vol. 12. Mineralogical Society of
America.
Rundqvist, I.K., Bobrov, V.A., Smirnova, T.N., Cmirnov, M.Y., Danilova, M.Y., Ascheulov,
A.A., 1992. Stages of formation of the Bodaibo ore district. Geology of Ore Deposits 34,
pp. 3–15 (in Russian).
Rusinov, V.L., Rusinova, O.V., Kryazhev, S.G., Schegol’kov, Yu.V., Alusheva, E.I.,
Borisovsky, S.E., 2008. Wall-rock metasomatism of carbonaceous terrigenous rocks in the
Lena gold district. Geology of Ore Deposits 50 (1), pp. 1-40.
Rytsk, E.Yu., Kovach, V.P., Yarmolyuk, V.V., Kovalenko, V.I., Bogomolov, E.S., Kotov, A.B.,
2011. Isotopic structure and evolution of the continental crust in the East Transbaikalian
segment of the Central Asian Fold belt. Geotectonics 45, pp. 349-377.
Safonov, Yu.G., 2006. Geological-genetic types of gold and gold-bearing deposits. In: Large and
Super-Large Ore Deposits, vol. 2. IGEM RAS, Moscow, pp. 17-96 (in Russian).
Skuzovatov, S., Wang, K.-L., Dril, S., Lee, H.-Y., Iizuka, Y., 2019. Geochemistry, zircon U-Pb
and Lu-Hf systematics of high-grade metasedimentary sequences from the South Muya
block (northeastern Central Asian Orogenic Belt): Reconnaissance of polymetamorphism
and accretion of Neoproterozoic exotic blocks in southern Siberia. Precambrian Research
321, pp. 34–53
Sher, S.D., 1972. Metallogeny of Gold. Nedra, Moscow, p. 256 (in Russian).
Taylor, B.E., 1986. Magmatic volatiles: isotopic variation of C, H, and S. In: Valley, J.W.,
Taylor, H.P. Jr, O’Neil, J.R. (Eds): Stable isotopes in high temperature geological
processes. Reviews in Geology 16, pp. 185–225.
13581359136013611362136313641365136613671368136913701371137213731374137513761377137813791380138113821383138413851386138713881389139013911392139313941395139613971398139914001401140214031404140514061407140814091410141114121413141414151416

Thiery, R., Kerkhof, A.M., Dubessy, J., 1994. PTX properties of CH4-CO2 and CO2-N2 fluid
inclusions: modeling for T<31 ° C and P < 400 bars. European Journal of Mineralogy 6,
pp. 753-771.
Trigub, A. L.; Tagirov, B. R.; Kvashnina, K. O.; Lafuerza, S.; Filimonova, O. N.; Nickolsky, M.
S., 2017. Experimental determination of gold speciation in sulfide-rich hydrothermal fluids
under a wide range of redox conditions. Chemical Geology 471, 52−64.
Tsygankov, A.A., Matukov, D.I., Berezhnaya, N.G., Larionov, A.N., Posokhov, V.E., Tsyrenov,
B.Ts, Khromov, A.A., Sergeev, S.A., 2007. Magma sources and stages of emplacement of
the Late Paleozoic granitoids in the West Transbaikal Region. Geology and Geophysics 48,
156-180.
Wood, B.L., Popov, N.P., 2006. The giant Sukhoi Log gold deposit. Geology and Geophysics
47, pp. 315-341
Yakubchuk, A., Stein, H., Wilde, A., 2014. Results of pilot Re-Os dating of sulphides from the
Sukhoi Log and Olympiada orogenic gold deposits, Russia. Ore Geology Reviews 59, pp.
21-28.
Yarmolyuk, V.V., Kovalenko, V.I., Kovach, V.P., Rytsk, E.Yu., Kozakov, I.K., Kotov, A.B.,
Salnikova, E.B., 2006. Early stages of the Paleoasian Ocean formation: Results of
geochronological, isotopic, and geochemical investigations of Late Riphean and Vendian-
Cambrian complexes in the Central Asian Fold Belt. Doklady Earth Sciences 411, pp.
1184–1189.
Yudovskaya M.A., Distler V.V., Prokofiev V.Yu., Akinfiev N.N. Gold mineralization and
orogenic metamorphism in the Lena province of Siberia as assessed from Chertovo Koryto
and Sukhoi Log deposits // . Geoscience Frontiers. 2016. V. 7. № 3. pp. 453–481.
Yudovskaya, M.A., Distler, V.V., Rodionov, N.V., Mokhov, A.V., Antonov, A.V., Sergeev,
S.A., 2011. Relationship between metamorphism and ore formation at the Sukhoi Log gold
deposit hosted in black slates from the data of U-Th-Pb isotopic SHRIMP-dating of
accessory minerals. Geology of Ore Deposits 53, pp. 27-57 (in Russian).
Zlobina, T.M., Murashov, K.Yu., Kotov, A.A., 2014. Modeling the structural-dynamic
conditions of Au-Q veins localization at the Irokinda deposit, Muya gold-bearing area.
Geologiya I Mineralno-Syryevyye Resursy Sibiri, no 3, Part 2, pp. 55–61 (in Russian).
Zlobina, T.M., Petrov, V.A., Prokofyev, V.Yu., Kotov, A.A., Murashov, K.Yu., Volfson, A.A.,
2016. Uryakhskoye gold field (NE Transbaikalia): Formation of structural assemblages in
centroid-type seismic regime. Doklady Akadmii Nauk, vol. 470, no. 4, pp. 452–467.
14171418141914201421142214231424142514261427142814291430143114321433143414351436143714381439144014411442144314441445144614471448144914501451145214531454145514561457145814591460146114621463146414651466146714681469147014711472147314741475

Zotov A. V., Tagirov B. R., Koroleva L. A., and Volchenkov V. A. 2017 Experimental modeling
of Au and Pt coupled transport by chloride hydrothermal fluids at 350–450°C and 500–
1000 Bar. Geology of Ore Deposits 59 434-442.
Figure captions
Fig. 1. Location map of gold deposits in the Baikal-Patom and Muya areas, Siberia. The area of
the study is marked with a square.
Fig. 2. Schematic geodynamic map of the Baikal–Patom and Baikal–Muya foldbelts (Bulgatov
and Gordiyenko, 1999) with locations of the gold deposits discussed in text.
Fig. 3. Simplified geological maps of the Baikal–Patom gold deposits: Sukhoi Log, Verninsk and
Dogaldyn.
Fig. 4. Morphology and textures of gold-bearing quartz and quartz-sulfide veins exposed in the
open pits (a-b) and underground (c-e): a – Sukhoi Log, b – Verninsk, c – Dogaldyn, d –
Uryakh, e – Irokinda.
Fig. 5. Mineral paragenetic sequences and associated types of FI of the main ore stage in the
studied gold deposits.
Fig. 6. Simplified geological maps of the Baikal–Muya gold deposits (Uryakh and Irokinda).
Fig. 7. Native gold grains in quartz from the studied gold deposits: a – Sukhoi Log, b – Verninsk,
c – Dogaldyn (in a polished section under reflected light), d – Uryakh, e – Irokinda.
Au – native gold, Q – quartz, Py – pyrite, Sph – sphalerite.
Fig. 8. Types of fluid inclusions in quartz as exemplified by the Irokinda samples: a-d – type 1
CO2-aqueous FI (a, b - in quartz, a - +25 °C, b - +5 °C; c, d - in sphalerite, c - +25 °C, d - –
10 °C); e, f - type 2 V gas-rich CO2 FI (e - +25°C, f - –10°C); g-i - type 3 L-V FI; k-m -
type 4 L-V-S multi-phase FI of chlorine brines.
L – aqueous solutions, V – gas phase, L CO2 – liquid CO2, S halite – halite crystal.
Fig. 9. Distribution of primary, pseudosecondary and secondary FI in gold-bearing quartz from
the studied gold deposits:
a – primary type 1 CO2–aqueous FI and secondary type 3 L-V FI in Sukhoi Log gold-bearing
quartz, b – pseudosecondary type 1 CO2-aqueous FI in Sukhoi Log gold-bearing quartz, c –
primary type 1 CO2–aqueous FI in Verninsk gold-bearing quartz; d – secondary type 3 L-V
FI in Verninsk gold-bearing quartz; e – primary type 4 L-V-S FI of chloride brines in
Irokinda gold-bearing quartz; f – an association of syngenetic primary type 1 CO2–
aqueous FI and primary type 2 V FI in Irokinda gold-bearing quartz.
14761477147814791480148114821483148414851486148714881489149014911492149314941495149614971498149915001501150215031504150515061507150815091510151115121513151415151516151715181519152015211522152315241525152615271528152915301531153215331534

Fig. 10. Diagrams of salinity vs. homogenization temperature of mineralizing fluids for the
Baikal-Patom-Muya gold deposits. The maximum and minimum values for each type of FI
are shown.
Fig. 11. Diagrams of homogenization temperature vs pressure of mineralizing fluids for the
Baikal-Patom-Muya gold deposits.
Fig. 12. Raman spectra of solid phases in the Irokinda multi-phase fluid inclusion: calcite (1) and
siderite (2), Locations of analytical points 1 and 2 are shown in the photograph, quartz
lines are labeled with Q.
Fig. 13. Values of δ13CCO2 for quartz-hosted fluid inclusions of the Baikal–Patom and Baikal–
Muya gold deposits. The diagram also shows the typical ranges of the δ13C values of
crustal and mantle rocks (Taylor, 1986 and references therein; Burrows et al., 1986;
Kerrich et al., 1987; Hoefs, 2009 and references therein). Data on fluid inclusions hosted in
quartz from enderbite are given according to Van den Kerkhof et al. (1994).
Fig. 14. Correlation between C isotope composition of CO2 and average temperature (a) and
average pressure (b) of fluids from the Baikal-Patom-Muya gold deposits.
Fig. 15. Diagram of δ13CCO2 vs δ15N values for quartz-hosted fluid inclusions from the Sukhoi
Log gold deposit (modified after Lüders et al., 2015). Ranges of the δ13C and δ15N values
in crustal and mantle rocks are taken from Taylor (1986, and references therein); Burrow et
al., 1986; Kerrich et al., 1987; Jingwen, 2003 and references therein; Hoefs 2009 and
references therein.
15351536153715381539154015411542154315441545154615471548154915501551155215531554155515561557155815591560156115621563156415651566156715681569157015711572157315741575157615771578157915801581158215831584158515861587158815891590159115921593

Table 1. Parameters of the mineralizing fluids in quartz- and sphalerite-hosted fluid inclusions from gold deposit in the Baikal-Patom and Muya
area, Siberia,.
Deposits
(number of
samples)
Incl. type,
mineral
n* Th
\ºC
Teut \ºC Tm ice
\ºC
(NaCl)
Tm CO2 \ºC Th CO2
(N2)\ºC
Hom.
mode
CO2
Tm
Clatrate
\ºC
C, Eq.
mas%
NaCl
C CO2
\mol/ kg
solution
D, \g/cm3
(Middle)
Pressure,\
bar
Sukhoi
Log (23)
1 P CO2-
aquas Q
283 210-
385
-30 to
-34
-4.6 to
-7.5
-57.1 to
-82.2
-19.9 to
+10.5
L 6.2-12.4 5.0-8.1 1.8-7.6 0.82-1.09 640-2630
2 P CO2-
aquas V Q
116 - - - -57.0 to
-60.8
-11.9 to
+18.6
L - - - 0.64-0.92
(0.81)
2a P V Q 252 - - - -62.3 to
-83.5
(-153.5 to
-158.6)
V-L - - - 0.12-0.57 -
3 S L-V Q 403 130-
385
-25 to
-34
-2.2 to
-7.5
- - - - 3.7-9.5 0.65-0.97 -
Verninsk
(5)
1 P CO2-
aquas Q
197 252-
356
-25 to
-32
-2.1 to
-5.5
-57.1 to
-60.8
-13.5 to
+24.5
L 8.7-12.0 1.4-8.1 1.4-8.6 0.84-1.05 570-3150
2 P V Q 33 - - - -56.9 to
-64.7
-13.7 to
+30.8
L - - - 0.54-1.00
(0.86)
1 PS CO2-
aquas Q
4 179 -31 -3.4 -58.0 28.5 L 7.8 5.0 2.3 1.03 -
3 S L-V Q 34 136-
261
-26 to
-33
-3.1 to
-3.9
- - - - 5.0-6.2 - 0.83-0.97 -
15941595159615971598159916001601160216031604160516061607160816091610161116121613161416151616161716181619162016211622162316241625162616271628162916301631163216331634

Dogaldyn
(6)
1 P CO2-
aquas Q
37 265-
339
-30 to
-39
-1.2 to
-5.1
-56.8 to
-60.2
-7.6 to
+13.8
L 8.1-11.0 1.4-7.3 2.6-7.1 0.90-1.05 960-3230
2 P V Q 122 - - - -57.0 to
-60.4
-14.1 to
+22.1
L - - - 0.70-1.02
(0.89)
1P CO2-
aquas Sph
8 267-
283
-39 -5.1 -60.2 +11.4 to
+13.3
L 8.6 6.7 3.7 1.05 -
1 PS CO2-
aquas Q
15 128-
236
-29 to
-30
-2.5…
-5.0
- 13.6 to
21.7
L-V 7.4-8.9 3.7-7.3 1.7-2.9 0.96-1.05 -
Uryakh (5) 1 P CO2-
aquas Q
25 289-
361
-30 to
-34
-4.8…
-7.1
-57.3 to
-58.0
-8.8 to
+20.1
L 7.3-9.2 2.5-5.2 3.8-7.7 0.96-1.06 1050-3290
2 P V Q 102 - - - -57.0 to
-59.1
-14.3 to
+25.6
L - - - 0.70-1.01
(0.88)
1 PS CO2-
aquas Q
4 213 -30 -6.6 -58.1 -30.9 L 7.3 5.2 3.8 1.08 -
3 S L-V Q 8 191 -30 -5.9 - - - - 9.1 0.94 -
Irokinda
(10)
1 P CO2-
aquas Q
146 270-
384
-30 to
-52
-3.6 to
(+10.8)
-57.0 to
-62.6
-4.3 to
+29.3
L -10.0 to
+14.8
3.9-23.4 2.4-7.7 0.98-1.15 840-5030
2 P V Q 229 - - - -56.7 to
-61.0
-32.4 to
+27.5
L - - - 0.65-1.09
(0.90)
4 P L-V-S Q 19 320-
453
-40…
-55
(320-
389)
- - - - 39.8-
46.3
- 1.02-1.13
16351636163716381639164016411642164316441645164616471648164916501651165216531654165516561657165816591660166116621663166416651666166716681669167016711672167316741675

1 PS CO2-
aquas Q
3 191 -36 -5.9 - 29.0 L 6.8 8.5 1.5 1.06 -
1 P CO2-
aquas Sph
13 270 -32 -6.0 to
-6.4
-62.6 -11.0 to -
5.4
L 14.0-14.8 7.5 5.2 1.09 -
3 S L-V Q 60 179-
230
-34 to
-60
-8.0 to
-15.3
- - - - 11.7-
18.9
- 0.97-1.03 -
Note: Inclusions type: 1 – CO2-aquas, 2 – (V) vapor CO2, 2a – (V) vapor N2, 3 – L-V gas-liquid water-salt solutions, 4 – L-V-S chlorine brines; P – primary, PS – pseudosecondary, S – secondary. n* – number of inclusions. *Sph – inclusion in sphalerite. Q – quartz.The table presents the maximum and minimum values for all microthermometric parameters for each type of inclusions.
16761677167816791680168116821683168416851686168716881689169016911692169316941695169616971698169917001701170217031704170517061707170817091710171117121713171417151716

Table 2. Raman data of molecular compositions of the gas phases of quartz-hosted fluid
inclusions from gold deposits in the Baikal-Patom and Muya areas, Siberia (mol. %)
№ sample, FI Type FI CO2 N2 H2S CH4
Sukhoi Log
8-202/3 1 2 V 80.2 19.7 0.00 0.03
8-202/3 2 2 V 74.4 25.6 0.00 0.00
Verninsk
V14-17 1 1 CO2-aquas 92.9 7.1 0.00 0.01
V14-17 2 1 CO2-aquas 91.5 8.5 0.00 0.00
V14-17 3 1 CO2-aquas 91.4 8.6 0.00 0.00
V14-21 2 1 CO2-aquas 89.2 10.8 0.00 0.00
V14-21 3 1 CO2-aquas 96.3 3.7 0.00 0.00
V14-21 4 1 CO2-aquas 98.4 1.6 0.00 0.00
V14-41 1 1 CO2-aquas 77.7 22.2 0.04 0.02
P14-4 1 1 CO2-aquas 98.3 1.7 0.00 0.02
P14-4 2 1 CO2-aquas 92.0 8.0 0.00 0.04
P14-21 1 2 V 92.9 7.1 0.00 0.01
P14-41 2 2 V 91.8 8.2 0.00 0.00
P14-4 3 2 V 93.2 6.8 0.00 0.00
Dogaldyn
D14-22 1 2 V 99.0 1.0 0.00 0.00
D14-22 2 2 V 98.2 1.8 0.00 0.00
Uryakh
S-1 2 1 CO2-aquas 98.2 1.8 0.00 0.00
S-1 1 2 V 96.1 3.9 0.00 0.00
Irokinda
1 2 1 CO2-aquas 65.4 34.5 0.00 0.08
1 3 1 CO2-aquas 56.6 43.4 0.00 0.04
15-32 2 1 CO2-aquas 98.7 0.0 0.00 1.29
1 1 2 V 75.9 24.1 0.00 0.00
15-32 1 2 V 99.7 0.0 0.00 0.28
13a/12 2 V 99.4 0.6 0.00 0.01
13a/12 2 V 99.1 0.8 0.00 0.1
17171718171917201721172217231724172517261727172817291730173117321733173417351736173717381739174017411742174317441745174617471748174917501751175217531754175517561757175817591760176117621763176417651766176717681769177017711772177317741775

Table 3. Chemical composition of mineralizing fluids at gold deposits of the Baikal-Patom and
Muya areas, Siberia
Deposits Sukhoi Log Verninsk Uryakh Irokinda
Components 8/202.3 6/198.2 V10/32 V14/41 C 1 29/12 13b/12
g/kg of H2O
CO2 46.52 91.71 208.50 265.40 87.49 29.61 109.14
CH4 0.018 0.99 0.181 0.157 0.09 5.34 0.07
Cl- 0.99 1.22 1.24 1.24 17.25 78.52 43.29
HCO3- 15.15 25.39 16.47 8.56 55.19 203.92 133.22
Na 5.55 9.48 6.70 3.07 30.98 117.82 74.05
K 0.619 0.38 0.215 0.08 0.43 3.35 2.43
Ca 0.15 0.73 - 0.258 0.23 6.14 0.77
Mg 0.16 - 0.11 0.33 0.34 0.85 1.21
ppm
Br 34.6 464.3 460.4 84.8 331.8 4184.2 602.5
As 0.73 48.14 146.36 134.53 56.13 31.97 27.84
Li 11.40 57.40 16.13 26.55 0.12 0.13 0.31
B 7.47 2161.03 282.88 268.70 136.31 154.87 140.21
Rb 0.62 0.85 0.53 0.85 2.00 9.77 7.41
Cs 0.18 0.10 1.62 1.03 1.14 7.99 3.65
Sr 1.10 0.56 0.88 17.53 11.26 7516.5 119.33
Mo 5.97 16.41 0.09 - 0.07 0.15 0.09
Ag 7.14 82.99 0.12 1.86 0.14 0.03 0.02
Sb 0.07 1.42 38.88 8.85 15.05 58.73 10.01
Cu 2.44 79.41 - - 0.43 0.07 6.59
Zn 240.84 89.32 7.02 14.32 3.59 30.39 307.41
Cd 0.11 0.15 0.19 - - 0.04 3.33
Pb 2.00 0.78 - 0.22 0.59 - 19.47
Bi 0.18 0.05 0.01 - 0.03 0.02 -
Th - 0.02 - 0.02 - -
U - - - 0.03 - - -
Ga 0.21 1.01 0.06 - -
Ge 0.84 3.43 1.03 1.89 0.22 0.11 0.32
Sc 8.27 26.41 - - - - -
17761777177817791780178117821783178417851786178717881789179017911792179317941795179617971798179918001801180218031804180518061807180818091810181118121813181418151816181718181819182018211822182318241825182618271828182918301831183218331834

Ti 1.57 1.47 - - - - -
Mn - - - 36.45 0.72 10.73 38.89
Fe - - 12.20 38.09 29.64 35.40 -
Co 0.11 1.80 0.17 0.30 0.01 0.07 0.49
Ni 12.50 14.55 0.60 5.81 0.69 2.14 2.22
V - - 3.21 0.92 0.91 1.02 0.32
Cr 0.84 - 0.21 0.71 0.08 0.18 -
Y - - 0.05 - 0.004 0.034 0.027
Zr 0.22 0.15 0.03 - 0.13 0.01 -
Sn 0.29 - - 6.23 0.07 0.09 0.12
Ba 0.51 2.82 - 5.36 5.45 1640.0 280.86
W 1.68 4.16 0.73 0.37 1.00 1.26 0.13
Te - - - - - 0.09 -
Au 0.020 0.049 0.124 0.031 0.018 - 0.038
Hg 0.36 0.71 - - 0.05 0.29 0.12
Tl 0.03 0.17 0.01 0.02 0.02 0.09 0.15
REE 0.075 0.245 0.062 0.404 0.079 0.239 0.104
Ta - - - 0.016 0.004 0.013 -
Na/K 9.0 25.0 31.2 39.3 72.6 35.2 30.5
CO2 /CH4 2584 93 1152 1690 1017 6 1495
K/Rb 1000 446 402 92 203 343 328
18351836183718381839184018411842184318441845184618471848184918501851185218531854185518561857185818591860186118621863186418651866186718681869187018711872187318741875187618771878187918801881188218831884188518861887188818891890189118921893

Table 4. Calculated cation and anion balance (mole fractions) and salinity (wt. %) in solutions at
gold deposits of the Baikal-Patom and Muya areas, Siberia
Deposits Sukhoi Log Verninsk Uryakh Irokinda
Element 8/202.3 6/198.2 V10/32 V14/41 C 1 13b/12 29/12
Na+ 0.90 0.97 0.97 0.86 0.98 0.96 0.95
K+ 0.06 0.02 0.02 0.01 0.01 0.02 0.01
Ca2+ 0.01 0.01 - 0.04 0.00 0.01 0.03
Mg2+ 0.02 - 0.01 0.09 0.01 0.01 0.01
Σ cations 0.99 1.00 1.00 1.00 1.00 1.00 1.00
Cl- 0.10 0.08 0.12 0.20 0.35 0.36 0.40
HCO3- 0.90 0.92 0.88 0.80 0.65 0.64 0.60
Σ anions 1.00 1.00 1.00 1.00 1.00 1.00 1.00
Salinity,
wt, %
2.3 3.7 2.5 1.4 10.4 25.5 41.1
18941895189618971898189919001901190219031904190519061907190819091910191119121913191419151916191719181919192019211922192319241925192619271928192919301931193219331934193519361937193819391940194119421943194419451946194719481949195019511952
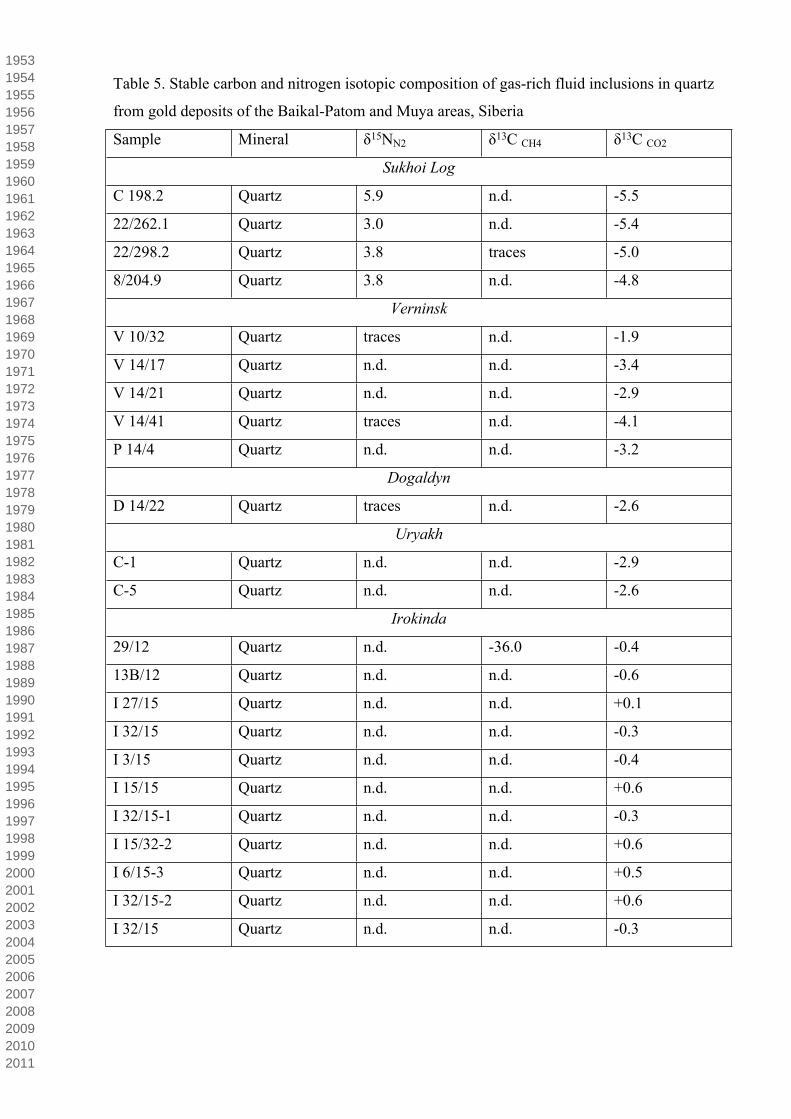
Table 5. Stable carbon and nitrogen isotopic composition of gas-rich fluid inclusions in quartz
from gold deposits of the Baikal-Patom and Muya areas, Siberia
Sample Mineral δ15NN2 δ13C CH4 δ13C CO2
Sukhoi Log
C 198.2 Quartz 5.9 n.d. -5.5
22/262.1 Quartz 3.0 n.d. -5.4
22/298.2 Quartz 3.8 traces -5.0
8/204.9 Quartz 3.8 n.d. -4.8
Verninsk
V 10/32 Quartz traces n.d. -1.9
V 14/17 Quartz n.d. n.d. -3.4
V 14/21 Quartz n.d. n.d. -2.9
V 14/41 Quartz traces n.d. -4.1
P 14/4 Quartz n.d. n.d. -3.2
Dogaldyn
D 14/22 Quartz traces n.d. -2.6
Uryakh
C-1 Quartz n.d. n.d. -2.9
C-5 Quartz n.d. n.d. -2.6
Irokinda
29/12 Quartz n.d. -36.0 -0.4
13B/12 Quartz n.d. n.d. -0.6
I 27/15 Quartz n.d. n.d. +0.1
I 32/15 Quartz n.d. n.d. -0.3
I 3/15 Quartz n.d. n.d. -0.4
I 15/15 Quartz n.d. n.d. +0.6
I 32/15-1 Quartz n.d. n.d. -0.3
I 15/32-2 Quartz n.d. n.d. +0.6
I 6/15-3 Quartz n.d. n.d. +0.5
I 32/15-2 Quartz n.d. n.d. +0.6
I 32/15 Quartz n.d. n.d. -0.3
19531954195519561957195819591960196119621963196419651966196719681969197019711972197319741975197619771978197919801981198219831984198519861987198819891990199119921993199419951996199719981999200020012002200320042005200620072008200920102011

123456789101112131415161718192021222324252627282930313233343536

12345678910111213141516171819202122232425262728293031323334353637383940414243444546474849505152535455

123456789101112131415161718192021222324252627282930313233343536
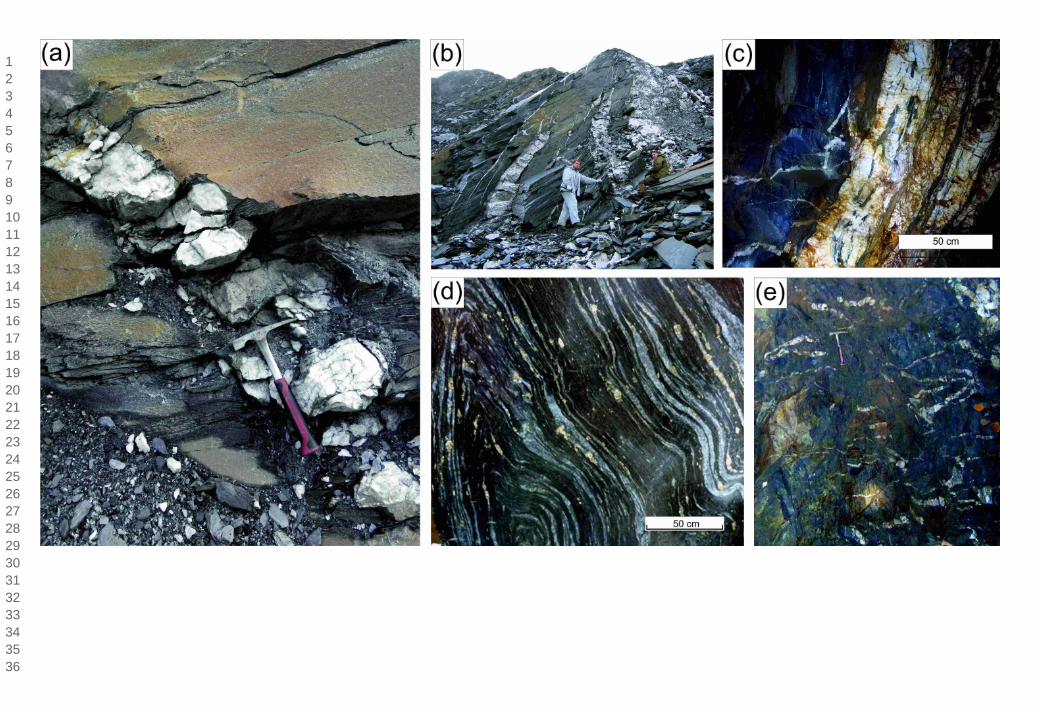
123456789101112131415161718192021222324252627282930313233343536

12345678910111213141516171819202122232425262728293031323334353637383940414243444546474849505152535455

123456789101112131415161718192021222324252627282930313233343536

123456789101112131415161718192021222324252627282930313233343536

123456789101112131415161718192021222324252627282930313233343536
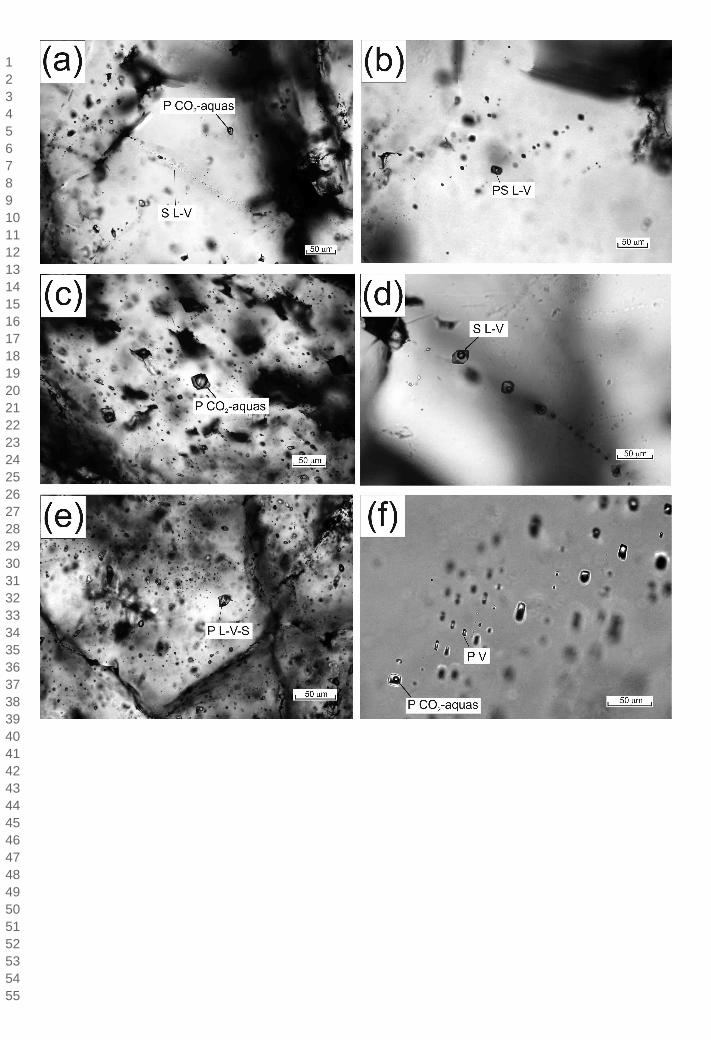
12345678910111213141516171819202122232425262728293031323334353637383940414243444546474849505152535455

123456789101112131415161718192021222324252627282930313233343536

12345678910111213141516171819202122232425262728293031323334353637383940414243444546474849505152535455

123456789101112131415161718192021222324252627282930313233343536

123456789101112131415161718192021222324252627282930313233343536

12345678910111213141516171819202122232425262728293031323334353637383940414243444546474849505152535455

123456789101112131415161718192021222324252627282930313233343536

Table 1. The parameters of the mineralizing fluids in fluid inclusions in quartz and sphalerite from the Baikal-Patom and Muya regions (Siberia)
gold deposit.
Deposits
(number of
samples)
Incl. Type,
mineral
n* Th
\ºC
Teut \ºC Tm ice
\ºC
(NaCl)
Tm CO2 \ºC Th CO2
(N2)\ºC
Hom.
mode
CO2
Tm
Clatrate
\ºC
C, Eq.
mas%
NaCl
C CO2
\mol/ kg
solu-tion
D, \g/cm3
(Middle)
Pressure,\
bar
Sukhoi
Log (23)
1 P CO2-
aquas Q
283 210-
385
-30 to
-34
-4.6 to
-7.5
-57.1 to
-82.2
-19.9 to
+10.5
L 6.2-12.4 5.0-8.1 1.8-7.6 0.82-1.09 640-2630
2 P CO2-
aquas V Q
116 - - - -57.0 to
-60.8
-11.9 to
+18.6
L - - - 0.64-0.92
(0.81)
2a P V Q 252 - - - -62.3 to
-83.5
(-153.5 to
-158.6)
V-L - - - 0.12-0.57 -
3 S L-V Q 403 130-
385
-25 to
-34
-2.2 to
-7.5
- - - - 3.7-9.5 0.65-0.97 -
Verninsk
(5)
1 P CO2-
aquas Q
197 252-
356
-25 to
-32
-2.1 to
-5.5
-57.1 to
-60.8
-13.5 to
+24.5
L 8.7-12.0 1.4-8.1 1.4-8.6 0.84-1.05 570-3150
2 P V Q 33 - - - -56.9 to
-64.7
-13.7 to
+30.8
L - - - 0.54-1.00
(0.86)
1 PS CO2-
aquas Q
4 179 -31 -3.4 -58.0 28.5 L 7.8 5.0 2.3 1.03 -
3 S L-V Q 34 136-
261
-26 to
-33
-3.1 to
-3.9
- - - - 5.0-6.2 - 0.83-0.97 -
1234567891011121314151617181920212223242526272829303132333435363738394041

Dogaldyn
(6)
1 P CO2-
aquas Q
37 265-
339
-30 to
-39
-1.2 to
-5.1
-56.8 to
-60.2
-7.6 to
+13.8
L 8.1-11.0 1.4-7.3 2.6-7.1 0.90-1.05 960-3230
2 P V Q 122 - - - -57.0 to
-60.4
-14.1 to
+22.1
L - - - 0.70-1.02
(0.89)
1P CO2-
aquas Sph
8 267-
283
-39 -5.1 -60.2 +11.4 to
+13.3
L 8.6 6.7 3.7 1.05 -
1 PS CO2-
aquas Q
15 128-
236
-29 to
-30
-2.5…
-5.0
- 13.6 to
21.7
L-V 7.4-8.9 3.7-7.3 1.7-2.9 0.96-1.05 -
Uryakh (5) 1 P CO2-
aquas Q
25 289-
361
-30 to
-34
-4.8…
-7.1
-57.3 to
-58.0
-8.8 to
+20.1
L 7.3-9.2 2.5-5.2 3.8-7.7 0.96-1.06 1050-3290
2 P V Q 102 - - - -57.0 to
-59.1
-14.3 to
+25.6
L - - - 0.70-1.01
(0.88)
1 PS CO2-
aquas Q
4 213 -30 -6.6 -58.1 -30.9 L 7.3 5.2 3.8 1.08 -
3 S L-V Q 8 191 -30 -5.9 - - - - 9.1 0.94 -
Irokinda
(10)
1 P CO2-
aquas Q
146 270-
384
-30 to
-52
-3.6 to
(+10.8)
-57.0 to
-62.6
-4.3 to
+29.3
L -10.0 to
+14.8
3.9-23.4 2.4-7.7 0.98-1.15 840-5030
2 P V Q 229 - - - -56.7 to
-61.0
-32.4 to
+27.5
L - - - 0.65-1.09
(0.90)
4 P L-V-S Q 19 320-
453
-40…
-55
(320-
389)
- - - - 39.8-
46.3
- 1.02-1.13
4243444546474849505152535455565758596061626364656667686970717273747576777879808182

1 PS CO2-
aquas Q
3 191 -36 -5.9 - 29.0 L 6.8 8.5 1.5 1.06 -
1 P CO2-
aquas Sph
13 270 -32 -6.0 to
-6.4
-62.6 -11.0 to -
5.4
L 14.0-14.8 7.5 5.2 1.09 -
3 S L-V Q 60 179-
230
-34 to
-60
-8.0 to
-15.3
- - - - 11.7-
18.9
- 0.97-1.03 -
Note: Inclusions Type: 1 – CO2-aquas, 2 – (V) vapor CO2, 2a – (V) vapor N2, 3 – L-V gas-liquid water-salt solutions, 4 – L-V-S chlorine brines; P – primary, PS – psevdo secondary, S – secondary. n* – number of inclusions. *Sph – inclusion in sphalerite. Q – quartz.The table presents the maximum and minimum values for all microthermometric parameters for each type of inclusions.
8384858687888990919293949596979899100101102103104105106107108109110111112113114115116117118119120121122123

Table 2. Raman data of molecular compositions of gas phases of fluid inclusions in quartz from
the Baikal-Patom and Muya regions (Siberia) gold deposit (mol. %)
№ sample, FI Type FI CO2 N2 H2S CH4
Sukhoi Log
8-202/3 1 2 V 80.2 19.7 0.00 0.03
8-202/3 2 2 V 74.4 25.6 0.00 0.00
Verninsk
В14-17 1 1 CO2-aquas 92.9 7.1 0.00 0.01
В14-17 2 1 CO2-aquas 91.5 8.5 0.00 0.00
В14-17 3 1 CO2-aquas 91.4 8.6 0.00 0.00
В14-21 2 1 CO2-aquas 89.2 10.8 0.00 0.00
В14-21 3 1 CO2-aquas 96.3 3.7 0.00 0.00
В14-21 4 1 CO2-aquas 98.4 1.6 0.00 0.00
В14-41 1 1 CO2-aquas 77.7 22.2 0.04 0.02
П14-4 1 1 CO2-aquas 98.3 1.7 0.00 0.02
П14-4 2 1 CO2-aquas 92.0 8.0 0.00 0.04
В14-21 1 2 V 92.9 7.1 0.00 0.01
В14-41 2 2 V 91.8 8.2 0.00 0.00
П14-4 3 2 V 93.2 6.8 0.00 0.00
Dogaldyn
Д14-22 1 2 V 99.0 1.0 0.00 0.00
Д14-22 2 2 V 98.2 1.8 0.00 0.00
Uryakh
С-1 2 1 CO2-aquas 98.2 1.8 0.00 0.00
С-1 1 2 V 96.1 3.9 0.00 0.00
Irokinda
1 2 1 CO2-aquas 65.4 34.5 0.00 0.08
1 3 1 CO2-aquas 56.6 43.4 0.00 0.04
15-32 2 1 CO2-aquas 98.7 0.0 0.00 1.29
1 1 2 V 75.9 24.1 0.00 0.00
15-32 1 2 V 99.7 0.0 0.00 0.28
13a/12 2 V 99.4 0.6 0.00 0.01
13a/12 2 V 99.1 0.8 0.00 0.1
1234567891011121314151617181920212223242526272829303132333435363738394041424344454647484950515253545556575859

Table 3. Chemical composition of mineralizing fluids of the Baikal-Patom and Muya regions
(Siberia) gold deposit
Deposits Sukhoi Log Verninsk Uryakh Irokinda
Components 8/202.3 6/198.2 V10/32 V14/41 C 1 29/12 13b/12
g/kg of H2O
CO2 46.52 91.71 208.50 265.40 87.49 29.61 109.14
CH4 0.018 0.99 0.181 0.157 0.09 5.34 0.07
Cl- 0.99 1.22 1.24 1.24 17.25 78.52 43.29
HCO3- 15.15 25.39 16.47 8.56 55.19 203.92 133.22
Na 5.55 9.48 6.70 3.07 30.98 117.82 74.05
K 0.619 0.38 0.215 0.08 0.43 3.35 2.43
Ca 0.15 0.73 - 0.258 0.23 6.14 0.77
Mg 0.16 - 0.11 0.33 0.34 0.85 1.21
ppm
Br 34.6 464.3 460.4 84.8 331.8 4184.2 602.5
As 0.73 48.14 146.36 134.53 56.13 31.97 27.84
Li 11.40 57.40 16.13 26.55 0.12 0.13 0.31
B 7.47 2161.03 282.88 268.70 136.31 154.87 140.21
Rb 0.62 0.85 0.53 0.85 2.00 9.77 7.41
Cs 0.18 0.10 1.62 1.03 1.14 7.99 3.65
Sr 1.10 0.56 0.88 17.53 11.26 7516.5 119.33
Mo 5.97 16.41 0.09 - 0.07 0.15 0.09
Ag 7.14 82.99 0.12 1.86 0.14 0.03 0.02
Sb 0.07 1.42 38.88 8.85 15.05 58.73 10.01
Cu 2.44 79.41 - - 0.43 0.07 6.59
Zn 240.84 89.32 7.02 14.32 3.59 30.39 307.41
Cd 0.11 0.15 0.19 - - 0.04 3.33
Pb 2.00 0.78 - 0.22 0.59 - 19.47
Bi 0.18 0.05 0.01 - 0.03 0.02 -
Th - 0.02 - 0.02 - -
U - - - 0.03 - - -
Ga 0.21 1.01 0.06 - -
Ge 0.84 3.43 1.03 1.89 0.22 0.11 0.32
Sc 8.27 26.41 - - - - -
1234567891011121314151617181920212223242526272829303132333435363738394041424344454647484950515253545556575859

Ti 1.57 1.47 - - - - -
Mn - - - 36.45 0.72 10.73 38.89
Fe - - 12.20 38.09 29.64 35.40 -
Co 0.11 1.80 0.17 0.30 0.01 0.07 0.49
Ni 12.50 14.55 0.60 5.81 0.69 2.14 2.22
V - - 3.21 0.92 0.91 1.02 0.32
Cr 0.84 - 0.21 0.71 0.08 0.18 -
Y - - 0.05 - 0.004 0.034 0.027
Zr 0.22 0.15 0.03 - 0.13 0.01 -
Sn 0.29 - - 6.23 0.07 0.09 0.12
Ba 0.51 2.82 - 5.36 5.45 1640.0 280.86
W 1.68 4.16 0.73 0.37 1.00 1.26 0.13
Te - - - - - 0.09 -
Au 0.020 0.049 0.124 0.031 0.018 - 0.038
Hg 0.36 0.71 - - 0.05 0.29 0.12
Tl 0.03 0.17 0.01 0.02 0.02 0.09 0.15
REE 0.075 0.245 0.062 0.404 0.079 0.239 0.104
Ta - - - 0.016 0.004 0.013 -
Na/K 9.0 25.0 31.2 39.3 72.6 35.2 30.5
CO2 /CH4 2584 93 1152 1690 1017 6 1495
K/Rb 1000 446 402 92 203 343 328
60616263646566676869707172737475767778798081828384858687888990919293949596979899100101102103104105106107108109110111112113114115116117118

Table 4. Calculation of cations and anions balance (mole fraction) and salinity (wt. %) of
solution of the Baikal-Patom and Muya regions (Siberia) gold deposit
Deposits Sukhoi Log Verninsk Uryakh Irokinda
Element 8/202.3 6/198.2 V10/32 V14/41 C 1 13b/12 29/12
Na+ 0.90 0.97 0.97 0.86 0.98 0.96 0.95
K+ 0.06 0.02 0.02 0.01 0.01 0.02 0.01
Ca2+ 0.01 0.01 - 0.04 0.00 0.01 0.03
Mg2+ 0.02 - 0.01 0.09 0.01 0.01 0.01
Σ cations 0.99 1.00 1.00 1.00 1.00 1.00 1.00
Cl- 0.10 0.08 0.12 0.20 0.35 0.36 0.40
HCO3- 0.90 0.92 0.88 0.80 0.65 0.64 0.60
Σ anions 1.00 1.00 1.00 1.00 1.00 1.00 1.00
Salinity,
wt, %
2.3 3.7 2.5 1.4 10.4 25.5 41.1
1234567891011121314151617181920212223242526272829303132333435363738394041424344454647484950515253545556575859

Table 5. Stable carbon and nitrogen isotopic composition of gas-rich fluid inclusions in quartz of
the Baikal-Patom and Muya regions (Siberia) gold deposit
Sample Mineral δ15NN2 δ13C CH4 δ13C CO2
Sukhoi Log
C 198.2 Quartz 5.9 n.d. -5.5
22/262.1 Quartz 3.0 n.d. -5.4
22/298.2 Quartz 3.8 traces -5.0
8/204.9 Quartz 3.8 n.d. -4.8
Verninsk
V 10/32 Quartz traces n.d. -1.9
V 14/17 Quartz n.d. n.d. -3.4
V 14/21 Quartz n.d. n.d. -2.9
V 14/41 Quartz traces n.d. -4.1
P 14/4 Quartz n.d. n.d. -3.2
Dogaldyn
D 14/22 Quartz traces n.d. -2.6
Uryakh
C-1 Quartz n.d. n.d. -2.9
C-5 Quartz n.d. n.d. -2.6
Irokinda
29/12 Quartz n.d. -36.0 -0.4
13B/12 Quartz n.d. n.d. -0.6
I 27/15 Quartz n.d. n.d. +0.1
I 32/15 Quartz n.d. n.d. -0.3
I 3/15 Quartz n.d. n.d. -0.4
I 15/15 Quartz n.d. n.d. +0.6
I 32/15-1 Quartz n.d. n.d. -0.3
I 15/32-2 Quartz n.d. n.d. +0.6
I 6/15-3 Quartz n.d. n.d. +0.5
I 32/15-2 Quartz n.d. n.d. +0.6
I 32/15 Quartz n.d. n.d. -0.3
1234567891011121314151617181920212223242526272829303132333435363738394041424344454647484950515253545556575859