projecte upc tesina individual - connecting repositoriesii!! dedication)...
TRANSCRIPT

MASTER THESIS TEMPLATE Dept. of Industrial Ecology
Gonçal Marion Moron
Melih Öncel

Providing Sustainable Life-‐Services with a Hybrid
Micro-‐Power Plant in Developing Countries: an
Assessment of Potential Applications

I
Summary/Abstract
The life-‐services notion covers meeting the need of education, health, nutrition, housing, water supply and sanitation. Reducing poverty and allowing all the individuals reach the basic needs have always been related with reformulating the politics and reconstructing production and income patterns. Knowing that the traditional developing way is threatening earth’s life and human future generations; the sustainable approach comes up as one of the key points in order to achieve a long term economical and social development and reduce the impacts of the human activities on the planet. The rural electrification issue is on the agenda of the Millennium Development Goals and is key a point in terms of providing life-‐services and making the development available. The decentralized power generation via renewable energy is a promising way for development. The off-‐grid electrification approach aims to settle in the nearest demand point, focusing mainly on satisfying the energy demand. This project brings two points together; preventing the absence of basic needs of the locals and achieving it by using an off-‐grid renewable energy power plant. The research consists on defining the current situation where the case study is being occurred, assessing the different potential solutions in order to cover the social needs’ gap, and investigating their technical characteristics. Thus, the results are focused on the intersection of these three segments, which create a detailed model of the micro-‐power plant and its features. The main focus is to identify which application provides each life-‐service and to analyze the effectiveness. This project work has been performed with the company Pamoja AB which was aiming to enter the energy market in developing countries, and under the supervision of a the Division of Energy and Climate Studies (ECS), at Royal Institute of Technology (KTH). The largest implication of the findings is to modify the Pamoja’s technology and business view according to satisfy the community’s needs. Key words: Sustainability; Renewable energy; Decentralized energy supply; providing life-‐services; Small-‐scale gasification power plant

II
Dedication
This thesis work is an outcome of an epic journey which has changed my life and my perspective. First of all, I would like to thank to my beloved family for their endless support, and to Gonçal Marion who has been always with me and made every single moment much easier and meaningful during this journey and my life in general. Finally, I would like to dedicate this work to my dearest friend who will never hear about my journey.
Melih

III
Table of Contents
Summary/Abstract ............................................................................................................... I Dedication ........................................................................................................................... II Table of Contents ............................................................................................................... III List of Figures ..................................................................................................................... V List of Tables ..................................................................................................................... VI 1. Introduction .................................................................................................................... 1 2. The Green Plant Concept ................................................................................................ 4
2.1 Background of Uganda, Context and the Energy Problem .................................... 4 2.2 The Green Plant Concept, System Boundaries and Stakeholders ......................... 5 2.3 The Green Plant and the Potential Applications ................................................... 9
2.3.1 Biochar Application .................................................................................. 11 2.3.2 Electricity Supply ...................................................................................... 13 2.3.3 Waste Heat Recovery ............................................................................... 16
3. Methodology ................................................................................................................. 21 3.1 Selection of Possible Solutions – Multi-‐Criteria Decision Analysis ...................... 26 3.2 Potential Impact Identification of the Selected Solutions ................................... 30 3.3 Final View of the System ..................................................................................... 31
3.3.1 Budget ...................................................................................................... 31 3.3.2 Final Layout of the System ....................................................................... 31
4. Field Trip ....................................................................................................................... 32 4.1 Site Visit Preparation ........................................................................................... 32 4.2 Survey of Visited Sites ......................................................................................... 33 4.3 Pilot Area ............................................................................................................. 43 4.4 Applications and Life-‐Services ............................................................................. 45
5. Results ........................................................................................................................... 48 5.1 Selection of Possible Solutions – MCDA .............................................................. 49 5.2 Potential Impact Identification of the Selected Solutions ................................... 52
5.2.1 General View of the Application .............................................................. 52 5.2.2 Business Model ........................................................................................ 68 5.2.3 Potential Impact Identification of the Selected Solutions ........................ 82 5.2.4 SWOT analysis ........................................................................................ 108
5.3 Final View of the Product .................................................................................. 115 5.3.1 Budget ................................................................................................ 115 5.3.2 Final Layout of the System ................................................................. 115
6. Conclusion and Discussion .......................................................................................... 133 References ...................................................................................................................... 136 Appendices ...................................................................................................................... 146
Appendix I The Absorption Chiller Working Process ............................................... 146 Appendix II The ORC Turbine Working Process ....................................................... 148 Appendix III Field Trip – Identification of Potential Sites ........................................ 149

IV
Appendix IV Weighted Product Model Example ..................................................... 150 Appendix V Brochures, Catalogues and Relevant Data related to the Possible Applications Assessed in the MCDA ........................................................................ 152 Appendix VI VI-‐Skogen Questionnaire – Site Visit ................................................... 155 Appendix VII Data Summary for the MCDA Chart ................................................... 158 Appendix VIII Mini-‐Grid Design, Technical Data and Calculations. ......................... 166 Appendix IX Sizing the Heat Pipe Exchanger ........................................................... 180

V
List of Figures
FIGURE 1. CONCEPTUAL RESEARCH FRAMEWORK ................................................................................................ 3 FIGURE 2. SYSTEM BOUNDARIES AND STAKEHOLDERS OVERVIEW ........................................................................... 9 FIGURE 3. ENERGY DEVELOPMENT, FROM RAW MATERIAL TO LIFE-‐SERVICES ......................................................... 10 FIGURE 4. CONCEPTUAL LAYOUT OF THE MINI-‐GRID SYSTEM .............................................................................. 15 FIGURE 5. HEAT PIPE EXCHANGER, WORKING DIAGRAM (ABD EL-‐BAKY & MOHAMED, 2007) ................................. 18 FIGURE 6. HEAT RECUPERATOR, WORKING DIAGRAM (RESOURCESMARTBUSINESS, 2006) ...................................... 18 FIGURE 11. CONCEPTUAL FLOW AND USE OF DATA ........................................................................................... 33 FIGURE 15. INITIAL MCDA CHART ................................................................................................................. 49 FIGURE 16. MCDA CHART WITH VALUES ........................................................................................................ 50 FIGURE 17. AGRICULTURAL PEAK LOAD COINCIDENCE IN HARVESTING SEASON ...................................................... 57 FIGURE 18. CONCEPTUAL LAYOUT OF THE MINI-‐GRID AND THE BATTERY CHARGING SYSTEM .................................... 58 FIGURE 19. SEKANYONYI SNAPSHOT. MINI-‐GRID DISTRIBUTION IN THE VILLAGE ..................................................... 60 FIGURE 20. CONCEPTUAL SCHEMA OF THE LINE DISTRIBUTION ............................................................................ 63 FIGURE 21. FINAL CONCEPTUAL DIAGRAM OF THE MINI-‐GRID, LINES AND LOADS ................................................... 64 FIGURE 22. CONCEPTUAL DIAGRAM OF THE BCS .............................................................................................. 66 FIGURE 23. CONCEPTUAL DIAGRAM OF THE HEAT PIPE EXCHANGER DEVICE FUNCTIONING ....................................... 68 FIGURE 25. CONCEPTUAL BUSINESS MODEL DIAGRAM FOR THE MINI-‐GRID ........................................................... 75 FIGURE 26. CONCEPTUAL DIAGRAM OF THE FUNCTIONING AND LINKAGE FOR THE BCS APPLICATION .......................... 79 FIGURE 28. POTENTIAL ECONOMICAL IMPACT IDENTIFICATION PROCEDURE ........................................................... 85 FIGURE 29. COFFEE ANNUAL REVENUES, CURRENT AND ESTIMATED AFTER PROCESSING THE HUSK ............................ 95 FIGURE 30. LOAD FACTOR FOR THE HOUSEHOLD LEVEL ...................................................................................... 98 FIGURE 31. WILL OF PAY FOR THE HOUSEHOLD LEVEL ..................................................................................... 100 FIGURE 32. SWOT MATRIX (MARKOVSKA, ET AL., 2009, P.755) ..................................................................... 109 FIGURE 33. BUDGET OF THE SELECTED APPLICATIONS ...................................................................................... 115 FIGURE 34. FINAL LAYOUT OF THE SYSTEM PROCEDURE ................................................................................... 116 FIGURE 35. COINCIDENT PEAK LOAD FOR THE PRODUCTIVE USES DURING THE HARVESTING SEASON ........................ 117 FIGURE 36. COINCIDENT PEAK LOAD FOR COMMUNITY SERVICE AND HOUSEHOLDS ............................................... 121 FIGURE 37. LOAD DISTRIBUTION OF THE COMMUNITY SERVICE, HOUSEHOLDS AND BATTERY CHARGING STATIONS ..... 122 FIGURE 38. LOAD DISTRIBUTION, DRYING, BATTERY CHARGING, COMMUNITY AND HOUSEHOLD ............................. 122 FIGURE 39. LOAD DISTRIBUTION OF THE MILLING, COMMUNITY SERVICE, HOUSEHOLDS AND BATTERY CHARGING STATIONS
................................................................................................................................................... 123 FIGURE 40. WILL OF PAY FOR THE HOUSEHOLD .............................................................................................. 126 FIGURE 41. INCREASE OF THE WILL OF PAY .................................................................................................... 126

VI
List of Tables
TABLE 1. SOCIO-‐ECONOMIC BENEFITS OF RURAL ELECTRIFICATION IN PHILIPPINES (THE WORLD BANK, 2008) ............. 14 TABLE 2. APPLIANCES OF THE BCS IN VIETNAM (DUNG, ET AL., 2003) ................................................................. 16 TABLE 3. REQUIREMENTS FOR THE SITE VISITS .................................................................................................. 24 TABLE 4. VALUE/MEASURE OF THE CRITERIA ................................................................................................... 29 TABLE 5. GENERAL INFORMATION OF THE PILOT AREA ....................................................................................... 43 TABLE 6. AGRICULTURAL PRODUCTION IN THE PILOT AREA ................................................................................. 43 TABLE 7. HOUSEHOLD ENERGY USE ................................................................................................................ 43 TABLE 8. CURRENT ENERGY CONSUMPTION ..................................................................................................... 44 TABLE 9. MACHINERY POWER AND ENERGY CONSUMPTION ................................................................................ 44 TABLE 10. POTENTIAL APPLICATIONS, LIFE-‐SERVICES AND BENEFITS FOR THE COMMUNITY LEVEL ............................... 46 TABLE 11. POTENTIAL APPLICATIONS, LIFE-‐SERVICES AND BENEFITS FOR THE PRODUCTIVE USE LEVEL ......................... 47 TABLE 12. VALUATION AND RANKING FOR MCDA ............................................................................................ 51 TABLE 13. SELECTED POTENTIAL APPLICATIONS ................................................................................................ 51 TABLE 14. POTENTIAL LIFE-‐SERVICES AND BENEFITS PROVIDED BY THE MINI-‐GRID FOR THE COMMUNITY & HOUSEHOLD
LEVEL .............................................................................................................................................. 53 TABLE 15. POTENTIAL LIFE-‐SERVICES AND BENEFITS PROVIDED BY THE MINI-‐GRID FOR THE PRODUCTIVE USE LEVEL ...... 54 TABLE 16. ESTIMATED ELECTRICITY CONSUMPTION AT HOUSEHOLD LEVEL ............................................................. 55 TABLE 17. ESTIMATED ELECTRICITY CONSUMPTION AT COMMUNITY SERVICE LEVEL ................................................ 55 TABLE 18. ESTIMATED ELECTRICITY CONSUMPTION AT AGRICULTURAL LEVEL ......................................................... 56 TABLE 19. SUMMARY OF THE DEMAND ASSESSMENT ........................................................................................ 59 TABLE 20. DISTRIBUTION OF HOUSEHOLDS PER CLUSTER .................................................................................... 61 TABLE 21. DISTRIBUTION OF MINI-‐GRID LINES AND COINCIDENT LOAD PER LINE .................................................... 62 TABLE 22. MAXIMUM COINCIDENT LOAD PER CLUSTER ...................................................................................... 62 TABLE 23. MAXIMUM COINCIDENT LOAD PER ACTIVITY ..................................................................................... 63 TABLE 24. BSC POTENTIAL LIFE-‐SERVICES AND BENEFITS FOR THE COMMUNITY AND HOUSEHOLD LEVEL .................... 65 TABLE 25. BSC POTENTIAL LIFE-‐SERVICES AND BENEFITS FOR THE PRODUCTIVE USE LEVEL ....................................... 65 TABLE 26. MAIN CHARACTERISTICS OF THE HEAT PIPE EXCHANGER DEVICE ........................................................... 67 TABLE 27. VALUE PROPOSITION FOR THE SELECTED CUSTOMER SEGMENTS ............................................................ 71 TABLE 28. BUSINESS CHANNELS FOR THE MINI-‐GRID ......................................................................................... 72 TABLE 29. DIFFERENT CUSTOMER RELATIONSHIPS POSSIBLE WITHIN THE MINI-‐GRID APPLICATION ............................. 73 TABLE 30. REVENUE STREAM OPTIONS ........................................................................................................... 74 TABLE 31. PRICING STRATEGY DESCRIPTION .................................................................................................... 74 TABLE 32. RELATION OF THE REVENUE STREAM WITH THE PRICING STRATEGY ........................................................ 74 TABLE 33. CUSTOMER RELATIONSHIPS AND PRICING STRATEGY LINKAGE ............................................................... 75 TABLE 34. RELATION BETWEEN CUSTOMER AND THEIR NEEDS AS VALUE PROPOSITIONS .......................................... 76 TABLE 35. CHANNELS FOR THE BCS BUSINESS MODEL ....................................................................................... 77 TABLE 36. CUSTOMER RELATIONSHIPS FOR THE BCS ......................................................................................... 77 TABLE 37. DIFFERENT REVENUE STREAMS FOR THE BCS SYSTEM .......................................................................... 78 TABLE 38. PRICING STRATEGY DEFINITION FOR THE BCS .................................................................................... 78 TABLE 39. RELATION BETWEEN THE PRICES AND THE REVENUE STREAMS FOR THE BCS ............................................ 79 TABLE 40. REVENUE STREAMS AVAILABLE FOR EACH CUSTOMER RELATIONSHIP ...................................................... 79 TABLE 41. VALUE PROPOSITIONS FOR THE HEAT PIPE EXCHANGER ....................................................................... 80

VII
TABLE 42. CHANNEL DESCRIPTION FOR THE HEAT PIPE EXCHANGER ..................................................................... 80 TABLE 43. CUSTOMER RELATIONSHIP FOR THE HEAT PIPE EXCHANGER ................................................................. 81 TABLE 44. REVENUE STREAMS FOR THE HEAT PIPE EXCHANGER ........................................................................... 81 TABLE 45. PRICING STRATEGY DEFINITION FOR THE HEAT PIPE EXCHANGER ........................................................... 81 TABLE 46. RELATION OF THE PRICING STRATEGIES WITH THE REVENUES AND CUSTOMERS ........................................ 82 TABLE 47. ENVIRONMENTAL ASPECTS INCLUDED IN THE ANALYSIS (KAKURU, ET AL., 2001) ...................................... 84 TABLE 48. ENERGY ISSUES RELATED TO THE CURRENT COMMUNITY SITUATION ...................................................... 86 TABLE 49. SOCIAL ENERGY CONCERNS ............................................................................................................ 86 TABLE 50. ENERGY USE IN THE HOUSEHOLD LEVEL ............................................................................................ 87 TABLE 51. ENERGY CURRENT SITUATION, USE OF ENERGY AT ALL LEVELS .............................................................. 87 TABLE 52. CURRENT COOPERATIVE PRODUCTIVITY ............................................................................................ 87 TABLE 53. MACHINERY POWER AND ENERGY USE ............................................................................................ 88 TABLE 54. REDUCTION OF CO2 EMISSIONS ..................................................................................................... 92 TABLE 55. UGANDA GENERAL ECONOMIC FACTS (UNDATA, 2011; UNICEF, 2011) ............................................. 93 TABLE 56. COFFEE PRICE DEPENDING ON PROCESSMENT LEVEL ........................................................................... 95 TABLE 57. ANNUAL COST DIFFERENCE BETWEEN THE USE OF DIESEL OR THE MINI-‐GRID SERVICE .............................. 96 TABLE 58. ESTIMATED CONSUMPTION AT HOUSEHOLD LEVEL FOR 24 HOURS, NORMAL DAY ..................................... 98 TABLE 59. COST OF LIGHTING FOR THE HOUSEHOLD LEVEL ................................................................................. 99 TABLE 60. SWOT ANALYSIS FOR THE MINI-‐GRID ........................................................................................... 110 TABLE 61. IMPROVED SWOT FOR THE MINI-‐GRID .......................................................................................... 111 TABLE 62. SWOT MATRIX FOR THE BCS ...................................................................................................... 112 TABLE 63. IMPROVED SWOT MATRIX FOR THE BCS APPLICATION ..................................................................... 113 TABLE 64. SWOT INITIAL MATRIX FOR THE HEAT PIPE EXCHANGER ................................................................... 114 TABLE 65. IMPROVED SWOT MATRIX FOR THE HEAT PIPE EXCHANGER .............................................................. 114 TABLE 66. PEAK LOAD FOR THE PRODUCTIVE USE ACTIVITIES ............................................................................ 117 TABLE 67. CUSTOMER RELATIONSHIPS FOR THE PRODUCTIVE USE ACTIVITIES ....................................................... 118 TABLE 68. COMMUNITY SERVICES, CUSTOMER CHARACTERISTICS ....................................................................... 118 TABLE 69. CONSUMPTION OF THE COMMUNITY SERVICES ................................................................................ 118 TABLE 70. COMMUNITY SERVICE, CUSTOMER SEGMENTS AND THEIR CHARACTERISTICS ......................................... 119 TABLE 71. USE OF ENERGY IN THE HOUSEHOLD LEVEL ...................................................................................... 120 TABLE 72. HOUSEHOLD LEVEL, CUSTOMER CHARACTERISTICS ............................................................................ 120 TABLE 73. SUPPORT BATTERY CHARGING CHARACTERISTICS .............................................................................. 121 TABLE 74. MILLING AND BATTARY SUPPLY PERFOMANCE, WORKING HOURS UNDER PEAK LOAD............................. 123 TABLE 75. CONSUMPTION OF ENERGY UNDER THE WORKING CONDITION RESTRICTED BY THE ENERGY SUPPLY .......... 124 TABLE 76. ENERGY COST, DIESEL COMPARED TO ELECTRICITY ........................................................................... 124 TABLE 77. ELECTRICITY SUPPLY FOR PRODUCTIVE USES, PRICING ....................................................................... 125 TABLE 78. COMPARISON BETWEEN KEROSENE AND THE MINI-‐GRID ................................................................... 125 TABLE 79. HOUSEHOLD SUBSCRIPTION FEE .................................................................................................... 127 TABLE 80. DRYING SERVICE RENTING CONDITIONS .......................................................................................... 127 TABLE 81. SUBSCRIPTION FEE AND CONTRACT CONDITIONS FOR THE DRYING SERVICE ........................................... 127 TABLE 82. TRADE CENTER, BATTERY CHARGING STATION CONTRACT CONDITIONS ................................................ 128 TABLE 83. TRADE CENTER BATTERY CHARGING STATION PRICING ...................................................................... 128 TABLE 84. PAYBACK TIME FOR THE BATTERY CHARGING SYSTEM ....................................................................... 128 TABLE 85. TOTAL COST FOR ONE BATTERY PER DAY ........................................................................................ 129

VIII
TABLE 86. BALANCE OF COST-‐BENEFIT FOR THE BATTERY CHARGING STATION IN THE TRADE CENTRE ....................... 129 TABLE 87. TARIFFS FOR THE TRADE CENTRE ................................................................................................... 129 TABLE 88. FINAL BALANCE FOR THE SYSTEM .................................................................................................. 130 TABLE 89. GLOBAL BALANCE FOR THE SYSTEM ............................................................................................... 131

IX

1
1. Introduction
The origin and result of this work is based in the researcher’s believe that the development of science and technology appliance is threatening earth’s life and human future generations. Especially in developing countries, technology is not taking in account people’s needs and many times the aim is just to look for economical benefit no matter what. This fact was the main one that pushed the author of the thesis to research and look for ways to improve, add some work and value into the efforts that are already are being made and, trying to collaborate in the reduction of the North-‐South division that nowadays exists. To do so, a brief introduction into the relevant facts related to the project is done below, including the objectives and the research questions that lead the project development. To start, an introduction into the world’s energy situation is done as the project is based on its use and profit. Nowadays, the energy supply is a significant problem all over the world (UN-‐Energy, 2010). The most relevant parts of this issue could be listed as “satisfying the increasing demand, the greater environmental concerns, GHGs emissions or the resource allocation and depletion”. This growing situation could be more clearly appreciated amongst developing countries (UN-‐Energy, 2010). In that manner, sustainable development is one of the key points in order to reduce the impacts of the human activities on the planet and a solution to achieve a long term economical and social development (United Nations Conference on Environment & Development, 1992). The focus of the initiative that Pamoja Cleantech AB is fostering, is in Uganda. It is a country located in East Africa, which lies on the Nile basin. The lakes Victoria and Kyoga dominate the water resources of the Nile. Nowadays, the estimated population of Uganda is about 34.6 million inhabitants (Central Intelligence Agency, 2011). Amongst the other East African countries Uganda is also dealing with the electrification problem -‐especially in rural areas-‐, the major part of the population lacks of electricity; as a result, the population is private of basic life-‐services1. Only 9% of all Ugandan households have access to electricity (International Energy Agency, 2011). Of course, the main reason is the lack of energy generation, although on the other hand there is that the big part of population lives in rural sites. The 87% of Ugandan households are located in rural areas (The World Bank, 2011). This situation makes even more difficult the achievement of global electrification by a national and large-‐scale grid system. In the rural sites, the main energy resource is the firewood and just a limited part of the rural inhabitants is able to use coal and diesel fuel (depending on the family’s income). The dominant energy source consumption (firewood) is estimated to be up to 91% of the whole energy consumption patterns. On the other hand, the other sources are residues (including household and biomass waste) (3.1 %), diesel (2.8%) and grid electricity (1.1 %) (UMEMD,
1 Life-‐services as water-‐pumping, heating systems, or other energy uses which improve life conditions.

2
2009). At this point the research has to be defined. In order to do so, the researcher needs to formulate the research question that will describe and delimit the objective.
How can the community life-‐services be covered in rural areas, by using the energy surplus from a decentralized small-‐scale biomass gasification power plant?
This project is of great importance in terms of satisfying the needs of the communities in developing countries and doing it by using local resources and generating the energy at local level; these solutions are as well the most effective ways to satisfy the society’s energy demand and at the same time protect the environment. So, the ultimate objective of this thesis work is to suggest a specific solution to cover the basic life-‐services of the population and at the same time, observing profitability parameters for the Green Plant project (GP). The life-‐services are defined as the basic human needs including lightning, electricity for basic tasks for domestic and productive purposes; besides, additional applications such as water-‐pumping, heating systems, or other energy uses, which improve life conditions. The provided life-‐service solutions are meant to cover all three aspects of the sustainability; economy, environmental and social impacts. The GP is a biomass gasification system with an expected energy output of 10 kW. The system will use the local biomass resources to provide energy for the rural inhabitants. In that direction, the corresponding analysis should be performed in order to identify the potential uses for the electricity and the by-‐products being generated by the GP. In order to find an answer for the main research question, a number of sub-‐questions have arise according to the sustainability aspects, which are stated below:
1. Economical Aspect; • How to reach a cost-‐effective system, • How to adapt the business approach to the community’s life-‐style in
order to be well accepted, 2. Social Aspect:
• How to foster the development of the area by having a positive socio-‐economic impact on society,
3. Environmental Aspect: • How to create an environmental friendly solution • How to achieve the maximum efficiency in terms of reusing waste,
cradle-‐to-‐cradle approach

3
The solution proposed might be a system, a process or a service, which takes advantage of the electrical energy surplus or of any other kind of residual energy waste that may be generated in the GP. To be successful, the proposed solution needs to be economically feasible; it must mean a benefit to local people and also imply a significant contribution in terms of environmental care. That is why the thesis output can be referred as a solution that covers the three main principles of sustainable development: economy, society and environment. Therefore, in order to carry out successfully this research, the structure of the thesis work is based on a series of steps that gradually should lead the authors to find the most suitable answer to the research question stated previously. This framework has 5 well-‐defined stages that can be seen in the Figure 1.
Figure 1. Conceptual Research Framework
Consequently, the final output must be the outcome of all the analysis done, filtering the conclusions in each of the mentioned parts, until the final result. Then, as the first view of the overall project concept is done, in the next chapter the background of the GP, the stakeholders, the boundaries of the system and its potential will be described and assessed, so a deeper understanding of the different possibilities can be achieved.
Research question
formulation
1
Literature Review
2
Field Trip
3
Analysis and interpreting of data
4
Results
5

4
2. The Green Plant Concept
In this chapter, first of all, the current energy situation of Uganda is explained in more detail. Understanding what the problems are and what has been applied, successfully or not, as solutions, can help the researcher to have a deeper view of the basic issues related to rural electrification. Right after, it is important to define the GP concept, the most relevant factors involving the boundaries of the project and the stakeholders that have contributed to enrich the work. Afterwards, an analysis over the potential solutions, applicable under the conditions described previously, will be defined. And so, at the end of the chapter, it should be comprehensible in terms of the conceptual work, involved actors and preliminary options that will be studied further on.
2.1 Background of Uganda, Context and the Energy Problem The main electricity supply in the country is based on a large-‐scale hydropower generation. According to the annual report of the Ministry of Energy and Mineral Development, the total grid electricity supply was 2050 GWh, in 2008 (UMEMD, 2009). The major part of the energy plants operate at Lake Victoria and through the Nile flow, thus are located right outside of Jinja (Busoga sub-‐region), which is the second commercial hub in the country and located in the south-‐eastern of Uganda. However, the electricity generation capacity has already been reduced by the decrease of the water level in the Lake Victoria. This fact contributed to a significant increase, from part of the industry, of diesel engines as backup to avoid troubles in case of an electricity shortage (Buchholz & Da Silva, 2010). According to the data on the 2008 annual report of the Ministry of Energy and Mineral Development, the electricity grid consumption was up to 66.426 Kgoe (kilograms of oil equivalent), on the other hand, the amount of diesel fuel reached 96,884 Kgoe (UMEMD, 2009). Nevertheless, the hydropower generation is still the biggest growing electricity supply in the energy sector; one of the biggest on going projects in the country is the Bujagali Hydro-‐Power Plant, which will have an output of 250 MW (UMEMD, 2009). This project is currently on going, and it has not been possible to find reliable data about the estimated finish of the construction work. In the majority of the developing countries, with Uganda amongst them, the lack of electricity is more evident in rural sites. The most common way to access the electricity is to use a diesel generator; this practice only works for private users or companies who have enough resources to purchase the equipment and the fuel. On the other hand, the vast majority of rural population has just the chance to get the electricity by connecting one of the two main isolated networks, set up as a national solution (Buchholz & Da Silva, 2010). It is important to bear in mind that these networks are small and will not reach most of the rural areas in many years (Rural Electrification Agency, 2006). This fact is highly relevant as the thesis project is focused on off-‐grid rural electrification solutions,

5
and is aimed to find the best options to electrify local communities. The off-‐grid solution is referred to a grid-‐isolated small-‐scale energy generation plant. Facing up the rural electrification issue, the use of the off-‐grid approach is well accepted way in order to cope with this crucial issue (The World Blank, 2008). In that direction, the ultimate problem about the electricity supply is that the electrification level in Uganda is way below the demand. Rural electrification is of great importance and, at the same time, a very difficult task. Especially, it is considerably difficult and complicated when the aim is to achieve a sustainable system that covers environmental, social and economical aspects. In the industrialized countries large-‐scaled centralized energy plants generate electricity. On the contrary, in the rural electrification case, it is not feasible and efficient to set up such systems. A centralized energy generation plant and a large electricity grid might not be suitable for rural areas, besides the fact that they are not always needed. In fact, it is highly costly and ineffective to choose the large-‐scale generation approach for places where the demand and consumption are low. The conflict on the large-‐scale production comes from the high investment costs that trigger the rise on the electricity tariff for the end user. Furthermore, a low energy demand due to a scant will of pay creates an economical problem for the suppliers (Zerriffi, 2011). Taking into account this situation, off-‐grid electrification solutions appear as a promising option. The development of the energy situation in Uganda should motivate the improvement of life conditions over rural areas in the country. This fact, together with a more efficient use of the energy, is not just a key point for the preservation of the environmental conditions but also for the positive economical development. First of all, bearing in mind that development means fighting against the poverty; poverty is an obstacle to fulfil the basic human needs, such as, food, clothing, shelter, health, education and sanitation services (UNDP, 2004). In addition, as the national energetic dependence decreases, in terms of fossil fuel importation, so does the economic threaten subjected to its pricing. In the following subsection, a closer approach to the limitations of the project and the groups that tightly collaborate with the GP development is taken. This description is done in more detail so the constraints of the research are understood, as well as the level of guidance and support received, especially during the field trip in Uganda, from the Pamoja Cleantech AB partners.
2.2 The Green Plant Concept, System Boundaries and Stakeholders First, is very important to introduce and define the whole concept concerning the GP, what is it and how it works. Thus, the boundaries related to this thesis work are easier to comprehend linking them with the GP development. At the end of this part, the stakeholders collaborating with Pamoja Cleantech AB and with this thesis work are stated.

6
During this study the authors have been working with a company, which is developing a renewable power generation project, named the Green Plant. The company, as said before, is Pamoja Cleantech AB. It is developing a project based on the design and construction of a modular off-‐grid small-‐scale renewable energy system for rural electrification (10kW). The plant is based on biomass gasification, preferably from local agricultural waste. The gasifier and the whole energy production system of the plant are all located inside a shipping container. In this way, a modular structure simplifies the transport and facilitates the installation. The main goal of the company’s project, the GP, is to design a sustainable off-‐grid platform that produces energy to provide life services and also to excite the local entrepreneurship in the rural sites where it is applied. The main business focus is to anchor load customers such as telecom companies, this load is assumed to be feeding a telecom booster station for cell-‐phone communication, which consumption is estimated to be 1 kW. Considering these load-‐customers implies a better cost-‐benefit ratio for the project, from a profitability point of view, since they would provide constant revenue that would allow maintaining the project. Furthermore, it ensures the fact of reaching into rural communities and creates an opportunity to provide them with life-‐services, this perspective is the one pointed by this thesis work. The GP project is formulated in collaboration with, Ugandan Industrial Research Institute (UIRI), The Vi Agroforestry Program, Centre for Research in Energy and Energy Conversation (CREEC) and both Nordic and African universities (Royal Institute of Technology -‐KTH, Aalto University and Makarere University); along with Pamoja Cleantech AB. Establishing boundaries within the project helps not to lose track of the main objectives and to focus on the most useful possibilities. In the study case, the boundaries can be divided in different groups. They can be classified as:
• The Geographical area. The region in which the solution is being applied would be the surroundings of the plant, the community who lives and works within this region. This means focusing in the local problems.
• The Use of residual energy and waste of the main plant as input. The main available supply for the final product would be the waste of the plant itself and/or the non-‐used energy. Thus, the final product should be limited to that input not creating a need of new supply lines.
• The Cost. It is meant to be a sustainable solution; the investment should not exceed a reasonable cost. That means that the capital investment must not mean a significant change in the main budget of the company.
• The Population needs. The proposed solutions will be only those that are useful for the population and those that can mean a positive impact on the area to

7
foster the economical development. That implies focusing on the real and current problems that stop the rural progress.
• The Space in the container as technical/design constraint. As the system has to be transported inside the container, the limitation of space inside will suppose a major restriction regarding to practical solutions and the design phase
• The collaboration between Pamoja and the telecom company is out of the system boundaries. The only issue that has been taken into account is the constant energy supply to the telecom tower and it is estimated to be 1kW.
• The limited knowledge about the technology used in the gasification process. Pamoja Cleantech AB is still developing the system that will drive the gasification process, and so, limited data is available regarding the waste thermal heat obtainable.
• The use of Multi-‐Criteria Decision Analysis (MCDA) as a discarding tool. The MCDA is not used as a deep analysis process but as a method followed to discard the less efficient solutions and from then, continue with a more detailed approach to the ones that performed more successfully.
• The assumptions made during the research. Throughout the different analysis performed, mainly in the results part, assumptions have to be made when data is not at researcher’s disposal. It slightly reduces the reliability of the project, but is the only option to continue with work. Those assumptions are always made in base of a reasoned judgment.
• The use of the some procedure as example instead of exact data. The above-‐mentioned fact about the shortage of concreteness, suggests using some of the procedures, the ones where more assumptions are made, as examples of how the development of those parts must be done instead of a source of exact data.
As it can be seen, the Figure 2 describes the GP and its relation with the stakeholders linked to the boundaries described previously. It includes the basic functions such as the energy input and output and the additional applications. Apart of these functions, the stakeholders that are working with Pamoja Cleantech AB are included in the diagram too. These partners collaborate in order to set up a successful business model, to provide technical support, to help find possible pilot areas where to test the system and to promote the idea within community as well as with the institutions. A brief description of each of them is given below:
• Community. The social web is the main stakeholder of this thesis work. The whole research is based on community’s necessities and development. The community is the customer who is taking advantage of the output of the thesis in form of life-‐services. The communities visited include the Magala Growers and

8
the Nabumbugu Coffee farmers Cooperative in the Busunju area, and the Esukanesi Memorial Primary School in Nyendo, Masaka area.
• Vi-‐Skogen (The Vi Agroforestry Program). Vi-‐Skogen is a Swedish Non-‐Governmental Organization with the headquarters in Stockholm. The program runs six small-‐scale farming projects around Lake Victoria; two in Kenya, one in Uganda, two in Tanzania and one in Rwanda. These projects aim to prevent soil erosion, produce fuel-‐wood, timber, and fruits, to generate income and improve the environment. Nowadays, they are working with around 150.000 families (more than 1 million people) and, every year small-‐scale farmers grow over ten millions trees. Vi-‐Skogen is the link between the agricultural cooperatives and the research group, helping to arrange the supply chain and business model between the community and Pamoja Cleantech AB. In addition, the collaboration lead to find the selected community for the pilot plant project. Regarding to the thesis work, the main support from this organization has been focused in the data collection and the surveys management during the field trip.
• Agricultural Cooperative. It is the part of the community dedicated to the agricultural production. And so, is supposed to be an important stakeholder to the thesis project as it should be one of the main users, as productive activities most probably need a source of electricity to improve and to become more efficient and sustainable.
• CREEC. It is a research institution that is founded under the Office of the Dean of the Faculty of Technology, Makerere University in Kampala. The aim of the institution is to be the bridge between researchers, scientists, business community, funding agencies and the general public. Mainly, the purpose of the organization is to support pilot projects. To do that, they provide technology, any implementation requirement and training studies. In addition, they increase the public awareness and participation. One of the most important aims of CREEC is to work on rural electrification systems. CREEC has stated this aim as to carry out research and feasibility studies on renewable energy system such as hybrid systems to power rural communities, set-‐up of mini-‐hydro, and biomass use for power generation, affordable ways of extending the national grid, Solar Home System innovation and design, etc. Regarding to the project, CREEC provided technical support, experience in the field and some funding for the GP development. The advising provided to the researcher of this work has been dedicated to the potential solutions assessed as the energy recovery systems.
• Telecom Company. It is the main load-‐customer for the GP concept, the basis for Pamoja Cleantech AB’s business model. In relation with the thesis work is just important to remember that the booster station tower has a load of 1 kW, and so, this power will not be available for a life-‐service use.

9
Figure 2. System boundaries and Stakeholders Overview
2.3 The Green Plant and the Potential Applications The following part is firstly introducing the link between the green plant and this thesis project as an overview of the whole system, as well as stating the principal concepts within the system; see Figure 3. Then, separated in different points, the potential solutions are described and analyzed in order to know which are the possible outputs of the project. It is already stated how the GP works and the first purposes of Pamoja Cleantech AB. And so, once the initial business concept of the company is known, the thesis framework concept has to be introduced. So far, the company has been studying various potential sites where the pilot plant could be placed as well as working on different design approaches. These approaches consider the electricity surplus and other by-‐products2
that could be used according to the specific needs in the area of operation. In that direction, and as declared previously (section 1 Introduction), the ultimate goal of the thesis work is to identify further potential uses for the electricity and by-‐products being generated by the Green Plant and to formulate a sustainable solution in terms of economy, environment and social impacts. Identifying which could be the most important applications of this surplus is crucial in order to turn it into a meaningful contribution to the rural zone. As a first approach, the Figure 3 has been made in order to understand the general concept. As it can be easily seen in the schema, the overall process has been divided in 5 parts, each of them defining a level of the whole energy stream. Starting from the raw material, passing through the conversion of this material into energy by the gasification process, and finally, the research’s stages research that are included in this thesis:
2 By-‐products include energy sources as biochar, exhaust gas or waste heat.
Telecom Company
Energy supply 1 kW
Community
Agricultural Cooperative
Vi-Skogen
CREEC
The Green Plant
Inside the system boundaries
Outside the system boundaries Energy
supply
Energy
supply
Technical
Support

10
analyzing the potential energy forms, how can these be converted into a useful way of energy and finally looking for the main human benefits that can be provided with them. It is important to understand that the mentioned “Potential Applications”, in the Figure 3, are the solutions that will be analyzed in the following points of the thesis in order to understand if these are feasible or not, from the thesis objective point of view. It is also very relevant to understand that the life-‐services, which are to be covered, are the ones pointed by the community people during the surveys made during the field trip; this will be explained in further sections. As said previously, a deeper analysis and understanding of the “Potential Applications” is done in the following part. Finally, in the same direction of what has been explained in the previous paragraph, is important not to confuse the “Energy Carriers” with the “Potential Applications” and the “Life-‐Services”. The “Energy Carriers” are the direct output of the GP, and what has the energy potential to be used. The “Potential Applications” are the processes that transform this energy in something applicable in the selected location. And so, be able to cover the “Life-‐Services” lacking in the local community.
Figure 3. Energy Development, from Raw Material to Life-‐Services

11
2.3.1 Biochar Application
As it has been stated in previous sections, the proposed solution should consider a cradle-‐to-‐cradle approach, amongst the other objectives. Hence, the solid waste of the GP ought to be reused or transformed into another profitable form. The gasifier produces charcoal-‐like solid material, which is also called biochar. The procedure followed for the biochar production is to heat any kind of biomass in the absence of oxygen for a specific time (between 350 and 600 ̊C) (McLaughlin, et al., 2009). This process is called pyrolysis and it results in a carbon rich product, and what is more important, its carbon compounds results to be highly stable. Thus, it provides highly efficient storage of the carbon (Lehmann & Joseph, 2009). There are still several discussions going on about the biochar production issue. However, there are not many scientific reports about this topic. The discussions are mainly focus on the biochar production technology. These are directly related to the gasification system whether it is a downdraft or updraft gasifier. And, as the exact technology that is going to be used by the GP is yet unknown for this research, this dilemma is not taken into consideration (Brown, R.C., n.d.). The most significant background of the biochar application is derived from the Amazonian rainforests findings (AKA Terra Preta) (McLaughlin, et al., 2009). Several studies have shown that biochar highly exists in the soil of the agricultural areas that are very productive and have a great yield (Lehmann & Joseph, 2009). On the other hand, it is rather difficult to give a sharp opinion about the cause and effects of biochar within the modern agricultural applications, even though the modern way of thinking tries to find opportunities of replacing chemical-‐based fertilizers of the industrialized agriculture (McLaughlin, et al., 2009). Nowadays, one of the most important known benefits of the biochar is its potential of GHGs mitigation due to its long-‐term carbon storage capacity (McLaughlin, et al., 2009). Despite, recent researches are mainly focused on the results of applying biochar to soil in terms of the management of agriculture and environment. An important fundamental book on biochar and its applications is “Biochar for Environmental Management” which is edited by Lehmann and Joseph (2009). The authors have described the purpose of applying biochar to soil by the following categories:
• Agricultural profitability. • Management of pollution and eutrophication risk to the environment. • Restoration of degraded land. • Sequestration of carbon from the atmosphere.
Agricultural profitability As mentioned before, published studies and current applications are rarely found on this topic. In the “Biochar for Environmental Management” book, are given some examples about biochar application in crop productivity (Lehmann & Joseph, 2009). In this case

12
study, agricultural profitability covers both economical feasibility and crop productivity. The key point of the literature review on biochar application, which must be taken into account during this thesis project, is that those entire examples are from tropical climates, as well as Uganda (U.S. Department of State, 2011). Although, some of the effects can be listed as below:
• Increased root nodule formation, plant growth and yield. • Increased N fixation. • Decreased amount of requested fertilizers and chemicals. • Increase of biomass.
However, in order to be economically feasible, the biochar application should have lower production costs than the improved agricultural products. Since there is lack of research on biochar productivity, it becomes even more difficult to find information about its profitability. One of the studies on the topic, which is done by Galinato et al. (2010), is about wheat farm profitability with and without biochar in Washington State. In the study, the authors have estimated costs and returns for using biochar as soil amendment. The methodology used has been to assess the reduced emissions of using biochar, and also accounting the benefits of the carbon sequestration after its appliance. In addition, a comparison has been performed between the productivity after the biochar application and after the lime application to the soil. The conclusion part of the mentioned research is focused on quantifying all the possible biochar applications to soil, they come up with the idea that the biochar can be economically feasible only if:
• The farms can justify the carbon sequestration on the carbon market and get promoted by authorities.
• The biochar market prices are low enough. Soil Management and Carbon Sequestration Agricultural profitability is one of the promising impacts of using biochar as fertilizer; furthermore another important issue is the carbon sequestration. National Sustainable Agriculture Information Service (ATTRA) (Schahczenski J., 2009) has published a broad study on carbon sequestration where it has been looking for the relationship between agriculture, climate change and carbon sequestration. Carbon sequestration could be simply defined as removing carbon dioxide from atmosphere by agricultural fields. In the natural carbon cycle, during the growing of plants, CO2 is absorbed from the atmosphere and afterwards when plants die, during the decomposing of organic substances, CO2 is emitted to the atmosphere again. Hence, the overall natural cycle is carbon neutral (Schahczenski J., & Hill, H., 2009). The problem with fossil fuels in terms of global warming comes up at this moment. Fossil fuels add more carbon to the atmosphere as they are burnt. In contrast, pyrolysis can detain this atmospheric carbon as biochar for long periods and by biochar application, this carbon can be stored in the soil. Therefore, the biochar approach is an attractive solution to cope with global warming concerns (Lehmann & Joseph, 2009).

13
As explained, soil has a huge potential to store carbon and it is already the biggest carbon-‐carrier. Biochar is helpful to increase this potential and by doing so, it is a soil protection and maintenance (Schahczenski J., 2010), at the same time and, as it has been mentioned in the previous paragraph, this situation makes biochar important in terms of carbon trading value. Taking advantage of biochar potential of boosting soil with organic carbon, increasing nutrient retention and improving crop productivity could be the most important approach in order to achieve local sustainable development (Whitman & Lehmann, 2009). Biochar applications are getting more interest in Africa. According to a group of African nations and UN Convention to Combat Desertification (UNCDD), the biochar applications could be the next key method to cope with global warming (Whitman & Lehmann, 2009). Besides, the soil amendment application is not only an opportunity to add positive value to the GP, but also to develop a sustainable agriculture system. This application would increase the productivity of the farms and put the agricultural residues to use. Working closer to biomass sources and with the local communal groups where the GP is located could also be a very important chance to accelerate the rural economic development.
2.3.2 Electricity Supply
There are numerous projects, applied and on going, which are concentrated on rural electrification in different parts of the planet. The researchers have observed that the main differences between the options applied are founded on the way the energy is generated. For instance, the projects are mainly based on solar, wind and biomass energy production. Therefore, since Pamoja Cleantech AB’s main project is aimed to produce electricity by gasification, the researchers have decided to examine just the electricity network options rather than the generation technology itself. In this case, the main options are mini-‐grid systems and battery charging systems in order to reach the end user. The aim of this application is to run the Green Plant with the objective of providing a more reliable and economical source of energy to the rural inhabitants and help to reach a local sustainable development. By doing so, productive activities could be increased in the area; the locals could get benefit from the light, life-‐services and other demands of the community, in which the GP will be located. And as mentioned in the previous paragraph, two systems are to be analysed, the mini-‐grid and the battery charging system. Mini-‐Grid There are different ways of establishing an off-‐grid system as a rural electrification method. The decision is usually made based on values as the energy consumption, the average income and the willingness to pay amongst the community. The electricity generating systems that are mainly used consist of diesel generators, micro-‐hydropower plants and renewable energy technologies. The most common renewable energy

14
solutions for the off-‐grid electrification are either solar or wind power. The biomass-‐based power plants are rarely used for this purpose (World Bank, 2008). The mini-‐grid might be the most crucial one amongst all the other application that are considered in this thesis project. The reason is that the mini-‐gird is supposed to increase the life condition of the community but at the same time with its high potential of boosting the productive activities, the system is expected to empower the economical and social development of the community. In 2002, The World Bank, performed a research on the socio-‐economic benefits reached out of a rural electrification project in Philippines (The World Blank, 2008). Some of the results are given below; see Table 1.
Table 1. Socio-‐Economic Benefits of Rural Electrification in Philippines (The World Bank, 2008)
Benefit Category Benefit Value (US$/month) Consumer Type Less expensive and expanded use of lightning
36.75 Household
Less expensive and expanded use of radio and TV
19.60 Household
Improved returns on education and wage income
37.07 Wage earner
Time saving for household chores 24.50 Household Improved productivity of home business 34.00 (before mini-‐grid)
75.00 (after mini-‐grid) Business
The data in Table 1 shows how the economical level of the households and the local businesses, after the implementation of the project, rise up. It is remarkable that the productivity of home business almost doubled after the connection to the electricity grid. Finally, in order to make the system’s explanation more understandable, the Figure 4 is a conceptual schema of how the mini-‐grid should be. Basically, in the system, the GP provides the produced electricity directly to the booster station tower and the community. Besides, at the same time, the system contains a battery charging system that provides electricity to the community during the low generation period as a back-‐up system. The main components of the back-‐up system are the batteries, which are charged by the GP output. The inverter reverts the alternative current network into direct current to charge the batteries. Thus, under the demanding time, the grid electricity will be fed by this stored energy. The specification and detail of the data is subjected to the agreement between the researchers and Pamoja Cleantech AB to protect the privacy of the project.

15
Figure 4. Conceptual Layout of the Mini-‐Grid System
As a last clarification, is important to see that the battery system included in the mini-‐grid design, see Figure 4, is different and independent from the battery charging system explained below. The both of them could coexist in a hypothetical scenario. Battery Charging System (BCS) The battery charging concept is designed and developed for the rural areas where the national electricity grid is not established and also not likely to reach in the near future. The targeted users are low-‐income groups who cannot afford to purchase diesel generators (or any other energy resource e.g. solar panels). The BCSs are more efficient for those locations where there is a low energy demand. The capacity of the system is flexible and can be designed according to the number of users and their electricity needs (Zerriffi, 2011). Basically, the system includes a battery charger located nearby the energy resource and several batteries. An example of the application of this system in Vietnam can be found in the paper that is published by Dung et al. (2003). In Vietnam there are 30 BCSs that were installed in 1990s, in which the energy source comes from photovoltaic solar panels. One singular case from the paper was based in a village where nearly 600 families (population of 3000 inhabitants) were living. The project was designed to electrify houses, the post office, the health centre and a cultural room. Since it would not be possible for the inhabitants to own solar panels in individual base at home, the charging station was established to decrease the initial cost for local community. The BCSs were usually installed at a common site and trained personnel were taking care of its maintenance. A useful method that can be extracted from this work is that there was a criteria followed in order to decide about the better placement for the BCSs, potential places where the system could be leading a positive impact. The given considered conditions in the report for starting the installation are listed as:
• Placement of the station and users locations according to the BCS

16
• Willing of pay and economical conditions of the locals • Potential of the site would have the grid electricity connection • Energy resource alternatives • Electricity requirements, e.g. for lighting, education, entertainment, milling,
water pumping etc. • Local cooperation
This methodology was helpful to establish the research work. Besides, an important given figure in the Vietnam case study was the method of choosing right battery type for the project. Following that, it is clear that depending on the activities carried out in the household, regarding to the level of the consumption, the battery should be different, see Table 2. And so, having an overview of what are society the needs and its consumption is basic to determinate which battery system will be used.
Table 2. Appliances of the BCS in Vietnam (Dung, et al., 2003)
Alternative Energy Demand Operating Hours Capacity of Battery
1 Only lighting 3-‐4 h 20 Ah
2 Lighting and B&W TV Lighting: 1-‐2 h and TV: 3 h 25-‐30 Ah
3 Lighting and color TV Lighting: 1-‐2 h and TV: 2 h 70 Ah
4 Lighting, color TV and VCR
Lighting: 1-‐2 h and TV & video: 2-‐3 h
100 Ah
The Rural Electrification (Zerriffi, 2011) textbook contains several different off-‐grid electrification cases in Brazil, Cambodia and China. The conclusion that can be taken out of these different studies is that the life span and success of the project is defined mostly based on the economical conditions of the area and the performance of the system. In order to financially maintain a project, the throughput should be maximized, which means that the stakeholders must ensure that the utilization capacity is being used as much as possible. The willing of pay is one of the most important constraints of this project, and in that matter, creating new business for the farmers and ensuring the power demand is of great importance; for example, new water pumping system and the irrigation could increase the yield of the crops (Ravindranath et al., 2006).
2.3.3 Waste Heat Recovery
In this section are explained the possible heat recovery systems. One of the major restrictions of the project is to take advantage of the surplus of energy. In specific case, this energy usually appears as a waste, despite of this drawback, it and has a great potential when it is transformed into the appropriate form. It is just relevant to state, regarding the thermal energy, that the gasification process and the engine are the main

17
contributors (U.S. Department of Energy, 2005; Pandiyarajan et. al., 2010) as sources due to the combustions carried out during the different energy production stages. To that point, add as well the fact that the whole system is located inside a closed container, and as a result of that, the thermal energy is concentrated, so it should be easier to accumulate. The possibilities of recovery and use of heat energy are vast. The different options that this energy source can offer are varied and mainly depend on the energy source, its quality and quantity. Also, the way to gather and stream the heat depends on the purpose of use; obviously it is not the same process if the aim is to produce cooling for a refrigerator as if it is to supply mechanical power to a shaft for agricultural systems. And so, as there are many systems that could be implemented and it would take a long time to describe in detail all of them, the analysis has been done about the most relevant and likely solutions for heat waste recovery/reuse. The main issue within this topic is to be able to recover all that waste energy in the most efficient way; so, the less quantity is lost in this procedure. In order to convert this heat into a useful energy stream it is recommended to use the system that better performs under the working conditions; that is referred to the characteristics of the system and the heat. It is also important to understand the contribution each system can bring to the community, so, the devices analysed below have been classified in three groups depending on the objective they cover. The groups are: heating system, cooling service and mechanical power. Heating system The devices described in this group are the ones that are using the waste thermal energy to apply it as heat for a specific purpose, e.g. seed drying. Thus, there is no further process than the fluid-‐to-‐fluid heat transfer.
• Heat Pipe The heat pipe consists in a sealed pipe or tube closed in both sides, in which inside there is a fluid. The kind of fluid depends on the characteristics of the system, temperature and pressure. The pressure can as well be modified so the fluid works in the rank of temperature desired. In the inside of the pipe there is as well a capillary wick that separates the gas from the liquid phase of the fluid. All the inner space of the pipe remains in vacuum condition. Once the components of the system have been described the process on going during the heat exchange can be easily interpreted by the following picture, see Figure 5.

18
Figure 5. Heat Pipe Exchanger, Working Diagram (Abd El-‐Baky & Mohamed, 2007)
The functioning of the heat pipe is very simple. Shortly, the heat absorbed by one side of the pipe is transferred to the other side and released. Once the heat is released it is possible to use it for heating other fluid or, for example, to heat a chamber in which the crops could be drought. Some of the advantages this system provides are that there is the no need of energy input, and its maintenance it is considered low because it does not have any mechanical parts that are constantly moving or any part that can wear out. (Bureau of Energy Efficiency, 199?)
• Recuperators The recuperators work normally with the exhaust gases of the engines, pre-‐heating the air that has to work in the combustion chamber. It can also be applied in other cases; mainly it is air-‐to-‐air or air-‐to-‐fluid heating transfer. For the case under study this system is interesting because of many reasons but one really important it’s its simplicity. In the picture below, see Figure 6, it is outlined the basic working process of a convective recuperator; the heated fluid is air. As it can be easily seen in the Figure 6, the air that is heated is the one running inside the tubes, the exhaust gas used is introduced in the shell, and cooled down as it transfer the thermal energy to the air.
Figure 6. Heat Recuperator, Working Diagram (ResourceSmartBusiness, 2006)
This kind of system is commonly used, as well as in air pre-‐heating, in air-‐conditioning or ventilation of big spaces (Bureau of Energy Efficiency, 199?). Cooling service The transformation of heat into a cooling source can be a very useful tool. It is likely to find facilities, in the area where the GP is applied, that need the supply of a cooling

19
service for their functioning; e.g. health care clinics, schools, offices or grocery stores. The most promising system for this task is the absorption chiller.
• Absorption Chiller The conversion from a thermal to a cooling source of energy performed by the absorption chiller is characterised for the almost negligible input of electricity that it demands. The main energy feeding of the system is the waste heat recovered. There are just two pumps that have to be connected to electricity, although the consumption is below the 1% of their cooling capacity (Trane Company, 1989 cited in Gordon & Choon, 1995). The technical aspects of this device are explained in the Appendix I. Mechanical Power The machinery used in most of the agricultural processes, as mills or coffee husk separators, work under a mechanical shaft. The Diesel generators are the main supply source of this power, and as said before, not everybody is able to access it. Providing a mechanical shaft by the reuse of waste energy appears, at first sight, as a potential cheap possibility to contribute to the improvement of the productive activities in the surrounding area of the GP. Thus, the system that better fulfils these requirements is the Organic Rankine Cycle turbine (ORC).
• ORC turbine First of all it is important to state that this device is still under development, although it is not difficult to find or purchase in the market, the characteristics and specifications and working conditions are tightly subjected to the manufacturer and its advising. In the Appendix II is it possible to find a detailed description of the system. The ORC turbine system is specifically designed to reuse the waste heat produced during combustion or in other energy-‐to-‐power processes The ORC turbines can work within a range of temperatures, for the waste heat recovered, from 60 ºC to 200 ºC (Yamamoto, et al., 2001). The fact that it is really hard to improve the efficiency of the current combustion systems, or all the processes in which the lost of heat is involved, is a significantly important factor that motivates the research on this system (Hung, et. al., 1997) As a final analysis of the ORC turbine, the advantages and weaknesses of the system are described below, as strong facts:
-‐ The performance of the Organic Rankine Cycle (ORC) shows a low maintenance cost and a high safety grade on converting the waste heat into a useful and profitable energy source (Wei, et al., 2007).
-‐ The “value” and the feasibility of this system increase in regions where the fuel price is high. (Hung, et al., 1997).
-‐ The technology that has to be implemented is simple, occupies a reduced space due to its small size and the non-‐emission of GHG or other pollutants turns the system into environmental-‐friendly. (Yamamoto, et al., 2001).

20
On the other hand, the main problem to overcome is:
-‐ The thermal efficiency of the Rankine cycle decreases as the temperature grade of the fluid gets low.
As a final conclusion for this overall section, remark that the evaluation of the GP project, the stakeholders and the thesis work boundaries together with the review of the analysed solutions, provides with a useful feedback and an overall view necessary to successfully continue with a deeper analysis and a better understanding of the whole system.

21
3. Methodology
In this chapter, the methodology used to develop the thesis project is explained. The chapter is intended to guide the reader through the research path followed by the authors. The diagram in Figure 7 shows this research path and links it to the structure of the thesis; it also contains a brief explanation of each step taken during the research.

22
Research Question How can the community life-‐services be covered in rural areas, by using the energy surplus from a decentralized small-‐scale biomass gasification power plant?
Literature Review Institutional & Scientific Sources
• The background of Uganda as well as the energy situation is studied in this part (2.1 Background of Uganda, Context and the Energy Problem).
• The institutional sources, which are provided by Pamoja Cleantech AB, are used to give an overview of the whole system, including the technical framework and the stakeholders (2.2 The Green Plant Concept, System Boundaries and Stakeholders).
• The scientific sources are used to cover an overview of the current energy situation, possible applications, and sustainable energy management in developing countries (2.3 The Green Plant and the Potential Applications).
Field Study – Collecting Data • The description of the approach to the site visits (4.1 Site Visit Preparation).
• The results of the surveys used to illuminate the relevant data (4.2 Survey of Visited Sites).
• At this point of the research, the pilot site and the life-‐services that could be provided by each application are known; so, the selection process starts. After applying the MCDA the most promising applications are selected to the final development (5.1 Selection of Possible Solutions – MCDA)
• Once the selection is performed, a deeper assessment over the business model, the potential impacts and the SWOT is done for the selected applications (5.2 Potential Impact Identification of the Selected Solutions).
• Finally, as a conclusion of the research, a final view of the applications is given as a budget and a concept modeling. In this section, instead of analyzing each solution separately, the intention is to merge the applications and evaluate them as a system. This last view includes an assessment of how the system works and interacts with the different members of the community (5.3 Final View of the System).
Section 1. Introduction
Section 2. The Green Plant Concept
Analyzing and Interpreting Data • The Selection of the site for the implementation of the pilot plant is done following the data
grouped from Table 5 to Table 9 (4.3 Pilot Area).
• The next step is to identify the potential benefits that can be provided to the community. The benefits are studied based on communal and productive energy uses. The results are shown as the possible applications and the life-‐services each would provide, see Table 10 and Table 11 (4.4 Applications and Life-‐Services).
Section 4. Field Trip
Section 5. Results
Figure 7. Conceptual Development of the Research Methodology

23
The starting point of this work is the statement of a research question. The second step of the research consisted of performing a literature review with the aim of building an overview of the current energy situation and sustainable energy management in Uganda, a description of the whole system including the technical framework of the project and its stakeholders; and finally an assessment of the possible solutions to be applied in order to respond to the research question. The literature review included the examination of scientific publications, development agencies’ reports, product brochures, etc. Internal documentation at Pamoja Cleantech AB was particularly important to describe the system and the stakeholders involved. The next step of the work consisted of observations and interviews. This step was developed in Uganda. The observations and interviews were conducted during a 2-‐month field trip that included visits to different institutional centers as UIRI (Uganda Industrial Research Institute), Makerere University and Vi-‐Skogen facilities amongst the most important; also areas to be evaluated as pilot sites including Sekanyonyi and Nabumbugu Coffee Farmers cooperative in the Busunju area. The fieldwork is an important part of the case study because it increases the reliability of the research and the report itself. The fieldwork covers both, the socio-‐economical and the physical conditions of the selected villages. During the development of the data collection process, in the visited locations and during the surveys, a number of interviews are done to easily retain the most useful information. The interviews are tape-‐recorded and written down into word processing software in order to make the information much more accessible and easier to analyze. Also, this method was useful to keep on retaining the possible applications and the actual conditions of the villages. The most relevant information from each interview was taken and considered as powerful input to the new product of the system. The aim of the site visits was to choose a place where there were favorable conditions to foster the objectives of the research. The intention is to find an undeveloped village with a significant energy demand and a potential of creating new business opportunities. Thus, connecting these site conditions with the main goal of providing as much life-‐services as possible. Furthermore, the physical and structural conditions of the area were also taken in account. In that direction, the focus was on villages that are neither connected to the national grid nor planning to be connected in a long time, according to the Ugandan Rural Electrification Agency (2006). Moreover, the interest in the current situation of the telecom company is considered as a requirement for Pamoja Cleantech AB, due to the fact that its primary business model is linked with the energy supply to the booster stations. Regarding the potential places where the Green Plant could be installed, the authors designed a specification sheet, which is included in Appendix III. In the same direction, there is a list with various requirements and its importance regarding to the aim of the project. This list is used during the field trip, by the researchers and members of a Pamoja Cleantech AB team, to assess the suitability for the project of different visited

24
places; see Table 3. Table 3. Requirements for the Site Visits
Requirement Level of requirement Good accessibility Min Existing local businesses with a need of electricity Must Second key customer on site (hospital, hotel, farm, etc.) Min Off-‐grid village/ town Must Potential new site for telecom base station Min Existing mobile base station with diesel generator and the interest in our system
Min
Available biomass either not-‐used biomass waste (saw dust, nut shells, rice husk, wood waste, bagasse,...) or existing biomass fuel production.
Min
Land available for local biomass production Wish Not far away from Kampala Wish Existing forestry program Wish Already an existing development hub of other organisations (e.g. Millennium village, etc.)
Wish
As a result of literature review, observations and interviews, the pilot project area was defined and the needs of the society were characterized. The potential areas were deducted from the interviewees’ opinions about the current situation of the village. Hence, the authors have pooled literature review, observations and interviews. It is also relevant to state that the work done during the literature review helps to be more efficient in the field trips; it allows the researchers to have a better understanding of the actual possibilities of energy use in developing countries, of what had been applied or not, and it delimits the survey investigations to specific characteristics and elements that are pointed by the researchers, in base to the previously acquired knowledge. Subsequently, the collected data is analyzed with the purpose of answering the research sub-‐questions, which are given in the introduction part. This analysis is performed by the use of Multi-‐criteria Decision Analysis (MCDA), which helped the systematization and analysis of the collected information. First of all, the data is grouped according to its relevance. Then, all the potential applications and results of the field trip are combined and analyzed together with the intention of providing potential solutions to decision makers. Hence, the output of the analysis is the selection of the best potential applications that are to shape the final solution of the thesis work. It is important to remark the fact that, in this study case, the MCDA is not used as a deep analysis process but as a method followed to discard the less efficient solutions and from then, continue with a more detailed approach. The selected potential applications are further analyzed. First, they are described. Then, they are assessed using three different approaches: the business model overview, the potential impact identification and the SWOT analysis. Each one of these evaluations could be a thesis work itself, and the authors of this work do not intend to do a deep and

25
very detailed analysis, but an evaluation of the most likely scenarios to have a deeper understanding of what could happen, and how could the final application’s benefits be maximized. Thus, the “Selected Solutions” represent a device or a system that is meant to provide life-‐services to the local community. The feedback that the researchers get after these analyses helps to do a more exact design of the whole system. And in that direction, the researchers, as final output, can set up a likely scenario with the selected applications working together as a unique system. The diagram described in the Figure 8 summarizes the methodology explained in previous paragraphs. The stages of the research are indicated in the flow and the lists contain the outcomes of each step, which will be discussed in chapters 4 and 5. Sequentially, the conclusion of one stage is used in order to perform the following step.
Research Question
Group Survey Results
Potential Benefit
Selection of Possible Solutions -‐ MCDA
Analysis and Design of
Final View of the System
• Research sub-‐questions
• Background Knowledge (Uganda, Green Plant, Energy Applications)
• Surveys and Interviews • Site Visits
• Current Social View • Biomass Supply Potential • Energy Use: Household / Farming • Farming Activities / Current Machinery
• Based in 2 main categories: o Community o Productive / Farming Activities
• Selected Applications: o Application 1 o Application 2 o …
• General View of the Application • Business Model • Potential Impact Identification • SWOT
Figure 8. Main Research Stages and Outputs

26
3.1 Selection of Possible Solutions – Multi-‐Criteria Decision Analysis The ultimate objective of this very specific section of the work is to analyze the different exposed solutions, compare them according to a criteria, which at the same time are related to the research sub-‐questions, and rank the mentioned solutions depending on their grade of performance related to these criteria. After these procedures the selected solutions will be defined, as systems or products, for a further and deeper assessment and design. The literature review done reveals a variety of solutions that could be applied as an output of the research project. Hence, to narrow down these different possibilities, discarding the inapplicable and the non-‐efficient regarding to the specifications defined by research sub-‐questions, there are a variety of methodologies that can be applied in order to help taking a wise judgment, founded in several bases which give to the decision a logical justification, and which in essence represent a significant aid to the decision-‐makers (DMs). There is a fact that should not be forgotten which affects the performance of this analysis. It is the reduced knowledge about the GP potential regarding the energy waste recovery, because the specific gasification system that is going to be used has not been defined yet; and due to the limited information related to the working specifications of the different solutions stated previously. Despite the lack of exact data, the analysis is carried out applying in all the decisions the useful knowledge and experience gathered during the field trip, the first steps of the literature review and after the advising of the various stakeholders involved in the project. It is also important to point the fact that this is a preliminary analysis, mainly used to discard inapplicable options, not aimed to define the output of the project. There are several systems and methods created for that aim, but in the case under study it has been understood that the most suitable procedure would be the appliance of the multi-‐criteria decision analysis (MCDA) (kiker, et al, 2005). The MCDA is chosen because it considers the participation of different stakeholders (researchers, companies, society, etc.) involved in a project, as well as the different solutions that must be assessed depending on the research sub-‐questions to be answered (kiker, et al, 2005; Guitouni & Martel, 1998; Triantaphyllou, 2000). Once the application of MCDA has been decided, different MCDA methodologies must be assessed according to the purpose of the DM and the particular conditions of the study. There are several scientific papers, which offer some aid to choose the best MCDA; those are based on the characteristics of each MCDA method and the objective of the DMs (Guitouni & Martel, 1998). In this particular case, considering the characteristic of the study and the existent solutions, the selected methodology is the Weighted Product Model (WPM). Finally, the utilization of the WPM is based on the aim of finding which are the best

27
solutions, amongst the described in section 2, regarding to the research sub-‐questions. That is, selecting the ones that maximize the sustainability in terms of economical, social and environmental development. Weighted Product Model (WPM) The WPM methodology is complex and needs a long explanation to achieve a good understanding of the whole process. Thus, a brief but useful description of the most important concepts is done below. In order to get a deeper approach see Appendix IV. As it has been described by Triantaphyllou, et al. (1998, p. 5):
“In WMP each alternative is compared to the others by multiplying a number of ratios, one for each criterion. Each ratio is raised to the power equivalent to the relative weight of the corresponding criterion.”
In the schema below, see Figure 9, it is described, in simple terms, the process carried out during the decision-‐making procedure; it is done in order to easily understand which are the steps taken along the work. Right after the Figure 9, the explanation of each one of the stages involved in the process is done.
A description, based on Triantaphyllou, et al. (1998, pp. 1-‐2), of the mentioned concepts in the Figure 9, is done below: 1. Definition of the Problem & Solutions: The different possibilities defined in the
section 2 of the report. 2. Identification of Criteria: The range of characteristics that have to be accomplished
by the solutions. Based in the research sub-‐questions and set up as milestones to achieve in order to be as successful as possible in reaching an answer for the main research question. There are 8 different criteria and all are related to the research sub-‐questions. The objective of them is describe an specific characteristic for, afterwards, assess how successfully achieve the solutions the criterion.
- Economical Cost: The economical issues included in this part are the ones regarding the cost of the system. Initial investment and maintenance are the
1-‐ Definition of the
Problem & Solutions
2-‐ Identification of criteria to compare solutions (research sub-‐questions)
3-‐ Weight the different criteria
4-‐ Eliminate the
Inapplicable Solutions
5-‐ Determinate the Performance of the Solutions for the Criteria
6-‐ Final Ranking
of solutions
Figure 9. Decision Making Process (Kiker, et al., 2005, p.105)

28
main expenses. The quantities are given in US dollars. - Return on investment for Pamoja Cleantech AB: The assessment of the potential
revenues that the company could have out of the application of the various studied systems.
- Development Empowerment: This criterion tries to evaluate how the proposed solution can promote the local business, and give an extra-‐value to the activity that is currently going on in the area. For example, the service of cheap energy, for the processing of coffee husk, could mean an important advantage as the manufactured coffee increases three times its price compared to the current non-‐treated product.
- New Business Opportunity: The potential that the application has to create new job opportunities within a currently on going activity or, what is more interesting, the capacity that the system has to generate new business activities, thus economical growing.
- Population Coverage: The different activities on going in the region occupy different sectors and number of people. This criterion is measured as the percentage of people affected by the solution over the total population of the community.
- Electricity Use: The criterion measures the quantity of energy used. The energy consumption, given in kWh/year, needed to run the proposed solution.
- Environmental Care: Each solution will be assessed by how it is adapted to the GP location and its environment. The key factors influencing upon this criterion are the estimated contamination (manufacture and use), the alteration on its surrounding (view, noise, etc.) and other eventual contamination the system could cause.
- Life span: The estimated life span given by the manufacturer. Is measured in years.
In the thesis work case, the level of performance of each solution per each criterion is graded following two options, as shown in Table 4, and depending on the solution to be assessed.

29
Table 4. Value/Measure of the Criteria
Evaluation/Measure of the Criterion per each Solution Numerical Option Criterion Evaluation/Measure Economical Cost US Dollars Population Coverage % Electricity Use kWh/year Life Span years No Numerical Option Return on investment for Pamoja Cleantech AB 1 à Very Unfavourable
10 à Highly Recommendable Development Empowerment New Business Opportunity Environmental Care
As Table 4 shows, the numerical values are obtained directly after the data collected in the field trip or after the information from the suppliers of the solution, if it is a device or a system. In the case of the non-‐numerical values, the authors of this thesis work decide the performance grade. These grades are the ones that are going to be applied in the mathematical equation, which is going to rank the solutions from the best performance to the less promising. This is possible because the WPM is referred also as a dimensionless analysis. The WPM structure eliminates any units of measure so different units can be assessed in the same analysis (Triantaphyllou, 2000, p. 8).
3. Weight the different criteria: It defines the value of each of the different criteria. Not all them have the same relevance from the DMs point of view, and the way to set the priority of the DMs is to grade the criteria according to the level of relevance for the study. In order to do that, in this case the result of adding up the weight of the entire criterion is 1.
4. Eliminate the Inapplicable Solutions: During the development of the analysis it is possible to see and understand that a considered solution can be discarded if its performance for the most relevant criteria, the ones with higher weight, is way worse than the rest of the possibilities.
5. Determinate the Performance of the Solutions: In this stage the different solutions have to be evaluated per each of the established criteria, this is done according to what has been explained in the Table 4.
6. Final Ranking of Solutions: Final result of the mathematical operation, which results in a ranking of the possible solutions assessed regarding to the criteria applied and its weight.
In order to have an approximate but coherent idea of the evaluation of each of the criteria; catalogues, papers, brochures of companies and other relevant information have been taken in account for each of the different possibilities. Thus, having an actual

30
reference in the study adds value and credibility to work for the statement of the figures and its comparison. The aforementioned data will be included in the Appendix V. Finally, expose that the WPM has been selected because of its simplicity, the possibility of working with different units, the versatility in terms of adding and subtracting items from it, and essentially because it is the MCDA method that better adjusts the specific characteristics of the goals and objectives for the purpose of the project, the constraints and the multiple possibilities that a starting project has to offer. The last step of this stage is to define which are the selected solutions included for the development of the project. Defining them and its parts is crucial for the following stages of the thesis work. And it links this part with the first step of the next stage, the overview of the design.
3.2 Potential Impact Identification of the Selected Solutions The evaluation includes the following segments under each product sub-‐title:
• The overall benefits of the application in terms of community, household and industrial development levels. A design overview of the application that explains how the system looks and works and what the components are used.
• The business model, which aims to match the different customers with the right service and develop a pricing strategy. Below this part, the business model methodology is explained in details.
• After all, the potential impact assessment has been carried out for each
application. The assessments include “Potential Social Impact Assessment”, “Potential Environmental Impact Assessment”, and “Potential Economical Impact Assessment”. Again the detailed methodology about the potential impact assessment is given below.
• Lastly, a SWOT analysis, in a matrix form, is used in order to merge and conclude
the business model and potential impact assessment outcomes. The schema below represents the mentioned different sub-‐titles and the processes that are explained above; see Figure 10.

31
3.3 Final View of the System The final view of the system is a design based on the previous overview created at the beginning of the results section (5.2.1 General Overview of the system), and improved when possible based on the assessments done during the research. The objective of this section is to try to merge all the applications in one in order to give more realistic figures and data. The final view of the system consists of two parts, the design of the system as a layout located on the selected village, and a brief budget containing the more relevant data, which can give an approximated idea of the assumed costs of the implementation of the system.
3.3.1 Budget
The budget will be spreadsheet based. In order to obtain a correct and successful budget, the following steps should be studied; paying special attention to the inclusion of all the parts involved in the product, regarding technical parts, all the devices belonging to the system. Once the spreadsheet is finished, the budget is completed. The list of the devices included in the spreadsheet can be as detailed as wanted, from general devices to small parts, depending on the technical list used and the supplier’s capacity.
3.3.2 Final Layout of the System
In this section, an overview of the final product will be given. The model will explain both the physical parts of the product and the relationships between different elements and stakeholders. By looking at this model, the reader should be able to observe how the product works and to examine the performance of the product. This understanding
Figure 10. Conceptual Development of the section 5.2 Potential Impact Identification of the Selected Solutions
General View of the Application
Business Model Potential Impact Identification
SWOT
Final View of the System

32
is done by the presentation of a hypothetical scenario based on the data collected during the field trip, and analyzed throughout the results part.
4. Field Trip
The field Trip section is, as explained in the methodology, divided in four sub-‐sections, the first two related to the data collection, and the two that are explained last in the chapter are regarding the interpretation of data.
4.1 Site Visit Preparation The preparation of the site visits starts before the trip itself. During the previous month, the background research helps to set up the data boundaries, to constraint the search of information and the surveys to what is completely relevant; focusing in the scopes of high interest as energy consumption and life-‐services. During this time, the survey that can be found in the Appendix III is developed and thus having a guideline for the data to be sought; as it is stated in the methodology section 3 Methodology, the survey is used for the identification of the potential site as well. Once this background work is done, the next step is to perform the trip to the locations. To do so, the researchers take advantage of the NGO Vi-‐Skogen. The collaboration aim is to identify the conditions and community needs. The work of the NGO, which is useful for this research, is the structuration of agricultural communities into cooperatives, fostering their development and increasing the yield ratio. Then, it is easy for them to highlight areas where the agricultural cooperative could be a good spot for the GP pilot plant, knowing beforehand what the needs of Pamoja Cleantech AB are. In this direction, the sites recommended by Vi-‐Skogen are: Magala Growers Cooperative and Nabumbugu Coffee Farmers. Then, to start the research, the main points of observation are made in connection to “i) the locality and demographics”, “ii) energy supply assessment, considering the production rate of the village, the main crops, the agricultural residue rate” and “iii) energy demand assessment, considering uses and costs of energy, energy sources, difficulties in energy supply and social needs. In order to collect this information a questionnaire is used”, see Appendix VI. Another collaboration with a different stakeholder in Uganda, CREEC, has been performed at the same time. This organization provides advising and the experience of having been working in the field for many years. Throughout the field trip, a number of surveys were also conducted. The local inhabitants have participated in the surveys. Mainly, the surveys are done with the farmer families. The details and result about the surveys are given in the result section (4.2 Surveys of Visited Sites). Once this information being arranged and analyzed, it will be used to select the most promising site for the pilot plant. Then, the specific data of this particular place (life-‐services, consumption, and willingness of pay) will serve for the MCDA process, and further on for the potential impact illumination.

33
A conceptual map is shown in order to clarify this explanation, see Figure 11.
Figure 11. Conceptual Flow and Use of Data
4.2 Survey of Visited Sites In this part of the chapter, it is given the result of the surveys, which are performed in the three sites visited. The data gathered during the field trips is exposed following the surveys in Appendix III, this data is used to select the potential site location of the GP. 1. Visit to: Esukanesi Memorial Primary School This visit is a particular initiative of the two authors of this thesis paper. During the visit, the data is gathered in order to include this visit into the potential pilot villages. Even though this site is not considered for the installation of the pilot plant, the information, the comments and the experience achieved during this trip is seriously taken in account, not for its direct repercussion on the project but for the vision of the local people which not differ much between the different areas in the country. 1. Area

34
1.1. Geographical placement The school is placed in Kisiita – Kawoko, Butenga Sub-‐County, Bukomansimbi County, Masaka District on Sembabule Road. It is a pretty isolated place, there is one road passing throughout the village but there is not pavement.
1.2. Extension of the village, community, town. (Approximate distances) 1.3. National grid expansion possibilities
There is a grid existent all along the road that connects the different houses and the village, which is really extended. The village is divided in two different councils, due to its large extension. 2. Population
2.1. Households The population of the area is around 800 people.
2.2. School covering The local school has 300 students, which means almost all the kids go to the school in the area. There is a high motivation of education, in terms of increasing their chance of success in the active labor life and their socio-‐economical conditions.
2.3. Economical level (possibilities of consumption, will of payment, capacity of acquiring devices which need of energy, etc.)
The population of the area does not dispose of a high amount of money per family. 3. Industrial/Commercial/Social activities
3.1. Main activity 3.1.1. Industrial (Cooperatives, farms, mills, etc.)
The zone does not dispose a well-‐structured industrial area. There is only one mill, which is situated far away from a big part of the village (due to the extension of the town itself). The main activity of the area is the agriculture; principal crops are coffee, banana and maize. Some people are dedicated to the production of mood bricks for construction. All labor is done by hand; there are no tractors or mechanical equipment involved. The whole village just disposes of one small truck, which is from private property.
3.1.2. Commercial (Markets, stores) There are three main grocery stores in the village; just one of them has access to electricity by a diesel generator. Water pumping and cleaning could be an option; there is no communal water net.
3.1.3. Social (Schools, cultural houses) There is one primary school in the area. The school is more than an educational centre, it is a point of meeting between people and represents an element that all are proud of. The school was formed by the initiative of one particular person, but after that all community has pushed in order to make it grow and develop. It is a symbol of community spirit and social collaboration. In the school the kids learn as well how to crop and how to work the land, in doing so the children learn to be self-‐sufficient in life.
3.2. Energy consumption per sector (estimated) 3.2.1. Industrial
In agriculture and the other industrial activities the consumption of energy is really low. Most of the works are done manually, without involving any mechanical machine or electrical device.

35
3.2.2. Commercial The only store that has electrical power gets it from a diesel generator.
3.2.3. Social The school has a diesel generator at its dispose but the price of the fuel makes it hard to use it. There are few small solar cells that provide a small amount of electrical energy that is used to light just one room of the school during a short period of time, it is a really low amount of energy.
3.3. Population involved in these activities Almost all the community is dedicated to the two main economical activities, agriculture and brick production.
3.4. Further possibilities (cooperative creation, implementation of other activities, such milling if there is not currently existing)
There is a strong community feeling and, with the school as an example, it could be possible to engage people to create a cooperative where they could mill the maize and corn (which means one of the principal elements in their diet). 4. Current energy resource(s) The main energy resources are the diesel, charcoal and firewood. 5. Biomass supply possibilities (agricultural activity)
5.1. Amount of activity (possible cover plant needs) High agricultural activity exists in the region. Nevermore, there are not a specific number of tons per year of agricultural waste.
5.2. Type of crop The main crops are banana, maize and coffee. 6. Social energy requirements
6.1. Households (cooking, light, etc.) The possibilities of consumption in the households are not very high, mainly due to: • There is already a way of life based on a non-‐electrical dependence, • The revenues per family are really low and there is not a real need of having
electricity in the houses, • The main customer for the electrical consumption would be the community as one
unit. 6.2. Community needs (milling, water pumping, food stocks conservation, medicine,
etc.) Water pumping service to the school or to a specific point of the town would be a strong need, as well as the disposition of a mill which all the farmers could use. The fact that the village is so extended is a problem. There is going to be always a part of the community far from the energy providing point.
6.3. Other needs. 7. Conclusion The main necessities detected after the visit are: • Water services. The community use rainwater for all dairy activities: washing,
cleaning, drinking, cooking, etc. The school has a deposit, which collects all the rainwater from the rooftops of the buildings that shape the school. The rest of the community collects water from a manual pump, which is far away from most of the

36
households that form the community. • Milling. All the members of the community have to cover a long distance in order to
access the grinding facilities. As milled maize is an important part of their diet, it results in a big need. It could improve their economical status and they could ensure a source of food, due to the use that they do out of maize flour.
• Electricity. There is a grid passing through the village but because problems with the transformer there is no electricity at community disposal. Despite of it, most of the members of the community wouldn't use the national grid electricity because their economical conditions; electricity prices are really high considering to the electricity demand. Regarding to light use, nowadays they just have light in one of the rooms of the school, it runs by a diesel generator which is really expensive, the lighted place is used for cooking and eating, just to light the room where most of the people living close to the school cook, it is also a social meeting point because there is no other place with this service around the school.
• Cooling System. There is no cooling service for the community, the storage of products is a problem, milk, meat, and etc. cannot be stocked.
• Cooking. They cook with charcoal stoves, this is not a big problem but the inhalation of the charcoal smoke can produce a number of dangerous diseases.

37
2. Visit to: Magala Growers Cooperative. Sekanyonyi, Busunju Area. After meeting with Vi-‐Skogen the research group arranged a meeting with the head of the Busunju District branch. 1. Area
1.1. Geographical placement Time gap, 15-‐20 minutes by car from Busunju. 1 hour 45 minutes by car from Kampala.
1.2. Extension of the village, community, town. (Approximate distances) The village is quite extended in the region; there are big distances between households; around 6 km2.
1.3. National grid expansion possibilities Currently the national grid is not reached to the region, and as it is a relatively isolated area the national grid extension plan does not cover the site. 2. Population
2.1. Households There are 110 households members in the cooperative, accounting 8 members per household.
2.2. School covering The village has two schools and there are another 8 schools in the area.
2.3. Economical level (possibilities of consumption, will of payment, capacity of acquiring devices which need of energy, etc.)
The business is highly depended on the agricultural activities. The economical conditions are relatively higher compared to the other villages. The need of electricity is high and the pilot project promises a potential economical development. 3. Industrial/Commercial/Social activities
3.1. Main activity 3.1.1. Industrial (Cooperatives, farms, mills, etc.)
There is just one maize mill currently at the cooperative disposition. Regarding groundnuts there is one small portable machine that separates the husk from the seed. Both of the machines they work with a diesel generator. For the coffee treatment they have to move to another village where they can use a machine.
3.1.2. Commercial (Markets, stores) There are 2 grocery stores in the villages. The main goods are basic food stocks (rise, eggs, vegetables etc.) and some fast moving consumer goods (FMCG).
3.1.3. Social (Schools, cultural houses) The main social meeting point of the village is the center of the village where the research team has been doing the surveys. The villagers are given some solar lamps by the Vi-‐Skogen and the main charging point is that center.
3.2. Energy consumption per sector (estimated) 3.2.1. Industrial
For the treatment of the agricultural production the energy consumed by the cooperative is mainly the diesel. In addition the national grid electricity is the part of their industrial activities. Nevertheless this electrical consumption is taking part in another village. The estimated consumption per crop is:

38
Maize → 10 litres of diesel/day; the machine is working everyday during 2 peak months per season. 4 months/year full capacity.
3.2.2. Commercial The commercial markets have no electricity. But in the center they use the small solar charging lamps and the kerosene lamps.
3.2.3. Social The solar charging lamps and the kerosene lamps are the only accounted. The consumption of kerosene in the village due to lighting needs:
Kerosene → 2,5 litre/household and week. Kerosene price → 3.000 UGX/litre. 1.06 USD/litre. 3.3. Population involved in these activities 3.4. Further possibilities (cooperative creation, implementation of other activities,
such milling if there is not currently existing) 4. Current energy resource(s) The available energy in the village is based on oil, firewood and charcoal, all these energy sources have to be transported to the village. In comparison, the price of electricity is: Electricity → 450 UGX/kW + VAT (tax on electricity = 100 UGX/kW) 5. Biomass supply possibilities (agricultural activity)
5.1. Amount of activity (possible cover plant needs) Regarding to the households (members) of the cooperative that are producing each of the crops: • Maize, large-‐scale → 70 members – 3 acres/member • Coffee, large-‐scale → 73 members – from 1 to 4 acres/member • Beans, large-‐scale → 68 members – 1,5 acres/member • Groundnuts, small-‐scale → 20 members – 0,5 acres/member These figures are the ones that account the harvest of the whole cooperative: • Maize → 70.000 kg/season (2 seasons) – 140 tonnes/year • Coffee → 20 bags/season (2 seasons) – 70 kg/bag – 2.800 kg of coffee/year • Beans → 700 kg/member and season As lately the price of groundnuts in the market is increasing, the organization is seriously thinking on expanding the production to that product as well.
5.2. Type of crop Market production • Maize • Coffee • Beans • Groundnuts (self-‐consumption yet) 6. Social energy requirements
6.1. Households (cooking, light, etc.) 6.2. Community needs (milling, water pumping, feedstock conservation, etc.) 6.3. Other needs.
7. Conclusion This village is the most promising one in terms on existing industrial activities and the

39
potential development opportunities. The main needs of the community could be listed as following: • Electricity for agricultural activities: machinery, water pumping and milk storage. • Electricity to create new business: the trade center where the small shops are or
hair-‐dresser (which was the one of the first demands of the community) • Electricity for domestic uses: lightning, cooking • High production rate • Telecom base station near the village working under a diesel generator. • Efficient cooperative organization • Micro-‐financing possibilities, expanding machinery.
Figure 12. Community of Sekanyonyi During the Development of the Survey

40
3. Visit to: Nabumbugu Coffee farmers CO, Busunju Area. This trip was part of the visits performed with Vi-‐Skogen in the Busunju Area. The on going Vi-‐Skogen project in the site is the training and the leading implementing methods for water management and efficient plantation. They have improved significantly their potential and production rate of coffee. Vi-‐Skogen helped and assisted the farmers in order to increase their productivity by different methods based on plantation management. There is currently ongoing a micro-‐finance system within the members of the organization. There is a governmental micro-‐finance program but it is not working as good as their own, as they say. As a cooperative they work together in the sales-‐agricultural market. They say that working as a group has increased their business capacity on 600 UGX/kg of coffee, which means that, per each kilogram they sell as cooperative they earn 600 UGX more than selling the same as individual farmers. There is one member of the cooperative that owns agricultural machinery; this facility is used of the whole cooperative. 1. Area
1.1. Geographical placement Approximately 45 minutes away by car from Busunju village.
1.2. Extension of the village, community, town. (Approximate distances) The village is a bit more compact than the villages visited previously, although as most of the villages visited it covers a large territory.
1.3. National grid expansion possibilities There is access to the national grid; the main issue against it, is that the electricity price is very high compared to the demand. 2. Population
2.1. Households There are 15 groups within the cooperative organization. The groups are formed by 15 members and so there are approximately 225 households dependent on the organization.
2.2. School covering 2.3. Economical level (possibilities of consumption, will of payment, capacity of
acquiring devices which need of energy, etc.) 3. Industrial/Commercial/Social activities
3.1. Main activity 3.1.1. Industrial (Cooperatives, farms, mills, etc.)
There are some machines available for all the farmers, the whole facility for coffee treatment and for maize milling.
3.1.2. Commercial (Markets, stores) 3.1.3. Social (Schools, cultural houses)
3.2. Energy consumption per sector (estimated) 3.2.1. Industrial
The energy consumption of the community is mainly based on the amount of harvest, due to the dependence on electrical supply, and the diesel prices, the consumption is tightly related to their economical capacity. The estimation of the need of energy can be calculated out of the machinery they use.

41
For coffee treatment: • Husk treatment → 18 kW • Filter, separation of the husk and the seed → 2 kW < X < 4 kW (approx.) • Packaging (bags) → 3 kW The system is used 8 months/year, 4 months each harvest. And the running of the machines during this period depends on the coffee availability. Involved in the coffee treatment there is the previous drying. It is dried by sun-‐heat, and so it is difficult to estimate how long is the process going to take, giving them the chance to dry it with some source of heat would improve their process, thus reducing cost and speeding up the whole production.
Maize milling, 2 machines, but it is out of our range: • Maize milling engine → 30 kW • Bagging → no data. Despite of the machinery the milling of maize is just directed to household-‐use level, there is no business out of maize flour in that cooperative.
3.2.2. Commercial 3.2.3. Social
3.3. Population involved in these activities 3.4. Further possibilities (cooperative creation, implementation of other activities,
such milling if there is not currently existing) 4. Current energy resource(s) The main energy resources are the diesel, charcoal and firewood. 5. Biomass supply possibilities (agricultural activity)
5.1. Amount of activity (possible cover plant needs) There are two agricultural activities that are relevant, but just one of them is dedicated to business making, which is coffee; maize is just for domestic consumption. • Coffee: 50.000 kg/season → 100 tones of coffee produced per year, this figure is for
dried coffee. Regarding to the sale market, there is an important figure which should be remarked, the difference between selling the coffee treated or not. The gain for the organization is more than twice the price. • Not treated coffee → 2.200 UGX/kg • Treated coffee → 4.500 UGX/kg The farmers say that they are able to sell high-‐priced coffee due to the quality of the product.
5.2. Type of crop • Coffee (Market production) • Maize (Household consumption) 6. Social energy requirements
6.1. Households (cooking, light, etc.) 6.2. Community needs (milling, water pumping, feedstock conservation, etc.) 6.3. Other needs.
7. Conclusion The potential of the village, regarding the amount of production and the machinery

42
available is very high; the main problem is the proximity and the current use of the national grid. The requirements of the project constrain this place where the grid is established. The farmers claim that they are ready and in good disposition of making an economical effort to improve their facilities if the plant is finally placed there. In the Figure 13 is possible to see the headquarters of the Nabumbugu cooperative.
There are sections of the surveys that are not filled; is due to the lack of information given by the farmers and the local people. Once the surveys are complete, the selection of the potential site takes place. This is done by the analysis of the collected data and the agreement amongst all the team involved in the GP project, which is Pamoja Cleantech AB group. In the next section, the Pilot Site selected is described.
Figure 13. Nabumbugu Coffee Growers Cooperative, Headquarters

43
4.3 Pilot Area This chapter includes: grouping the data, detailing the analysis, arguing on the potential options, and the discussion amongst the researchers and the Pamoja Cleantech AB members who help to qualify the location for the pilot plant. The final decision is to place the pilot plant in Sekanyonyi, that means selecting the Magala Growers Cooperative. The relevant data for the selection of the pilot plant is given below, see Table 5, Table 6, Table 7, Table 8 and Table 9.
Table 5. General Information of the Pilot Area
Community Current Situation
Population 110 households 880 people (approx.) Area of the Village The village is spread along 6 km2
Schooling Rate 8 schools in the area (2 reachable for mini-‐grid)
High schooling among kids
Active Local Organization
Magara Cooperative 3 years of work experience
The coop. work increases social and economical possibilities among the community
2 Small-‐business (Grocery Stores) working in the area National Grid Not connected and not planned in long time period
Table 6. Agricultural Production in the Pilot Area
Current Agricultural Production
Biomass Coop. members Production Total
Maize 70 3 acres/member 140,000 kg/year Coffee 73 1 to 4 acres/member 47,600 kg/year Beans 68 1.5 acres/member 2,800 kg/year Groundnuts 20 0.5 acres/member No data 3 Milk 100 liters/day
Table 7. Household Energy Use
Household Energy Use
Cooking Use
Meals per day 3 meals total Breakfast 0.5 hours
Lunch 2 hours
Dinner 2 hours Time per meal 4.5 hours total
Energy need 3 firewood pack per day for cooking the meals Water Boiling 10 litres per household per day
Lighting Rooms lighted 5 rooms Time lighted 5 hours average
Others Micro-‐solar cell Phone charging
3 So far is just produced for self-‐consumption. Although, lately the prices in the market started rising and the cooperative is open for business considerations.

44
Table 8. Current Energy Consumption
Total Energy Consumption (Uganda GDP per capita = $500, UNData, 2011)
Source Current Consumption Price Purpose Kerosene 2.5 litre/household*week 1.06 USD/litre Lighting Diesel 70 litres/week 1.06 USD/litre Agriculture Charcoal 260 kg/month (4 bag/month) 5.33 USD/bag Cooking Firewood 3 bundles/day 0.35 USD/pack Cooking
Table 9. Machinery Power and Energy Consumption
Current Machinery
Machine Power Capacity Diesel generator 9.7 kW Maize mill 7.5 kW 400 kg/day
Energy Consumption for the Machinery
Crop Fuel Quantity Price Diesel Generator Diesel 10 litres/day4 1.06 USD/litre The area covers much of the requirements for the implementation of the pilot-‐plant. The fact is that the production rate is really high, compared to the other options. Thus, it makes this place the best of the possibilities in terms of feedstock supply and potential of creating new productive activities; see Table 6. The capacity of the agriculture cooperative regarding to the economical potential is promising as well, since they have the possibility of enhancing the farmers by micro-‐financing. The only weakness is the current disposition of machinery, even though this becomes less problematic because of the micro-‐finance possibilities; see Table 9. The chance of allocating a mill, in the community, would be crucial. First of all, it is important to reduce the distances that the farmers have to cover in order to process their products, and secondly, all the farmers could get benefit out of it (even the ones that do not belong to the cooperative). Besides, the placement of the GP would not be a problem since all the facilities are already established in the same area or nearby the cooperative. They are close to each other in order to improve the efficiency of the production and reducing time and costs. Another positive key point of the location is the presence of a telecom tower in the region, which should be the main customer and the principal revenue stream for the Pamoja Cleantech AB business model. Once the location is decided, the next step is to define the main life-‐services that can be provided to the community, both in the households and the cooperative.
4 Working on 7 hour/day regime.

45
4.4 Applications and Life-‐Services Throughout the site visits, the surveys and the analysis of the data collected during the field trip, see Tables 5 to Table 9, the main needs of the society have been identified. In order to convert this information into a useful source of knowledge about the life-‐services to be provided, the following tables link the potential applications studied (section 2.3 The Green Plant and the Potential Applications) to the life-‐services needed that those could cover; see Table 10 and Table 11. The data exposed in the Table 10 and Table 11, is organized according to the level of impact, that is community or productive use. These terms are defined below for a better understanding;
• Community (see Table 10) It includes all services that are meant to attend social needs. Not implicating any direct economical gain. There are two sub-‐levels:
o Community as a global, village or organizations within the village. o Household, individual family.
• Productive Use (see Table 11) It regards mainly agricultural-‐related activities. The offer of the desired energy is ought to be the tool that has to foster an enlargement of the existing economical activities, promoting the development of the area and, therefore, an improvement of the local economic conditions. The benefits that are described on the following tables (Table 10 and Table 11) are the direct contribution of the life-‐services to the people, the positive impact intended to provide.

46
Table 10. Potential Applications, Life-‐Services and Benefits for the Community Level
Community Level
Potential Application
Life-‐Service Benefit
Community
Battery Charging
Lighting Time efficiency, productivity increase, educational progress, improved security and a richer social life
Battery charging
Locals don’t have to go to another town to charge their cell-‐phones’ batteries
Leisure time Local people can listen the radio or to do any other activity to spend their spare time
Mini-‐Grid
Lighting Time efficiency, health improvement in the households, productivity increase, educational progress, improved security and a richer social life
Electrification of facilities
Community facilities, schools, cooking spots, etc.
Battery charging
Locals don’t have to go to another town to charge their batteries. Time efficiency.
Health-‐care Improvement in health-‐care facilities or possibility of establishing new ones
Beauty Salon Possible improvement in self-‐care and hygienic conditions
Refrigeration of food
Possibility of storing food products for a longer time and in better conditions
Leisure time Local people can listen the radio or to do any other activity to spend their spare time
Absorption Chiller
Refrigeration Possibility of storing food products for a longer time and in better conditions
Household
Battery Charging
Lighting Time efficiency, health improvement, educational progress
Phone charging
Possibility of charging devices at home
Leisure time Members can use their increased leisure time listening radio, or doing other activities
Mini-‐Grid
Lighting Time efficiency, health improvement, educational progress
Battery charging
Possibility of charging devices at home
Leisure time Members can use their increased leisure time listening radio, or doing other activities
Refrigeration of food
Possibility of storing food products for a longer time and in better conditions

47
Table 11. Potential Applications, Life-‐Services and Benefits for the Productive Use Level
Productive Use Level
Potential Application
Life-‐Services Benefit
Mini-‐Grid
Lighting Opening business longer hours
Increa
sed Prod
uctiv
ity and
Econo
mical Develop
men
t
Electricity Power
Possibility of working with better and more equipment Time-‐saving devices Capacity for better and more equipment Improvement in product processing
Heat Pipe Exchanger
Drier Speed up drying process, capacity of previewing drying time and planning the rest of the processing
Refrigeration Refrigeration of spaces such as the container or the battery hub
Recuperator Drier
Speed up drying process, capacity of previewing drying time and planning the rest of the processing
Refrigeration Refrigeration of spaces such as the container or the battery hub
Absorption Chiller
Milk Storage Refrigeration of a closed thermally-‐isolated space where milk can be stored at an appropriate temperature
Refrigeration Refrigeration of spaces such as the container or the battery hub
ORC Turbine
Mechanical Shaft
Providing shaft for the functioning of the mills and other agricultural processing machinery
Electricity Production
Capacity of producing a small amount of electricity for other purpose
As a brief and first conclusion of the applications’ overview, it can be seen following the Table 10 and Table 11, that the systems that can cover most of the needs are the ones related to rural electrification; battery charging system and mini-‐grid. This analysis must be used as an overview of all the possible uses that can be given to the energy sources available. The definitive applications, the study of how each of them could be commercialized and served to the community or the agricultural processes will be explained in the section 5 Results.
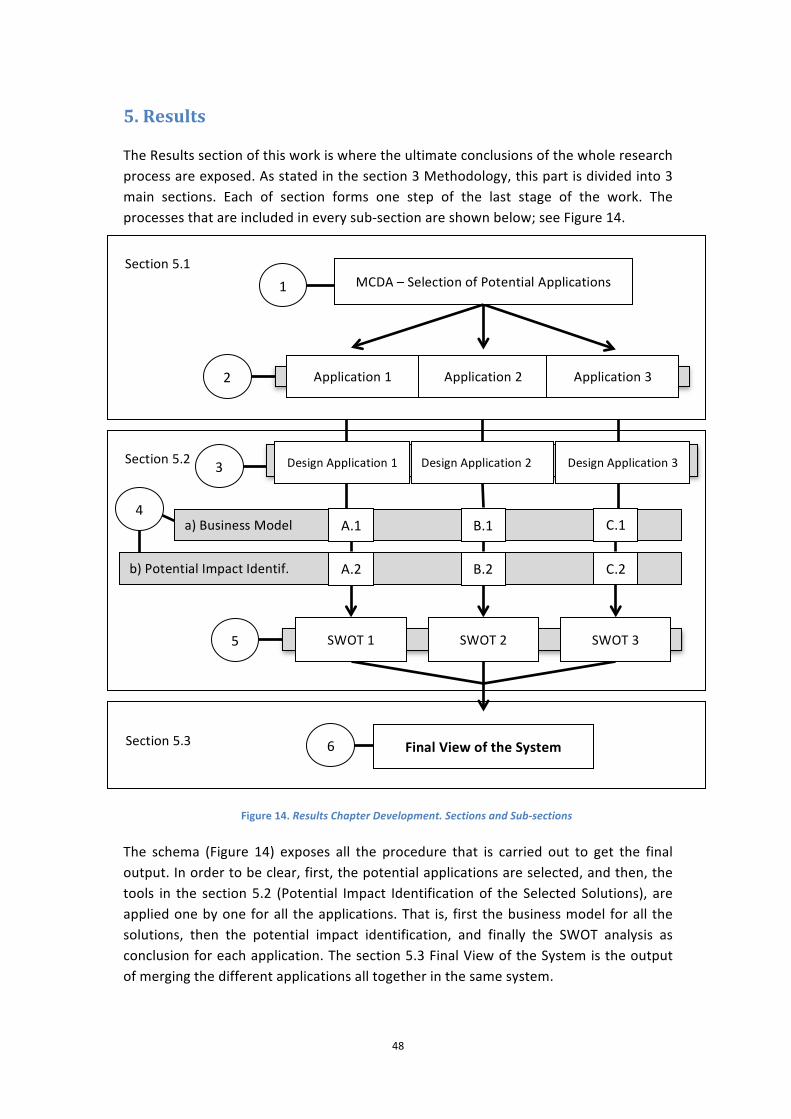
48
5. Results
The Results section of this work is where the ultimate conclusions of the whole research process are exposed. As stated in the section 3 Methodology, this part is divided into 3 main sections. Each of section forms one step of the last stage of the work. The processes that are included in every sub-‐section are shown below; see Figure 14.
The schema (Figure 14) exposes all the procedure that is carried out to get the final output. In order to be clear, first, the potential applications are selected, and then, the tools in the section 5.2 (Potential Impact Identification of the Selected Solutions), are applied one by one for all the applications. That is, first the business model for all the solutions, then the potential impact identification, and finally the SWOT analysis as conclusion for each application. The section 5.3 Final View of the System is the output of merging the different applications all together in the same system.
Final View of the System 6
2 Application 2 Application 3 Application 1
MCDA – Selection of Potential Applications 1
Section 5.2
Section 5.1
3 Design Application 2 Design Application 3 Design Application 1
5 SWOT 2 SWOT 3 SWOT 1
a) Business Model
b) Potential Impact Identif.
4 A.1
A.2
B.1
B.2
C.1
C.2
Section 5.3
Figure 14. Results Chapter Development. Sections and Sub-‐sections

49
5.1 Selection of Possible Solutions – MCDA The MCDA is the key decision making process of the research. The approach is used in order to compare fairly the different solutions exposed. All the possible applications are analyzed with the MCDA. To apply successfully the method for each solution a spreadsheet table is prepared. The table consists of the potential applications and the criteria related to them (including the weight for each criterion). An overview of the possible market solutions is done to find reliable data of the different applications regarding market issues as the economical costs or the working conditions. The brochures and descriptions of the chosen options are shown in the Appendix V. The previously mentioned spreadsheet chart has been fulfilled in order to perform the decision-‐making calculations. The approach is explained more detailed in the methodology part (3.1 Selection of Possible Solutions – MCDA) and a useful example is given in the Appendix IV. A layout of the starting chart can be seen in Figure 15.
Economical Cost (USD)
Potential
Solutions
Criteria Initial
investment Maintenance
Economical
Gross
Benefit for
Pamoja
Development
empowerment
New
Business
Opportunity
Population
coverage
(%)
Electricity
Consumpt.
(kWh/y)
Environmental
Care
Lifespan
(years)
Weight 0,2 0,1 0,1 0,15 0,1 0,1 0,2 0,05
A Biochar
B
Battery
Charging
system
C Mini-‐grid
D Heat pipe
Exchanger
E Recuperator
G Absorption
Chiller
I
Organic
Rankine
Cycle
Turbine
Figure 15. Initial MCDA Chart
This chart is the main tool used for the MCDA process. The blank cells are filled with the information taken from the brochures together with the data extracted out of the section 4.3 Pilot Area and 4.4 Applications and Life-‐Services. In the Appendix VII can be found a summary of the relevant data used for each application, as a result of merging the sub-‐sections previously mentioned.

50
Once the aforesaid data is added to the previous chart, it is time to analyse the results. In the next chart, see Figure 16, the cells are filled appropriately. It is clear that, as mentioned in the section 3.1 Selection of Possible Solutions – MCDA, some of the criteria cannot be assessed by an absolute value, then it is given a relative value, which is equivalent to the comparison of all the applications for the same criteria; from the best(s) that is given a 10, down to the middle(s) with a 5 and ending with the worst(s) given a 1. The chart is not ranked or it shows at first sight any conclusion. The chart is used as a matrix that has to be mathematically operated, and just after this the ranking can be extracted.
Economical Cost (USD)
Potential
Solutions
Criteria Initial
investment Maintenance
Economical
Gross
Benefit for
Pamoja
Development
empowerment
New
Business
Oportunity
Population
coverage
(%)
Electricity
Consumption
(kWh/y)
Environ-‐
mental
Care
Lifespan
(years)
Weight 0,2 0,1 0,1 0,15 0,1 0,1 0,2 0,05
A Biochar
1 3 4 1 100 1 10 1
B
Battery
Charging
system
340 No Data 10 5 3 70 1 6 7
C Mini-‐grid 9700,00
5 years free
warranty
and optional
prolong
10 10 10 90 1 5 15
D Heat pipe
Exchanger 2820,00
5 year
warranty
73.93 USD
cost
1 5 5 63,63 44,6 10 10
E Recuperator
NO APPLICABLE
F Absorption
Chiller 45183,26 No data 10 10 1 100 518,4 5 1
G
Organic
Rankine
Cycle
Turbine
15000,00 No warranty
Likely failure 5 5 5 80 1 5 1
Figure 16. MCDA Chart with Values
There are two key factors that have to be highlighted to avoid leading to confusion. 1. The fact that 1 is the lower valuation for all the criteria is due to the fact that 0
cannot be included in the mathematical calculations. 2. Two of the criteria that can be assessed with absolute values need special
treatment. In the case of “Economical Cost” and “Electricity consumption” as higher is the value, the worse is the application; this is the opposite reasoning

51
than the used in all the rest of criteria. This is corrected by a modification in the mathematical procedure, switching up the values in the ratio.
Once the mathematical operations described in the example, see Appendix IV, are applied in this case with the data given the results are the ones shown below, see Table 12.
Table 12. Valuation and Ranking for MCDA
Rate Value Comparison Final Ranking
R(A/B) 2,475717592 A > B 1 A – Biochar
R(B/C) 1,76189639 C > B 2 C – Mini-‐Grid
R(A/C) 3,641242949 A > C 3 B – Battery Charging System
R(C/D) 1,57232776 C >D 4 D – Heat Pipe Exchanger
R(C/F) 4,067583517 C > F 5 G – ORC Turbine
R(C/G) 1,61118058 C > I 6 F – Absorption Chiller
R(B/G) 2,369696748 B > I
R(B/D) 2,312552686 B > D
R(D/G) 1,024710383 D > I The Table 12 shows the relative value of one application to the other, and so, having these measures for all the applications allows the creation of the ranking that prioritize the potential applications regarding the criteria chosen and its importance for the research. Thus, the selection of the potential applications is defined below; see Table 13.
Table 13. Selected Potential Applications
Alternative Status Main Advantages Biochar 1st Selected No initial cost. Covers entire agriculture
cooperative. Highest environmental care
Mini-‐grid 2nd Selected Major economical benefit for Pamoja. Highest
development and business creation opportunities.
Rural electrification solution.
BCS 3rd Selected Economical benefit for Pamoja. Low initial cost.
Minor rural electrification solution. Minor
development and business creation opportunities.
Heat Pipe Exchanger 4th Selected High environmental care. Minor development and
business creation opportunities.
Organic Ranking Cycle Turbine
5th Not-‐selected
Abortion Chiller 6th Not-‐selected Recuperator Eliminated

52
Some conclusions can be extracted from this last procedure and its results. The reason of why biochar is the first alternative is mainly about the economical aspect. The application does not have any initial cost and it has one of the two highest environmental care grades. The economical and environmental criteria are the two with highest weight. Hence, they affect the result more than the others. On the other hand, the advantage and strength of the mini-‐grid application as second product, is coming from its high potential of economical benefit, development empowerment and business opportunities. Besides, the application itself covers 90% of the population. The last two selected options, the BCS system and heat pipe exchanger application, have common characteristics. The main difference between the two solutions is derived from the economical benefit, where the BCS has a higher grade. Despite of the great result that biochar obtained in the MCDA, the design of the biochar is not developed, as there is not a system as itself. The impacts are pretty unknown and have been described in the section 2.3.1 Biochar Application. The rest of the applications’ development is done below. The development of the work, as shown in Figure 14, is done section by section, where the three selected solutions are analyzed before moving forward to the further sub-‐section. In conclusion, four applications are to be developed and designed. The development of the selected solutions is done in the following parts, based on the data collected and analyzed in the previous sections and in this assessment.
5.2 Potential Impact Identification of the Selected Solutions In this section the selected solutions are to be designed and analyzed, so an improved complete system can be built up afterwards. As it is described in the section 3 Methodology, the first stage of this chapter is to give a general vision of the selected applications.
5.2.1 General View of the Application
Previous to the further analysis of the selected applications, there is a mandatory first step; the introduction and assessment of the system design, has to be done in order to have a good understanding of the processes on going, and so help to identify the related opportunities and impacts. This part builds what is fundamentally a starting point to base the further analysis and to identify the potential impacts. The design given in this part is the base for the final system, and only the small modifications that could improve it significantly are the ones that would be performed. The development of this part starts with the design of the mini-‐grid (A), then the BCS (B) and finally the heat pipe exchanger (C).
A. Mini-‐Grid To start understanding what the mini-‐grid could mean for the local people is important

53
to see the direct benefits of the life-‐services that each application can provide. In order to do that the table below shows the relation between those elements for the mini-‐grid, see Table 14 and Table 15. The data collected throughout the field trip and previously assessed in the project is used to achieve these conclusions (Table 6 to Table 11). Although, it is not the only used source of information; other papers and official reports, such as the report of the World Bank Independent Evaluation Group, (2008), have been taken into account as an example of already assessed impacts. Table 14. Potential Life-‐Services and Benefits Provided by the Mini-‐Grid for the Community & Household Level
COMMUNITY AND HOUSEHOLD LEVEL
Life-‐Service Benefits
Lighting
Time efficiency: Providing lighting could save time of gathering other possible light sources as firewood or kerosene. Another time-‐saver comes after the chance of working or doing home-‐tasks after the natural light is gone
Productivity increase: The possibility of working longer hours and more easily. Clear and instant lighting could improve community conditions allowing the implementation of communal productive activities
Educational progress: Kids and adults can read and improve their educational level in community areas provided with lighting. They could have after school lessons in a shared house with lighting
Improved security: Street or communal lighting could provide security during night-‐time due to the increase on illumination; robberies or burglaries could be reduced or more likely spotted
Richer social life: The lighting of commune areas would activate social activities and the likeliness of sharing the free time, strengthening the relationship between community members
Health-‐care: The possibility of reducing the kerosene lamps, or other lighting devices that mean combustion of any fuel, would directly affect the quality of indoor air, reducing the percentage of harmful particles breathed by the people inside any commune shelter
Battery Charging
The local people would not have to go to other villages to charge the batteries of the different devices like phones, radios or any other. It would imply timesaving as well.
Health Care The opportunity of starting a health-‐care service that could provide the community with first-‐aid kits or other public health items.
Beauty Salon The chance of having a beauty salon service in the area would directly imply a timesaving for those services, avoiding the trips to other places to have access to the service.
Refrigeration of food
The possibility of storing food products, for a longer time and in better conditions for community consumption, would mean a better feeding and increased capacity to avoid digestion diseases.
Leisure time The capacity of spending the leisure time in better conditions, increasing comfort and giving the chance of using electronic devices as radios or televisions, which at the same time can help to be aware of political, social or any other kind of events.

54
Table 15. Potential Life-‐Services and Benefits provided by the Mini-‐Grid for the Productive Use Level
PRODUCTIVE USE LEVEL
Life-‐Service Benefits
Lighting
The opportunity of longer business time; opening after sunset could increase revenues of shops and home small-‐scale businesses. It would also allow the agricultural processing activities, such the husk processing of coffee, to be carried out during more hours a day, reducing the amount of days used to do this activity, and so, getting a more efficient use of time.
Electricity Power
Increase on revenues and give the possibility of expand the business capacity.
Timesaving and more efficient devices.
Improvement in product processing methods
After describing which are the potential contributions of the mini-‐grid to the community and the cooperative it is time to describe in detail what is the mini-‐grid, which are its parts, and how would it look like according to the data collected in the surveys. The design of the mini-‐grid has been mainly based in the methodology described in the Mini-‐grid Design Manual (Inversin, 2000). Although, this design work has been done with the best intentions, the theoretical approach has multiple drawbacks, and the major of those is the lack of specific data and real figures. The estimations that have been made during the development of this work have been based in the knowledge gathered all along the report and the thesis surveys and field trips. The aim of this design is to illustrate how the mini-‐grid would look like, instead of reproducing an actual situation in Sekanyonyi. The design has not been done until the last steps due to the reasons mentioned before. Following the design guide defined by Inversin (2000), just the 3 first steps have been included in this report. Although another 3 steps can be found in the Appendix VIII, these are related to a more technical approach to the line and its characteristics, which can give an idea of the cost of the line conductor, and thus, a more accurate budget preview. The parts defined below are the mini-‐grid demand assessment (I); the area mapping (II); and the system layout (III).
I. Demand Assessment. Mini-‐Grid Loads The evaluation of possible demand is the first step to start the design of the mini-‐grid delivery system. The demand assessment has been based on the previously collected data and in the ideas and concepts developed all along the work and research. The telecom tower supply, as it has been mentioned in the previous parts of this work (Section 2.2 The Green Plant Concept, System Boundaries and Stakeholders) is taken in account in order not to consume its part of the supply, but is not included in the design performed due to lack of information about its exact placement and functioning. The demand of the mini-‐grid is based on the 3 big groups of consumption that can be

55
found in the pilot area, the Households (a), the Community Services (b) and the Productive Use (c). The differentiation of these 3 big units can be seen since the section 4.3 Pilot Area (from Table 5 to Table 9).
a) Household
The supply to the households, according to the research done, will be pointing mainly low-‐power demanding items like lighting, radios or phone chargers. Therefore, the simultaneous supply will not be high compared to the other uses. The estimation of coincident load per household can be seen in Table 16.
Table 16. Estimated Electricity Consumption at Household Level
Item Load Bulb 60 W Radio 5 W Phone charger 5 W Others 10 W Total coincident load/household 80 W Total coincident load (110 household) 8.8 kW
In that way, it is possible to see, Table 16, that the maximum coincident load demanded by all households will be less than 9 kW, and so it is possible to supply the telecom tower (1 kW), which is meant to be the main GP customer and the peak household load at the same time.
b) Community Level The delivering of energy to the community amenities is, at that point, still uncertain because there is no exact data about the demand that these activities will hold. To set a starting minimum load of demand for community services, the facilities that are placed in the village, the 2 schools and the 2 grocery stores, are accounted. So, the maximum load per facility is expected can be seen in Table 17.
Table 17. Estimated Electricity Consumption at Community Service Level
Activity Amount Load Total load Schools (2) Lighting (bulbs) 15 60 W 900 W
Leisure 5 100 W 500 W Total load per one school 700 W Grocery Stores (2)
Lighting (bulbs) 6 60 W 360 W Small battery charging 6 100 W 600 W Others 6 100 W 600 W
Total load per one grocery store 780 W Total load 2.96 kW
The assessed demand is accounting the possible applications mentioned in the previous stages of this research (Section 4.4 Applications and Life-‐Services). As a conclusion and

56
after analyzing the Table 17, two basic ideas can be identified: • The assessed consumption per facility is the maximum that each facility can have,
and so, the lining design will be based on this maximum energy demand per customer.
• The total load calculated is the minimum load that must be foreseen in the designing of line for the global community service supply. It must be the starting point and a likely reference for future grid extensions.
c) Productive Use
The demand of electricity for productive uses is reduced to the electrical motors, the electric devices and the lighting of the facilities, where the agricultural procedures are carried out. These activities are:
• Agricultural Activities. Seed drying (Heat Pipe Exchanger, see Appendix VI); Milling; and Lighting
• Battery System - Agricultural Activities: In order to obtain the maximum efficiency in energy management, accounting the seasons and knowing about the agricultural processes is very important, especially because drying is previous to milling, and it is likely that all the harvest cannot be dried at the same time, so the first milling activity can be done during the last seeds are being dried. In the next table the demand for these agricultural activities is assessed, see Table 18.
Table 18. Estimated Electricity Consumption at Agricultural Level
Activity Duration5 Energy Demand Seed dryer 3 weeks per season 2.2 kW
Mill 2 months per season 9.54 kW6
Mill lighting (2 bulbs) During milling 120 W
Total Load Coincident One week per season 9.82 kW
Together with the Table 18, the Figure 17 show that the peak supply capacity of 12.2 kW it is almost reached one week per season; so, there is the harm of not being able to perform normally the daily productive tasks if the system capacity is exceeded. In order to prevent this to happen, the farmers will have to be aware and manage the productivity times to avoid possible problems in the energy supply, the coincidence of the two main agricultural activities (milling and seed drying) will be not possible, thus the selection of which activity is held will have to be done by the farmers.
5 The farmers gave the data regarding the duration of the agricultural activities. 6 The conditions of peak demand change for the start-‐up period, see Appendix VIII.

57
Figure 17. Agricultural Peak Load Coincidence in Harvesting Season
- Battery Charging System: A battery back-‐up system is integrated into the mini-‐grid. It is not an application but part of the mini-‐grid system itself. It should not be considered as a separated service. The battery charging system can be connected to the grid during the low demand hours (night time), thus it is used as back–up resource during extreme demand-‐peak hours; this is the reason why there are no calculations about its demand. There is another benefit related to the implementation of this solution; the use of this energy storage during the night would increase the load factor of the system making it more efficient. The battery storage power is of 6.72 kW, and the inverter power has a maximum of 2.2 kWh. Thus, the batteries could be charged in less than 4 hours and be used during daytime if there is the need. Looking to the diagram, see Figure 18, is easy to see how the battery system works. It charges from the mini-‐grid when the demand is low. It stores up to 6.72 kWh that can be supplied whenever the demand reaches a point that cannot be covered by the generator of the GP. As it is not a principal demand it would be consuming in low-‐demand time periods there is no problem about load.
0
2
4
6
8
10
12
14
1 2 3 4 5 6 7 8 9 10
Total Consumpyon Milling Consumpyon Seed Drying Consumpyon

58
Figure 18. Conceptual Layout of the Mini-‐Grid and the Battery Charging System
After stating all the demand that will be loading the mini-‐grid, few uncertainties arise, and so, the following explanations are done in order to clarify those possible doubts;
• The demand of the community and household segments are not overlapping because, as it is understood by the researchers, the main demand of these two groups occurs in different time laps, and both groups are including the same people but performing different activities. E.g. the owner of a micro-‐business is demanding the household supply when he/she is not demanding for his/her business.
• During the harvesting season, when the productive uses are in its maximum demand of electricity, the members of the community should be aware of using less energy, so the productivity is not affected.
In the table below, see Table 19, a summary of the demand assessment is shown. As previously stated, it is important to understand that not all the demand is coincident on time, and the responsible consumption must be a remarkable point highlighted to locals when implementing the system into the village.
!"#$%&##'$()*'+$
,-'-.%&-/$
(&0/1234#$56#$70881'-+9$:#&4-2#$
;016#"0)/6$
<'4#&+#&$ =*>#&9$ =*>#&9$ =*>#&9$
=*>#&9$ =*>#&9$ =*>#&9$
!"#$%&'()*%"+$',**-'
,-'-.%&-/$

59
Table 19. Summary of the Demand Assessment
Level Location Nº Locations Item
Household Individual Household 110
Light Bulb Radio Phone Charger Others
Community
School 2 Light Bulb Leisure
Grocery Store 2 Light Bulb Battery Charging Others
Productive Use
Agriculture 1 Seed Drier
Mill Light bulb (mill light)
Battery Charging 1 Inverter/Batteries II. Mapping the Area
The area of the Sekanyonyi village, where the GP pilot plant is to be placed is shown in the Figure 19. The highlighted elements on the picture are the main delivery points of electricity; those are placed regarding the location of the potential users of the energy. The placement of these spots is estimated under the criteria of the researchers due to the lack of exact information. It might not be the actual distribution but for the purpose of the study it can be used as an example of how to develop the mini-‐grid design. The snapshot is taken from the software “Google Earth”; the distances and the line distribution are also based in the information available in this software. The incapacity of accessing another mapping tool forced the authors of the thesis to take advantage of this tool. When looking to the Figure 19, six different elements can be found. Amongst those, the costumers defined in the previous part can be found. These groups conform as well the backbone of the village, and all are represented in the data collected during the field trip. Also, the GP and a key spot for the mini-‐grid distribution are included. In the Figure 19 is easy to see that the lines are located all along the roads and paths that connect the different households and parts of the village, this is made in order to facilitate its installation and its access in case of failure.

60
Figure 19. Sekanyonyi Snapshot. Mini-‐Grid Distribution in the Village
A description of each of the elements is done below. • The Green Plant: It is the source of the energy. The placement of the GP has
been selected regarding its functioning and concept. As an industrial activity is being carried out in it, the fact that noise and other disturbing factors are likely to happen pushed the location of the GP away from the inhabited area of the village.
• Sekanyonyi Centre, key distribution spot: It is one of the main points in the distribution line. The mini-‐grid is spread around the village, and this middle point is the perfect location to set a distribution position to reach the rest of the elements in the grid. Also, taking in account the possibility of expanding the grid over time this point gives an advantageous situation.

61
• Trade Centre & Grocery Store: These two points situate the two stores that are in the village; they are separated so they cover a greater area regarding the service provision. The given names are different so it is easy to distinguish them.
• School 1 & 2: The two schools that are in the village. As the stores, the fact that those facilities are dispersed reduces the distances that most of the kids have to cover.
• Cluster 1,2,3,4,5 & 6: The clusters refer to the household groups. The fact that it is not possible to know which households will or not be connected to the mini-‐grid since the beginning, forces to use this kind of method. The mini-‐grid will reach these distribution points named clusters and then, the households that wish and are prepared will be easily able to connect to the distribution line. The number of households per cluster is defined in Table 20.
Table 20. Distribution of Households per Cluster
Cluster nº Households Cluster 1 25 Cluster 2 25 Cluster 3 10 Cluster 4 8 Cluster 5 7 Cluster 6 35 Total 110
This distribution is made according to the position of each cluster in the map. Cluster 6, as is the most centric, it is the one surrounded by more households, and so, it is the one that is more likely to serve more customers. The same logic has been applied to the consideration of the rest of the groups. Another factor that affected to this decision was the fact that the longitude of the line, which is connecting cluster 6, is shorter than the rest but the one to cluster 5. And this issue is relevant when calculating the line size and the conductor, and so, directly related to the budget.
• Productive Activity: The productive activity area is related to the industrial and agricultural activities. It is placed beside the GP to reduce losses in electricity transmission and separated of the urban area for the same reasons than the GP.
III. System Layout
The distribution of maximum loads of the system, the distances within the delivery lines and the overview of the mini-‐grid are explained in this stage of the design. It is useful to have a conceptual outlook of the system and to understand how to approach the steps of the design as the selection of the conductors, the sizing of the lines or the implementation of the poles, those further technical stages are exposed in the Appendix VIII. The evaluation of the coincident loads among the customers and the lines needs to be assessed, and as it is done in the first stage of the design, a table related to the layout

62
with the relevant data of the system is shown next, see Table 21.
Table 21. Distribution of Mini-‐Grid Lines and Coincident Load per Line
Line Start End Peak load/line (kW) Distance (km)
Main Green Plant Sekanyonyi Centre 10 0.37
1 Main line Grocery Store 0.78 0.01
2 Sekanyonyi Centre Cluster 1 2 0.15
3 Sekanyonyi Centre School 1 1.5 0.2
3.1 School 1 Cluster 3 0.8 0,05
4 Sekanyonyi Centre Trade Centre 0.78 0.1
5 Sekanyonyi Centre Cluster 2 3.34 0.1
5.1 Line 5 School 2 1.34 0.3
5.2 School 2 Cluster 4 0.64 0.1
6 Green Plant Cluster 5 0.56 0.34
7 Green Plant Productive Activities 7.5 0.1
The lines defined in Table 21 are the ones that can be seen in the Figure 19. As mentioned, the distances are defined according to the data in the software used. The peak-‐load/line defined is the maximum energy that could pass through each line; thus, this maximum load will establish the base for the technical development of the mini-‐grid done in Appendix VIII. In order to fill in the Table 21 with the appropriate coincident load per line, a more deep analysis is done looking directly to the coincident load per user, gathering users per lines, and finally evaluating the coincident load per line of distribution. This is shown below; see Table 22 and Table 23.
Table 22. Maximum Coincident Load per Cluster
Cluster Nº Households Coincident load per cluster (W) Cluster 1 25 2000 Cluster 2 25 2000 Cluster 3 10 800 Cluster 4 8 640 Cluster 5 7 560 Cluster 6 35 2800
The assessment of the loads is done according to the data from Table 16 and Table 20. The Table 23 is filled in with the data from Table 17 and Table 18.

63
Table 23. Maximum Coincident Load per Activity
End user Coincident load per user (W) Grocery Store 780 Trade Centre 780 School 1 700 School 2 700 Productive Uses 7500
Finally, a conceptual scheme, with the line distribution, is done to facilitate the understanding of the line system, see Figure 20. Under the maximum load, the main line will have to bear 10 kW, as it is the maximum supply of electricity at mini-‐grid disposal. A critical doubt that could appear is related to the battery charging system. It is not counted in the maximum coincident load per line because it would not change anything. There are three distribution lines that go out of the GP, and so, as the maximum load that the GP and the batteries could have is 12.2 kW, and the maximum load of the three lines is 18.06 kW (Line 1, Line 6 and Line 7), the electricity can be distributed through the different lines to avoid possible problems. The design assumes as well that the 10 kW include the telecom tower, as it could be connected to the Line 1.
Figure 20. Conceptual Schema of the Line Distribution
The feasibility of this system is highly dependent on the basis that has been explained in other parts of the research. The energy source capacity is limited to 9 kW, and so, it is very important to remind that the electricity consumption is tightly related to the

64
season (agricultural means), to the day period (community load and household) and the responsibility of the consumers to not demand high amount of energy when is not recommended. The rest of the relevant calculations and the processes carried out in order to have a more detailed view of the mini-‐grid design are exposed in Appendix VIII. The reason of doing so is based in the fact that the budget conformation would be extremely inaccurate otherwise. The final conceptual design of the mini-‐grid after all the calculations done in the Appendix VIII is shown in the Figure 21.
Figure 21. Final Conceptual Diagram of the Mini-‐Grid, Lines and Loads
B. Battery Charging Station The battery charging station (BCS) is one of the applications, which are aimed to cover the basic needs of the community by the electrification. As it has been discussed before, there are several examples on this issue. However, this application aims to improve those existing models and modify it in a better and more sustainable way. Hence, the product provides a sustainability approach in terms of environmental and economical aspects and promises improvements on social conditions. The overall benefits could be listed as follows, see Table 24 for the community level approach and Table 25 for the productive uses.
!"#$%&'()*+,),*! "#$$#%&'! ())*!*+,#%&'! -#&./%&'
0.)'1+))%'2$3%4'
-./)"0*10,2)3*
1+56)+,'(45+)'
7$894)+':'
(6.55$':'
7$894)+';'
()<3%,5%,#'7)%4+)'
0+3*)'7)%4+)'
7$894)+'='
7$894)+'>'' (6.55$'>'' 7$894)+'?'
7$894)+'@'
-53*'ABB'C'-53*'ADB'C'-53*'E'=@B'C'-53*'DBB'C'-53*'F'>'<C'-53*'F'@'<C'-#%)'(#G)'?HB'-#%)'(#G)'>'-#%)'(#G)'='

65
Table 24. BSC Potential Life-‐Services and Benefits for the Community and Household Level
COMMUNITY AND HOUSEHOLD LEVEL
Life-‐Service Benefits
Lighting
Time efficiency: Providing lighting could save time of gathering other possible light sources as firewood or kerosene. Another time-‐saver comes after the chance of working or doing home-‐tasks after the natural light is gone
Productivity increase: The possibility of working longer hours and more easily. Clear and instant lighting could improve community conditions allowing the implementation of communal productive activities
Educational progress: Kids and adults can read and improve their educational level in community areas provided with lighting. They could have after school lessons in a shared house with lighting
Improved security: Street or communal lighting could provide security during night-‐time due to the increase on illumination; robberies or burglaries could be reduced or more likely spotted
Richer social life: The lighting of commune areas would activate social activities and the likeliness of sharing the free time, strengthening the relationship between community members
Health improvement: The possibility of reducing the kerosene lamps, or other lighting devices that mean combustion of any fuel, would directly affect the quality of indoor air.
Battery Charging
The local people would not have to go to other villages to charge the batteries of the different devices like phones, radios or any other. It would imply timesaving as well.
Leisure time The capacity of spending the leisure time in better conditions, increasing comfort and giving the chance of using electronic devices as radios or televisions, which at the same time can help to be aware of political, social or any other kind of events.
Table 25. BSC Potential Life-‐Services and Benefits for the Productive Use Level
PRODUCTIVE USE LEVEL
Life-‐Service Benefits
Lighting Opening business longer time, after sunset could increase revenues of shops and home small-‐scale businesses.
Electricity Power
Possibility of working with better and more equipment e.g. beauty salon e.g. hair cutting machine
The battery charging system has two main components. The first one is the rectifier, which is an electrical device that converts alternating current (AC) to direct current (DC). The rectifier converts AC, the generator current, to DC in order to charge the batteries. The second device is coming right after the rectifier, the charge controller. This equipment is used to ensure that the system is working, and protects it against possible overloads (in order to protect the batteries and the generator). The costs of rectifiers

66
are dependent to the specification and the design of the device; it means that for different output power and ampere the cost may vary. In this case, the authors have desired to be able to charge 6 batteries at the same time. The capacity with 1 or 2 batteries would cause bottlenecks in the system and having a large capacity would be too costly for a small village and cause the idle costs. Hence, the rectifier is designed to supply 6 batteries at the same time with an output of 72V and 15A. The supplier has given the price of the desired device as 340 USD. The battery charging station business model is build up to serve any battery owner from or outside of the pilot village. However, due to budget constraints and in order to be more economical efficient, the start up design is assumed to run with 30 household members from the village. One regular car battery costs approximately 100 USD (the cost is expecting to be decreased by having a battery manufacturer partner). So, the battery purchase will be 3000 USD in total. Of course the foreigners will be able to use the station during the starting up period. For a better understanding of the system a diagram shows the concept of the BCS, see Figure 22.
Figure 22. Conceptual Diagram of the BCS
C. Heat Pipe Exchanger
One of the main objectives of the project is to help the local people to cover their needs, to improve their current life-‐services or to add value to its agricultural harvest, and in doing so, if it is possible, re-‐use a waste of energy providing a more sustainable approach to the concept. Chasing this purpose, the application that is described below fulfills the requirements, at first sight. In order to have a better and deeper knowledge of the real capacity and potential of heat pipe exchanger a detailed analysis has been performed. It is covering the design of the application, passing through a business model and ending with the evaluation of the likely impacts on the local population.
!"#$%&##'$()*'+$
!"#$%"&'()*)+,&)-'
./0"&1' ./0"&1'
./0"&1' ./0"&1'
./0"&1'./0"&1'
,'-$./#&$ ./0"&1'23/&4)*4'56/$7*'
27*6&788"&'

67
As a previous overview, two characteristics that describe the benefits that the system could bring are stated: • Speed up drying process: applicable only for the coffee drying process. Currently,
this process is done by natural ways: sun drying. The drying process by heat pipe system is expected to decrease the drying process time and also eliminate the process disturbances due to the weather conditions such as rain.
• Capacity of forecasting drying time and planning the rest of the processing: the duration of the process is directly related to the weather conditions. However, by applying this system, it is possible to reach a more certain drying process. This opportunity would allow the agriculture cooperative to forecast the production activities and provide to maintain better relationship with the customer in terms of delivery time and amount.
The design of the heat pipe exchanger, as well as its characteristics and working specifications, are given by the supplier’s particular design. The main work done in this stage has been to adapt the device to the GP working conditions, trying to maximize the benefits and seeking to obtain the best results for all the stakeholders. In order to know which device was the more appropriate for the purposes seek by the researchers and the application success, the sizing of the machine capacity had to be assessed. As it is obvious, greater capacity means greater cost, and so, the equilibrium between those two elements is the basic starting point for the selection of the best equipment. All the calculations related to the sizing of the machine can be found in the Appendix IX. The result of the calculations performed in the Appendix IX is that the device selected is the model CC200. A key point is that 2 devices will be applied in order to achieve a high level of efficiency; obviously this affects significantly the budget and the possibilities of an actual application in the future. The characteristics of the device can be found in the Appendix V. The Table 26 shows the most relevant working specifications.
Table 26. Main Characteristics of the Heat Pipe Exchanger Device
Supplier and Model Noren CC2000 Cooling Capacity 2.19 kW Electricity Consumption 44.26 kWh/year The main idea of this application is to recover the waste heat inside the GP container and stream it inside a room where the coffee seeds will be stored, in that way, speed up the drying timing, reduce the process and allow the prevision of the next steps in the coffee procedure. The figure below, Figure 23, shows a conceptual overview of how the system would work. The conduct to stream the heat source is dependent on the distance between the heat source (GP) and the drying chamber. The possibilities to cover this tubing system are varied, since the application of thermally insulated pipes to the use of PVC, or other plastic tubes, previously covered with a special material that reduces the heat loss

68
significantly. The economical cost of the piping is not going to be relevant when compared to the cost of the 2 devices needed for the application. So, it is decided not to include into the final budget.
Figure 23. Conceptual Diagram of the Heat Pipe Exchanger Device Functioning
In this analysis there is a key point that is not mentioned until now, it is the system boundary of the container space. As the volume of the gasification machinery that is going to be inside the container is not known yet, the development of this application is done without taking in account that fact. Despite of this, the data related to the volume of the heat pipe exchanger device is included in the brochures that can be found in the Appendix V.
5.2.2 Business Model
The creation of a business model is important for the market success of a service or product. In this study case, it is relevant not just because of the economical sustainability of the investment, but also because a deeper effect on the market will imply a broader impact over the community. It is obvious that the strategies used to spread a service over the community will directly affect the success of it, and thus, a correct and efficient business model strategy will maximize the effect of the provided service. To start explaining what is understood as business model, a definition stated by Teece (2010) is given:
“The essence of a business model is that it defines the manner by which the business enterprise delivers value to customers, entices customers to pay for value, and converts those payments to profit: it thus reflects management’s hypothesis about what customers want,

69
how they want it, and how an enterprise can organize to best meet those needs, get paid for doing so, and make a profit.”
The main parts that must be involved in the creation of a business model are included in the definition; these are the customers, the value of the service provided, the revenues, etc. All these must be analyzed and evaluated in order to have an actual view of the socio-‐economic environment, the market. And this is what is done in this section of the thesis work, to help the researchers compile all these data, the “Business Model Canvas” is followed (Osterwalder & Pigneur, 2010). Hence, going through the mentioned model, the Figure 24 shows what elements have to be accounted and how to treat them. The Figure 24 is divided in two due to size issues.
Awareness Raise awareness
about company’s
services
Evaluation Help customers
evaluate the
company’s Value
Proposition
Purchase Allow customers
to purchase
specific products
and services
Delivery Deliver a Value
Proposition to the
customer
After Sales Provide
post-‐purchase
customer
support
3 – Channels The channels define how the value proposition reaches the customer segment, are the connection between the company and the clients. For this purpose, the establishment of the channel has 5 phases, based on how the company should:
2 – Value Propositions It is the amount of services offered that provokes people to become customer. Detecting, analyzing and targeting a specific need to be cover would be the value proposition. Customer Segment Detected Need Value Proposition Offered
Figure 24. Business Model Strategy (Osterwalder & Pigneur, 2010)
1 – Customer Segments Business targets could contain different client profiles. So, the target customers must be clustered in order to have a distinction based on their main characteristics. The customer segments must separate different consumers by specific criteria, by answering the following questions:
Which are the needs How to reach them Level or profitability Willingness of paying

70
4 – Customer Relationship It is the nature and degree of relation that the company sets with the different customer segments. The relationships applied in the project are: Personal Assistance Individual and personalized connection between the two parts, during the whole
purchasing and service stage
Self-‐Service No personal relation between parts. Customers help themselves with the tools
that are provided
Communities The company maintains a relation with the whole community. Helping and
providing what is needed, and at the same time this society starts developing
knowledge and in that way, the people can help each other, allowing the
company personnel step back. It creates self-‐sufficiency among the community
Co-‐Creation The strength of the relationship is based in a continuous feedback from the users
or customers to the company, giving advices and opinions about the services and
how to improve them
5 – Revenue Streams
It is the way that each Customer Segment will pay for the service acquired, which is the payment method. Every Customer Segment can have different Revenue Streams. Usage Fee Payment proportional to the level of use. Price increase with consumption.
Subscription Fee Periodical payment for the access to a service; the fee can be monthly yearly or
by reaching a maximum access to a service.
Renting The contract between the two parts agrees in a periodical payment for a specific
time, at the end of this contract the customer can agree with the company to
buy the service or product, and thus become owner.
Shareholding The customer participates in the investment cost of the product or service, in
the purchase, as accorded in a contract and under the agreed conditions.
6 – Pricing Strategy
The definition of the price for each Value Proposition, regarding to the Customer Segment and related to the Customer Relationship, is of great importance. It determines the price established for the Revenue Streams. It varies in function of the actors involved in each case. List Price Price is fixed for the Value Proposition.
Customer Segment Dependent
Prices are fixed but depending on the Customer Segment that is purchasing the
product of consuming the service.
Volume Dependent Prices are fixed but depending on the level/quality of consumption.
Figure 24. Business Model Strategy (Osterwalder & Pigneur, 2010)

71
There are other points described in the methodology exposed by Osterwalder & Pigneur (2010) but the researchers have considered that were no relevant for the study case. Another clear idea that must be taken out of the analysis is that the environment and the social issues related to the area constraint and limit the business model. In the case under study, this fact becomes more important as the economical and social problems are much more significant in developing countries. So, to start the business model development, as explained, the first step will be to focus in the mini-‐grid.
A.1 -‐ Mini-‐Grid 1) Customer Segments
In the methodology part, a series of different issues had been stated in order to identify the different customers, after analyzing the scenario in the section 4.3 Pilot Area, the groups selected are:
I. Social & Community Activities / Micro-‐business II. Households Use III. Agricultural Activities / Productive Use / Cooperative
2) Value Proposition
The different life-‐services of the mini-‐grid are described in the section 4.4 Applications and Life-‐services, so it is possible to arrange them regarding to the different customer segments, see Table 27.
Table 27. Value Proposition for the Selected Customer Segments
Customer Segment
Need Value Proposition
Social Activities / Community / Micro-‐business
Lighting Electric supply to common facilities
Electrifying facilities Electric supply to the facilities that have power demand / Electric supply to cover the demand in each specific need
Battery charging Health-‐care Beauty Salon Refrigeration of food Leisure time
Households / Individual Use
Lighting Electric supply to each house that demands it
Battery charging Leisure time Refrigeration of food
Agriculture / Productive Use Lighting
Direct power supply to the machines
Refrigeration of food Electricity Power

72
3) Channels The analysis between the potential communication between the village and Pamoja Cleantech AB or the GP project is defined by the previous defined stages of the channel assessment, see Table 28.
Table 28. Business Channels for the Mini-‐Grid
Channel Phase
Awareness The awareness among the community already exists. As the research was performed in the area and because it is a small community
Evaluation The evaluation must be positive. The Value Propositions have been selected regarding to the community needs
Purchase
The purchasing system will be dependant on the Customer Segment, the Value Proposition and the Customer Relationship with the company. It will be a payment made by an economical compensation in any case, but there are different forms of payment
Deliver The mini-‐grid will deliver the power supply to the specific Customer Segment that demands it, the grid will reach the sites that require its use
After Sales Support and direct contact after sales. Helping in the first stages of the business implantation to build up reliability on the service.
4) Customer Relationships
The diverse contract options between the company and the potential customers are pretty varied for the mini-‐grid application. The big differences amid the customer segments provoke very different contract situations; see Table 29.

73
Table 29. Different Customer Relationships Possible within the Mini-‐Grid Application
Relationship Description Customer
Individual Service
Particular supply to individuals who demand it. Personalized connection between the two parts, during the whole purchasing and service stage
• Households • Micro-‐Business • Productive Use
Self-‐service There is no personal relation between company and customers. Customers help themselves with the tools that are provided
• Households • Micro-‐Business • Productive Use
Co-‐ownership The property of a specific service can belong partly to the customer. Sharing would strength the relationship between parts
• Community • Micro-‐Business • Cooperative
Rental Conditions
Render a service for a previously accorded price and period of time. The company maintains a relation between the whole community, helping and providing what is needed, and at the same time this society starts developing a knowledge and in that way, the people can help each other, allowing the company personnel step back. It creates self-‐sufficiency among the community. The importance of the model is that it allows the customer to purchase/owe the system component in the end of the contract period.
• Community • Micro-‐Business • Cooperative
Membership Availability of access to specific services in exchange of an association. The costs would depend on the services
• Households • Community • Cooperative • Micro-‐Business • Productive Use
Co-‐creation
The strength of the relationship is based in a continuous feedback from the users or customers to the company, giving advices and opinions about the services and how to improve them
• Community • Productive Use • Cooperative • Micro-‐Business
5) Revenue Streams
The company’s income for each customer depends on the relationship between them, which means that it is going to be different for each case. For example, the community can have a kind of relationship for one life-‐service, and other relationships for other life-‐services; the different revenue streams are first stated in the Table 30.

74
Table 30. Revenue Stream Options
Revenue Stream Description Asset sale Selling a physical product to the customers Usage fee Selling a service proportionally to the level of use of it
Renting/Leasing Permitting the access to a determinate service for a specific period of time, in exchange for a fee
Shareholding The customer participates in the investment cost of the product or service as accorded in a contract and the under specifications it subscribes
Subscription fees Selling permanent access to a service, charging periodically on time, monthly, yearly, or by reaching a maximum of access to the service
6) Pricing Strategy
It is basic to explain, in the same direction than before, the different pricing strategies that can be applied to purchase the various services; see Table 31.
Table 31. Pricing Strategy Description
Pricing Strategy Description List Price Prices are fixed for the Value Propositions Customer Segment Dependent
Prices are fixed but dependant on the customer segment who is purchasing the product or consuming the service
Volume Dependent Prices are fixed but dependant on the level/quantity of consumption.
Now, it is the moment to relate the different revenue streams with the pricing strategies that can be used in each case; Table 32. In the same direction, it is essential to define which customer relationships will allow the specific revenue streams. In that way, each customer can now which customer relationship is better for a particular case; Table 33.
Table 32. Relation of the Revenue Stream with the Pricing Strategy
Revenue Stream Pricing Strategy Asset sale List Price
Usage fee List Price Volume Dependent
Renting/Leasing List Price Customer Segment Dependent
Shareholding List Price Customer Segment Dependent
Subscription fees List Price

75
Table 33. Customer Relationships and Pricing Strategy Linkage
Customer Relationship Revenue Stream
Individual Service Asset sale Usage fee
Self-‐service Asset sale Usage fee Renting/Leasing
Co-‐ownership Renting/Leasing Shareholding
Rental Conditions Renting/Leasing
Membership Subscription fees Shareholding
Co-‐creation Shareholding Thus, after defining all the relevant concepts, linking the life-‐services provided and the customer segments by the customer relationships, and stating prices and revenue streams, the business model is defined. The potential users and customers of the services know the various options offered by the company to get the life-‐services, how to purchase them and what to expect. As a final conclusion for this part, a conceptual diagram of the business model relationships is shown in the Figure 25.
Figure 25. Conceptual Business Model Diagram for the Mini-‐Grid
B.1 – Battery Charging System 1) Customer Segments
The elements of the customer segments of the BCS application are same as it is in mini-‐grid business model development. However, here in this model, “Agricultural Activities / Productive Use / Cooperative” segment is excluded, since the limited
!"#$%&'()*)+,-).+&
/#%01(,23,.4&2"0,#,-%+&
5"6%(&78"(4,.4&
9%"#18:7"(%&
5%"$13&;"#).&
<%2(,4%("-).&
=%,+$(%&>,?%&
/#%01(,0,13&')@%(&
=,48-.4&7)??$.,13&A0-B,-%+&C&
D,0()E$+,.%++&
A4(,0$#1$("#&F&&'()G$0-B%&
H+%&
9)$+%8)#G+&H+%&
7$+1)?%(&;%4?%.1+&78"..%#+&
7)?*".3&;1($01$(%&
7$+1)?%(&<%#"-).+8,*+&
<%B%.$%&;1(%"?+&
;3+1%?&
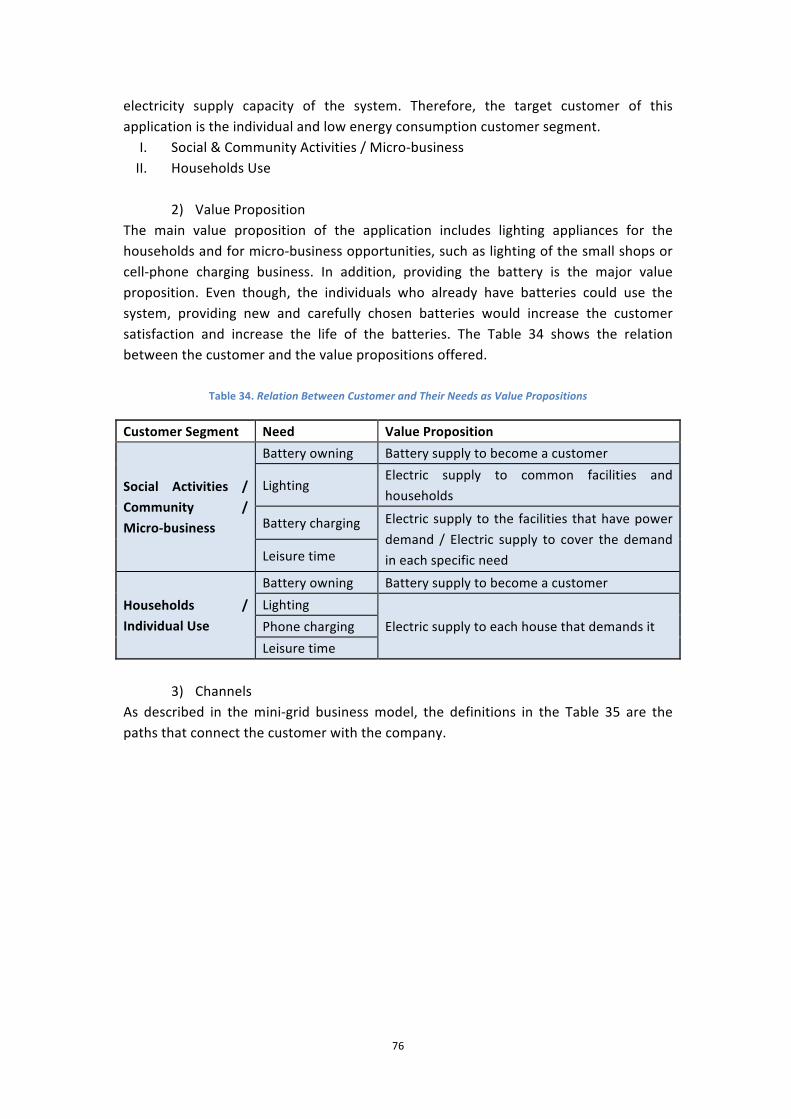
76
electricity supply capacity of the system. Therefore, the target customer of this application is the individual and low energy consumption customer segment.
I. Social & Community Activities / Micro-‐business II. Households Use
2) Value Proposition
The main value proposition of the application includes lighting appliances for the households and for micro-‐business opportunities, such as lighting of the small shops or cell-‐phone charging business. In addition, providing the battery is the major value proposition. Even though, the individuals who already have batteries could use the system, providing new and carefully chosen batteries would increase the customer satisfaction and increase the life of the batteries. The Table 34 shows the relation between the customer and the value propositions offered.
Table 34. Relation Between Customer and Their Needs as Value Propositions
Customer Segment Need Value Proposition
Social Activities / Community / Micro-‐business
Battery owning Battery supply to become a customer
Lighting Electric supply to common facilities and households
Battery charging Electric supply to the facilities that have power demand / Electric supply to cover the demand in each specific need Leisure time
Households / Individual Use
Battery owning Battery supply to become a customer Lighting
Electric supply to each house that demands it Phone charging Leisure time
3) Channels
As described in the mini-‐grid business model, the definitions in the Table 35 are the paths that connect the customer with the company.

77
Table 35. Channels for the BCS Business Model
Channel Phase
Awareness The awareness among the community already exists. As the research was performed in the area and because it is a small community
Evaluation The evaluation must be positive. The Value Propositions have been selected regarding to the community needs
Purchase
The purchasing system will be dependent on the Customer Segment, the Value Proposition and the Customer Relationship with the company. It will be a payment made by an economical compensation in any case, but there are different forms of payment
Deliver The BCS will deliver the power supply to the specific Customer Segment that demands it. The charging center will be located nearby the GP and reachable for the customers
After Sales Support and direct contact after sales. Helping in the first stages of the business implantation to build up reliability on the service.
4) Customer Relationships
It is very important to make the application useful and reachable for each potential customer to reach a successful business state. The key issue is to provide the best offer according to needs of the society. To reach this purpose, it is essential to create flexible relationships with the customers. A micro-‐business entrepreneur or a part of the community should have different status than an individual household customer, in terms of the fee, paying period and access to the service agreements. For instance, an entrepreneur could have chance to pay monthly fees and on the other hand a household user should chose the best way of payment based on personal consumption and income level. The different possible relationships are defined in the Table 36.
Table 36. Customer Relationships for the BCS
Relationship Description Customer
Individual Service
Particular supply to individuals who demand it. Personalized connection between the two parts, during the battery purchasing and/or charging stages
• Households • Micro-‐Business
Membership
Some customers may have specific deals and memberships. The costs would depend on the agreement between the member customer and the company
• Community • Micro-‐Business
Co-‐creation
The strength of the relationship is based in a continuous feedback from the users or customers to the company, giving advices and opinions about the services and how to improve them
• Community • Micro-‐Business • Households

78
5) Stream Revenues The company’s income for each customer depends on the relationship between them, which means that it is going to be different for each case. For example, the community can have a kind of relationship for one life-‐service, and other relationships for other life-‐services; the different revenue streams are first stated in the Table 37.
Table 37. Different Revenue Streams for the BCS system
Revenue Stream Description
Asset sale Selling a physical product to the customers (selling battery or a constant fee per charging service)
Usage fee Selling a service proportionally to the level of use of it (charging the customer according to the amount of electricity)
Renting/Leasing Permitting the access to a determinate service for a specific period of time, in exchange for a fee (charging cycles/periods)
Shareholding The customer participates in the investment cost of the product or service as accorded in a contract and the under specifications it subscribes
Subscription fees Selling permanent access to a service, charging periodically on time, monthly, yearly, or by reaching a maximum of access to the service
6) Pricing Strategy
The definition of each of the price strategies used in for the BCS application are described in the Table 38.
Table 38. Pricing Strategy Definition for the BCS
Pricing Strategy Description List Price Prices are fixed for the Value Propositions Customer Segment Dependent
Prices are fixed but dependent on the customer segment who is purchasing the product or consuming the service
Volume Dependent Prices are fixed but dependent on the level/quantity of consumption.
Now, the relationship between the prices and the revenue streams can vary for each application and customer segment; see Table 39 and Table 40.

79
Table 39. Relation Between the Prices and the Revenue Streams for the BCS
Revenue Stream Pricing Strategy Asset sale List Price Usage fee Volume Dependent
Renting/Leasing List Price Customer Segment Dependent
Shareholding List Price Customer Segment Dependent
Subscription fees List Price Customer Segment Dependent
Table 40. Revenue Streams Available for each Customer Relationship
Customer Relationship Revenue Stream
Individual Service Asset sale Usage fee
Membership Subscription fees Shareholding Renting/leasing
Co-‐creation Shareholding The understanding of the whole process could be easier by looking at the diagram in Figure 26. It represents the conceptual approach of how the complete system works.
Figure 26. Conceptual Diagram of the Functioning and Linkage for the BCS Application

80
C.1 – Heat Pipe Exchanger The methodology applied in this case is the same than in the other two, the difference is that this service is not related to rural electrification and it does not provide a service to the people themselves but to the agricultural processes.
1) Customer Segments The elements of the customer segments of the heat pipe application include only one segment. The target customer is the agricultural cooperative, since the only application of the product is agricultural activities. In fact, to be more specific, it is important to state that the only target customers are the coffee producer members of the cooperative.
I. Agricultural Activities / Productive Use / Cooperative
2) Value Propositions The proposed value of the application includes a more time effective and predictable production process; see Table 41.
Table 41. Value Propositions for the Heat Pipe Exchanger
Customer Segment Need Value Proposition Agricultural Activities / Productive Use / Cooperative
Faster production Predictable production
The heat is provided to be used on coffee drying process
3) Channels
The channel description is done in the Table 42.
Table 42. Channel Description for the Heat Pipe Exchanger
Channel Phase Awareness The awareness among the community already exists. As the research was
performed in the area and because it is a small community Evaluation The evaluation must be positive. The Value Propositions have been
selected regarding to the community needs Purchase The purchasing system will be dependent on the Customer Segment, the
Value Proposition and the Customer Relationship with the company. It will be a payment made by an economical compensation in any case, but there are different forms of payment
Deliver The heat will be provided to the customer via the equipment called heat pipe exchanger. The usage of the equipment will be a part of the business model and there will be a fee for it.
After Sales Support and direct contact after sales. Helping in the first stages of the business implantation to build up reliability on the service.

81
4) Customer Relationships In this application, the membership-‐based relationship seems to be the best option for the different sides of the business model. Since it is going to be a new process and a new technology for the farmers, the membership-‐based relationship would make it work easier. Moreover, the drying process with the heat pipe exchanger requires operating the device at the time being of the drying of the products. This time could shape according to the different farmers. The correct time for the coffee to be drying could vary. So, the foreseeing model is to lease the device to the farmer who is ready for the process and willing to use the method; see Table 43.
Table 43. Customer Relationship for the Heat Pipe Exchanger
Relationship Description Customer
Membership
Some customers may have specific deals and memberships. The costs would depend on the agreement between the member customer and the company
• Agricultural use • Cooperative
5) Revenue Streams
As there are fewer customer relationships than before, and it is a special case, the two revenue streams possible for this application are described below, Table 44.
Table 44. Revenue Streams for the Heat Pipe Exchanger
Revenue Stream Description Usage fee Selling a service proportionally to the level of use of it. The electricity
usage of the heat pipe exchanger in this case. Renting/Leasing Permitting the access to a determinate service for a specific period
of time, in exchange for a fee. The fee for the exchanger.
6) Pricing Strategy The same than in revenue streams can be applied here, as the value proposition to offer is targeting very specific customer, less options are offered when it comes to the price strategies. The Table 45 shows the two options for establish the payment method. The Table 46 relates those strategies with the revenue streams and the customer relationships.
Table 45. Pricing Strategy Definition for the Heat Pipe Exchanger
Pricing Strategy Description List Price Prices are fixed for the Value Propositions Volume Dependent Prices are fixed but dependant on the level/quantity of
consumption.

82
Table 46. Relation of the Pricing Strategies with the Revenues and Customers
Revenue Stream Pricing Strategy Usage fee Volume Dependent Renting/Leasing List Price Customer Relationship Revenue Stream
Membership Usage fee Renting/leasing
5.2.3 Potential Impact Identification of the Selected Solutions
Despite that it could appear needless to say, all the new and innovative installations have some consequences. Hence, in order to maintain the projects, environment and social issues, it is crucial to assess the potential impacts of the actions. However, the estimation of these changes is not easy and it is based on the current global situation, the key factors detected by the researchers and the future evolution of the area. In this section of the work, it is intended to identify and highlight which are the potential impacts related to the implantation of the selected applications. As the effects that are relevant for the research can be divided between environmental, social and economic, this section will be divided in the same parts. The work done by Vanclay (2003), Bruhn & Eklund (2002), Ecaat (2004), and others has been used as inspiration; the approaches given by these mentioned authors have been used as guide and baseline, although the profundity of the analysis carried out in this report is not comparable with the one reached by the cited researchers. Social Impacts The first step must be to define what is understood for social impacts; a definition can be extracted from a description of Vanclay (2003), the social impacts are;
“…the intended and unintended social consequences, both positive and negative, of planned interventions and any social change processes invoked by those interventions…”
Now that it is clear what is understood as social impact, it is the moment to define which steps will be done in order to identify them. The steps for the analysis development are taken from the Guidelines and Principles for Social Impact Assessment (The Interorganizational Committee on Guidelines and Principles for Social Impact Assessment, 1994), and are the following:
i. Baseline study: describe the area and define the human environment. The data can be taken from the section 4.3 Pilot Area and 4.4 Applications and Life-‐Services.
ii. Identification of the stakeholders in the area: social, economical, cultural and environmental facts related to stakeholders activities.

83
iii. Identify the major impacts or the most likely possibilities within it. iv. Identify and anticipate the social impacts and possible reactions.
The main instrument used to execute the analysis is the field observation. The use of the data collected during the field trip, the connection with Pamoja Cleantech AB and the rest of stakeholders is the tool that will bring useful and reliable information to, according to the steps defined before, complete the analysis. Regarding to the appliance of this method as results, the points i) and ii) are common for all the selected applications, on the other hand, the impacts detected will be directly dependent to the application under study. Environmental Impacts The environmental impact identification objective is to assess the environmental impacts associated with the implementation of the GP in a specific area, as well as taking in account the sustainable development matters related to those impacts. Therefore, the developers of the GP can prevent and foresee which are the main future potential problems, and so, avoid them by modifying the project (Bruhn & Eklund, 2002). Specially, the environmental impact is important and worth to analyze because there is not much industrial activity in the area. Plus, the main economical activity in site, agriculture, is tightly dependent on environmental conditions. The development of the followed methodology is based on the guidelines and procedures stated in the Review of the Application of Environmental Impact Assessment (EIA) in Uganda (Ecaat, 2004), see Figure 27.
To have a clear idea of which are the possible impacts included in the analysis, ecological and social issues have been stated below as in Kakuru, et al. (2001), see Table 47.
Project Identification Identify the impacts normally associated to this type of project
Pre-‐feasibility Assessment Pre-‐evaluation of feasibility of the project from an environmental approach
Project Design i. Identify which are the negative environmental problems that could arise in the
current design. ii. Assess if there is any solution that could avoid this negative impacts
Figure 27. Potential Environmental Impact Identification Methodology (Ecaat, 2004)
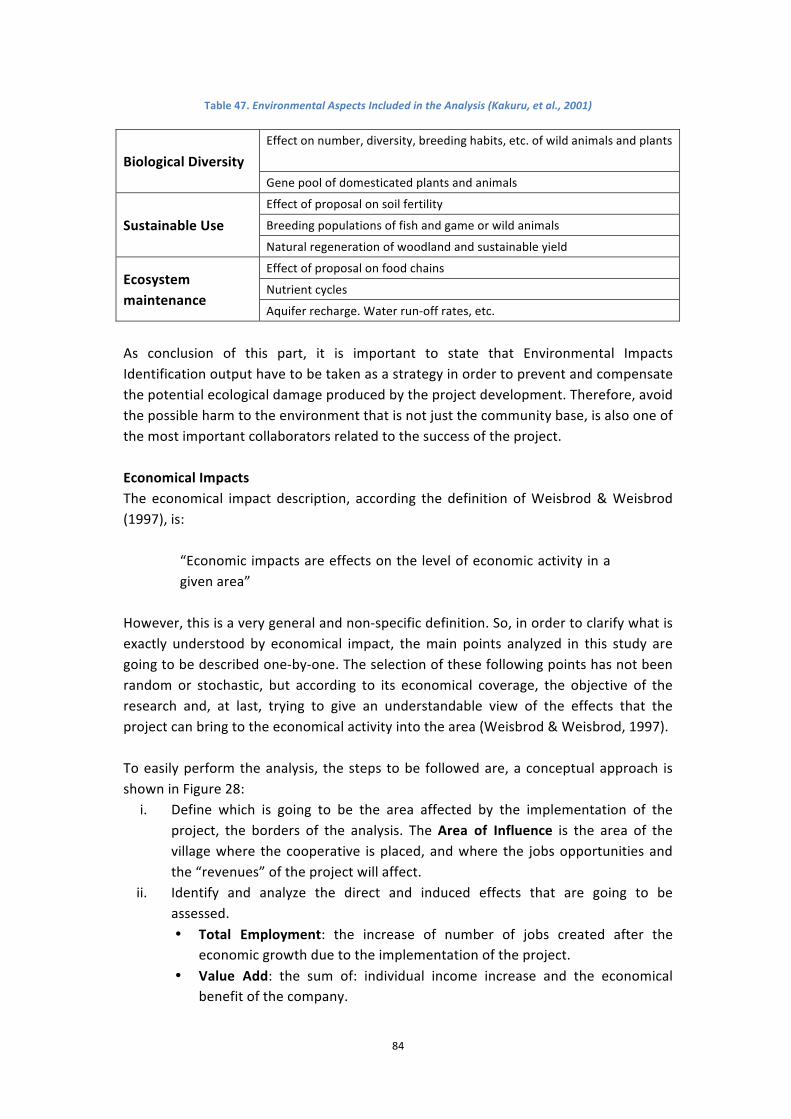
84
Table 47. Environmental Aspects Included in the Analysis (Kakuru, et al., 2001)
Biological Diversity Effect on number, diversity, breeding habits, etc. of wild animals and plants
Gene pool of domesticated plants and animals
Sustainable Use Effect of proposal on soil fertility
Breeding populations of fish and game or wild animals
Natural regeneration of woodland and sustainable yield
Ecosystem maintenance
Effect of proposal on food chains
Nutrient cycles
Aquifer recharge. Water run-‐off rates, etc.
As conclusion of this part, it is important to state that Environmental Impacts Identification output have to be taken as a strategy in order to prevent and compensate the potential ecological damage produced by the project development. Therefore, avoid the possible harm to the environment that is not just the community base, is also one of the most important collaborators related to the success of the project. Economical Impacts The economical impact description, according the definition of Weisbrod & Weisbrod (1997), is:
“Economic impacts are effects on the level of economic activity in a given area”
However, this is a very general and non-‐specific definition. So, in order to clarify what is exactly understood by economical impact, the main points analyzed in this study are going to be described one-‐by-‐one. The selection of these following points has not been random or stochastic, but according to its economical coverage, the objective of the research and, at last, trying to give an understandable view of the effects that the project can bring to the economical activity into the area (Weisbrod & Weisbrod, 1997). To easily perform the analysis, the steps to be followed are, a conceptual approach is shown in Figure 28:
i. Define which is going to be the area affected by the implementation of the project, the borders of the analysis. The Area of Influence is the area of the village where the cooperative is placed, and where the jobs opportunities and the “revenues” of the project will affect.
ii. Identify and analyze the direct and induced effects that are going to be assessed. • Total Employment: the increase of number of jobs created after the
economic growth due to the implementation of the project. • Value Add: the sum of: individual income increase and the economical
benefit of the company.

85
• Induced Effects: the impacts to be accounted as a spending in electricity or willing to pay due to an estimate increase in local people economic level.
iii. Conclude which are the estimated economical impacts of each of the scopes researched.
Figure 27. Potential Economical Impact Identification Procedure
Even though these impacts appear to be easy to assess there are a few drawbacks that must be regarded during the analysis.
• Total Employment: The accounting of job creation does not imply that the job opportunity is being increased too, and that it cannot be compared to the public cost of creating these jobs, meaning subsidizes, public grants, etc.
• Value Add: includes all company benefits, even though some of these revenues will not have any impact in the area under study. Some of this wealth can be invested out of the region of influence.
As conclusion for this part, it is easy to state that economical assessment can be useful in order to have an idea of big figures, general numbers and to estimate which are the paths that can be used to help the local economy growth; but, to evaluate how these elements can affect the daily life of the locals there is the need of a deeper analysis, the disposition of specific detailed data and the exact budget involving all project development. Finally, after all the applied methodology is explained, the analysis of the potential impacts for the mini-‐grid starts below.
A.2 -‐ Mini-‐Grid a. Social Impacts
i. Baseline Study The baseline study is based in the data relevant to describe the human, cultural, economic and environmental state of the area that is being researched. The use of the sections 2 The Green Plant Concept, 4.3 Pilot Area and 4.4 Applications and Life-‐Services, is basic for this stage. Although, there is a lack of information from the field trip that
!"#$%&'%()*+#),#%
-."#,/%01#,/2%()3+,#3%01#,/2%
!"#$%&'&(
)*"+$,&'*"(
4&/$5%0675&86#)/% 9$5+#%!33%
()3+,#3%01#,/2%
()3+,#3%01#,/2%
:.5;%<&)2#"=$>&)%
<&66+)./8%?%:.,"&@A+2.)#22%
<&1##%B"&,#22.)C%
:.5;%<&)2#"=$>&)%
<&66+)./8%?%:.,"&@A+2.)#22%
<&1##%B"&,#22.)C%
4&/$5%0675&86#)/%
4&/$5%0675&86#)/%
!"#$%&'(&#)'*!%+,$(-*

86
could be useful and interesting for this study, e.g. gender equality, workload per age, adults/kids or male/female work ratio, etc. The idea of this first point is to describe the starting point situation of the community, so the changes that can happen, the impacts, can easily be identified. Thus, it is of much importance to portray as actual as possible a big picture of the community. The following tables will help to understand which are the relevant points for the analysis. The tables can be classified according to its topic, social issues, agricultural facts and energy consumption levels. The first tables are related to the current social situation of the village; see Table 48 and Table 49.
Table 48. Energy Issues Related to the Current Community Situation
Community Current Situation
Population 110 households 880 people (approx.) Area of the Village The village is spread along 6 km2
Schooling Rate 8 schools in the area (2 reachable for mini-‐grid)
High schooling among kids
Active Local Organization
Magara Cooperative 3 years of work experience
The coop. work increases social and economical possibilities among the community
2 Small-‐business (Grocery Stores) working in the area National Grid Not connected and not planned in long time period
Table 49. Social energy Concerns
Energy Issues Related to Community Energy Concern Diesel price and lighting possibilities
Productivity -‐ Not expanding possibilities due to energy lack Desirability in the use of energy
Ranking among community what would be the uses of energy 1 – Lighting 2 – Agricultural machinery. 3 – Charging phones 4 – Beauty Salon 5 – Refrigeration for food storage
The following tables show the energy situation in the region at this time; Table 50 and Table 51.

87
Table 50. Energy Use in the Household Level
Household Energy Use
Cooking Use
Meals per day 3 meals total Breakfast 0.5 hours
Lunch 2 hours
Dinner 2 hours Time per meal 4.5 hours total
Energy need 3 firewood pack per day for cooking the meals Water Boiling 10 litres per household per day
Lighting Rooms lighted 5 rooms Time lighted 5 hours average
Others Micro-‐solar cell Phone charging
Table 51. Energy Current Situation, Use of Energy at all Levels
Energy Current Situation Energy Current Sources Type Price Use Kerosene 1.06 USD/litre Lighting Diesel 1.06 USD/litre Agriculture productivity Firewood 0.35 USD/pack Cooking & lighting
(Rainy season use) Charcoal 5.33 USD/bag Cooking & lighting Consumption Kerosene 2.5 litre/household*week Diesel 70 litre/week (harvest 4 peak months/year) Firewood 3 pack/day Charcoal 260 kg/month (4 bag/month) And finally, the last two tables make reference to the productive or the economical activity in the area; Table 52 and Table 53.
Table 52. Current Cooperative Productivity
Biomass Coop. members Production Total
Maize 70 3 acres/member 140,000 kg/year Coffee 73 1 to 4 acres/member 47,600 kg/year Beans 68 1.5 acres/member 2,800 kg/year Groundnuts 20 0.5 acres/member No data Milk 100 liters/day

88
Table 53. Machinery Power and Energy Use
Current Machinery
Machine Power Capacity Diesel generator 9.7 kW Maize mill 7.5 kW 400 kg/day
Energy Consumption for the Machinery
Crop Fuel Quantity Price Diesel Generator Diesel 10 litres/day 1.06 USD/litre Other relevant points:
• It is important to understand that a member of the cooperative means a household associated to the cooperative system.
• When there are impacts that are affecting the production of the cooperative, there are two kinds of impact on population: direct (workers, mainly men) and indirect (households that are economically dependent on cooperative activities, women and kids)
• Even though there is no access to electricity in the area, comparing the price of electricity grid 550 UGX/kWh, to the estimate price the GP could provide is also of much importance to realize the level of the impact it is causing.
• The output of maize milling, called “posho”, supposes one of the main basic elements in local’s diet.
• The cooperative has at its disposal a piece of land that could be used for the implementation of the GP.
• Milk storage is one of the main issues that the community is facing. Nowadays, there is no way to keep it assuring that healthy conditions are not going to be affected.
ii. Identification of the stakeholders in the area: social, economical, cultural and
environmental facts related to stakeholders activities The stakeholders that can contribute or either be affected by the implementation of the GP are the cooperative and the locals living in the area. The social institutions, as schools, can be subjected to an impact as well. The lack of health-‐care clinics, hospitals, or other governmental facilities reduce the capacity of having more spread positive impact further than the area that the cooperative covers. Therefore, in order to comprehend which are the stakeholders that can have a direct effect over and after the project, these are listed below.
- Magara Farmers Cooperative. The farmer’s cooperative is the main stakeholder for the biomass supply and, as a previewed, should suppose the main consumption of electricity production, so become the main customer for the output of the GP. The cooperative suppose also the principal actor involved in the productive activities in the area. The success of the cooperative is of much importance because most of the families

89
in the area are dependent on its productivity and market future. There are possibilities of expanding the business and the crops that are currently harvested, and there is a big interest among the members to improve the processes that are possible to carry out in its facilities. Micro-‐finance options are available for the associates and can bring new advances regarding machinery and accessible amenities.
- Community, citizens of Sekanyonyi. Obviously, the community is another key stakeholder for the success of the GP project. The community represents the end-‐user and includes all the households that are also potential consumers. It is also the organism that links all the customers and that intertwine all business, institutions and people in order to interrelate them and sews the social network. It is important to keep it alive to spread the possible positive impacts that the GP can bring.
- Micro-‐business, run by local inhabitants. The micro-‐businesses that are set up in the area, like stores or workshops, are potential customers and the enlargement and improvement of them can bring an increase on economical activity in the area.
Despite of the current stakeholders, there are future possibilities that shouldn’t be discarded, as the implementation of a project like that can bring future business and increase the market opportunities. Regarding the applications defined in previous parts, and the discussions held between the researchers of this work and the Pamoja Cleantech AB promoters, there are a few potential stakeholders that must be taken in account for the assessment.
- Micro-‐business on refrigeration for food storage The possibility of having available electricity could enhance the entrepreneurship among the people and one of the main uses of the energy could be to serve a refrigeration system in order to store food products. The storage could be for self-‐consumption as well as to preserve the products until the moment they are sold.
- Health-‐care service
A small clinic or a center for health care is missing in the area. The implementation of an energy providing plant could motivate the installation of some services in that direction. Reliability on lighting and on the capacity of store medication would be the key factors.
iii. Identify the major impacts or the most likely possibilities within it
The impacts identified during the whole research process and stated here can be separated into two basic groups, positive and negative impacts. It is important to highlight that those impacts are not the result of a specific process like this, but the

90
output of the knowledge acquired during a long process that started at the same time together with the research. Positive: • Reduction in consumption of expensive fuel. The price of diesel is much higher than
the energy supplied by the GP. The exact prices and data regarding this point are explained in the following economical analysis.
• The possibility of reducing the use of kerosene for house lighting will increase the quality of in-‐door air and so, have a direct positive impact in people’s health.
• The possibility of empowering the area could contribute with enforcement in community strengthening and stimulating collaboration among the members of it; especially in between cooperative members.
• The spread of electricity all along the community would increase inhabitants’ possibilities and with the likely enlarged economical activity, a growth in community consumption of energy.
• The increase on their revenues mean a possible escalation on their consumption, and a directly rise of worker salaries which at the same time means a probable enlargement of household opportunities. Therefore, an increase on social welfare.
• The control on production stages and the improvement of it could mean an increase on leisure time for workers. And so, the involvement of those into social task and life.
• The delivery of electricity and lighting to the households could mean the possibility for the students to do their homework, readings and other educational activities for longer hours and at their own places. Thus, improving educational level in the area.
• Lighting could as well allow the micro-‐business to work longer hours even though when there is no natural light.
• Social security during night hours in the village would be improved if lighting was to be spread along the area.
• The production improvements would mean potential increase on revenues out of market. At the same time, these revenues could be used to purchase new machinery and increase even more the production of the cooperative.
• The empowerment of agricultural production and activity could mean feeding self-‐sufficiency, guaranteeing the feedstock and the market possibilities during bad-‐cropping seasons.
• The lighting and the improvement in community facilities, like schools, motivate the workers and it is more likely that work-‐absenteeism is significantly reduced.
Negative: • Possible creation of a need on energy supply. If community starts building their
economical and social opportunities around energy, there is the danger of fostering energy dependence.
• The difference in positive impact of energy supply among society could mean unequal future possibilities between who is member of cooperative and who is not. This could lead to social disparity and create conflicts within the people in the area.

91
iv. Identify and anticipate the social impacts and possible reactions
The possible prevention to reduce the potential drawbacks of the project are defended in this stage. There are two main negative impacts that can potentially affect the development of the project. • The development of a dependence on electricity or other forms of energy is a harm
that must be carefully approached. The focus must be put on creating tools and strategies to prevent these problems, the batteries or the ownership of small solar cells in the future could help the community to keep their energy sovereignty.
• The generation of unequal opportunities among society can be a problem as well. If much of the efforts for the development are focused on increasing the cooperative possibilities, which at first sight is not a bad idea, the people in the area who are not associated to it can feel left aside. Thus, at the same time foster envy and pain, and disparity within community, which could lead to a social break up. The effort should be focus on the enhancement of the society and the provision of different opportunities for all the community, not depending on their initial economical capacity. An example could be, share some crop fields, share batteries or other type of collaborations amongst the locals with less economical resources.
b. Environmental Impacts
One of the basic ideas that must be clear before starting the environmental assessment, is to bear in mind that future generations must not be affected by a possible environmental harm caused by the implementation of the current project. Once, this important statement is clear, the three steps of the assessment can be performed. Step 1 -‐ Project Identification. As it had been described in the research, the GP is considered as a “black box”, so the authors of this work are not going to analyze the environmental impact of the GP system, but the output applications. In that case that means the mini-‐grid application. Thus, just its impacts are going to be assessed and to do so, different examples and reviews of other works have been used (World Bank Independent Evaluation Group, 2008; The World Blank, 2008). The impacts are divided between positive and negative.
Positive - Reduction in the use of diesel, kerosene and firewood. The first two mean a
reduction in CO2 emissions, the latter a reduction to the stress that the woods around the village are subjected to. The following calculation will show the real saved CO2 emissions; see Table 54.

92
Table 54. Reduction of CO2 Emissions
Fuel Consumption7 CO2 content8 CO2 kg saved Kerosene 132.5 litres/year 2.4 kg CO2/litre 318 kg of CO2 Diesel 1200 litres/year 0.7 kg CO2/litre 840 kg of CO2
- An Energy supply origin from a renewable energy technology source. It means
that under sustainability work conditions it should be able to provide energy without problems to future generations.
- A potential future use of electricity for refrigeration means would reduce food waste. Milk, meat together with vegetables could last longer and preserving all organoleptic properties. At the same time, it might be possible that the need of producing milk or meat diminish, so the pressure to which the animals are subjected would decrease. Negative
- If the dependence on the crop production increases and the market pressure rises, farmers start to feel over-‐demanded and might apply non-‐environmental friendly methods to raise their crops. Possible use of chemical fertilizers that could endanger the use of the soil in the future.
- If one crop is pointed as the more efficient for the GP biomass or market purposes, it can result in the implantation of a monoculture crop activity which is completely dependent on market and that at the same time reduces the food sovereignty of the area because all the production is focused on market. Thus, putting in risk feed stock and using a bad agricultural methodology because the monoculture can foster the quick spread of vegetal diseases.
- Intensification of the agricultural methods due to market pressure. There are many drawback of it, mainly are use of pesticides, the soil erosion, the destruction of natural habitats and the high amount of energy inputs to keep a high productivity.
- The mini-‐grid itself can mean a negative environmental impact, because of its installation and the materials used for the construction of it.
- When using a potential water-‐pumping application for the use of the energy, the fact that the source of water is irregular and even in few seasons is not available at all and that there is going to be the capacity of extracting it without no physical effort, can lead to the drastic overexploitation of it, and its completely disappearance of the water source.
Step 2 – Pre-‐feasibility Assessment. The majority of the negative impacts can be successfully prevented with the right environmental related education, with advices and standards of behavior. Not just for
7 Assuming the consumption rates stated in the previous point of this impact assessment (Section 5.2.3 Potential Impact Identification of the Selected Solutions), Social Impacts 8 Source: Kaufman, 1999

93
the farmers or the business runners, but for the whole community, because the success of sustainability relies on global conduct. Thus, the feasibility study from the environmental point of view is granted as long as the spread of sustainability advices is appropriately done, and the appropriate measures are taken by Pamoja Cleantech AB. Step 3 – Project Design. i. Identify which are the negative environmental problems that could arise in the
current design. • The possible use of chemical fertilizers that could endanger the use of the soil. • The intensification of the agricultural methods. Starting to use transgenic seeds
and other dangerous materials in order to improve the yield immediately, but threatening the future generations’ possibilities.
ii. Assess if there is any solution that could avoid this negative impacts. It is not up to the specific design of the application, but more under the business model performance and the business pressure. The contribution that can be done from on of the main stakeholders of the GP project, Vi-‐Skogen, is essential since they scope of work is agroforestry management; they are also providing agricultural education and advising over the incorrect management of the soil and the methods used. So, fostering this education should be a decisive tool.
c. Economical Impacts
The economical impact assessment must be done based in real data, in the best case the source of information will be the community affected itself, whenever this is not possible other reliable sources of general information will be accessed. The UN and its independent groups as FAO or others must be one of the first databases checked for information. In doing so, some general statistics about Uganda facts are stated in the following table (UNData, 2011; UNICEF, 2011), see Table 55.
Table 55. Uganda General Economic Facts (UNData, 2011; UNICEF, 2011)
Economical Facts GDP (gross domestic product) per capita (USD) and % of growth 2000 256.8
+ 35.04% +94%
2005 346.8 2008 500 +44.17% Average annual rate of inflation (1990-‐2009) % 8 Energy consumption per capita (kilograms oil equivalent) 37.0 Although there is not much quantity of information in the Table 55, it can give an idea of Uganda economic trends. The GDP from 2000 to 2008 has a growth of the 94%, almost double. On the other hand there is inflation that has increased an 8% in 20 years. It is clear that the economical development of the country is beyond doubt, and so, the most likely option is that the trend continues if not at the same rate, at least being

94
favorable to economical expansion. This conclusion, brought to daily life and household level, means that the average economical capacity of the population must increase and so, the will of pay for services and energy supply. It has been not possible to find the exact data about wages evolution in the last years, even though this general numbers can give an idea of which are the trends also in salaries. Finally, the information gathered in Table 55, is used in order to have an actual knowledge about the economical trends, and so, have a better background to establish future potential situations. Also, it allows the researchers to compare the potential economical impacts and its repercussions to the current situation. Next, the 3 main steps involved in this methodology are performed. i. Definition of the area under the influence of the project. The identification of the economical impact starts by defining the influence area of the project implemented. In this case, the area of influence is the whole village of Sekanyonyi. As the definition of the geographical area is not as important as the definition of the economical activities within this village, the main economical activities will be stated next:
• Magara Farmers Cooperative (productive and agricultural activities) • Micro-‐business (normally owned by particulars) • Community (basic economical activity) • Others; temporary workers or transporters
ii. Identification and analysis of the direct and induced effects.
• Total Employment The direct creation of jobs that the activity produces, by itself, to the community it is just valuable during the construction stage, since the working phase does not need of any worker to perform properly. On the other hand, defining a specific number of new opportunities it is pretty difficult due to the uncertainties that are always involved on the new projects in developing countries. At first sight, the improvement of processes and the new energy scenario should increase the number of jobs in the agricultural industry. In fact, the progressive estimated development of the household economy should foster people to look for new opportunities as an entrepreneur. It is not possible to give a determinate number of new jobs but it is possible to anticipate an improvement in the environment that must promote the raising of good business opportunities.
• Value Add The economical impact that the implementation of the project could have in terms of income increase per household is definitely beyond doubt. As it has been described through all impact assessment process, the change in economical activities due to the availability of electricity will directly influence the social income. Like in the previous case, it is difficult to forecast the increase
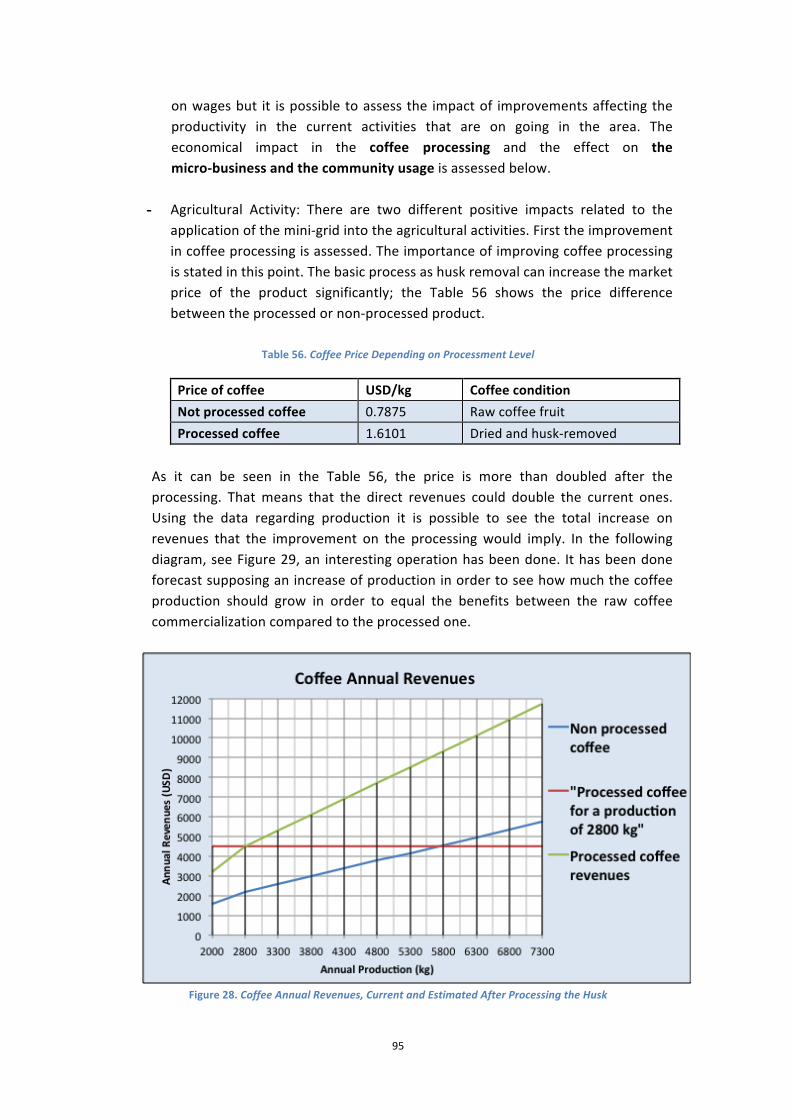
95
on wages but it is possible to assess the impact of improvements affecting the productivity in the current activities that are on going in the area. The economical impact in the coffee processing and the effect on the micro-‐business and the community usage is assessed below.
- Agricultural Activity: There are two different positive impacts related to the application of the mini-‐grid into the agricultural activities. First the improvement in coffee processing is assessed. The importance of improving coffee processing is stated in this point. The basic process as husk removal can increase the market price of the product significantly; the Table 56 shows the price difference between the processed or non-‐processed product.
Table 56. Coffee Price Depending on Processment Level
Price of coffee USD/kg Coffee condition Not processed coffee 0.7875 Raw coffee fruit Processed coffee 1.6101 Dried and husk-‐removed
As it can be seen in the Table 56, the price is more than doubled after the processing. That means that the direct revenues could double the current ones. Using the data regarding production it is possible to see the total increase on revenues that the improvement on the processing would imply. In the following diagram, see Figure 29, an interesting operation has been done. It has been done forecast supposing an increase of production in order to see how much the coffee production should grow in order to equal the benefits between the raw coffee commercialization compared to the processed one.
Figure 28. Coffee Annual Revenues, Current and Estimated After Processing the Husk

96
In the Figure 29, the red horizontal line is the revenue of processed coffee with a steady production based on the actual cooperative productivity (2800 kg). The intersection between the blue and red line marks the production expansion necessary to reach the increase of revenues that the improvements in production would bring. At the same time, the green line shows the rise of income that the processing would suppose. Finally, a production of 5724 kg of coffee would be needed to reach the annual revenue of selling raw coffee compared with processed coffee market. There is another impact related to the mini-‐grid application on agricultural activities, it is the difference in the energy cost. The Table 57 shows the difference in the cost for the same activity, the milling. According to the data from the Appendix VIII, the mill needs the supply of energy from an electrical motor that consumes 9.54 kWh working under normal conditions. Therefore, using the data from the section 4.3 Pilot Area and from the Appendix VIII, the result is clear; see Table 57.
Table 57. Annual Cost Difference Between the Use of Diesel or the Mini-‐Grid Service
Amount9 Cost Total Diesel 1200 litres 1,06 USD/litre 1272 USD Mini-‐Grid 8013.6 kWh 0,18 USD/kWh10 1442.448 USD Annual Cost Difference 170.45 USD
The conclusion after looking at Table 57 is that there is an increase on the price of the energy, and so, it would suppose a negative economical impact. On the other hand, there is no transport cost or attached pollution. Furthermore, the availability of electricity is supposed to be much more reliable than the diesel because the power point is meant to be right in the mill. Therefore, the balance is neutral, although the price is higher, the mentioned advantages payback the addition in price.
- Micro-‐Business and Community Usage: The implementation of micro-‐business in the area, or the improvement of them with the provision of electricity, could imply an economic impact among the local population. There are some key factors that show how the implementation of a mini-‐grid can positively push the creation of entrepreneurship among the community. Nowadays, drawbacks like the lack of light to perform the work adequately, or the possibility of not working enough hours to have the profitability required to hold the business could be eliminated with the suitable energy supply. As Maleko (2005) states in his work as real examples in Tanzania, locals and entrepreneurs highlight that the access to electricity is one the main elements that
9 According to 7 hour work per 4 peak months a year (120 days/year) 10 Data facilitated by Pamoja Cleantech AB

97
motivate the creation of micro-‐business at local level. The creation of these microenterprises at the same time means creation of jobs and the activation of local economy. Jobs are wages and these salaries are the ones that will hold the entrepreneurs successfully on their business. Quoting one of Maleko (2005) conclusions:
“The availability of the electricity services is one of the factors facilitating the decision of local entrepreneurs to invest in income generating activities such as milling machines, wood works, welding workshops in a specific area because most of these enterprises are found in centers where there is an electricity supply line”
At the same time, the creation of these businesses helped the locals to live more comfortably in their own community and village, as there are more services provided in a close area distances are drastically reduced as well as the time invested on daily tasks. There is another factor that pushes for the productive use of micro-‐enterprises, to foster the economical development and the increase on consumption capacity. A small analysis on the load factor of demand has been developed by assuming a household consumption according to the experience from the field trips. First, it is important to define what is the load factor (World Bank Independent Evaluation Group, 2008):
“The load factor is the ratio of average consumption to the total possible consumption”
Now, it is important to define the consumption ratio along the day, and keeping out of the assessment the telecom tower load supply (1 kW). The values of consumption given in Table 58, are an estimation based on the experience from the field trips, the elements included in the Table 58 and the consumption of each of them is according to the assumptions done in the section 5.2.1 General View of the Application, for the mini-‐grid (Table 16), other data used to support the assumptions made can be found in the World Bank Independent Evaluation Group (2008) and in The World Bank, 2008.

98
Table 58. Estimated Consumption at Household Level for 24 hours, normal day
NIGHT
Lighting for 110 households for 5 hours, from 18:00h. to 23:00h. 1 bulb per household on at the same time 1 bulb = 60 W = 0.06 kW 60 w x 1 bulb x 110 users = 6600 w = 6.6 kW on lighting
DAY
Radio for 20% of households for 5 hours, from 10:00h. to 15:00h. 1 radio = 5 W = 0.005 kW 22 users x 5 W =110 W = 0.11 kW on radio Other uses for 7 hours, from 12:00h. to 19:00h. 2 kW
Once the definition of the consumption all over the 24 hours of the day, the distribution of this energy use all over the day can be shown as the load factor, see Figure 30.
Figure 29. Load Factor for the Household Level
From the Figure 30 some conclusions can be made. It is easy to see how the consumption is mainly done during the night where the lighting is used. The peak demand almost reaches the maximum capacity of the supply because the output of the GP is 10 kW, and the peak consumption is 8.6 kW, plus the 1 kW for the telecom tower is 9.6 kW. Another important economical fact related to it is that the load factor for estimated consumption over maximum is 22.99%. That means that close to the 77% of the possible electricity (77% of potential revenues) would be out of use if just household activities were fostered. It is important to point as well that in the studies used as example for this one, the conclusion of this demand distribution was that these household needs were more efficiently covered by battery charging systems.
• Induced Effects The capacity of people to pay for electricity supply is one of the most interesting facts that can be researched since it is one of the key factors that will influence in

99
the success of the project. Linking this point to the previous ones, the improvement in social and economical conditions will directly affect the capacity and the will of pay all over the community. In order to assess the willingness to pay of the society, some examples (World Bank Independent Evaluation Group, 2008; The World Blank, 2008) have been used, as the experience of previous works is a priceless resource. The most basic and efficient analysis to do is the willingness of pay for lighting service, paying electricity for lighting means. It is important because it is probably the most used service among the households. The estimations used for the calculation of the load factor can be applied in this case. On the other hand, the real data for consumption of fuel for lighting can be used in this assessment. Thus, the Table 59 shows the values taken from the section 4.3 Field Trip, 5.2.1 General View of the Application and form the assumptions.
Table 59. Cost of Lighting for the Household Level
Kerosene Mini-‐Grid Consumption 10 litres/month 60 W bulb
0.05 litres/hour11 5 hours/day Usage 200 hours/month 150 hours/month Price 1.06 USD/litre 0.18 USD/kWh12 Lighting13 55 lumens 730 lumens
1.1 kilolumen/month (Qk) 109.5 kilolumen/month (Qm) Investment 10.6 USD/month (Pk) 1,62 USD/month (Pm) In the Table 59 can be seen that the units used, as lumens/month, have been chosen to facilitate the comparison between the two sources of energy. The selection of lumens is obvious, if lighting is wanted to be assessed there is no better unit that the one that measures the intensity of light (World Bank Independent Evaluation Group, 2008). The investment data shows a significant difference between the two types of lighting, kerosene is 3 times more expensive giving 100 times less light; see Table 59. The chart describing the demand and the willingness to pay for lighting service is shown below; see Figure 31. Although, a few explanations regarding its reliability have to be done previously;
• The demand is lineal because is directly based in the data given in the Table 43. A more realistic approach would be achieved from a non-‐linear demand curve since the lineal one overestimates the surplus that the costumer obtains. Elasticity in demand is not known, is highly dependent on income per household and current economical conditions.
• Electricity supply lowers the cost of energy to the user, resulting in an increase in
11 Source: Rainbow Power Company, 200-‐ 12 Data facilitated by Pamoja Cleantech AB 13 Source: World Bank Independent Evaluation Group, 2008

100
consumer surplus, which is the difference between what the consumer is willing to pay and what they actually do pay.
Figure 30. Will of Pay for the Household Level
To explain which would be the consumer surplus of applying the mini-‐grid in the community, different areas have been defined in the diagram, see Figure 31. The quantity that the population is currently investing in lighting is “B+D”. “A” defines the extra amount that they could pay. On the other hand, the area defined by “E” is the amount of money the population would have to spend in electricity if they would purchase it from the mini-‐grid. Then “A+B+C” would be the surplus that the consumer would have between the amount of money they pay for electricity compared to the capacity, or the will of pay.
iii. Conclusion of the estimated economical impacts The conclusions of the economical impact analysis are not as reliable as desired, the fact that there are many uncertainties involved in this kind of projects reduces the consistency of the results, although, it is clear that those results can be taken as trends or signs of what should happen, despite the exact numbers might not be precise. The conclusion for each of the effects studies is done below: • Total Employment: To declare a specific number of new jobs or to give concrete
data about the improvement of working conditions is impossible at this time. Although it is possible to foresee an increase on community possibilities and opportunities due to the implementation of the GP project.
• Value Add: It is possible to see in the previous analysis of this point, the likeliness of increasing the revenues and the household opportunities. Summarizing: o Increase of the revenues due to the commercialization of a more developed
product: doubling price in the case of coffee. o The improvement on life-‐services, conditions and the likely increase on salaries
are just few of the possibilities that the community could experience.
!"
#" $"
%"
&"
!"# !$#
%$#
%"#&'$()*#
'()*+,"'*-."
'',"'(*-"

101
o Possible increase on expenditures on the price of energy for agricultural activities. As explained before, it might reduce the capacity of production but the availability of energy and the easy access should counteract the price effect.
• Induced Effects: o The use of electricity, and so, the consumption could be extremely benefited
after the implementation of the mini-‐grid. The reduction on expenses in electricity could lead to use the money saved in entrepreneurship, greater education, better life-‐conditions or other issues that are needed by local people.
o The Increase on the will of pay, thus, increases on expenditures in lighting. As shown in the previous social assessment, the increase in lighting has direct positive effects over the life-‐conditions of the community.
B.2 – Battery Charging Station
a. Social The development of the identification of the potential impacts for the BCS is mainly the same than used before for the mini-‐grid. In that direction, the first to points of the assessment “ i. Baseline study” and “ii. Identification of the stakeholders” will not be exposed here; for the purpose of the analysis the ones described before for the mini-‐gird can be used also in this case. Thus, the analysis starts here with the third step of the methodology. iii. Identify the major impacts or the most likely possibilities within it.
The most likely impacts to happen with a direct relation to the BCS implementation are divided in two groups, positive impacts and negative impacts, and described below: Positive: • Reduction in consumption of expensive fuel. The price of diesel is much higher
than the energy supplied by the GP. The exact prices and data regarding this point are explained in the following economical analysis.
• The possibility of reducing the use of kerosene for house lighting will increase the quality of in-‐door air and so, have a direct positive impact in people’s health.
• The possibility of empowering the area could contribute with enforcement in community strengthening and stimulating collaboration among the members of it. Especially in between cooperative members.
• Lighting could as well allow the micro-‐business to work longer hours even though when there is no natural light.
• The batteries could make possible to watch TV (or listen to radio) for who those could afford a TV. Yet, it would be communal social effect by gathering neighbors, especially children, together and watch TV during the night. This situation would increase the awareness the current situation of the country and even the world. In addition, watching the broadcast in English and Luganda (most geographically spread language) could encourage the children learn to speak those languages.
• Battery power for handheld torches, which would be used to travel around the village more easily at night.

102
• The possibility of replacement of dry cell batteries in handheld torches by rechargeable 6V batteries. These included improvements in convenience, finances (villagers no longer needed to buy as many dry cell batteries).
Negative: • The grid electrification provides AC power and makes it possible to run machinery
such as sewing machines, welding irons, milling equipment, etc. On the other hand, the batteries provide DC power and this situation limits the appliances that can run of it. Thus, this application does not allow for a wide range of income generating activities to occur. So, the only income-‐generating opportunities, which are expected to be created or enhanced, are those that could be performed at night, using lighting run by the batteries. The most common option is expected to be extension of the opening hours of the local village shop.
• To have a battery and become a part of this application might cause an additional cost to the community. The problem with this additional cost might arise not just in the beginning but also during the any time period according the economical condition of the household.
iv. Identify and anticipate the social impacts and possible reactions.
• The limited power capacity of the system compared to the grid electrification. Even though, the lightning and running TV/radio possibilities are very noteworthy changes in the rural areas, the batteries will not help to cope with the main problem, which are the low economical conditions. The batteries should be used may as a common good. Share batteries between some households could help to socialize meanwhile doing the daily tasks.
• Another problem could occur when using the appliances equally among men, women and children of the village. Some of the expected benefits of the lightning are to provide better conditions to women for the domestic work and also to the children for fostering the education. As the lighted area (even the charging station) would be a very social environment, it is important to be sure that is not only shared among men.
• The end-‐user could get disappointment of the system. To avoid this situation, informing the community about the advantages and drawbacks of the system is important (e.g. informing about the lack of capacity of the batteries). This situation would reduce the disappointment and also remain still the reliability of the project.
b. Environmental Impacts
Step 1 – Project Identification. The impacts detected are divided into positive and negative.
Positive - Reduction in the use of diesel, kerosene and firewood. The first two mean a
reduction in CO2 emissions, the latter a reduction to the stress that the woods around the village are subjected to.

103
- Energy supply origin from a RET source. It means that under sustainability work conditions it should be able to provide energy without problems to future generations. Negative. Amongst the negative effects, there are the leakages of the toxic chemicals that compound the batteries.
- The most common intake of lead for man is the inhalation of lead dust and ingestion of contaminated water, soil and food. The dangerous part is that it is difficult to diagnose the intake, because the lead contamination causes very general symptoms. One early effect of high levels of lead contamination in the blood is anemia, of which the early symptoms are fatigue, headache and lassitude. Prolonged lead exposure may produce effects on the Central Nervous System, with symptoms like physiological and behavioral changes. This effect is much more important to children (World Health Organization, 2011).
- The lead particles can reach drinking water supplies by soil since the lead can easily transport in an acidic environment. In addition, this poured out lead can be easily contaminated into the agricultural fields.
- The electrolyte is made up of sulphuric acid, which can make its way through clothes and skin, and has an adverse affect on the environment. In addition the electrolyte in an old battery is highly contaminated with lead particles.
- An overcharged battery has the risk of explosion. The overcharging may lead the gas escape from the battery and cause an explosion.
Step 2 – Pre-‐feasibility study. The environmental problems with the BCS are not only viable for this application but for every single use of the lead-‐acid batteries. However, it is possible to prolong the lifetime and improve the efficiency of the battery by performing some very simple maintenance activities and practical considerations. In addition, informing and training the society about the use of battery and sustainability issues would give positive output for this specific application and also for the ultimate purpose of achieving sustainable development. Step 3 – Project design.
i. The more likely negative impacts to happen under the current design of the application are caused by the chemicals and the design of the battery, those are:
• The lead contamination to the environment. Negative impacts to the nature and to the human health.
• Misuse and false disposal of the battery. ii. There are different advises that should be followed to avoid having
environmental-‐related problems during the functioning of the BCS application.

104
• The amount of acid in the electrolyte should remain constant and the amount of the water and charge status forms the acid concentration which is 1.20-‐1.28 g/cm3 for a fully charged battery ranges from, depending on type and brand (Lorenzo, 1994). Due to evaporation and gassing there is always some loss of water from the electrolyte. If the loss is severe, the plates are exposed to air and will oxidize and cause breakdown. By checking the water level in every 2-‐3 months, the electrolyte level could be held above the plates. Then, the water should be added if it is needed.
• The charge controller is designed to protect the battery and keep the lifetime longer. The operating of the charger does not require a specific knowledge but does require consistent care.
• The stakeholders should take into account the gravity of the aspect and pay attention on disposal and recycling systems. The lead is a recyclable and most of the battery manufacturers collect the scrap batteries to recycle. c. Economical Impacts
i. Definition of the area under the influence of the project.
Here again, the influenced area is the entire village of Sekanyoni. Nevertheless, the application is basically open for everyone. The company could also get numerous customers from the neighbor villages. The end-‐users who are already using charging station could chose coming here to charge their batteries since the pilot site would be nearby and the tariff is expected to be less. This would reduce the end-‐user expenses on the battery charging. ii. Identification and analysis of the direct effects
• Total Employment As it has been discussed before, the business prediction is least expected to create new business opportunities for the community. However, it is expected to distinguish a positive business generation for the grocery shops. On the other hand, this application has a bigger business potential for the neighbor villages, including the grocery shop effect, mobile charging services, and dry cell battery services. Even in a bigger scope, some entrepreneurs could start to charge batteries at the GP station and rent them in their villages. Thus, it is still likely to achieve a positive economical impact and foster micro-‐finance business. • Value Add As it is in the mini-‐gird application, (although it is expected to be in smaller proportion) it is certain that the income level per household would be increased. On the other hand, BCS does not aim to add a new value to a certain product, which the community currently produces.

105
iv. Conclusion of the estimated economical Impacts for each scope of work. In the conclusion, the significant economical aspects of the application is not coming from either value adding or creating new business opportunities but it is coming from decreasing the expenses of the community, such as: - Cheaper battery charging (the current charging fee per battery is 1500-‐2000 UGX) - Cheaper cell-‐phone charging - Cutting off the transportation costs of the battery charging purposes - If there is a new beauty salon, cutting off the transportation costs of going to
another village/town - Increased trade in the shops
C.2 Heat Pipe Exchanger a. Social
The development of the identification of the potential impacts for the BCS is mainly the same than used before for the mini-‐grid. In that direction, the first to points of the assessment “ i. Baseline study” and “ii. Identification of the stakeholders” will not be exposed here; for the purpose of the analysis the ones described before for the mini-‐gird can be used also in this case. Thus, the analysis starts here with the third step of the methodology. iii. Identify the major impacts or the most likely possibilities within it.
Positive • Positive impact on the agricultural activities. Application of the technology on the
agricultural production. Production with more professional and modern methods. • Forecasting opportunities for the production time and maintaining better
relationship with the customer in terms of delivery time and amount. • Alleviate poverty through increase on the production activities, employment
generation and wage increase. • Increasing of the motivation and self-‐confidence of the agriculture cooperative to
take an action in similar projects. • Increasing of the willingness of becoming of a cooperative member. • Increasing of the interest of the other organizations to take an action in the same
area. Negative • Possible conflicts on the scheduling of using the heat exchanger. • In case of being unsuccessful, the interest of the community could decrease (for
this project and for the similar environmental studies). • Time required learning how to use the heat exchanger. iv. Identify and anticipate the social impact and possible reactions.
The field trips have showed that the communities are usually open to any kind of new application. Especially, the willingness of using technology is fairly high. Hence, the

106
foreseeing use of the application is that the coffee producers would like to try and be part of the application. Presumably, the first upcoming benefits of the application would be improving on the time and efficiency of the drying process. However, the biggest difference which would the application make is that to provide more predictable production timing to the farmers. The improved relationship between supplier and the wholesaler would likely to increase the business activities between two sides. For instance, scheduled deliveries are always more attractive for the wholesalers, thus, there is a possibility for the cooperative to make a difference among the other farmers and increase their annual sales.
b. Environmental Impacts Step 1 – Project Identification.
Positive - An application of waste energy recovery. - Increased energy efficiency and conservation. - The recovered energy is equal to 20% of the heat power that is accumulated
inside the container, according to the data from GEK gasifier regarding heat loss of the system. Negative
- Electricity consumption of the device. - Negative environmental impacts out of the used material of the device if the
disposal phase is not performed correctly. Step 2 – Pre-‐feasibility study In order to perform the drying process by the heat exchanger efficiently, it is important to train the users and supervise the process. It would prevent to misuse and the possible negative impact of the application. It would be helpful to work together with the stakeholders and control the process in the beginning. Step 3 – Project design In this case, the environmental impacts are not highly dependent on the design of the project. The impacts are more related to usage phase of the heat exchanger and maintaining it. This application requires the adjustment of a new device to a community, which is not using any additional machinery for this process. Accordingly, this situation brings the negative impacts such as electricity consumption and additional machinery to the environment.
c. Economical Impacts
i. Definition of the area under the influence of the project. The application area is going to be the pilot village and the main target and partner of the application are going to be Magara Farmers Cooperative (productive and agricultural activities). However the end-‐users who would like to apply this new drying

107
process method could benefit from outside the village and farmer cooperative. ii. Identification and analysis of the direct effects
• Total Employment The application is not expected to create new business opportunities at the first side. But it is possible to cause a positive impact on agricultural activities. So, by time, the number of farmers or employment could increase and the importance of the agricultural process could ascend in terms of economical benefits. • Value Add The added value is not coming from improved quality of the coffee product or it is not related to providing another function or so. Nevertheless, the additional value is coming from the faster production phase. In other words, the application adds a new value to the producer not to the product. Increased value of the cooperative and the farmers is expected to attract more customers and provide more trade. Besides, the improved drying process would eliminate the long processing time and avoid the undervalue sales. Also it would allow trading the goods with money in a shorter time. iii. Conclusion of the estimated economical impacts for each scope of work
It is a difficult task to calculate the exact outcomes of the application in monetary values. Nevermore, it is possible to observe the possible economical impacts by looking at the coffee market conditions and process in Uganda. • According to the Uganda Coffee Development Authority (UCDA), the coffee
production sector is almost completely dependent on the small-‐scale farmers and it is stated that the large-‐scale centralized coffee production is needed for the industry. Even though this picture looks like a drawback, it is also stated that the situation helps to cope with the uncertainties of the world market prices, since; the small-‐scale producers have low marginal costs of production.
• One of the most significant costs of the production phase is the drying issue. The selling price of the coffee is directly dependent on the moisture content of the coffee beans. The fully dried coffee beans could be sold to the value of the good. Conversely, the high moisture content causes falling in value. The expected moisture content of the dried coffee is 13-‐14 % and it usually takes 2 weeks. As the moisture content goes high, the price of the coffee goes down. Besides, it is pointed out that the delayed drying could result on the quality of the product and decrease the value.
• In addition, Oxfam (Oxford Community for Famine Relief) has made some case studies on the importance of coffee production in Uganda (Sayer, G., 2002). In the research, it is mentioned that drying process is up to the economical conditions of the farmers. It means that, sometimes the farmers are forced to sell their goods before they are dried enough for the market requirements. Especially, this occurs if there is sickness in the family or an urgent need of sugar, salt or any basic food product. Uncompleted dried coffees (sometimes they sell right after starting drying process) are sold to the small traders, which continue to the drying process and sell the coffee with higher prices. According to the report (Sayer, G., 2002), the farmers

108
sometimes sell up to 1000 kg non-‐dried coffee in one year with a price down to 0.20 USD/kg (average price of the dried coffee is 0.79 USD/kg).
5.2.4 SWOT analysis
The SWOT methodology is a framework used in the analysis of a project in order to create a strategic planning to it, thus spotting the strengths, weaknesses, opportunities and threats (as SWOT is the acronym of these four points) (Hill & Westbrook, 1997). A good description of SWOT is stated by Stacey, (1993 cited in Pickton & Wright, 1998, p. 103); he defines SWOT as:
“A list which shows the strengths and weaknesses of an organization by an analysis of its resources and capabilities, and a list of the threats and opportunities which is identified by analyzing its environment. Strategic logic obviously requires that the future pattern of actions to be taken should match strengths with opportunities, ward off threats, and seek to overcome weaknesses.”
The reasons, that brought the authors of this research to think that SWOT is a procedure that fits the needs of the study, are based on the fact that this approach takes in account the internal and external factors of the project. In order to understand that statement, the internalities and externalities are going to be defined following the differentiation made by Karppi, et al. (2001); in the paper, describes that the main distinction between the internal and external factors is the degree of control over them. The internal ones are characterized by their direct relation with the project itself, and should be controllable by the managers or directors of it. On the other hand, the external factors are influenced by the environment and its changes, not just referring to the natural environment but the economical and socio-‐cultural movements and flows. The first step that must be done during the development of a SWOT analysis has to be, always, an overview of the project and its surrounding; the study of the environment, socio-‐cultural aspects, and all these factors that are or could affect the successful development of the project, as it can be found out in Pickton &Wright (1998) examples. In this sense, the data collected and the analysis were done during the research trip to Uganda, more specifically to the placement where the pilot plant is to be constructed. The collaboration of other members of the company, (Pamoja Cleantech AB) as well as the interviews with the locals, helped in order to obtain reliable and useful information. Moreover, the conclusions of the previously performed analysis (section 5.2.2 Business Model and 5.2.3 Potential Impact Identification) are the statements that will be used to complete the SWOT analysis. Once the research of relevant information is done, the next step is to frame all these data in a matrix format, as it can be seen as example the following chart, see Figure 32 (Markovska, et al. 2009, p.755):

109
Figure 31. SWOT Matrix (Markovska, et al., 2009, p.755)
Pickton & Wright (1998) consider that leaving the analysis at point is a mistake, they declare that a more profound analysis is necessary to have a reliable and discussed order of factors. Kotler (1991, cited in Pickton & Wright, 1998, p.106) proposes that, as an improvement of the conventional SWOT method, another matrix should be done. This second matrix must be focused on the external factors (threat and opportunity) classifying hierarchically the statements in two different scopes, by degree of impact and probability of occurrence. In the same direction, it is suggested that the internal factors could be disposed by order of importance. After ordering all the factors within the new criteria, the elements that are more significant, and likely to happen are highlighted so it is easier to focus on them. In this case, the SWOT has to contribute to the understanding of the impacts related to the implementation of the product developed in this study. This methodology is used in order to classify the different outcomes of the two previous analysis (section 5.2.2 Business Model and 5.2.3 Potential Impact Identification), so it is clear which of them can be managed (internal) or just treated carefully (external). The SWOT output is useful for the final design of the selected applications, so is done in order to give a solution to the research question and sub-‐questions. In this direction, the SWOT analysis performed in this research would include the second improvement chart (Kotler, 1991, cited in Pickton & Wright, 1998, p.106), so the researchers reach a deeper and more realistic view, and have more tools for a richer discussion. Therefore, taking in account these results, provide an efficient and sustainable final design of the whole system.
A.3 -‐ Mini-‐Grid The SWOT analysis is used in this research as a final conclusion of the assessment and the business model. It states the main facts of the project discussed and defended in the previous stages of the development of the results and, as it is one of SWOT’s purposes, clustering them depending on their origin and nature. In the Table 60, the mentioned

110
impacts and analysis are included.
Table 60. SWOT Analysis for the Mini-‐Grid
Internal External Positive Strengths
• Good predisposition of local people to use the electricity.
• Energy price and market competitiveness.
• No business competitors. • Community already organized
as a cooperative. • Health benefits because of
fossil fuel substitution. • Possibility of covering almost all
daily-‐life needs. • Educational improvements. • Reduction of time spent for
daily-‐tasks, which means increase on leisure time.
• Increase on comfort. • Possibility of working, studying
or doing other activities after the sunset.
Opportunities • Entrepreneurship potential. • Micro-‐financing possibilities. • Increase on cooperative
revenues. • Traditional fuel rising price. • Possible institutional
customers. • Likely increase in job
opportunities and wages. • Enforcement in social activities,
gathering to spend leisure time together, read or study.
• Increase on other economical activities and migration due to energy disposition.
• Increase on productivity and storage possibility empowers the food sovereignty.
Negative Weaknesses • Existence of very few
enterprises in the area. • Small energy capacity. • High dependence on
cooperative for revenues. • Lack of experience regarding
the business model. • No constant demand.
Threats • Possible supply failure. • Lack of reliability on the
improvement of economical activities over population.
• Possible creation of a need related to energy supply.
• Positive impacts must be correctly managed to avoid a social break up between poor and rich people.
Once the matrix is completed, see Table 60, the second matrix must be done in order to arrange the statements hierarchically on relevance, see Table 61. This second matrix must be focused on the external factors (threat and opportunity) classifying the statements in two different scopes, by degree of impact and probability of occurrence. In the same direction, it is suggested that the internal factors could be disposed by order of importance. The mentioned data is included and arranged in Table 61.

111
Table 61. Improved SWOT for the Mini-‐Grid
Internal External Positive 1. Community already organized
as a cooperative. 2. Good predisposition of local
people to use the electricity. 3. Energy price and market
competitiveness. 4. Health benefits because of
fossil fuel substitution. 5. Educational improvements. 6. No business competitors. 7. Possibility of covering almost all
daily-‐life needs. 8. Reduction of time spent for
daily-‐tasks, which means increase on leisure time.
9. Increase on comfort. 10. Possibility of working, studying
or doing other activities after the sunset.
1. Increase on cooperative revenues.
2. Increase on productivity and storage possibility empowers the food sovereignty.
3. Micro-‐financing possibilities. 4. Likely increase in job
opportunities and wages. 5. Entrepreneurship potential. 6. Traditional fuel rising price. 7. Increase on other economical
activities and migration due to energy disposition.
8. Enforcement in social activities, gathering to spend leisure time together, read or study.
9. Possible institutional customers.
Negative 1. Existence of very few enterprises in the area.
2. High dependence on cooperative for revenues.
3. Small energy capacity. 4. No constant demand.
1. Possible supply failure. 2. Possible creation of a need
related to energy supply. 3. Lack of reliability on the
improvement of economical activities over population.
4. Positive impacts must be correctly managed to avoid a social break up between poor and rich people.
Finally, after ordering all the factors within the new criteria, the elements that are more significant and likely to happen are highlighted so it is easier to focus on them.
B.3 -‐ Battery Charging System The different conclusions and impacts of the application under study are joined here following the methodology explained above in this section. The SWOT matrices done are shown, the first one is in Table 62 and the improved in Table 63.

112
Table 62. SWOT Matrix for the BCS
Internal External Positive Strengths
• Good predisposition of local people to use the electricity.
• Energy price and market competitiveness.
• There are business competitors but far away and more expensive
• Community already organized as a cooperative.
• Health benefits because of fossil fuel substitution.
• Possibility of covering daily-‐life needs.
• Educational improvements. • Reduction of time spent for
daily-‐tasks, which means increase on leisure time.
• Increase on comfort. • Possibility of working, studying
or doing other activities after the sunset.
Opportunities • Entrepreneurship potential. • Traditional fuel rising price. • Possible institutional
customers. • Enforcement in social activities,
gathering to spend leisure time together, read or study.
Negative Weaknesses • Existence of very few
enterprises in the area. • Very limited energy capacity. • High dependence on
cooperative for revenues. • Lack of experience regarding
the business model. • No constant demand. • Possibility of lack of interest
according to limited business opportunities
Threats • Possible supply failure. • Lack of reliability on the
improvement of economical activities over population.

113
Table 63. Improved SWOT Matrix for the BCS Application
Internal External Positive 1. Community already organized
as a cooperative. 2. Good predisposition of local
people to use the electricity. 3. Energy price and market
competitiveness. 4. Health benefits because of
fossil fuel substitution. 5. Educational improvements. 6. Business competitors but far
away and more expensive. 7. Possibility of covering daily-‐life
needs. 8. Reduction of time spent for
daily-‐tasks, which means increase on leisure time.
9. Increase on comfort. 10. Possibility of working, studying
or doing other activities after the sunset.
1. Enforcement in social activities, gathering to spend leisure time together, read or study.
2. Entrepreneurship potential. 3. Traditional fuel rising price. 4. Possible institutional customers.
Negative 1. Very limited energy capacity. 2. Existence of very few
enterprises in the area. 3. Possibility of lack of interest
according to limited business opportunities
4. High dependence on cooperative for revenues.
5. No constant demand.
1. Lack of reliability on the improvement of economical activities over population.
2. Possible supply failure.
C.3 – Heat Pipe Exchanger The different conclusions and impacts of the application under study are joined here following the methodology explained above in this section. The SWOT matrices done are shown, the first one is in Table 64 and the improved in Table 65.

114
Table 64. SWOT Initial Matrix for the Heat Pipe Exchanger
Internal External Positive Strengths
• No business competitors • Community already organized
as a cooperative • Possibility of increasing coffee
production activities • Eliminating of the drawbacks of
the unpredictable drying process
• Eliminating the long processing time
Opportunities • Entrepreneurship potential.
Negative Weaknesses • Dependent on cooperative
interest • Lack of experience • Possibility of lack of interest
according to uncertainties
Threats • Possible supply failure
Table 65. Improved SWOT Matrix for the Heat Pipe Exchanger
Internal External Positive 1. Eliminating the long
processing time 2. Eliminating of the drawbacks of
the unpredictable drying process
3. No business competitors 4. Possibility of increasing coffee
production activities 5. Community already organized
as a cooperative
10. Entrepreneurship potential
Negative 1. Possibility of lack of interest according to uncertainties
2. Lack of experience regarding the business model
3. Dependent on cooperative interest
5. Possible supply failure.

115
5.3 Final View of the Product The final section of this report consists of two main parts, the budget and the final layout of the system. The purpose of this chapter is to give to the reader an actual vision of what is done throughout the research; show the outcome of the ultimate objective of the work, expose an objective scenario based on the data collected, and the estimations done based on the literature review, where the studied applications are applied and function within the system.
5.3.1 Budget
In order to estimate the final budget of the project, a spreadsheet has been used. The Figure 33 is based on all the components that are involved in the developing of the products and the entire system. The table consists of the prices of the each component and transportation costs which are explained in the product design overview. The design conditions followed are the ones given in the section 5.2 Potential Impact of the Selected Solutions, under each product sub-‐title. Thus, the budget is entirely defined in the Figure 33.
Figure 32. Budget of the Selected Applications
5.3.2 Final Layout of the System
The very final stage of the thesis is to evaluate the functioning of all the applications within the system. The researchers have concluded that the most likely future scenario is one where all these applications, and even others that have not been assessed in this work, are working together, providing different services to a community economically
Item Amount Unit Cost (USD)Material 15699,84
Transport 4725,76Labour 3203,2Inverter 2600
6 Batteries 4470
Others 2630Electric Motor Engine 1,874Milk Tank Tank --
33330,674340
100
3000
33405640
5640
1 Battery Charger
2 Battery
Battery Charging Station
Productive Uses2Mini-grid
Total (USD)Part
1 Conductor
Battery Charging
TOTAL
2820
--
Heat Pipe Exchange /
Driying
1
2
Heat Exchanger
Heat Pipes
CC2000 2
--
the start up system is assumed to run with 30 members
cost/battery
42.310,67

116
advancing and with a growing potential demand. The success of the first energetic improvements will lead to an escalating will to have those resources at community disposal. This last step, to conclude the research, is to set out a possible future scenario likely to happen in the village under study. A hypothesis involving a possible energy demand under specific business relationships, impacts and solutions, is proposed. The results obtained during the research are going to be used in this part, and those are the fundamental basis, the whole work developed is used as an example of how the output of the thesis could work. Thus, and in order to start with the last stage of the report, the first step is to raise the characteristics of the scenario. The scenario is divided in three main parts. The first is based on the description of the three customer segments defined in the previous stages of the report. At the same time, this customer are to be defined depending on the activities they carry out, the demand related to it and the relationship they hold with the company. The second is done in order to describe the functioning of the applications together, looking for the best configuration of the system, so the efficiency of the energy production is increased as maximum. In the second part, the tariffs and revenue streams are also set up, so the different relations between customers and energy providers are established. At the end, in order to be able to manage all this data given, a series of conclusions regarding the scenario defined are exposed. The Figure 34 shows a diagram of how the following analysis is performed.
Figure 33. Final Layout of the System Procedure
Step 1 – Definition of the Customer Segments There is an important statement to be done before the different customers are defined; it is that the scenario is based on the harvesting season. This is decided in order to enrich the analysis a scenario based on the harvest season means a productive uses at its maximum.
a. Productive Use The productive uses, as have been defined in previous parts of the work, are the
!"#$%&%'%(#)*+,-*%-.%/01"-2#3%!#42#*"1%
!"#$%5%6%70*8,-*+*4%-.%"9#%!:1"#2%
!"#$%;%'%/-*8<01+-*1%
=> ?3-@08,A#%B1#%C> /-220*+":%!#3A+8#%8> D-01#9-<@1%
=> !:1"#2%EF8+#*8:%C> G=3+H%E1"=C<+192#*"%
+> I8,A+,#1%++> (#2=*@%+++> /01"-2#3%J#<=,-*19+$%
K%J#A#*0#%!"3#=21%

117
activities regarding the cooperative and the industrial activities. The processes on going in the industrial area are the ones with a greater demand.
i. Activities (Value Propositions): the two main activities carried out in the productive area are milling and seed-‐drying. The milling involves the use of lighting; the Table 66 shows how these activities are defined.
Table 66. Peak Load for the Productive Use Activities
Activity Peak load (kW) Duration Milling 9.54 2 months/season Drying 2.2 3 weeks/season Lighting 0.12 During milling
ii. Demand: the peak coincident load for the productive activity will be reached
when the drying and milling processes are overlapped, this is happening one week per season, and its peak load is 11.85 kW. The demand for each of the harvesting weeks is shown in Figure 35.
Figure 34. Coincident Peak Load for the Productive Uses During the Harvesting Season
As it can be seen in Figure 35, the demand during the week when the milling and the drying is performed simultaneously, reaches 11,85 kW. Knowing the peak load for the mini-‐grid is 9 kW and for the batteries is 2.2 kW, is easy to see that the 11.2 kW that could be provided by those two systems can’t cover the demand. Thus, the agricultural activities are to be done separately.
iii. Customer Relationships & Revenue Streams: -‐ Milling and lighting: The revenue Stream is under subscription fee. The
cooperative pays a fixed quota every 6 months; the minim duration of the membership is 2 years. And the amount of the quota is fixed in the beginning of the contract for all its duration. The contract is renewable at the end of this period with a revision of the conditions for both sides.
2,19 2,19
11,85 9,66 9,66
0 2 4 6 8
10 12 14
0 1 2 3 4 5 6 7 8 9 10
KW
Week
Produckve Ackvikes, Maximum Coincident Load

118
-‐ Drying: The consumption of electricity is included in the cooperative subscription fee and charged together with the milling and lighting electricity fee. On the other hand, the customer relationship is supposed to be renting. The conditions of the contract are mainly dependent on the cost, life-‐spent and warranty and commission of the company. The leasing quota is fixed at the beginning of the contract and the payment is done every 6 months. The contract ends when the customer fulfills the payment requirements, thus, acquires the equipment.
The Table 67 shows the final customer segment characteristics for the productive uses.
Table 67. Customer Relationships for the Productive Use Activities
Customer Segment Value Proposition Revenue Streams Customer Relationship
Productive Uses Milling and Lighting Subscription fee
Co-‐Creation Drying
Subscription fee Renting
b. Community Services
i. Activities: The activities accounted as community service are the two schools and the two stores placed in the village area. The characteristics of this customer are shown in the Table 68.
Table 68. Community Services, Customer Characteristics
Activity Peak load/unit (kW) Working Schedule Store 0.78 10:00h. to 18:00h. School 0.7 9:00h. to 16:00h.
The trade center holds and extra-‐activity serving as a battery charging station, having the capacity of 5 batteries simultaneously.
ii. Demand: The total consumption of the four community amenities can be seen in
Table 69. Table 69. Consumption of the Community Services
Activity Peak load/unit(kW) hours/day Consumption kWh/day Store 0.78 8 6.24 School 0.7 7 4,9 Total 2.96 22.28
iii. Customer Relationships & Revenue Streams: The relationships can be divided in
three groups. The two schools are under the same conditions. The 2 stores are

119
in different situations between them and in relation with the schools agreements.
-‐ Schools: The schools are under subscription fee agreement. There is a contract that has 1 academic year of duration and the subscription fee has to be paid every 2 months.
-‐ Grocery Store: Usage fee. There is a monthly charge directly proportional to the amount of energy used. The company is going to provide with an electricity meter to each customer under this kind of contract.
-‐ Trade Centre: there two different agreements regarding the trading centre. • Shareholding: This contract is related to the initial shared property that the
company and the trade centre have over the battery charging station application. The initial conditions of the agreement are that the ownership is 50% per each part, according to the initial investment coverage. Each stakeholder paid 50% of the first cost. The share in the revenues is split is the defined by 75-‐25% favourable to the micro-‐business. This inequality is based on the concept that a revenue balance in micro-‐enterprise favour would empower the entrepreneurship and foster local economy. Also there is the possibility that the trade centre decides to start acquiring Pamoja Cleantech AB part, it can be done after reaching an agreement with the company.
• Subscription fee: The service of electricity to the trade centre is under subscription fee. The membership fee is paid every two months on a fixed price. The contract can be renovated every year.
The following table shows the overall relation between the customer segment and the provider of the services; see Table 70.
Table 70. Community Service, Customer Segments and Their Characteristics
Customer Segment Value Proposition Revenue Streams Customer Relationship
School Lighting
Subscription fee Communities Leisure
Trade Centre Lighting
Subscription fee Personal Assistance Small battery charging Big battery charging Shareholding Co-‐Creation
Grocery Store Lighting
Usage fee Personal Assistance Small battery charging Others
c. Households
i. Activities: The main activities related to the electricity consumption in the households are lighting, the energy use linked to the leisure time, like radio listening, and phone charging. Regarding the “others” uses, they make reference to the activities that use electricity such as hairdressing, use of kettles or any other possible utility. These are described next; see Table 71.

120
Table 71. Use of energy in the Household Level
Activity Peak load/unit (kW) Time-‐spent per day Lighting 0.06 18:00h. -‐ 23:00h. Radio 0.005 20:00h. – 22:00h. Phone-‐charger 0.005 15:00h. – 17:00h. / 21:00h. –
22:00h. Others 0.01 20:00h. – 21:00h.
ii. Demand: The total consumption, of one single household, of energy per day is shown below, in Table 72.
Activity Peak load (kW) Hours/day Consumption kWh/day Lighting 0.06 5 0.3 Radio 0.005 4 0.02 Phone-‐charger 0.005 1 0.05 Others 0.01 1 0.1
Total 0.08 0.335 iii. Customer Relationships & Revenue Streams: Over the total 110 households,
60% of them want to have electricity service. It means that a total of 66 households agreed to have a subscription to the service, under a fee paid every two months and contract renewable every two years. The rest of the households that want the electrical service are restricted to a usage fee, mainly because it is estimated that not all the society will be interested in being connected to the mini-‐grid from the beginning. In the final calculation and conclusions those houses are not going to be accounted due to the estimated non-‐will to be connected.
The Table 72 below, summarizes the information for the household service.
Table 72. Household Level, Customer Characteristics
Customer Segment Value Proposition Revenue Streams Customer Relationship
Household
Lighting Subscription fee (60%)
Personal Assistance Radio Phone-‐charger
Usage fee (40%) Others
Step 2 – Functioning of the System
a. System Efficiency In this stage, the efficiency of the system is checked out. There are different configurations assessed in order to see if the energy produced is used, and so, increase the effectiveness of the whole system. This analysis is also important to fix the tariffs for the different customers and their relation with the energy provider. The tariffs have to

121
be quantified in relation to the customer segment, its potential demand and the global load factor of the system. The next calculations and figures show the different load factors assessed for the different customers and evaluation the maximum coincident load reachable under safe conditions. In that direction, the fist load factor assessed is including the demand of the households and the community services, those within the time and load defined previously; see Figure 36.
Figure 35. Coincident Peak Load for Community Service and Households
The amount of energy used over the total potential supply (9 kWh) is only of the 20.13%. It means a really low load factor. Out of the distribution of this demand it is easy to see that during the night hours the demand is null. So, this can be used to charge the battery system if needed and in that way obtaining a net profit. Assuming that the trade center has 5 batteries, and using the data given in the section 5.2.1 General View of the Product, in the Table 73 the data regarding the batteries can be found; in the Figure 37 the new load distribution is shown.
Table 73. Support Battery Charging Characteristics
Device Storage Capacity (kW)
Inverter Capacity (kWh)
Charging time
Mini-‐grid Battery System
6.72 2.2 3.05 hours
Battery Charging St. 4.9 -‐-‐ 7 hours
1,4
2,96 3,29
1,11 0,78
3,96
4,95 5,28
3,96
0 0 0
1
2
3
4
5
6
0 1 2 3 4 5 6 7 8 9 10 11 12 13 14 15 16 17 18 19 20 21 22 23 24
kW
Hours/Day
Load Distribukon for Household and Community Service Load

122
Figure 36. Load Distribution of the Community Service, Households and Battery Charging Stations
The battery charging stations start working at 00:00h am, around 3:30h am the mini-‐grid battery system is fully charged, and by the time the schools start using the energy, the trade center charging station is complete. For this configuration, the new load factor is 24.86%, slightly better. The next step is to add the productive uses, the agricultural means. First, just the drying is evaluated. As proved before, both agricultural activities cannot be held at the same time, and thus must be analyzed separately. The Figure 38 shows the new load distribution.
Figure 37. Load Distribution, Drying, Battery Charging, Community and Household
1,4
2,96 3,29
1,11 0,78
3,96
4,95 5,28
3,96
2,9 2,9
0,7 0,7
0
1
2
3
4
5
6
0 1 2 3 4 5 6 7 8 9 10 11 12 13 14 15 16 17 18 19 20 21 22 23 24
kW
Hours/Day
Household and Community Service Load Bazery Charging Stayons
1,4
2,96 3,29
1,11 0,78
3,96
4,95 5,28
3,96 2,9 2,9
0,7 0,7
2,2 2,2
0
1
2
3
4
5
6
0 1 2 3 4 5 6 7 8 9 10 11 12 13 14 15 16 17 18 19 20 21 22 23 24
kW
Hours/Day
Household and Community Service Load Bazery Charging Stayons Drying

123
The load factor under these conditions is 33.60% of the total capacity, and although it is improving, the configuration with the milling system, which is the one that has the biggest load, is assess below; see Figure 39. The mill needs to work taking the energy from the batteries and the mini-‐grid at the same time. It is a bit complicated, and the work is subjected to the duration of the batteries. In the Table 74 there is defined the series of hours that the mill can work, that is done in order to know how long will the batteries last under the load regime. Obviously, as is the coincident load factor the one evaluated, the mill is active simultaneously to the households and community service.
Table 74. Milling and Battary Supply Perfomance, Working Hours Under Peak Load
Working Hours 8 -‐ 9 9 -‐ 10 10 -‐ 11 11 -‐ 12 12-‐13
Load
Community (kW) 0 1.4 1.54 1.14 2.96 Milling & Light (kW)
9.66 9.66 9.66 9.66 0
Total 0 11.06 11.2 10.8 2.96
Supp
ly
Load
Mini-‐grid 9 9 9 9 9 Battery back-‐up 0.66 2.06 2.2 1.8 0 Battery Load Left 6.72 6.06 4 1.8 0
It is clear that the mill can work as long as there is power to run it. The battery and the mini-‐grid can together supply the mill motor for 4 hours, from 8:00 am. to 12:00 am. When the capacity of the battery is diminishing at cannot supply the whole load of the community and the mill, the mill will have priority having like this, the amount of electricity needed to cover the need of the electrical motor. In the Figure 39 it can be seen how the incorporation of this affects the distribution of the load.
Figure 38. Load Distribution of the Milling, Community Service, Households and Battery Charging Stations
0
2
4
6
8
10
12
0 1 2 3 4 5 6 7 8 9 10 11 12 13 14 15 16 17 18 19 20 21 22 23 24
kW
Hours/Day
Milling and Community Service Bazery Charging Stayons

124
The load factor in this case is up to 41.84% of the total capacity. It is the higher, and so, this configuration is the most efficient, all the equipment working along the day in separated hours. At this point, the next step is to develop the tariffs for each customer and situation.
b. Tariff Development The tariff assessment will be structured per each revenue stream and depending on the customer and the service offered. Subscription fee The tariff for this status must be limited by the usage fee. The subscription fee for these customers must be lower than the individual one, that is lower than the usage fee. This last statement is due to the fact that the membership customers must be somehow rewarded for their fidelity and trust in the company. Productive Uses: the price of the fee will be dependent on the demand and the consumption. The table 75 shows the actual working hours and the data after the evaluations done previously.
Table 75. Consumption of Energy Under the Working Condition Restricted by the Energy Supply
Activity Peak load (kW) Time Days/season Consumption (kWh/season)
Milling 9.54 4 hours/day 120 4579.2 Lighting 0.12 4 hours/day 120 57.6 Drying 2.19 5 hours/day 21 45.99 Total 4682.79 The current fuel situation compared with the electricity conditions offered are shown below, see Table 76.
Table 76. Energy Cost, Diesel Compared to Electricity
Fuel Consumption Cost Total cost Diesel 70 litres/week 560 litres/season 1.06 USD/litre 593.6 USD/season Consumption Cost Total cost Electricity 4682.79 kWh/season 0.18 USD/kWh 842.90 USD /season Diesel Cost 593.6 US D/season Cost difference 249.30 USD/season The Table 76 shows that the price of the diesel is 30% cheaper than the electricity, looking at this figures, it is obvious that the cooperative members would choose to use diesel. The price of the kWh must be reduced in order to be competitive with the current energy source. A price of 0.126 USD would reduce the cost of electricity to

125
561.93 USD. Table 77 shows how the pricing strategy would be.
Table 77. Electricity Supply for Productive Uses, Pricing
Consumption Cost Total cost Electricity 4682.79 kWh/season 0.126 USD/kWh 590. USD /season Subscription fee every six months 590 USD This is the maximum price to be competitive. The value added in the mini-‐grid is the inclusion of the drying system in the overall procedure. At that point two facts have to be analysed over time. -‐ The profitability of this electricity commercial price for the provider. -‐ The willingness of pay for the drying service among the cooperative. A big
satisfaction towards this service could lead to a increase in kwh price. Schools: The use of energy in the schools is estimated to be in its peak load of 0.7 kW. The fact that there is no current data of consumption, fuel use, will of pay, etc. pushes the researches to build up non-‐strongly founded estimations. The subscription estimated for the schools will be lower than the one fixed for the grocery store due to the fact that the schools are not obtaining any potential economic revenue after the use of energy. The main labour of schools is to provide the children better conditions for their learning activity. And so, due to its purpose of providing more fundamental services, the schools subscription fee will be quantified as a 75% of the individual service price. Thus, the price will be 0.135 USD/kWh. The two-‐month subscription fee will be equal to 28.35 USD. Households: For the stating a price for the subscription fee of the households, the willingness of pay for the lighting is taken as a reference because it means the 75% of electricity consumption in the households; see Table 78.
Table 78. Comparison Between Kerosene and the Mini-‐Grid
Kerosene Mini-‐Grid Consumption 10 litres/month 60 W bulb
0.05 litres/hour14 5 hours/day Usage 200 hours/month 150 hours/month Price 1.06 USD/litre 0.18 USD/kWh15 Lighting16 55 lumens 730 lumens
1.1 kilolumen/month (Qk) 109.5 kilolumen/month (Qm) Investment 10.6 USD/month (Pk) 1,62 USD/month (Pm)
14 Source: Rainbow Power Company, 200-‐ 15 Data facilitated by Pamoja Cleantech AB 16 Source: World Bank Independent Evaluation Group, 2008

126
Following the Figure 40; assuming a linear demand, the quantity of electricity consumption increases linearly with the reduction of the price of electricity. The demand line is created using the individual service pricing per kWh (0.18 USD/kWh). As this is the higher price that could be given per household subscription fee, a lower price 80% of the individual asset (0.144 USD) price is used to assess the quantity.
Figure 39. Will of Pay for the Household
The reduction on the price gives a new cost of 0.144 USD/kWh. This added to the monthly current consumption in lighting sums a 1.29 USD/month spent in lighting means. With these new price, the willing pay would increase, and so, the quantity of light used would proportionally escalate following the demand line; see Figure 41.
Figure 40. Increase of the Will of Pay
!"
#" $"
%"
&"
!"# !$#
%$#
%"#&'$()*#
'()*+,"'*-."
'',"'(*-"
11, 10,6
109,5, 1,62
114,22 0
2
4
6
8
10
12
0 20 40 60 80 100 120
USD
/mon
th
Kilolumens/month
Will of pay
"0.18 USD/kWh" "0.144 USD/kWh"

127
The Figure 41 shows the increase on the quantity of light per month (kilolumens/month) as the cost is reduced; this caused by the continuation of the will-‐of-‐pay trend until the point where the cost is 0.144 USD/kWh (1.29 USD/month). To show a comparable figure related to the light increase with the reduction of price, say that from the 11 kilolumens/month of the kerosene to the 114.22 kilolumens/month of the light bulbs supposes and increase of the 1038%. Thus the tariff of for the subscription of fee of the households is shown in Table 79.
Table 79. Household Subscription Fee
Peak Load Cost Time Total fee
0,08 kW/day 0.144 USD/kWh 660 hours 7.603 USD Thus the fee paid every two months for each of the 66 households subscripted to the electricity service is up to 7.603 USD. Renting The drying service is under renting conditions. This means that the equipment will be purchased by the cooperative after specific period of time, in which both parts agreed in the contract; see Table 80.
Table 80. Drying Service Renting Conditions
Device Cost Warranty Life-‐spend Peak Load Work hours Consumption 5640 USD 5 years 10 years 2.2kW 5 hours/day 10.95
kWh/day 559.9 kWh/year
The key factor is that the cooperative must complete the purchase of the application by the estimated lifetime of the product. This constraints the yearly fee that has to be paid. The assumption of constant fees, during the 10 years of the contract duration, means that when the warranty is over the 50% of the device will be acquired by the cooperative. At the same time, this means that the investment will reach 2820 USD, only in the payment of the machine, in 5 years. On the other hand, Pamoja Cleantech AB benefit is based on a commission over the price of the device, the income is the 15% of the device investment cost. Then, the final conditions of the subscription fee according to the price of the machine, the mentioned characteristics of the warranty and the estimated benefit of the provider are shown in Table 81.
Table 81. Subscription Fee and Contract Conditions for the Drying Service
Total Cost Total commission Periodic fee every 6 months Investment pay Commission Total fee
5640 USD 846 USD 282 USD 42,3 USD 324.3 USD

128
Shareholding The trade centre will start this business together with the help of Pamoja Cleantech AB. As it is supposed that this micro-‐business has not enough capacity to cover the whole initial investment by itself, the company collaborates in the implementation by holding 50% of the property of the battery charging station. So, the initial conditions for the business are below; see Table 82.
Table 82. Trade Center, Battery Charging Station Contract Conditions
Battery Charger Battery cost -‐ 6 battery Total cost Shareholding Revenue split 340 USD 600 USD 940 USD 50 – 50 % 75 – 25 % After Table 82 is easy to see that the micro-‐business has to make an initial investment of 470 USD to start the service. The electricity consumption of the system is, assuming it takes 6 hours to charge the batteries, shown Table 83.
Table 83. Trade Center Battery Charging Station Pricing
Charging Batteries
Load Hours Consumption
Total Storage
Cost Total Cost (5 battery)
0.816 kW 6 hours 4.9 kWh 4.9 kWh 0.18 USD/kWh 0.882 USD Total cost for charging the batteries is 0.882 USD. Thus, the price for charging each battery is 0.176 USD per battery; these facts are assuming that the cost of electricity is based in the individual usage fee. The tariff on battery rental is based on the payback time assumed for the battery charging system, and this latter is founded in the estimated lifetime of the equipment. The assumed lifetime of each battery according to proper working conditions is of 3 years. This lifetime is estimated to be shorter than the life-‐spend of the battery charger. And so, this is the constraint taken for the payback time estimations, supposing that the batteries are payback in 3 years; see Table 84.
Table 84. Payback Time for the Battery Charging System
For the 5 Batteries 300 USD 3 years 100 USD 1 year 0.27 USD 1 day
For the 1 Battery 0.054 USD 1 day

129
The Table 85 shows that the payback of the batteries for 1 day is 0.054 USD. Thus, the lowest rental cost per battery that the trade centre can apply to obtain benefits, is the equal to the total cost of one battery for one day; see Table 85.
Table 85. Total Cost for One Battery per Day
The total cost of the system is the investment cost plus the energy consumption cost Cost of charging one battery (energy consumption) 0.176 USD Cost of payback for one battery per day (investment) 0.054 USD Total Cost for one battery per day 0.23 USD So, after Table 85, it can be seen that the minimum rental tariff that the trade centre must establish to be economically feasible is 0.23 USD per battery. Thus, assuming that the 5 batteries are rented everyday at a rental price of 0.40 USD, the net revenue for the trade centre is calculated below; see Table 86.
Table 86. Balance of Cost-‐Benefit for the Battery Charging Station in the Trade Centre
Cost (Trade Centre) for 1 year Benefit for 1 year Investment 100 USD
5 batteries rental 730 USD Electricity Consumption 321.93 USD Total/year 421.93 USD Total/year 730 USD
Balance 308.07 USD According to the revenue split in the contract:
-‐ Trade Centre net benefit per year: 231.05 USD/year -‐ Pamoja gross benefit (25% revenues + electricity sold to the trade centre):
77.01 (shareholding) + 321.93 USD/year (electricity) = 398.94 USD/year As this benefits are yearly, accounting the lifetime analysis of the batteries previously done, for Pamoja Cleantech AB the net benefit per year is: 711.03 USD/year. Finally, the Table 87 describes the different fees for the 2 revenue streams of the trade centre.
Table 87. Tariffs for the Trade Centre
Trade Centre Fees Subscription fee every two months Shareholding
98.98 USD 77.01 USD Usage Fee The tariff under the usage fee regime is stated at 0.18 USD/kWh. The price is estimated by Pamoja Cleantech AB calculations.

130
Step 3 – Conclusions In the last table of the process, see Table 88, there is summarized all the customers, revenues, services, consumptions and the total gross revenues that Pamoja Cleantech AB would have in one year under this working conditions. Although, the main scenario has been explained and arranged, still few points must be explained in order be sure that all the process is understood. These points are described below. • The importance between fixed and variable revenues is obvious in this example.
The ratio between the different income streams can be taken as an output of this scenario concept. The ratio is that up 66.14% of the income is fixed. There is one revenue stream that is dependent on the success of the service business (battery charging station), although it is likely to be frequently used, and so, to become less variable.
• In order to develop the most balanced tariffing rates a maximum load demand has been estimated as it has been proved that, besides the productive activities that are subjected to their high demand, the rest of demand can be supplied without problems. The reason is that if the fee is fixed independent from the consumption, the consumption trends to be as high as possible. Thus, reaching the peak load demand.
• The estimated revenues for Pamoja Cleantech AB allow the researchers to have an approximation of the payback time for the investment system budget (Section 5.3.1 Budget).
Table 88. Final Balance for the System
Application Cost (USD) Benefit (USD) Mini-‐grid 33330.67
4592.172
Battery Charging System 3340 Heat Pipe Drier 5640
Total 42310.67 Payback time 9 years and a half
The calculated payback time does not include the main generation system, the other devices, activities or other equipment that has not been included in the system boundaries of the project or defined previously in this work. To have a better understanding of the global conclusion out of the section 5.3.2 Final Layout of the System, the Table 89 shows the different customer segments with its characteristics, which have been defined throughout this analysis. The Table 89 ends with the conclusion of the total revenues of the energy provider for one year. This revenues as explained along the thesis work, might not be the highest in terms of economy but based in a sustainable approach and service of electricity to cover the life-‐services to the community.

131
Table 89. Global Balance for the System
C. Segment Value Prop. C. Relation. Revenue S. Tariff Total year cost
Cooperative Milling, lighting & drying Co-‐Creation Subscription fee 590 USD 1180 USD
Cooperative Drying Co-‐Creation Renting 324.3 USD 648.6 USD
Community (School) Lighting & Radio Communities Subscription fee 28.35 USD 170.1 USD
Community (Grocery Store) Lighting, small-‐battery charging, other
Personal Assistance Usage fee 0.18 USD / kWh Dependent on use
Community (Trade Centre) Lighting, small-‐battery charging, other
Personal Assistance Subscription fee 98.98 USD 593.88 USD
Community (Trade Centre) Battery Charging Station Co-‐Creation Shareholding 77.01 USD 462.06 USD
Households (60%) Lighting and others Personal Assistance Subscription fee 7.603 USD 45.618 USD
Households (40%) Lighting and others Personal Assistance Usage fee 0.18 USD / kWh Dependent on use
Annual Total Gross Benefit for Pamoja 3100.25 USD/year

132
The comparison between the budget and the estimated revenues for the company show a payback time that is over 13 years. Accounting the possible failures of the system and the repairing during this period of time, it is likely that the budget would escalate significantly. Thus, showing an economical efficiency that might not fit the company’s competitiveness. On the other hand, the positive impacts assessed, in terms of economical development of the area and social advances, are pretty encouraging. The fact that the social resources are scarce facilitates the efficacy of any energetic implementation. The environmental threatens are few, and the major impacts would just be related to the use of batteries in bad conditions or the over-‐exploitation of the local agricultural ecosystems in order to obtain a bigger productivity. The overall conclusion is that the implementation of the systems must be extremely adapted to the locality where it is implemented, in terms of size and needs. The use of non-‐appropriate applications or the offer of non-‐interesting life-‐services could lead to the disenchantment of the local people and a likely descent of the number of entrepreneurs wanting to foster this systems.

133
6. Conclusion and Discussion
Developing countries need to reach a growing industry and economy in order to maintain the welfare. Hence, a systematic economical and political approach is of importance. The renewable energy technology and sustainable systems could be the key elements in developing world; especially, in the rural sites and among small communities. In Uganda case, the rural development is one of the important priorities, with the prerequisite of the industrial improvement. The government is committed to this issue by supporting the institutes or related studies, which are organized by the ministries. On the other hand, the private sector, entrepreneurs and NGOs are the other driving forces of this development. In this matter, this project has a noteworthy position between all these players. Pamoja Cleantech AB had started the business by having the collaboration with UIRI (Uganda Industrial Research Institute) and Makerere University and they have developed new collaboration with the long-‐standing NGOs. Thus, the Green Plant project is promising to cover different aspects with a maximum benefit. As a part of the GP project, this thesis work has been started in order to find out the best possible ways of satisfying the needs of the community in the rural areas by using the energy surplus of GP. All the methods and analyzing approaches have been discussed in the previous parts. All the results are organized and represented according to the sub-‐research-‐questions in order to fulfill the ultimate purpose of the thesis work. The validity and reliability of the thesis work were the major concern of the authors. The methods and selected approaches have been discussed in details before applying them. One vulnerable issue about the reliability is the fact that this research was based on a single exploratory case study. The legitimacy of the results could always be enhanced by increasing the number of the cases in different places (preferably different countries). On the other hand, single case study concept improves the perception of a specific phenomenon and entails detailed insights, which ensures the validity of the study. This makes preferred approach the best option according to the requirements of the project. The most outstanding feature of the data collection process is the two-‐months of experience on the field, in Uganda; as a member of the company and also a member of the local society. This situation enriched the observations via the knowledge about the current condition and advanced the practice of the project. The superiority of the thesis and the analysis come from the structure of the research work. The reason is that, first of all, the authors have developed a set of alternative applications, which they have aimed to choose the best options among. This process is important in terms of evaluating multiple options instead of focusing one single solution. The decision-‐making process helped to come up with the best alternatives. All the alternatives have been studied in details, including the literature review, technical features and promises of the application. Besides, the impact assessment of the

134
selected options has redoubled the quality and importance of the results. The results are grouped based on the selected application but however analyzing process has been organized according to the same aspects. The benefit outcomes are given in the same outline, which makes it easier to compare the different applications and observe the pattern and relationships between different applications. The main pattern which firstly stands out is that the applications would allow the community to foster the productive activities, improve the existing processes and increase the value of the local goods. Of course the requisition of basic human needs is mainly related to electrification and the relationship between the applications help to cover the absence. Furthermore, there are some exceptions or disappointments, so to speak. These are the things that the authors had planned to apply, however they could not in the end of the project. For instance, the biochar application has been seemed a promising alternative which would the increase the yield and could be a great example of cradle-‐to-‐cradle approach. In the end, the authors had to eliminate this option according the reasons have been stated before. Another negative outcome of the research is that there are so many things to improve on the field, but there is always a limitation. For instance, finding the capital to start a business (or even in order to be a member of the Green Plant system) is always a big obstacle for the community. The last point about the pattern of the results that the authors would like to add is related to the validation of the work. As it has been mentioned in the beginning of this chapter, the single case study is limiting the result spectrum. The GP applications and benefits could of course vary place to place. Since the different locations and communities would have different problems and needs, the output would be different. As a conclusion, this thesis work shows the problems on the area and the best way to approach them; the way of taking the maximum benefit out of the project; and the expected outcome of the applications. Moreover, in order to understand more what these results may cause and how many different doors it may open, the authors would like to give the following list that shows the payback that the partners/stakeholders could take from this study.
• This report shows the great potential of the GP project to Pamoja AB. This would lead Pamoja to take the right steps and enlarge the benefit, which could be taken out of it in terms of social and economical aspects.
• It brings the different stakeholders together in a most effective way according to their characteristics. This is a great opportunity to make the best matching stakeholders’ work together.
• It introduces a detailed model of a ready-‐to-‐work system (concerning the output of the GP).
The authors would like to finalize the report with pointing out the possible future

135
research that could be done. There are numerous ways of varying the life-‐services by using different applications. However, there are some limitations such as financial or technical inadequacy. The future research could include all those eliminated appliances and try to create a more effective system. Separately, the possible impact assessment that is done during this research could be performed after kicking off the system in the pilot site. Or even more, the similar study could be performed for different places to collect more data and increase the efficiency of the system. Besides, the capacity of the GP was also a limit for the project. Thus, with a bigger system, it could be enriched the life-‐services.

136
References
Abd El-‐Baky, M. A. & 1, Mohamed, M. M., 2007. Heat Pipe Heat Exchanger for Heat Recovery in Air Conditioning. Applied Thermal Engineering, [Online]. 27, pp. 795–801 http://www.sciencedirect.com/science/article/pii/S135943110600370X [Accessed 15 June 2011] AboutUganda.com, 200-‐. Uganda Climate. [Online] Available at: http://www.aboutuganda.com/climate.html [Accessed 15 August 2011] Buchholz, T. & Da Silva, I., 2010. Energy for Sustainable Development. Potential of Distributed Wood-‐Based Biopower Systems Serving Basic Electricity Needs in Uganda, [online]. pp. 56-‐61. Available at: http://www.sciencedirect.com [Accessed 04 October 2011] Bureau of Energy Efficiency, 199?. Waste heat recovery system. [Online] s.l. s.n. Available at: http://www.em-‐ea.org/Guide%20Books/book-‐2/2.8%20Waste%20Heat%20Recovery.pdf [Accessed 14 April 2011] Bruhn, S. & Eklund, M., 2002. Environmental Impact assessment – a tool for sustainable development? A case study of biofuelled energy plants in Sweden. Environmental Impact Assessment Review. [Online] 22 (2) pp. 129 – 144. Available at: http://www.sciencedirect.com/science/article/pii/S0195925501001044 [Accessed 22 July 2011] Central Intelligence Agency, 2011. The World Fact Book – Uganda [Online] (Updated 27 September 2011). Available at: https://www.cia.gov/library/publications/the-‐world-‐factbook/geos/ug.html [Accessed 2 October 2011] Combined Heat and Power, 2007. Absorption Chiller Refrigeration Cycle. [Online] (Updated 17 Feb 2007) Available at: http://www.chpcentermw.org/08-‐01141_tech.html [Accessed 9 April 2011]

137
Dung, T.Q., Anisuzzaman, M., Kumar, S., Bhattacharya S.C. , 2003. Renewable Energy. Demonstration of Multi-‐Purpose Battery Charging Station for Rural Electrification, [online]. pp. 2367-‐2378. Available at: http://www.sciencedirect.com [Accessed 04 October 2011] Ecaat, J., 2004. Review of the Application of Environmental Impact Assessment (EIA) in Uganda. United Nations Economic Commission for Africa. [Online] Available at: http://www.uneca.org/sdd/documents/ReportEIAUgandaFinal.pdf [Accessed 2 September 2011] Energuia, 200-‐, Refrigeración por absorción. Interés energético e impacto ambiental. [Online] Available at: http://www.cientificosaficionados.com/energia%20solar/aire%20acondicionado.pdf [Accessed 10 April 2011] Eurotanks, 200-‐. Rectangle-‐shape cooling tanks SCO. [Online] Available at: http://www.eurotanks.com/schladzialniki_wannowe_en.html [Accessed 20 October 2011] Extension, 2010. Sources and Causes of High Bacteria Counts in Raw Milk: An Abbreviated Review. [Online] (Updated 3 May 2010) Available at: http://www.extension.org/pages/11811/sources-‐and-‐causes-‐of-‐high-‐bacteria-‐counts-‐in-‐raw-‐milk:-‐an-‐abbreviated-‐review#Milk_Storage_Temperature_and_Time [Accessed 10 October 2011] Galinato, S.P., Yoder, J.K., & Granatstein, D., 2010. The Economic Value of Biochar in Crop Production and Carbon Sequestration. [online] Washington State University. Available at: http://www.ses.wsu.edu/PDFFiles/WorkingPapers/sgalinato/WP_2010-‐03.pdf [Accessed 05 April 2011] Garcia, O., Balikowa, D., Kiconco, D., Ndambi, A. & Hemme, T., 200-‐. Milk Production in Uganda: Dairy Farming Economics and Development Policy Impacts. [Online] International Farm Comparison Network IFC. Available at: http://www.igad-‐lpi.org/publication/docs/IGADLPI_WP09_08_MK.pdf [Accessed 10 October 2011]

138
Gordon, J. M., & Choon Ng, K. 1995. A general thermodynamic model for absorption chillers: theory and experiment. Heat Recovery System & CHP. 15 (1), pp. 73 – 83, Available at: http://www.sciencedirect.com/science?_ob=MImg&_imagekey=B73HC-‐47VBB8G-‐8-‐1&_cdi=11551&_user=1517299&_pii=0890433295900381&_origin=gateway&_coverDate=01%2F31%2F1995&_sk=999849998&view=c&wchp=dGLzVzz-‐zSkzS&md5=7284104e20c4e2a22b2bf76e3f4b0b66&ie=/sdarticle.pdf [Accessed 10 April 2011] Guitouni, A. & Martel, J.-‐M., 1998. Tentative guidelines to help choosing an appropriate MCDA method. European Journal of Operational Research, [Online]. 109, pp.501-‐521. Available at: http://www.sciencedirect.com/science?_ob=ArticleURL&_udi=B6VCT-‐3VGMFB9-‐1C&_user=10&_coverDate=09%2F01%2F1998&_rdoc=1&_fmt=high&_orig=gateway&_origin=gateway&_sort=d&_docanchor=&view=c&_searchStrId=1694491901&_rerunOrigin=google&_acct=C000050221&_version=1&_urlVersion=0&_userid=10&md5=5eba3f423b9bb386b56a87a1314bd2c4&searchtype=a [Accessed 22 March 2011] Hill, T. & Westbrook, R., 1997. SWOT Analysis: It’s Time for a Product Recall. Long Range Planning, [Online] 30, pp. 46-‐52. Available at: http://www.sciencedirect.com/science/article/pii/S0024630196000957 [Accessed 1 September 2011] Hung, T. C., Shai, T. Y. & Wang, S. K., 1997. A review of organic Rankine cycles (ORCs) for the recovery of low-‐grade waste heat. Energy. 22 (7) pp. 661-‐667, Available at: http://www.sciencedirect.com/science?_ob=MImg&_imagekey=B6V2S-‐3WDCDP2-‐H-‐1&_cdi=5710&_user=1517299&_pii=S036054429600165X&_origin=gateway&_coverDate=07%2F31%2F1997&_sk=999779992&view=c&wchp=dGLbVzz-‐zSkzS&md5=5bdffa7bc040742316c23b39a41f4597&ie=/sdarticle.pdf [Accessed 14 April 2011] International Energy Agency, 2011. World Energy Outlook, Electricity access in 2009 – Africa [Online] (Updated 2011). Available at: http://www.iea.org/weo/database_electricity10/electricity_database_web_2010.htm [Accessed 27 September 2011] Inversin, A. R., 2000. Mini-‐grid Design Manual. [Online] National Rural Electric Cooperative Association. Available at: http://riaed.net/?Mini-‐Grid-‐design-‐manual [Accessed 20 October 2011]

139
Kakuru, K., Musoke, R. O. & Kyakuwaire, I., 2001. A Guide to the environment Impact Assessment Process in Uganda. Sustainable Development Series No. 1. [Online] Available at: http://www.greenwatch.or.ug/pdf/news/publications/Guide_to_the_Environment_Impact_Assessment_Process-‐Issue1.pdf [Accessed 2 September 2011] Karppi, I., Kokkonen, M. & Lähteenmäki-‐Smith, K., 2001. SWOT-‐Analysis as a basis for regional strategies. Nordregio -‐ the Nordic Centre for Spatial Development, [Online] 4 Available at: http://www3.ekf.tuke.sk/re/Strategia%20a%20analyzy/SWOT%20methodology.pdf [Accessed 20 August 2011] Kaufman, S. L., 1999. Calculating, Monitoring, and Evaluating Greenhouse Gas Benefits from Solar Home Systems in Developing Countries. [Online] Sunrise Technologies Consulting. Arlington, MA, USA. Available at: http://www.repp.org/repp_pubs/pdf/devGGas.pdf [Accessed 16 October 2011] Kiker, G. A., Bridges, T. S., Varghese, A., Seager, T. P. & Linkov, I., 2005. Application of Multi-‐Criteria Decision Analysis in Environmental Decision Making. Integrated Environmental Assessment and Management, [Online]. 1 (2), pp.95-‐108. Available at: http://citeseerx.ist.psu.edu/viewdoc/download?doi=10.1.1.128.5486&rep=rep1&type=pdf [Accessed 21 March 2011] Lehmann, J. & Joseph, S. eds., 2009. Biochar for Environmental Management. London, UK: Earthscan. Liu, C-‐Q., Zhao, Z., Xiao, T. & Guha, J., 2003. Strategic Management of Environmental and Socio-‐economic Issues. Guizhou Science and Technology Publishing House, [Online] pp. 8-‐14. Available at: http://www.uqac.ca/msiaa/articlesCG/article26.pdf [Accessed 18 August 2011] Lorenzo, E., 1994. Solar Electricity. Engineering of Photovoltaic Systems. Sevilla, Spain: PROGENSA Maleko, G. C., 2005. Impact of Electricity Services on Microenterprises in Rural Areas in Tanzania. [Online] Department of Energy and Sustainable Development, University of Tewnte, Enschede. The Netherlands. Available at: http://essay.utwente.nl/58510/ [Accessed 10 October 2011]

140
Markovska, N., Taseska, V. & Pop-‐Jordanov, J., 2009. SWOT analyses of the national energy sector for sustainable energy development. Energy, [Online] 34, pp. 752-‐756. Available at: http://www.sciencedirect.com/science/article/pii/S0360544209000450 [Accessed 20 August 2011] McLaughlin, H., Anderson, P.S., Shields F.E. & Reed, T.B., 2009. All Biochars are Not Created Equal, and How to Tell Them Apart. In: The International Biochar Initiative, North American Biochar Conference. Boulder, CO, USA August 2009. [electronic print] Available at: http://www.biochar-‐international.org/sites/default/files/All-‐Biochars-‐-‐Version2-‐-‐Oct2009.pdf [Accessed 05 April 2011] Nexans, 2011. ACSR Physical Data. [Online]. Available at: http://www.nexans.ca/eservice/Canada-‐en_CA/navigateproduct_540149611/ACSR.html [Accessed 22 October 2011] Osterwalder, A. & Pigneur, Y., 2010. Business Model Generation: A Handbook for Visionaries, Game Changers, and Challengers. [e-‐book] Hoboken, New Jersey: John Wiley and Sons. Available at: ebook3000 online store http://www.ebook3000.com/Business-‐Model-‐Generation-‐-‐A-‐Handbook-‐for-‐Visionaries-‐-‐Game-‐Changers-‐-‐and-‐Challengers_104272.html [Accessed 15 October 2011] Paliwal, R., 2006. EIA practice in India and its evaluation using SWOT analysis. Environmental Impact Assessment Review, [Online] 26, pp. 492-‐510. Available at: http://www.sciencedirect.com/science/article/pii/S0195925506000102 [Accessed 21 August 2011] Pandiyarajan, V., Chinna Pandian, M., Malan, E., Velraj, R. & Seeniraj, R. V., 2010. Experimental investigation on heat recovery from diesel engine exhaust using finned shell and tube heat exchanger and thermal storage system. Applied Energy, [Online]. 88, pp. 77-‐87, Available at: http://www.sciencedirect.com/science?_ob=MImg&_imagekey=B6V1T-‐50TYH6R-‐2-‐21&_cdi=5683&_user=1517299&_pii=S0306261910002928&_origin=gateway&_coverDate=01%2F31%2F2011&_sk=999119998&view=c&wchp=dGLbVlz-‐zSkzk&md5=490bd9cffbcfaf0da409eb5a53b5d3b3&ie=/sdarticle.pdf [Accessed 10 April 2011]

141
Payraudeau, S. &Van der Werf, H.M.G., 2005. Environmental impact assessment for a farming region: a review of methods. Agriculture, Ecosystems and Environment. [Online] 107 (1) pp. 1 – 19 Available at: http://www.sciencedirect.com/science/article/pii/S0167880905000149 [Accessed 23 July 2011] Pickton, W. & Wright, S., 1998. What’s SWOT in Strategic Analysis?. Strategic Change, [Online] 7, pp. 101-‐109. Available at: http://www.hr-‐exec.com/students/215docs/Whats%20SWOT%20in%20Strategic%20Analysis.pdf [Accessed 3 September 2011] Rainbow Power Company, 201-‐. Fuel Based Lighting. [Online] (Updated 18 Oct 2011) Available at: http://www.rpc.com.au/products/services/faq-‐info/fuelbasedlighting.html [Accessed 20 October 2011] Ravindranath, N.H., Somashekar, H.I., Dasappa, S., Jayasheela Reddy, C.N., 2006. Sustainable Biomass Power for Rural India: Case Study of Biomass Gasifier for Village Electrification. Centre of Sustainable Technologies, Indian Institute of Science [online]. Available at: http://www.ias.ac.in/currsci/oct102004/932.pdf [Accessed 04 October 2011] RenewableEnergyWorld.com, 2009. Milk Cooler Powered by Renewable Energy Could Help Ugandan Dairy Farmers. [Online] (Updated 6 Feb 2009) Available at: http://www.renewableenergyworld.com/rea/news/article/2009/02/milk-‐cooler-‐powered-‐by-‐renewable-‐energy-‐could-‐help-‐ugandan-‐dairy-‐farmers-‐54675 [Accessed 10 October 2011] ResourceSmartBusiness, 2006. Heat Recovery in Industry [Online] Available at: http://www.seav.vic.gov.au/manufacturing/sustainable_manufacturing/resource.asp?action=show_resource&resourcetype=2&resourceid=44 [Accessed 15 June 2011] Robert, C.B., n.d.. Biochar Production Technology. [Online] Center for Sustainable Environmental Technologies, Iowa State University Available at: http://www.bioeconomyconference.org/08%20Presentations%20approved/Breakouts/Biomass%20Processing/Brown,%20Richard.pdf [Accessed 02 December 2011]

142
Rural Electrification Agency, 2006. Strategic Plan 2005/06-‐2011/12. [Online] Available at: http://www.rea.org.ug/userfiles/Strategic%20Plan.pdf [Accessed 13 July 2011] Sayer G., 2002. Coffee Futures The Impact of Falling World Prices on Livelihoods in Uganda. Ofxam (Oxford Community for Famine Relief) [online]. Available at: http://www.maketradefair.com/en/assets/english/CoffeeFuturesUgandaResearch2002.pdf [Accessed 31 October 2011] Schahczenski, J., & Hill, H., 2009. Agriculture, Climate Change and Carbon Sequestration. [Online] National Sustainable Agriculture Information Service (ATTRA) Available at: https://attra.ncat.org/attra-‐pub/viewhtml.php?id=297 [Accessed 02 April 2011] Schahczenski, J., 2010. Biochar and Sustainable Agriculture. [Online] National Sustainable Agriculture Information Service (ATTRA) Available at: https://attra.ncat.org/attra-‐pub/summaries/summary.php?pub=322 [Accessed 02 April 2011] Southwire, 2011. ACSR, Product Catalog [Online] Available at: http://www.southwire.com/products/ACSR.htm [Accessed 12 October 2011] Srivastava, P. K., Kulshreshtha, K., Mohanty, C.S., Pushpangadan, P. & Singh, A., 2005. Stakeholder-‐based SWOT analysis for successful municipal solid waste management in Lucknow, India. Waste Management, [Online] 25 (5), pp. 531-‐537. [Accessed 24 August 2011] Steiner, C., McLaughlin, H., Harley, A., Flora, G., et al., 2010. U.S. Focused Biochar Report Assessment of Biochar’s Benefits for the United States of America. USBI – US Biochar Initiative [online]. Available at: http://www.biochar-‐us.org/pdf%20files/biochar_report_lowres.pdf [Accessed 31 October 2011] Teece, D. J., 2010. Business Models, Business Strategy and Innovation. Long Range Planning, [Online]. 43, pp. 172-‐194. Available at: http://www.sciencedirect.com/science/article/pii/S002463010900051X [Accessed 15 October 2011]
143
Terrados, J., Almonacid, G. & Hontoria, L., 2007. Regional energy planning through SWOT analysis and strategic planning tools. Impact on renewables development. Renewable and Sustainable Energy Reviews, [Online] 11, pp. 1275-‐1287. Available at: http://www.sciencedirect.com/science/article/pii/S1364032105001000 [Accessed 23 August 2011] The Interorganizational Committee on Guidelines and Principles for Social Impact Assessment, 1994. Guidelines and Principles For Social Impact Assessment [Online] Available at: http://www.nmfs.noaa.gov/sfa/social_impact_guide.htm [Accessed 28 July 2011] The World Blank, 2008. Designing Sustainable Off-‐Grid Rural Electrification Projects: Principles and Practices. Operational Guidance for World Bank Group Staff [Online]. Available at: http://siteresources.worldbank.org/EXTENERGY2/Resources/OffgridGuidelines.pdf [Accessed 15 October 2011] The World Bank, 2011. Rural Population (% of total population) [Online] (Updated 2011) Available at: http://data.worldbank.org/indicator/SP.RUR.TOTL.ZS [Accessed 27 September 2011] Triantaphyllou, E., Shu, B., Nieto Sanchez, S. & Ray, T., 1998. Multi-‐Criteria Decision Making: An Operations Research Approach. Encyclopedia of Electrical and Electronics Engineering, [Online].15, pp.175-‐186. Available at: http://web.ntpu.edu.tw/~yml/yml/download/sysanal2009s/Triantaphyllou%20et%20al.%20(1998),%20Multi-‐Criteria%20Decision%20Making%20An%20Operations%20Research%20Approach.EEEE1.pdf [Accessed 21 March 2011] Triantaphyllou, E., 2000. Multi-‐Criteria Decision Making Methods: A Comparative Study. Dordrecht: Kluwer Academic Publishers. Twatchai Suwannakum, 2008. Mini-‐grid System for Rural Electrification in the Great Mekong Sub Regional Countries. [e-‐book] Kasselç. Kassel University Press. Available at: http://books.google.es/ [Accessed 20 October 2011] UMEMD, 2009, Uganda Ministry of Energy and Mineral Development – Annual Report 2008 [Online] Available at: http://www.energyandminerals.go.ug/pdf/Annual%20Report%202008%20.pdf [Accessed 04 October 2011]

144
UNICEF, 2011. Uganda Statistics. [Online] Available at: http://www.unicef.org/infobycountry/uganda_statistics.html#79 [Accessed 18 October 2011] United Nations Conference on Environment & Development, 1992. AGENDA 21. United Nations Sustainable Development, [Online]. Available at: http://www.un.org/esa/sustdev/documents/agenda21/english/Agenda21.pdf [Accessed 7 July 2011] UNDP United Nations Development Programme , 2004. World Energy Assessment. Overview 2004 Update, [online]. Available at: http://www.undp.org/energy/weaover2004.htm [Accessed 04 October 2011] UNData, 2011. Uganda. [Online] (Updated 19 Sep 2011) Available at: http://data.un.org/CountryProfile.aspx?crName=Uganda#Economic [Accessed on 18 October 2011] UN-‐Energy, 2010. UN-‐Energy Looking to the Future. United Nations, UN-‐Energy, [Online]. Available at: http://www.unido.org/fileadmin/user_media/News/2010/UN-‐Energy_Looking_to_the_Future.PDF [Accessed 7 July 2011] U.S. Department of State, 2011. Bureau of African Affairs. Background Note: Uganda [Online] (Updated 21 Oct 2011) Available at: http://www.state.gov/r/pa/ei/bgn/2963.htm [Accessed 15 Dec 2011] U.S. Department of Energy -‐ Energy Efficiency and Renewable Energy, 2005. Biomass Program. Pyrolysis. [Online] (Updated 13 Oct 2005) Available at: http://web.archive.org/web/20070814144750/http://www1.eere.energy.gov/biomass/pyrolysis.html [Accessed 10 April 2011] Vanclay, F., 2003. SIA Principles, International Principles For Social Impact Assessment. Impact Assessment and Project Appraisal, [Online] 21 (1) pp. 5–11. Available at: http://www.socialimpactassessment.com/documents/0303%20Vanclay%20IAPA%20V21N1%20SIA%20International%20Principles_1.pdf [Accessed 6 July 2011]

145
Wei, D., Lu, X., Lu, Z. & Gu, J., 2007. Performance analysis and optimization of organic Rankine cycle (ORC) for waste heat recovery. Energy Conversion and Management. 48, pp. 1113-‐1119, Available at: http://www.sciencedirect.com/science?_ob=MImg&_imagekey=B6V2P-‐4MK0HFJ-‐1-‐1&_cdi=5708&_user=1517299&_pii=S0196890406003347&_origin=gateway&_coverDate=04%2F30%2F2007&_sk=999519995&view=c&wchp=dGLzVlb-‐zSkzS&md5=15003951149a13c740de17cad72611e0&ie=/sdarticle.pdf [Accessed 15 April 2011] Weisbrod, G. & Weisbrod, B., 1997. Measuring Economic Impacts of Projects and Programs. Economic Development Research Grup. [Online] Available at: http://www.edrgroup.com/pdf/econ-‐impact-‐primer.pdf [Accessed 4 September 2011] Whitman, T. & Lehmann, J., 2009. Environmental Science & Policy. Biochar—One way forward for soil carbon in offset mechanisms in Africa?, [online]. 21 Aug., pp. 1024-‐1027. Available at: http://www.sciencedirect.com [Accessed 05 April 2011] World Bank Independent Evaluation Group, 2008. The Welfare Impact of Rural Electrification: A Reassessment of the Costs and Benefits An IEG Impact Evaluation. [e-‐book] Washington D.C. The International Bank for Reconstruction and Development / The World Bank Available at: www.worldbank.org [Accessed 15 October 2011] World Health Organization, 2011. Water Sanitation and Health (WSH) [Online] Available at: http://www.who.int/water_sanitation_health/diseases/lead/en/) [Accessed 10 October 2011] Yamamoto, T., Furuhata, T., Arai, N. & Mori, K., 2001. Design and testing of the Organic Rankine Cycle. Energy. 26, pp. 239-‐251, Available at: http://www.sciencedirect.com/science?_ob=MImg&_imagekey=B6V2S-‐42MFDGM-‐2-‐27&_cdi=5710&_user=1517299&_pii=S0360544200000633&_origin=gateway&_coverDate=03%2F31%2F2001&_sk=999739996&view=c&wchp=dGLbVtz-‐zSkzV&md5=ae47493ed8797caf391ac12d011f8c2a&ie=/sdarticle.pdf [Accessed 15 April 2011] Zerriffi H., 2011. Rural Electrification, Strategies for Distributed Generation . London, UK: Springer.

146
Appendices
Appendix I The Absorption Chiller Working Process The functioning of the absorption chiller is relevant in order to understand how should it be applied in case it is selected as a possible output for the thesis work. The Figure I shows the different parts involved in the system. Then, to facilitate the comprehension of it, an explanation of the process is also done.
Two different fluids perform the cycle of the absorption chiller; one is called refrigerant and the other is called absorbent. The most commonly used combinations of fluids are water-‐lithium bromide or ammonia-‐water, refrigerant and absorbent respectively. In order to understand the procedure of the system, the explanation will start from the absorption cycle (Combined Heat and Power, 2007).
• In the absorption cycle the two fluids are combined and then separated. The low-‐pressure refrigerant vapour that arrives at the absorber is combined with the absorbent; this process releases a big amount of heat. The solution of the two fluids is pumped into the generator that works at high pressure. In this point the heat, which is being reused, is added to the process. This heat produces the evaporation of the refrigerant and the subsequent separation of the two fluids, the refrigerant in vapour and the absorbent as liquid. In this point, the absorbent is leaded to an expansion valve before going back to the absorber by the pressure difference, meanwhile the vapour refrigerant flows to the condenser.
• The high-‐pressure vapour refrigerant in the condenser rejects the heat and becomes high-‐pressure liquid.
• The next step is to transform this high-‐pressure liquid into a low-‐pressure fluid. An expansion valve that is placed right after the condenser performs this process.
• Once we have the low-‐pressure liquid it is leaded into the evaporator. In order to perform the evaporating process at low pressure, the liquid absorbs an
heat input, cooling rate
condenser
absorberevaporator
generator
QabsQevap
QgenQcond
expansionvalve
solutionpump
expansionvalve
refrigerantpump
heated refrigerant(vapour)
concentrated solution
diluted solution
cooled refrigerant
heat rejection heat input
heat rejection
1
Figure I. Absorption Chiller, Working Diagram (Gordon & Choon, 1995)

147
amount of heat that creates the cooling system by a heat exchanger. Right after converting the fluid into vapour it is driven again into the absorber where the cycle starts again.
2

148
Appendix II The ORC Turbine Working Process The functioning of the ORC turbine is relevant in order to understand how should it be applied in case it is selected as a possible output for the thesis work. The Figure II shows the different parts involved in the system. Then, to facilitate the comprehension of it, an explanation of the process is also done.
The process on going within the system is easy to understand. It is based in five basic components, these are: the working fluid, the evaporator, the turbine, the condenser and the pump (Yamamoto et al., 2001). The diagram (Fig. 8) shows how the system is distributed. The process starts in the evaporator where the waste heat recovered transfer the thermal energy into the working fluid evaporating it at a high pressure. The flow is directed to the turbine in which is transformed into mechanical power. The working fluid, during the process in which it transfers energy to the turbine, suffers a drop on the pressure. The low-‐pressure vapour is introduced in the condenser in which will exchange heat with another fluid and turned into liquid. In the last step of the process the working fluid is pumped to the evaporator again, in which the cycle begins again (Wei, et al., 2007).
evaporator
condenser
Heat exchange
Heat input
turbine
pump
Figure II. ORC Turbine, Working Diagram (Yamamoto, et al. 2001)

149
Appendix III Field Trip – Identification of Potential Sites The collection of relevant data, for the analysis of the potential locations for the GP, is done by filling the following form:
Visit to: (Name of the area, village, community, etc.) 1. Area
1.1. Geographical placement 1.2. Extension of the village, community, town. (Approximate distances) 1.3. National grid expansion possibilities
2. Population 2.1. Households 2.2. School covering 2.3. Economical level (possibilities of consumption, will of payment, capacity of
acquiring devices which need of energy, etc.) 3. Industrial/Commercial/Social activities
3.1. Main activity 3.1.1. Industrial (Cooperatives, farms, mills, etc. 3.1.2. Commercial (Markets, stores) 3.1.3. Social (Schools, cultural houses)
3.2. Energy consumption per sector (estimated) 3.2.1. Industrial 3.2.2. Commercial 3.2.3. Social
3.3. Population involved in these activities 3.4. Further possibilities (cooperative creation, implementation of other activities, such
milling if there is not currently existing) 4. Current energy resource(s) 5. Biomass supply possibilities (agricultural activity)
5.1. Amount of activity (possible cover plant needs) 5.2. Type of crop
6. Social energy requirements 6.1. Households (cooking, light, etc.) 6.2. Community needs (milling, water pumping, feedstock conservation, medicines, etc.) 6.3. Other needs.
7. Conclusion

150
Appendix IV Weighted Product Model Example The best way to understand how the WPM is applied and work, is to explain an example from the beginning to the end. The WPM is a matrix-‐based system where the criteria and the alternatives are operated in order to obtain the best alternative; this means the alternative which better covers the criteria needs in a global approach, according to the weight criteria applied. In the Equation I, it is described how the different alternatives are assessed depending on the criteria and its weight, it shows the mathematical procedure to obtain the final result (Bridgman, 1922 and Miller & Starr, 1969 cited in Triantaphyllou, et al., 1998, p. 5):
Where:
, → are the actual values of performance of the alternatives.
→ number of criteria;
→ is the actual value of the i-‐th alternative in terms of the j-‐th criterion;
→ is the weight of importance of the j-‐th criterion.
If: is better than .
As example; For the project work it is need to decide between the alternatives A, B, C; knowing that the most important criteria to take in account in Z, Y, X. It is stated that the weight of the criteria is: Z=0.4; Y=0.35; X=0.25 The Figure III shows the alternatives, the criteria and how each alternative performs the criteria one per one:
R(AKAL
)= ∏N
j= 1
(aKj/aLj)Wj
AL AK
N
aKj
W j
R(AKAL
)> 1 ; AK AL
Z Y XWeight 0.4 0.35 0.25
A 15 20 8B 4 30 2C 18 23 19
Figure III. Example on filling a MCDA chart
Equation I. WPM Mathematic Operation to Rank Alternatives (Bridgman, 1922 and Miller & Starr, 1969
cited in Triantaphyllou, et al., 1998, p. 5)

151
Following the Equation II, which is the application of Equation I into this specific case and ranking A/B:
;
; so
The result obtained shows that for the specific purpose the alternative A cover the criteria requirements in a better way than B. Then;
and so it is easy to rank the alternatives as;
C is the best alternative. Ranking in the study case The way in which the classification will be done is following the example previously given. The main difference between the example and the study case remains in the quantity of alternatives. It is obvious that is easier to rank the options as less there are, but in the case under study the different possibilities will be compared following the numerical order. Thus, the first will be compared with the second; the most promising of those will be compared with the third and so on. The result out of all the comparisons made will be the guide that will be used to rank the alternatives.
R(AKAL
)= ∏N
j= 1
(aKj/aLj)Wj= (AZ /BZ )
0.4× (AY /BY)0.35× (AX /BX )
0.25
R( AB )= (15/4)0.4× (20/30)0.35× (8/2)0.25= 2,0820
A> 1
R( AC )= 0,7131 R( BC )= 0,3425
C> A> B
Equation II. Evaluation of Alternative A and B

152
Appendix V Brochures, Catalogues and Relevant Data related to the Possible Applications Assessed in the MCDA The Heat Pipe Exchanger Model can be seen in the Figure IV
Figure IV. Heat Pipe Exchanger Characteristics

153
The ORC Turbine Brochure can be seen in Figure V.
Figure V. The ORC Turbine Characteristics

154
The model of the Absorption Chiller used is shown in Figure VI.
Figure V. The ORC Turbine Characteristics

155
Appendix VI VI-‐Skogen Questionnaire – Site Visit Information Data:
1. Name of Institution/Village and purpose:__________________________________ 2. Name of Interviewee and contact:________________________________________ 3. Position in the institution/village:________________________________________ 4. Date of Survey:______________________________________________________ 5. District: _______________Sub-‐county: ____________Parish: ________________ 6. Village:____________________________________________________________ 7. How many people are hosted in your institution/village?______________________
Demand assessment:
1. How many meals are prepared per day (incl. Breakfast, lunch and dinner)?______ 2. How many hours do you spend cooking per meal?
Breakfast___h, lunch___h, dinner___h 3. How much fuel do you use every time you cook?___________________________ 4. Does the institution/village boil drinking water? YES/NO
If YES, how much water and how often?_______________________________ 5. How big are your cooking pots?
Between 5L and 15L_______ between 15L and 50L_______ over 50L_______ 6. How many rooms do you light during night? _______________________________ 7. How many hours do you light these rooms?________________________________ 8. Do you currently use solar power? YES/NO If YES how big is the system?__________________________________________ 9. How much money do you spend on energy per month or year?
Energy source
Usage (units / time)
Unit Cost (UGX / unit)
Cost each transport (UGX)
Purpose e.g. cooking, lighting, boiling, charging, productive use, radio etc
Diesel Battery Kerosene Candles Charcoal Firewood Biogas Cow dung LPG Electricity Alternative energy source (specify)

156
10. Questions about your energy supply? Energy source
Where to get your energy source?
Distance to supply location
Difficulties in energy supply
How do you store the energy fuel
Diesel Battery Kerosene Candles Charcoal Firewood Biogas Cow dung LPG Electricity Alternative energy source (specify)
11. How was the trend of your energy demand in the last 5 years? ________________ 12. What is the expected increase of the population in the next 2 years? ____________
Possible alternative fuels 1. How do you manage waste (kitchen, agriculture and excrements)? (e.g. pit-‐latrine,
compost, fertilizer)____________________________________________________ 2. Does your institution/village own an agricultural farm? YES/ NO
if YES, what type of agricultural farm?___________________________________ 3. How big is your farm? (e.g. 10 cows, 30 pigs, xx chicken, crops, trees. fruits etc.) _______________________________________________________________________ 4. What agricultural practices are in place? __________________________________ 5. What is the source of water supply? ______________________________________ 6. Do you have access to agricultural wastes (e.g. maize cobs, rice husks, charcoal fines,
grass, papyrus or cutting wood)? YES/ NO If YES, what kind of wastes? _______________________________________
7. How much waste would you be able to collect in a week______________________ 8. How much would it cost?______________________________________________
Environmental awareness: 1. Have you ever heard of Environmental degradation or Global warming? YES/ NO
If YES, what are you doing for / against it?________________________________ 2. Are you currently using energy efficient technology to burn fuels? YES/ NO
If YES, which technology?____________________________________________ 3. Have you ever participated in any Environmental awareness campaign? YES/ NO

157
If YES, which campaign (e. g. tree planting) ?_____________________________ 4. Would you be willing to use modern technologies to conserve the environment (e.g.
biogas, gasification, rainwater harvesting, composting, organic farming, beekeeping, wast collection)? YES/ NO
If YES, which technology and how much are you willing to spend extra?________

158
Appendix VII Data Summary for the MCDA Chart The data shown is the one used to fill the MCDA chart. It is a sum of the data extracted from the field trips and the information of the brochures and the working characteristics of each of the applications assessed. The compilation adds facts from the sections 4.3 Pilot Area and 4.4 Applications and Life-‐Services; as well as from the Appendix III, V and VI). It is easy to see that the data has been arranged following the different criteria that are analyzed in the MCDA. For each studied application there is a description and a definition of the data to be used in the MCDA chart. 1. Biochar As it has been mentioned before the biochar is one of the main outputs of the system. Thus, the biochar is produced continuously during the gasification process. The importance of this application as fertilizer is coming from that it is a key example for the cradle-‐to-‐cradle approach. The expected business model is to sell biochar back to the farmers’ cooperative, which the Pamoja Company buys the biomass from. • Economical Cost:
There is no an extra investment cost for this application since the biochar is produced as an output. However, to be more specific, the operational cost of collecting biochar could be added (it is excluded in this study)
• Economical Benefit for Pamoja Cleantech: The price of the fertilizer could be set according to the chemical based fertilizer market prices. On the other hand, charging the farmers for biochar could decrease the willing of applying the fertilizer. Hence, the application could start with a pilot project to see the results and benefits of the application to convince the farmer cooperative. Or another alternative could be an agreement between the cooperative and Pamoja which sets a relative discount on the biomass input.
• Development Empowerment: The fertilizer would increase the yield of the product. Thus, the farmers would have more goods in the end of the harvesting seasons. From the field trips, the researchers know that the farmers would like to apply fertilizer but in the present, they cannot because of the high fertilizer prices.
• Population Coverage: The amount of people affected by this system would be the entire farmer cooperative, 100% of the cooperative members.
• Electricity Consumption: There is no electricity consumption neither for producing nor applying the biochar.
• Environmental Care: As it has been mentioned in the section 2.3 The Green Plant and the Potential Applications, the biochar application is very effective on the yield and it eliminates the negative environmental impacts of the chemical based fertilizers.
• Life-‐spend: For this application it was complicated to define the life-‐spend. The number of the harvesting season during one year could be a base line; however, it would

159
not give a fair comparison with the other alternative. Hence, the authors have decided to give the lowest grade for this application by considering that the farmers need some time to see the agricultural benefits after applying the soil amendment.
2. Mini-‐Grid The electricity is the major output of the system. The GP will provide electricity for the telecom tower and for the community. A device, so called “off-‐grid inverter”, will perform the power management of the system. The main system components are the batteries, which are charged by the GP output and the inverter, which reverts the alternative current network into direct current to charge the batteries. The households are connected to the GP by the mini-‐grid. The entities of the MCDA chart is filled based on this off-‐grid inverter • Economical Cost: 9700 USD
o Initial Investment: § Off-‐grid inverter: 2600 USD
Ø Technical details: AC output: 230/250 V 50/60 Hz AC input (generator): 230 50/60 Hz Dimension (W/H/D): 450 / 425 / 165 mm Weight: 23 kg
§ 6 batteries: 4470 USD Ø Technical details:
Battery DC input: 24 V 90 A Battery type: Lead / NiCd Battery capacity: 100 Ah....1000 Ah
§ Other (power management system devices): 2630 USD • Economical Benefit for Pamoja Cleantech:
The budgeted price for electricity selling is set to 0.52 USD/kWh for the telecom company and 0.25USD/kWh for the community by Pamoja AB. This application is one of the most economical beneficial applications for the company.
• Development Empowerment: The rural electrification problem may be the most crucial issue of lacking basic human needs. To avoid this problem would have a significant impact on society’s development. This application would make lightning possible at home, allow using telecommunication opportunities (mobile phone charging, radio, tv etc.) and a leading fact, it would make educational options increase. In addition, it would make to run some business activities such as electrifying the shops, running machinery equipments, etc.
• Population Coverage: Different then the major part of the application, instead of concerning just the farmers, this application covers different part of the community and also households.
• Electricity Consumption:

160
From the nature of the application, the usage of energy to charge batteries does not take into account as electricity consumption.
• Environmental Care: One of the alternative solutions of the supplier is to use lead-‐acid batteries. The lead is a recyclable material but yet it is extremely toxic. Even a small amount of exposure can cause brain and kidney damages. The supplier did not provide any information about the lifetime of the batteries but we could assume it as same as the lead-‐ acid car batteries, which is three years. The other option is to use nickel-‐cadmium (NiCd) batteries. Industrial NiCd batteries contain 6% cadmium, which is a toxic heavy metal. The accumulation can cause a significant pollution. This fact makes the situation more sensitive and therefore the disposal part requires a special care.
• Life-‐spend: The supplier did not provide any information about the life-‐spend of the system either. However, an estimation can be done by looking at the warranty issues. The supplier provides a free warranty during first 5 years, and then it could be prolonged for 10 to 15 years optionally. So, the input value for the MCDA chart is taken as 15 years (excluding the battery replacement issue).
3. BCS The battery charging system has two main components. The first one is the rectifier, which is an electrical device that converts alternating current (AC) to direct current (DC). The rectifier transfers AC after the generator to DC in order to charge the batteries. The second device is coming right after the rectifier, the charge controller. This equipment is used to ensure that the system is working, and protect the system against overloads (this would protect the batteries and the generator). An overview of the system is given below, see Figure VI;
Economical Cost: The main device of the system is the microprocessor controlled rectifier/battery charger. The equipment, either single-‐phase or three-‐phase systems, is designed
Figure VI. BCS Conceptual Layout
Charge Controller
Rectifier
+
Biomass

161
to supply DC power to sensitive loads at a constant uninterrupted voltage, free from the usual utility power line distributions.
o Initial Investment: § The charger: 340 USD
• Economical Benefit for Pamoja Cleantech: The budgeted price for electricity selling is set to 0.52 USD/kWh for the telecom company and 0.25 USD/kWh for the community by Pamoja AB. This application is one of the most economical beneficial applications for the company.
• Development Empowerment: The rural electrification problem may be the most crucial issue of lacking basic human needs. To avoid this problem would have a significant impact on society’s development. This application would make lightning possible at home, allow using telecommunication opportunities (mobile phone charging, radio, tv etc.) and a leading fact, it would make educational options increase.
• Population Coverage: Different then the major part of the application, instead of concerning just the farmers, this application covers all the community and households.
• Electricity Consumption: From the nature of the application, the usage of energy to charge batteries does not take into account as electricity consumption.
• Environmental Care: The system is designed to run with lead-‐acid batteries (12V, 40-‐70 Ah). These are the same batteries that the community is already using these batteries with diesel generators or national grid. One material issue related to the environmental aspect, is the disposal phase. Most of the suppliers indicate the lifetime of a car battery as three years. The stakeholders should take into account this fact and pay attention on disposal and recycling systems. The lead is a recyclable material but yet it is extremely toxic. Even a small amount of exposure can cause brain and kidney damages. On the other hand, recharging batteries would decrease the use of the dry cell batteries, which are thrown into the nature after being used.
• Life-‐spend: The supplier did not provide any technical data on the life-‐spend of the charger. But the estimated life span of the batteries is around 6 or 7 years.
4. The Heat Pipe Exchanger Taking in account that the coffee dry process is done by natural heat, that means sun-‐heat, it takes a long time and, what is more important, this time is unpredictable due to the uncertainty over weather, especially during the rainy season that is when the harvest is done. The possible use of heat just by extracting the hot air from inside the container and stream it where the coffee is, and by this reduce the drying time considerably, could be an efficient and cheap way to improve the actual coffee drying process. This process could help to cool down the temperature inside the container, and by that reducing

162
possible harm to the operators and the machinery. • Economical Cost: 2,820 + 73.93 = 2893.93 USD.
o Initial Investment: § The price of the device is 2,820 USD.
o Maintenance: Total cost 73.93 USD § Annual electricity consumption cost for the functioning of the device is
8.73 USD. § Possible repairing. 120 USD every 4 years for fans’ replacing. § The estimated maintenance cost by the company is 65.2 USD. § 5-‐year warranty included in the purchase.
• Economical Benefit for Pamoja Cleantech AB: There is not defined direct profit out of this activity;
• Development Empowerment: Reduction in drying time, this fact allows to control the production and to have beforehand the timing of each step of the process, therefore there is a better planning and a more efficient work. It won’t promote directly any development or create any job, but the capacity of predicting when the harvest is going to be ready to process let the people get ready and stay on step further than now.
• New Business Opportunity: The implementation of this system can empower the farmers to increase coffee production and so, whether more people will be related to farming or current farmers will hire people to help them increase their yield.
• Population Coverage: The amount of people affected by this system would be the one that is currently producing coffee. In the village where the pilot plant is placed 70 households over a total of 110 are dedicated to coffee crop, which means almost 65% of the total population is dependent on this activity.
• Electricity Consumption The amount of electricity consumed for the functioning of the device, it is up to 44.16 kWh/y.
• Environmental Care: The material used in this system is mainly aluminium, which is cheap and easy to recycle. The heat pipes which have alcohol inside, small quantity of it, do not have to be replaced until the system is replaced, which means more than 10 years of use. That makes the system not very harmful for the environment. The level of noise is between 58 – 62 dB. It is the same grade of noise than the sound of a full restaurant. The sustainability of the system could be improved by the use of the heat in other tasks apart than drying the coffee. Thus, shorten the payback time and add extra value to the whole concept. The cooling capacity of the system is up to 2.19 kW, taking in account that the estimated heat load in the container is 12.126 kW is supposes a recovery of almost 20% of the heat. Thus, it can be stated as good performance
§ Life-‐spend:

163
The estimated lifetime work of the device is above 10 years, although the moving parts of it (fans) should be replaced every 4 – 5 years.
5. Recuperator The recuperator is a heat exchanger device, as the heat pipe, it could be used in many applications, mainly improving the coffee drying system or drying the biomass input in the hopper, among other possibilities. The efficient recovery of heat by using this system is not possible because the quantity and quality of the heat source does not reach the desired level for this kind of device. Therefore, the application of this system is not feasible in the Green Plant. It is discarded for the MCDA. 6. Absorption Chiller The output of the absorption chiller is a cool fluid. This fluid could be used to refrigerate other fluids or, in few cases when it works almost ideally, its cooling service chills some food products for a longer preservation. In the study case, the non-‐continuous functioning of the gasifier automatically discards this option. Thus, the cooling system would be used as a refrigeration application for any machine or even for the Green Plant itself, or other device applied to the system, as battery charging. • Economical Cost:
o Initial Investment: 45,183.26 § Purchase Cost USD.
o Maintenance: § Cost of electricity consumption USD. § Possible repairing (likely following brochure) § Warranty; No data § Other cost.
• Economical Benefit for Pamoja Cleantech AB: The direct benefit for Pamoja would be the selling of the cooling service to the community, for shared purposes, selling the service to a micro-‐enterprise or to the households that could afford it.
• Development Empowerment: One of the most likely uses of the cooling service is short storage of milk and food products, and the locals declared during the surveys, the storage of milk, even for 1 or 2 days, can imply an arise of product prices, and directly increase the revenues of the producers.
§ New Business Opportunity: There is no possible creation of new business because it would be Pamoja, the actor who is selling the service directly to a customer, is not selling energy to facilitate the implementation of new business in that direction.
§ Population Coverage: The whole cooperative would be benefited if the milk business increases its revenues, 100% of the members of the cooperative. The cooling service would be available to all those customers that will to pay for the service, but at first

164
sight is open to everybody. § Electricity Consumption:
The electricity consumption is mainly related to the hours of service, but as a cooling service, it is supposed to be working 24 hours a day, everyday of the year. Supposing that the storage is done for 10 months a year, full load and 24 hours a day, the consumption of electricity per year would be: Power input: 0.072 kW. Working 24 hours per day: 1.728 kWh/day. And under the working regime described before: 518.4 kWh/year.
§ Environmental Care: The principal positive factor of this system is that it uses recovered heat to produce cooling service. It is re-‐using waste energy and so, it is an environmental-‐friendly device.
§ Life-‐spend: There is no data related to the life-‐spend of the product, and so, it will be negatively graded in order not to overrate it.
7. Organic Rankine Cycle Turbine
The ORC Turbine is used to produce a mechanical movement, to transfer it to a shaft, after the recuperation of thermal energy. This system is still under experimentation and constant improvements. Despite of this, the immediate future of this application is promising, and that reason pushed the researchers to include this system into the project.
§ Economical Cost: o Initial Investment: 15000 USD + Bad maintenance conditions. o Maintenance:
§ Cost of electricity consumption: 0 USD. § Possible repairing: Likely of failure due to the fact that it is still under
development. § No Warranty.
§ Economical Gross Benefit for Pamoja Cleantech AB: There is a very likely benefit for the company as the service can be potentially sold to the cooperative.
§ Development Empowerment: The farmers that could benefit of this service would significantly increase their revenues by adding value to its product (further processing). It would also have a positive impact on local economy and in the cooperative expanding possibilities.
§ New Business Opportunity: It will probably foster the creation of new jobs in the coffee and maize processing activity as it is improved by the application. May be new machinery can be purchased and other agricultural activities can be started taking advantage of the possibility that using mechanical power brings.
§ Population Coverage: Farmers that crop coffee and maize would benefit of the mechanical power

165
produced by the ORC turbine because it would drive the mills. § Electricity Consumption:
There is no electricity consumption for the functioning of this device. It works with the waste heat of the exhaust gas.
§ Environmental Care: The material used for the construction of the ORC turbine is mainly stainless steel. The noise level is less than 40 dBA at 10 meters of distance. The fact that the energy is coming from the re-‐use of waste energy makes this application very environmental-‐friendly.
§ Life-‐spend: No data given by the producer. No estimation as it is a new product that is still under experimental stage.

166
Appendix VIII Mini-‐Grid Design, Technical Data and Calculations. The stages done in this appendix could be listed as a continuation of what is done in the report, section 5.2.1 General View of the Application, in the mini-‐grid case. In the report, the last step done is the “III. System Layout”. Therefore, the explanation will continue from this point. IV. Line configuration After assessing the different possibilities for the line configuration, and due to different reasons that are stated below, the final election has been to apply a three-‐phase four-‐wire (wye) configuration.
• Ugandan nominal voltage is 240V. Three-‐phase configuration allows the connection to this voltage, and so, most of the items and devices could be connected to the mini-‐grid without the need of any change.
• Three-‐phase configuration is cheaper because it uses less conductor material to transfer the same voltage than the equivalent in other configurations.
• Three phases can be split into single phases for household and community usage for low voltage.
• Allows the connection to larger demanding equipment. V. Conductor
a. Type of conductor The conductor type selected for the mini-‐grid distribution line is: Aluminium Conductor Steel Reinforced (ACSR) (Inversin, 2000; Suwannakum, 2008). The main characteristics of ACSR are:
• It’s conductivity properties are lower compared to copper. Aluminium needs 1.6 times the area for same conduction.
• Smaller weight per unit length than copper, it allows to implement longer spans and so, potentially use fewer poles, related economical savings.
• To increase its strength it can be wrapped around a steel core to obtain steel-‐reinforced ACSR, which is the most widely used conductor for lines.
• Special care has to be taken when it comes to the use of it crossing roads or between houses, avoiding eventual people contact to it must be a preference.
The given characteristics of the conductor are used in all the following calculations done to establish the size, length, and configuration of the distribution lines.

167
Line Main line Line 7 (engine start-‐up)
1, 2, 3, 3.1, 4, 5, 5.1, 5.2, 6
Code Name Sparrow Penguin Turkey Type ACSR ACSR ACSR Size (AWG -‐ mm2) 2 – 33.62 4/0 – 107.2 6 – 13.30 Resistance AC @ 75 ºC (ohms/km)
1.08 0.39 2.64
Reactance @ 75ºC – 0,3m spacing. (ohms/km)
0.418 0.346 0.481
Weight (kg/100m) 13.54 43.30 5.35 Length per selling unit (m)
736.568 926.592 2729.484
Price per selling unit (USD)
452 362 481
b. Sizing of the conductor
It is important to be as accurate as possible with the following calculations to establish the size of the conductor for each line, as the cost of the conductor is one of the main expenses in the implementation of a mini-‐grid. Also the performance of the grid is dependent on the accuracy of the estimations and results obtained, an established sized smaller than the required could lead to problems in the electricity supply. The sizing is dependent on the load that has been estimated previously. Once the design of the mini-‐grid and the loads are established, the determinant factors to maintain an acceptable voltage level are the type and size of the conductor and the power factor determined per line. So, in the next steps, the power factor and the voltage drop are described. The data, related to the conductor, needed to make the following calculation is given below, Table V (Southwire, 2001; Nexans, 2011).
• The power factor (PF) The PF is dependent on the uses of the electricity. For an incandescent light bulb the power factor is 1, the maximum, while a fluorescent light can reach 0.6 (Inversin, 2000). To calculate the power factor of the main 4 customers: household, stores, schools and productive uses, the characteristics of the loads are taken in account. As it is not possible to assess the power factor of all the items connected, the main end-‐users have been analyzed to see which components are connected in each case, and in that way, estimate which can be the power factor. The estimations made are always bearing in mind the importance that a big difference between the real power factor and the estimated one could mean, regarding the performance, problems and possible failures.
Table V. Characteristics of the Conductor for each Line

168
For this case is important to state that the mill needs of an electrical motor to work. Thus, the characteristics of it are stated below; see Figure VII. These characteristics are used in the rest of calculations that are made further on.
The Table VI shows the estimated PF of each of the elements included in the mini-‐grid. As said before, the data in Table VI is an estimation, and the relevance is depending on the importance of each element within the grid, that is the energy consumption that each has over the total consumption.
Figure VII. Characteristics of the Electrical Motor

169
Customer Item load (W) PF % of load over total
Household Bulb light 60 1 75 % of the load is due to bulb lighting Radio 5 -‐
Phone Charger 5 -‐ Others 10 -‐
Stores Bulb light 160 1 20 % of the load is due to bulb lighting Charging 300 -‐
Other 300 -‐ Schools Bulb light 450 1 64 % of the load is due to
bulb lighting Leisure 250 -‐ Productive Activities
Seed Dry 2200 -‐ 58 % of the load is due the milling machine Milling 7500 0.86
Mill lighting 120 1 Refrigeration 3000 -‐
Regarding what mentioned before about power factor limits (between 0.6 and 1), and relating the estimations with the percentage of load per customer, the different assumptions for the power factor have been made, as accurate as possible and trying to generous, reaching a lower power factor to be in the safe-‐side for the design issues. So, in the Table VII it is a list of the final PF. The estimations are based on the information at researchers’ disposal; when the PF is unknown, is estimated as 0.6, the lowest, worst possible scenario. An average PF is calculated for each final user, as it is what is relevant for the calculations, the PF at the end of the line.
Customer Power factor estimation Power Factor
Households 75% =1; 25%=0.6; 0.9 Store 20%=1; 80%=0.6; 0.68 School 64%=1; 36%=0.6; 0.85 Productive Activities 58%=0.86; 1%=1; 41%=0.6; 0.75 Average global power factor 0.795 Once the PF is calculated, the next step is to find to the voltage drop per each line. The calculation of the PF for each line depends on the load it has to bear. And so, as example, the PF for the “main line” is; see Equation III.
!" !"#$ !"#$= (!" !"#$%ℎ!" + !" !"#$% + !"#$ℎ!!")
3= 0.81
Table VII. Power Factor Estimation
Table VI. Power Factor of each Customer
Equation III. Power Factor

170
• Voltage Drop (VD) High voltage drops in the line will lead to a poor service, creating distrust and so, a future loss regarding potential new customers and demand of the service. The possible voltage drop has to be analyzed in order to minimize it. The voltage drop can be reduced by an increase of the conductor size. After assessing the distribution of the line, the loads and its layout, it has been decided to treat each line independently assuming all the load at the end of the line, and in that way, have a more accurate view of what are the exact voltage drops per line. This deep analysis allows the researchers to treat differently each line if it is needed. The calculation of the voltage drop per each line is long and complicated, and so, an example is stated for the line 7. It is understandable that the same process has to be applied to the rest of the lines. The case of line 7 is special because of the electrical motor start-‐up. To calculate the voltage drop per line there are 4 equations that must be applied; there are also a few concepts that must be introduced before for a better understanding of the equations; see Table VIII.
Sign Element Measure VD Voltage Drop Volt E Nominal Voltage Volt P Power Input kW I Intensity Amperes cosØ Power Factor x Line reactance Ohms/km r Line resistance Ohms/km L Longitude of the line Meters Pl Power loss kW Once the elements that are going to be used have been defined. The next step is to give the values of each of those elements for the “main line” characteristics, see Table V. The application of the values in Table V in the following equations (see Equation IV, V, VI and VII) will give the results in Table IX. The voltage drop (VD) per phase is shown in the Equation IV; in order to calculate the VD it is needed the intensity, which is calculated in the Equation V. Then, the Equation VI calculates the power loss. To conclude, the percentage of power loss compared to the total power supplied is calculated by the Equation VII.
Table VIII. Elements Used in the Calculations

171
!"! = ! ∗ ! ∗ !"#∅ + ! ∗ !"#∅ ∗ !
! =! ∗ 1000
!"#∅ ∗ ! ∗ 3
!! = !! ∗ ! ∗ !
!" % =!"
! ∗ 1000∗ 100
After applying these equations, the voltage drop can be calculated for all the lines. The results are shown in the Table IX.
Line Conductor Size (AWG) Voltage Drop Power Loss % Power Loss
Main 2 11,92241177 117,4871717 1,174871717 1 6 0,047944065 0,067005479 0,008590446 2 6 1,524486062 3,772290809 0,18861454 3 6 1,559582342 2,993197279 0,199546485 3.1 6 0,203264808 0,201188843 0,025148605 4 6 0,479440655 0,670054787 0,08590446 5 6 1,728604814 7,336121633 0,21964436 5.1 6 2,089840338 3,583056689 0,26739229 5.2 6 0,325223693 0,257521719 0,040237769 6 6 1,170326932 1,174291939 0,209694989 Before concluding with this sizing, a key factor must be accounted, the start-‐up conditions of the motor connected to line 7 (Productive Uses). A huge voltage drop during the starting-‐up of the engine could lead to a bad performance, even to the impossibility to running the motor. The first step is to define the motor used and its characteristics; see Figure VII. To calculate the input power (Pi) that the electrical motor needs for the start-‐up, the Equation VIII is used; ! is the efficiency of the motor, is 0.914 (see Figure VI); cos∅ is the estimated PF for the start-‐up, defined as 0.76, lower than the normal; Po is the output power desired, in this case 7.5 kW.
Equation IV. Voltage Drop
Equation V. Intensity
Equation VI. Power Loss
Equation VII. Power Loss Percentage
Table IX. Voltage Drop per Line
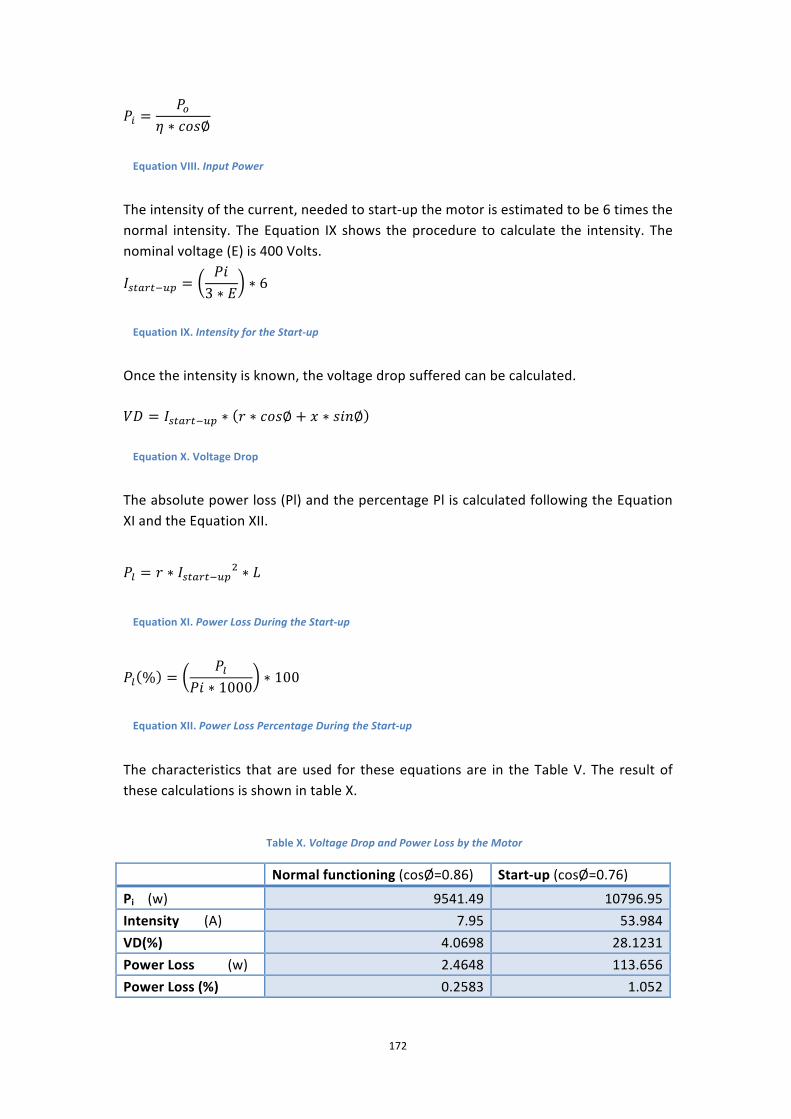
172
!! =!!
! ∗ !"#∅
The intensity of the current, needed to start-‐up the motor is estimated to be 6 times the normal intensity. The Equation IX shows the procedure to calculate the intensity. The nominal voltage (E) is 400 Volts.
!!"#$"!!" =!"3 ∗ !
∗ 6
Once the intensity is known, the voltage drop suffered can be calculated. !" = !!"#$"!!" ∗ ! ∗ !"#∅ + ! ∗ !"#∅
The absolute power loss (Pl) and the percentage Pl is calculated following the Equation XI and the Equation XII.
!! = ! ∗ !!"#$"!!"! ∗ !
!! % =!!
!" ∗ 1000∗ 100
The characteristics that are used for these equations are in the Table V. The result of these calculations is shown in table X.
Normal functioning (cosØ=0.86) Start-‐up (cosØ=0.76) Pi (w) 9541.49 10796.95 Intensity (A) 7.95 53.984 VD(%) 4.0698 28.1231 Power Loss (w) 2.4648 113.656 Power Loss (%) 0.2583 1.052
Equation VIII. Input Power
Equation IX. Intensity for the Start-‐up
Equation X. Voltage Drop
Equation XI. Power Loss During the Start-‐up
Equation XII. Power Loss Percentage During the Start-‐up
Table X. Voltage Drop and Power Loss by the Motor

173
The line 7 uses the ACSR of 107.2 mm2. It allows a better performance for the motor to start-‐up and, obviously, it improves the outputs of the smaller sizes. Although, it has unavoidable drawback that is imply in its size, more amount of material is needed, thus, more costly. After the analysis of the conductors for all the lines, the following conclusions can be extracted:
• The voltage drops, thus, power losses are very small, almost all are under the 1%.
• Most of the lines use the same sizing so it simplifies the implementation and is likely to reduce cost as the demand is higher
• The Line 7 is treated separately because it has to bear the start-‐up of the engine. After a deeper assessment, the size previously selected has had to be removed due to performance problems.
• The fact that the size of the conductors is small will have a positive economical effect in two ways. First, the investment cost is lower, and secondly, the possible repair or replacement of wires is easier and cheaper than using bigger sizes.
The final characteristics of the conductors are shown in the Table XI.
Line Conductor Size Length (km) Total length/conductor (km) Volume (m3)
Main 2 0.37 1.48 12.58 1 6 0.01 5.4 0.34 2 6 0.15 5.1 3 6 0.2 6.8 3.1 6 0,05 1.7 4 6 0.1 3.4 5 6 0.1 3.4 5.1 6 0.3 10.2 5.2 6 0.1 3.4 6 6 0.34 11.56 7 4/0 0.1 0.4 10,72
Total 1.82 7.28 69.2 As the configuration of the system is three-‐phase four-‐wire, the total length of conductor that is needed is four times the length per line, because each line has three phases and the neutral. As it can be seen in the Table XI, the largest amount of cable is needed for size 6 AWG, which is the used in the majority of lines.
• Cost of Conductor The total cost of the conductor per each line is dependent on three main factors. The cost of the material, the transport of it and the installation costs.
Table XI. Final Characteristics of the Conductors for all the Lines

174
Cost of Material The calculation of the total cost of the material is according to the data given by the supplier of the ACSR (Southwire, 2011). The data is collected in the Table XII.
Type Total length
(km) Total km/unit
Number of units needed
Weight per unit (kg)
Cost (USD/kg)
Total Cost (USD)
2 1.48 2.955 1 400.975 9.964 3995.68 6 5.4 4.698 2 400.975 10.604 8504.08 4/0 0.4 0.926 1 400.975 7.980 3200.08
Total cost of conductor material (USD) 15699.84 As can be seen in the Table XII, the total cost of the ACSR material is 15,699.84 U.S. Dollars. Transport The transportation costs of the material to the area where the mini-‐grid is implemented are hard to state and are also dependent on the supplier and on the customer. In order to evaluate the cost in a reliable way, the examples given in the mini-‐grid design manual (Inversin, 2000) have been taken in account; the transport arises as one of the main costs of the whole project. The case of the El Limón, in the Dominican Republic can be taken as an example, the international transport of the materials cost up to 17% of the total budget. In the case under study, the 20% of the cost of the material will be taken as the transport costs. Labor and construction costs. The labor and construction costs are also very difficult to assess without the appropriate data and especially in developing countries where there is a greater lack of regulations regarding wages and job conditions. As it has been made for the transportation cost case, an example from the bibliography has been used in order to evaluate the cost of labor and salaries for the physical implementation of the project. In the table of the mini-‐grid design manual, table 28 (Inversin, 2000 p.237), the labor cost per conductor is stated. In this case, the data used is equivalent to the one given for a 4-‐wire configuration, the same that is used in the project, and size and conductor type #6-‐ACSR.
Total length (km) Cost (USD/m) Total Labour Cost (USD)
7.28 0.44 3203.2 The Table XIII shows the data taken from the table 28 (Inversin, 2000 p.237) previously mentioned. In that way is possible to obtain a value for the construction cost of the
Table XII. Cost of the Conductor’s Material
Table XIII. Labor Cost per Distance

175
mini-‐grid lines. Total Cost for the conductor Merging the results of the cost for the material, transport and labor, it easy to obtain the final cost of the conductor for the mini-‐grid implementation. The table XIV shows the total budget just for the conductor.
Category USD Material 15699.84 Transport 4725.76 (20% of conductor total cost) Labour 3203.2 Total Cost 23628.8 US Dollars VI. Poles The importance of poles is really high in grid extensions that are not spread underground. The fact that the roads and the paths along the village are used to wire the area gives even more importance to the shape and structure of the poles, due to the traffic of vehicles and people passing underneath the electrified cables. The hazard to people’s health could be highly increased if the poles are not suitable for the area where are placed. The problem for poles’ design is that, in this study and due to economical facts, the poles’ raw material is taken from the surrounding area of the village. Using local materials would greatly reduce the potential costs of the whole mini-‐grid project, as it can be seen in other examples (Inversin, 2000) poles’ budget is one of the main costs of the entire mini-‐grid. Besides, it is decided not to use a very technical approach here because about this part there is absolutely no data from the locals or the field trips. The main problem related to the use of local materials is the possible environmental harm. In this case and due to the dimensions of the grid, it has been supposed that the amount of poles needed would not be a problem for the forestry sustainability of the area. The further calculations regarding poles, its potential tensions, fixing them to the ground, etc. are not accounted in this study. The ignorance about wind’s load or other key factors to bear in mind when studying the performance of poles forces the researchers to drop the more exact calculations at this point. The data given regarding poles layout and characteristics are; Material: Local wood source used. Minimum high (for bare phase conductor in areas with vehicular traffic in the U.S.A): 5m (Inversin, 2000). Number of poles: 43 Span: different span lengths according to the layout of the system.
Table XIV. Total Cost of the Conductor

176
The relation between the lines, the poles and its span length has been calculated in the Table XV and Table XVI. The list of the poles is done according to the mapping of the area. In the following snapshot, Figure VIII, the main poles and the different lines are highlighted in order to have a better understanding of how the system would look at the end.
Line Pole
Pole-‐to-‐Pole Span (m)
total line (m)
Start of the Main Line 1 1-‐2 10 10
2 2-‐3 30 40
3 3-‐4 30 70
4 4-‐5 30 100
5 5-‐6 30 130
6 6-‐7 10 140
7 7-‐8 40 180
8 8-‐9 40 220
9 9-‐10 40 260
10 10-‐11 40 300
11 11-‐12 40 340
End of the Main Line
12 12-‐13 30 370
Sekanyony Centre 13 13 0 370
Start of the Line 1 10 10-‐14 20 390 End of the Line 1 14 14 0 390
Table XV. Pole Distribution of the Main Line

177
Line
Pole
Pole-‐to-‐Pole Span (m) total line
(m) Star ofthe Line 2 13 13-‐15 40 430
15 15-‐16 40 470
16 16-‐17 20 490 End of the Line 2
17 17-‐18 50 540 Cluster 1 18 18 0 540
Start of the Line 3 19 19-‐20 40 580
20 20-‐21 40 620
21 21-‐22 40 660
22 22-‐23 40 700
End of the Line 3
23 23-‐24 20 720 School 1 24 24 20 740
Line 3.1 Cluster 3 25 24-‐25 50 790 Start of the Line 4 13 13-‐26 50 840
26 26-‐27 50 890
End Line 4 Trade Centre 27 27 0 890 Start of the Line 5
0 890
890
27 27-‐28 50 940
Cluster 2 28 28 0 940 Line 5.1
27 27-‐29 40 980
29 29-‐30 40 1020
30 30-‐31 40 1060
31 31-‐32 40 1100
32 32-‐33 40 1140
33 33-‐34 40 1180 School 2 34 34-‐35 10 1190
35 35-‐36 50 1240
Line 5.2 36 36-‐37 50 1290 End Line 5 Cluster 4 37 37 0 1290 Start of the Line 6
The Green Plant 7 7-‐38 40 1330
38 38-‐39 40 1370
39 39-‐40 40 1410
40 40-‐41 40 1450
End of the Line 6
41 41-‐42 40 1490 Cluster 6 42 42 0 1490
Start of the Line 7 2 2-‐43 30 1520 End of the Line 7 43 43 0 1520
Table XVI. Pole Distribution of the Mini-‐Grid Lines

178
Figure VIII. Pole Distribution in Sekanyonyi

179
VII. Mini-‐Grid Design Conclusion The design of a mini-‐grid comprises all the stages from the output of the power generator system, the source of electricity, to the end-‐user device. All the steps that must be performed in order to design the whole mini-‐grid system could be a report themselves, this fact added to the lack of reliable information and that the aim of the project is not to develop a mini-‐grid, pushed the researchers to just present an overview of a mini-‐grid example. And so, the data presented has to be taken as a general assessment, not as the exact design of a mini-‐grid. The calculations have been made as long as the researchers understood that the information given was relevant and actual, when a minimum point of reliability couldn’t be reached, the authors of the work decided to not perform the next stages of the design. A more global view is needed to understand the general functioning of the mini-‐grid, and it involves all the stages as impact assessment, business model, etc. done before. The main purpose of the mini-‐grid design’s overview has been to give a more real approach to how the mini-‐grid would look, and to have a basic understanding of its different parts, the economical costs and the technical issues regarding electrical engineering. The Figure IX shows the conceptual diagram of the mini-‐grid and its lines.
!"#$%&'()*+,),*! "#$$#%&'! ())*!*+,#%&'! -#&./%&'
0.)'1+))%'2$3%4'
-./)"0*10,2)3*
1+56)+,'(45+)'
7$894)+':'
(6.55$':'
7$894)+';'
()<3%,5%,#'7)%4+)'
0+3*)'7)%4+)'
7$894)+'='
7$894)+'>'' (6.55$'>'' 7$894)+'?'
7$894)+'@'
-53*'ABB'C'-53*'ADB'C'-53*'E'=@B'C'-53*'DBB'C'-53*'F'>'<C'-53*'F'@'<C'-#%)'(#G)'?HB'-#%)'(#G)'>'-#%)'(#G)'='
Figure IX. Final Mini-‐Grid Conceptual Diagram

180
Appendix IX Sizing the Heat Pipe Exchanger The calculation steps followed are taken from the brochure available in the website of the device supplier (Appendix V). The data relevant to the heat load in the container and the temperatures is according to data provided by Pamoja Cleantech AB. The heat is estimated after assessing heat loss temperatures along the gasification process. It can appear that some data is not justified or some devices related to the heat recovery are not mentioned, as the gasifier, it is due to confidentiality issues about the GP project. The Figure X shows a draft of the container with its dimensions, the dimensions are given in meters. It can be seen that is a common shipping container.
The first step then is to calculate the heat load inside the container. This value is function of the temperature in and out the container and the area of it exposed. The temperature are define as follows Tin = 70 °C (158 °F) Tout = 28 °C (82.4 °F) according to the data (aboutuganda.com, 200-‐) The areas exposed A1 = 8.6 * 8 = 68.6 m2 A2 = 8.6 * 20 = 172 m2 A3 = 8 * 20 = 160 m2 The total area of the container is calculated in Equation XIII; !"#$ = 2 × !! + 2 × !! + !! = 137.6 + 344 + 160 = 641.6 !"!
Then, the formula to account the heat load inside the container is shown in Equation XIV.
Figure X. Container Draft with Measures
Equation XIII. Area of the Container

181
! ! =9 × !"#$ !"! × !! − !! °!
36= 9 × 641.6 × 158 − 82.4
36= 12.126 !"
The used element in Equation XIV are described in the Table XVII. P Heat Load in watts Area Total Exposed surface of the container T1 Temperature inside the container T2 Ambient Temperature
The heat load inside the container is up to 12.12 kW for the temperatures evaluated. And so, in order to see which of their models fits better to the needs of this application, the following formula is applied, see Equation XV:
! = !" × ![!]∆![!°]
− (9×!"#$[!"!])
The elements used in the Equation XV are described in the Table XVIII.
C Container Cooling Rating Area Total Exposed surface of the container ΔT Allowable rise of temperature above ambient inside the container after
the service is installed P Heat Load in watts The device chosen is related to the cooling rating, the supplier provides a table with the rating of each of the devices that can be purchased. The value for C obtained in the formula must be smaller than the value of the chosen device in order to reach the desired conditions. The different considered models and the value of C for each of them are shown in the Table XIX.
Installed Unit C CC1200 1500 CC1400 1500 CC2000 2200
Equation XIV. Heat Load Inside the Container
Table XVII. Elements Included in the Calculations of the Equation XIV
Equation XV. Calculation of the Container Cooling Rating
Table XVIII. Elements Used in Equation XV
Table XIX. Relation of Absorption Chiller Model and Cooling Rating

182
It is easy to see that the value of C is directly dependent on the temperature rise that is allowed inside the container. As in the case under study the area of the container is very big, and the economic aspect is a big constraint, the temperature rise permitted will be up to 43 °F (23.8 °C). Thus, the result when applying this value to Equation XV is:
! =36 × !∆!
− 9×!"#$ = 9 × 12126.6
43− 9 × 641.6 = 4377.6
As the value is higher than the ones found in the table for air-‐to-‐air heat exchanger, two devices will be applied. Thus, following Equation XVI shows the result.
! + ! =36 × !∆!
− 9×!"#$ → 2 × ! = 4377.6 → ! = 2188.8
So, the model CC2000 is the appropriate for the system (appendix V).
• Supplier and model: Noren CC2000. • Cooling capacity = 2,19 kW • Annual electricity consumption = 44,16 kWh/year. Assuming 120 days of activity
and 8 hours of work a day. The main idea of this application is to recover the waste heat inside the GP container and stream it inside a room where the coffee seeds will be stored, in that way, speed up the drying timing, reduce the process and allow the prevision of the next steps in the coffee procedure. The figure below, see Figure X, is an overview of how the system would work, a conceptual approach to what is intended to apply. The conduct to stream the heat source is dependent on the distance between the heat source (GP) and the drying chamber. The possibilities to cover this tubing system are varied, since the application of thermally insulated pipes to the use of PVC, or other plastic tubes, previously covered with a special material that reduces the heat loss significantly. The economical cost of the piping is not going to be relevant when compared to the cost of the 2 devices needed for the application. So, it is decided not to include into the final budget.
Equation XV. Calculation of the Container Cooling Rating
Equation XVI. Calculation of the Container Cooling Rating if 2 Devices Applied

183
Figure X. Conceptual Diagram of the Functioning of the Heat Pipe Exchanger