project title: p1: control methodologies of distributed...
TRANSCRIPT

P1: Control methodologies of Distributed Generation for enhanced network stability and control
Milestone 6 & 7 Report: April 2011 4/19/2011 1
Project title: P1: Control methodologies of Distributed
Generation for enhanced network stability and control – (UQ)
Milestones 6 & 7 report
Project Leader & Investigator: Prof. Tapan K. Saha
Investigators: Dr. Mithulan Nadarajah and Dr. Uday P. Mhaskar
PhD Students: Mr. Tareq Aziz & Mr. Sudarshan Dahal
Covers progress on research, models, publications and software developed
The University of Queensland, St. Lucia, Brisbane

P1: Control methodologies of Distributed Generation for enhanced network stability and control
Milestone 6 & 7 Report: April 2011 4/19/2011 2
Table of Contents
Table of Contents ................................................................................................................................. 2
List of publications ................................................................................................................................ 4
Executive summary .............................................................................................................................. 5
Chapter 1 A Grid compatible methodology for Reactive Power compensation in renewable based distribution system ................................................................................................................... 7
I. Introduction ................................................................................................................................ 7
II. Grid interconnection requirements & standards .................................................................. 8
1. Reactive power generation capability ............................................................................... 9
2. Steady state voltage; continuous operation range .......................................................... 9
3. Interconnection system response to abnormal voltage .................................................. 9
III. Proposed methodology...................................................................................................... 10
1. Solution algorithm ............................................................................................................... 10
2. System model ..................................................................................................................... 11
3. Optimal capacitor placement ............................................................................................ 12
4. Dynamic compensation system (STATCOM) ................................................................ 13
IV. Results and analysis .......................................................................................................... 14
1. Test distribution system and analytical tool .................................................................... 14
2. Load composition and load curves .................................................................................. 15
3. Distributed generators and their size .............................................................................. 16
4. Optimal capacitor placement and sensitivity indices .................................................... 16
5. Voltage recovery and STATCOM placement ................................................................. 18
V. Conclusions ............................................................................................................................. 23
Chapter 2 An approach to control a photovoltaic generator to damp low frequency oscillations in an emerging distribution system ............................................................................. 25
I. Introduction .............................................................................................................................. 25
II. Model of a Photovoltaic System ........................................................................................... 26
1. Model of Photovoltaic Generator ..................................................................................... 27
1. Power Factor Control ......................................................................................................... 29
III. Small Signal Stability of Distribution System ................................................................. 30
1. Description of Distribution System ................................................................................... 30
2. Oscillatory Modes ............................................................................................................... 31
IV. Impact of PV on Critical Mode .......................................................................................... 33

P1: Control methodologies of Distributed Generation for enhanced network stability and control
Milestone 6 & 7 Report: April 2011 4/19/2011 3
1. Participation Factor ............................................................................................................ 33
2. Eigenvalue Sensitivity ........................................................................................................ 34
3. Time Domain Analysis ....................................................................................................... 35
V. Design of feedback Controller .............................................................................................. 36
1. Selection of control signals ............................................................................................... 36
2. Controller Design ................................................................................................................ 38
3. Effectiveness of the Controller ......................................................................................... 39
VI. Conclusions ......................................................................................................................... 40
Chapter 3 Conclusions of milestones 6 and 7 ............................................................................. 42
I. Conclusions ............................................................................................................................. 42
2. MatLab tools for small signal stability studies ........................................................................ 44
References .......................................................................................................................................... 45

P1: Control methodologies of Distributed Generation for enhanced network stability and control
Milestone 6 & 7 Report: April 2011 4/19/2011 4
List of publications
1. T. Aziz, U. P. Mhaskar, T. K. Saha and N. Mithulananthan. “A Grid Compatible Methodology for Placement of Reactive Power Compensation in Renewable Based Distribution System”-accepted for the proceedings of the IEEE Power & Energy Society General Meeting (PESGM) 2011, to be held in Detroit, Michigan, USA during 24-28th July 2011.
2. S. Dahal, N. Mithulananthan, T. Saha, “An approach to control a photovoltaic generator to damp low frequency oscillations in an emerging distribution system”, accepted for the proceedings of the IEEE Power & Energy Society General Meeting (PESGM) 2011, to be held in Detroit, Michigan, USA during 24-28th July 2011.
3. T. Aziz, U. P. Mhaskar, T. K. Saha and N. Mithulananthan. “An Index and Grid Compatible Methodology for Reactive Power Compensation in Renewable Based Distribution System” submitted to IEEE transactions on Power systems.

P1: Control methodologies of Distributed Generation for enhanced network stability and control
Milestone 6 & 7 Report: April 2011 4/19/2011 5
Executive summary The interconnection requirements and compelling technical standards from different
organizations such as IEEE, IEC and AEMO demand small scale DGs to operate with
characteristic similar to synchronous generator, subject to installed capacity. Hence it
becomes requirement for system/network operator to maintain voltage and frequency within
a specific band during all operating conditions of the power system to enhance the energy
contribution from small scale (kW-MW), scattered renewable energy based independent
power producers. This report discusses placement strategy that allows the network operator,
to place dynamic as well as static reactive power compensation system with necessary
controller in place that helps in maintaining the voltage of node to which DG is connected.
With the integration of DG units, there are more concerns on stable operation of distribution
networks under various small disturbances. Assessment of low-voltage-ride-through (LVRT)
capability has become an important issue before a DG unit can be connected to an existing
power system. Given the smaller geographical area, the generators and controllers are in a
close proximity in a distribution system as compared to transmission systems. Such
proximity may induce interactions among the machines leading to low frequency oscillations
and improper tuning of controllers. As a result, issues of oscillatory instability may become a
threat to secured operation of an emerging distribution system. Oscillatory instabilities in the
form of low frequency oscillations are highly undesirable.
The research objectives were to:
• Evaluate the effectiveness of proposed/new index & method for unified placement of
capacitor bank(s) and/or STATCOM(s), to improve the uptime of DGs in presence of
grid interconnection requirements (Chapter-1).
• Design of a controller for photovoltaic generator to damp low frequency oscillation of
a distribution system (Chapter 2).

P1: Control methodologies of Distributed Generation for enhanced network stability and control
Milestone 6 & 7 Report: April 2011 4/19/2011 6
The outcomes from this research are as follows:
• The new sensitivity index RdIdV / has been proved to be effective in detecting
appropriate location of STATCOM in presence of fixed compensation. As a result,
small scale DG units can remain connected to grid under abnormal conditions and
improving their uptime.
• This approach helps in placing capacitor banks and STATCOM in distributed manner
to improve voltage profile at DG and load bus.
• Reactive power control of PV is better for damping of low damped excitation modes.
• With the aid of a proper PV controller, a photovoltaic generator can effectively damp
low frequency oscillations in a distribution system.
• A desired damping ratio can be achieved by selecting an appropriate value of
controller gain. The controller is found to affect only the critical mode while the other
modes are mostly unaffected.

P1: Control methodologies of Distributed Generation for enhanced network stability and control
Milestone 6 & 7 Report: April 2011 4/19/2011 7
Chapter 1 A Grid compatible methodology for Reactive Power compensation in renewable based distribution system
I. Introduction n recent years, several environmental and economic benefits have led large scale
integration of renewable energy based distributed generation (DG) in existing power
systems. Making renewable a dependable source of energy, despite its intermittent nature,
is a big challenge. Moreover, grid requirements and standards are trying to shape the
conventional control strategies to allow seamless integration of DG into the main grid. The
technical regulations or specific standards define the allowed voltage range that bounds the
maximum permitted variation of every bus bar voltage under both transient and steady state
conditions. The post fault voltage recovery time at DG bus is the crucial part of these
standards as it requests DG to trip, if recovery time exceeds certain limit [1], [2] . It is well
known that voltage control issue in power system has strong correlation with reactive power
compensation. Both static and dynamic compensators play an important role in voltage
stability. Optimum allocation of static compensators (such as capacitor banks) considering
location and size, is one of the foremost components in reactive power planning [3]. On the
other hand, Static Var Compensator (SVC) and STATic COMpensator (STATCOM) have
inbuilt potential to offer both dynamic reactive power compensation for transient voltage
stability improvement as well as steady state voltage regulation. For example, in a wind
turbine integrated system, dynamic reactive power compensation is provided by a
STATCOM or SVC located at the point of wind turbine connection [4], [5]. With voltage
source converter (VSC), STATCOM has the least delay associated with thyristor firing
resulting faster operation compared to a SVC [6]. However, these studies emphasize only
the role of SVC and STATCOM in improving voltage profile of DG bus. In few studies, On
Load Tap Changing Transformer (OLTC) along with reactive power generation capability of
DG units have been utilized to maintain the voltage profile at point of common coupling
under all operating conditions [7], [8], [9], [10], [11]. These approaches allow plant operators
I

P1: Control methodologies of Distributed Generation for enhanced network stability and control
Milestone 6 & 7 Report: April 2011 4/19/2011 8
to make large renewable energy based power plants grid code compliant. This issue takes a
new dimension when the penetration level of small scale independent power producers in an
area tends to increase. Due to the rapid growth of interest and investment in renewable
energy, a widespread integration of small DG units is expected in coming years. With
increased penetration of DG units, early tripping of DG due to local disturbance can further
risk the stability of the whole system. Grid standards have addressed this issue by
requesting distributed generators bellow certain size to operate with constant power factor
control mode [12]. Hence, system operator becomes responsible to maintain the voltage
profile within acceptable range at all nodes under all operating conditions. As a result, fault
tolerant control algorithm is required for DG integrated system, which improves the voltage
recovery time to avoid tripping of small scale DG units and also maintains acceptable
voltage at all buses under all operating conditions. In this study, an IEEE std 1547-2003
compatible methodology has been proposed to control voltage and reactive power of
distribution test system, where a mixture of static as well as dynamic compensators have
been considered. A sensitivity based approach has been proposed to decide and limit the
location of high-cost dynamic compensator device such as STATCOM. This unified
approach not only reduces the loss but also ensures faster recovery time and thus improves
uptime of DG. Feasibility of the proposed methodology has been demonstrated on two
distribution systems with different network and load configurations. This chapter is organized
as follows. Section II gives a brief introduction to the available grid interconnection
requirements for distributed resources by utility grid. The section III describes the detail
methodology followed to achieve improved voltage profile in pre-fault and post-fault
conditions. Section IV presents and analyses the results obtained to meet grid requirements.
Section V draws conclusions with scope of future work.
II. Grid interconnection requirements & standards Grid codes have been specified for wind power plant as well as for other distributed
generators under both steady state and dynamic conditions. Normally, these operations

P1: Control methodologies of Distributed Generation for enhanced network stability and control
Milestone 6 & 7 Report: April 2011 4/19/2011 9
requirements for DG units are specified at the point of common coupling. In general, the
steady state operation requirements include power factor requirement of DG units, steady
state voltage operating range, frequency operating range and voltage quality [11].
1. Reactive power generation capability In order to request increased real power generation in the system, different grid codes
around the world have limited reactive power capability of DG units to a minimum standard.
IEEE Std 1547-2003 does not allow DG units to regulate voltage at the point of common
coupling actively [12]. According to FERC orders 661 [13], power factor at the coupling point
must remain in between 0.95 leading to 0.95 lagging for large wind parks over 20MW. In
Australia, distributed generation with a capacity of less than 30MW shall not actively regulate
the voltage at coupling point and power factor must lie in between unity to 0.95 leading for
both 100% and 50% real power injections [14].
2. Steady state voltage; continuous operation range The steady state voltage level at each load connection point is one of the most important
parameters for the quality of supply. Inclusion of DG has not affected this requirement. In
general it is expected that voltage of DG bus and load bus should remain within the range of
±10% of nominal voltage [14].
3. Interconnection system response to abnormal voltage IEEE std. 1547-2003 states that any DG unit should cease energizing the electric power
system during abnormal system conditions according to the clearing times shown in Table .
Clearing time is the time between the start of an abnormal condition (due to some fault) and
DG ceasing to energize the local area [12]. The clearing time listed is a maximum threshold
for DG with capacity of 30 kW or less. For DG units with generation capacity greater than 30
kW, the listed clearing time is default value though this can vary with different utility
practices. Hence, the clearing time in Table has been taken as default value for the present
study. So DG can only be remain connected to the system supplying the demand in pre-fault

P1: Control methodologies of Distributed Generation for enhanced network stability and control
Milestone 6 & 7 Report: April 2011 4/19/2011 10
as well as in post-fault condition, if the voltage recovery time is maintained less than the
tabulated clearing time.
Table 1 Interconnection system response to abnormal voltages [12] Voltage range (p.u.) Clearing time (sec)
V < 0.5 0.16
0.5 ≤ V < 0.88 2.00
1.1 < V < 1.2 1.00
V ≥ 1.2 0.16
III. Proposed methodology Based on the literature review and existing grid requirements, a step by step methodology as
shown in flowchart of Figure 1 has been proposed to support grid compatible voltage profile
of a DG integrated distribution system. A detail of the solution algorithm is described in
section 1, followed by some other essentials to implement the proposed methodology.
Figure 1 : Flow chart: determination of type, size and location of reactive power controller.
1. Solution algorithm The major steps to be followed to achieve regulated voltage throughout the system for pre-
fault as well as post-fault condition have been depicted in Figure 1. Total demand of real
power has been supplied by DG units present in the system. This approach converts the test
system to a normal interconnected Micro grid. With a multi-objective function of minimizing
grid loss and reactive power compensation requirement, optimal reactive power
compensator placement is performed. Steady state voltage requirement (at generator and
load terminals) is set as constraints for the objective function. Static load models need to be

P1: Control methodologies of Distributed Generation for enhanced network stability and control
Milestone 6 & 7 Report: April 2011 4/19/2011 11
considered for this part of the methodology. Changing the loading condition, optimal solution
can be achieved from lightly loaded condition to peak load condition. For the present work,
peak load condition derived from realistic load curve has been utilized to get optimal location
and size of capacitors. With various faults in the system, time domain simulation is
performed to check dynamic voltage restoring capability of the generator and load bus.
Dynamic compensator (here STATCOM) is required only if static compensators fail to meet
the grid requirement as mentioned in Table . A new sensitivity index RdIdV / along its
direction is used to find out the best location among optimal capacitor nodes to replace that
capacitor by a STATCOM. After replacing the optimal capacitor by STATCOM on the bus
with highest sensitivity, voltage recovery time is calculated with time domain simulation for
generator and load bus. Performance of RdIdV / is compared with an existing sensitivity
index dQdV / . The procedure repeats itself till the voltage excursion of all nodes concerned
falls within the required range. Details of this procedure will be explained with simulation
results.
2. System model Proper system modelling is required to investigate the feasibility of the proposed
methodology. Power system dynamics are commonly expressed as in (1.1) and (1.2) using
differential algebraic equation (DAE) form [15], which has been followed in this work.
),,,(' pyxfx = nkmnf ℜ→ℜ ++: (1.1)
),,,(0 pyxg= mkmng ℜ→ℜ ++: (1.2)
,nXx ℜ⊂∈ ,mYy ℜ⊂∈ kPp ℜ⊂∈
In the parameter-state space of X ,Y , P , x is a vector of n state variables, y is a vector of
m algebraic variables and p is a vector of k parameter variables, which are changing slowly.
The dynamic state x describes the generation dynamics of power systems such as exciter
control systems. y stands for instantaneous variables, which satisfies algebraic constraints
in (1.2), such as power flow equations. Parameter p specifies particular system

P1: Control methodologies of Distributed Generation for enhanced network stability and control
Milestone 6 & 7 Report: April 2011 4/19/2011 12
configurations and operation conditions, such as generation, loads, voltage setting points
etc. V-I characteristics of loads have been considered in load flow studies [16]. For load flow
studies and optimal compensation placement, static load models are relevant as these
express active and reactive powers as functions of the bus voltages. In general, a static load
model that represents the power relationship to voltage can be expressed in (1.3) and (1.4)
respectively.
np
VVPP ⎟⎟
⎠
⎞⎜⎜⎝
⎛=
00
(1.3)
nq
VVQQ ⎟⎟
⎠
⎞⎜⎜⎝
⎛=
00
(1.4)
Here 0P and 0Q stand for real and reactive power consumed at a reference voltage 0V. The
exponents np and nq depend on the load type [17]. The loads are highly nonlinear and there
are a number of constraints to be met. This leads to an optimization technique for selection
of proper location and size of fixed compensator.
3. Optimal capacitor placement The capacitor problem considered in this work is to determine the location, numbers and
sizes of capacitors to be installed in the test system. The objective function of the problem
can be expressed in (1.5) to minimize the capacitor investment and system energy loss [18]:
( ) j
L
jjlossi
I
ii TPKqCMinF ××+= ∑∑
== 1.
1 (1.5)
Where power flow equations are used as equality constraints and VAR source placement
restriction, reactive power generation restrictions, transformer tap-setting restriction, bus
voltage restriction and power flow of each branch are used as inequality constraints. In the
objective function, L and I respectively represent number of load levels and candidate
locations to install the capacitors. iq stands for the set of fixed capacitors for optimal solution,
jq is the control scheme vector at load level j whose components are discrete variables.
Investment cost associated with capacitor installed at location i is given by ( )ii qC . Power loss

P1: Control methodologies of Distributed Generation for enhanced network stability and control
Milestone 6 & 7 Report: April 2011 4/19/2011 13
at a load level j with time duration jT is given by jloss TP × and K stands for electricity price.
Tabu search, which is a heuristic optimal technique has been used as an optimization tool
for finding compensator placement and sizes [19] in the present work. DIgSILENT routine
has been used for this purpose [20].
4. Dynamic compensation system (STATCOM) STATCOM is a Voltage Source Converter (VSC) based system that injects or absorbs
reactive current, independent to grid voltage unlike an SVC. However, reactive current RI
injected or absorbed by the STATCOM will significantly influence the grid node voltage V as
shown in Figure 2. Based on the availability of energy source at the DC link, it is modelled
either only as reactive current source or as a current source with active and reactive
component. The current injected by STATCOM depends on pulse width modulation (PWM)
method used along with operational limits and characteristics of Insulated Gate Bi-polar
Transistors (IGBT) in use. Hence, current injected by STATCOM has appropriate limiters,
which are dynamic in nature [21]. As STATCOM can be modelled as reactive current source
for voltage stability improvement, sensitivity of node voltage to reactive current injection RI
will be used to find the proper placement of STATCOM as mentioned earlier in section III-1.
A positive value of RI indicates capacitive current, whereas a negative value stands for
inductive current. Rating of STATCOM on each location has been taken as equal to the
optimal reactive power requirement for that location found from optimization routine. To
maintain bus voltage constant, modulation index of VSC has been controlled with the control
block referred in [22].

P1: Control methodologies of Distributed Generation for enhanced network stability and control
Milestone 6 & 7 Report: April 2011 4/19/2011 14
Figure 2 Basic STATCOM model.
IV. Results and analysis
1. Test distribution system and analytical tool To test the effectiveness of proposed methodology, two distribution test systems with
different configuration and load compositions have been considered in this part of research.
The first distribution system used in this work is a 23kV radial distribution system with 16
nodes. Total real and reactive power load in the system is 28.7MW and 9.48MVAr
respectively. Single line diagram of this test system is shown in Figure 3. This system is a
modified form of the one used in [23] and has been treated as a commercial feeder
throughout our study.
Figure 3 Single line diagram of 16 bus test system. An IEEE 43 bus mesh distribution system, with total real and reactive power load of
21.76MW and 9MVAr respectively has been studied as the second test system [24]. This

P1: Control methodologies of Distributed Generation for enhanced network stability and control
Milestone 6 & 7 Report: April 2011 4/19/2011 15
test system has been shown in Figure 4. The system has five different levels of rated voltage
at 69kV, 13.8kV, 4.16kV, 2.4kV and as low as 0.48kV. This system has been treated as an
industrial feeder.
Figure 4 Single line diagram of 43 bus test system.
2. Load composition and load curves This study has considered practical scenarios of load composition as they have profound
impact on dynamic voltage control of distribution nodes. Utilities consider their loads into
various compositions with different percentages of loads. The breakdown typically used by
the utilities for commercial and industrial feeder have been shown in Table [25]. Here,
motors with power rating greater than 100hp have been treated as large motors, which are
principal loads in industrial feeder. Commercial feeder is dominated by 51% of small motors
representing air conditioners. These breakdowns of loads have been utilized for static load
modelling of both feeders.
Table 2 Typical load composition [25] Load type Load Composition
Commercial Feeder (16 bus system)
Industrial Feeder (43 bus system)
Resistive 14 5 Small Motor 51 20 Large Motor 0 56 Discharge Lighting 35 19

P1: Control methodologies of Distributed Generation for enhanced network stability and control
Milestone 6 & 7 Report: April 2011 4/19/2011 16
For each type of feeder, the customer load has its typical daily load curve (DLC) set [26].
Pavg/Pmax found from these DLC sets is presented in Table 3 and has been used in this work.
Table 3 Peak load data [26] Load type Load Composition
Commercial Feeder (16 bus
system)
Industrial Feeder
(43 bus system)
Pavg/Pmax 0.68 0.61
Peak load (MW) 42.72 28.82
3. Distributed generators and their size DG units considered in this study are conventional synchronous generators with unity power
factor operation. DG connection details for both systems have been shown in Table at base
load condition. The location of DG units in 16 bus system has been chosen randomly at bus
3 and bus 6, whereas for 43 bus system locations are given in the system data.
Table 4 Distributed geneation: capacity and location
Distributed Generation Commercial Feeder
(16 bus system)
Industrial Feeder
(43 bus system)
DG1 DG2 DG1 DG2
Location bus 3 6 4 50
MVA rating 10 19.58 13 9.75
Power factor 1 1 1 1
4. Optimal capacitor placement and sensitivity indices As described in section III-3, ‘Tabu search’ technique has been used to find out the proper
location of fixed compensator in the system at peak load condition followed from Table 3.
Number of candidate buses has been chosen to 50% with an objective function of
minimizing grid loss with minimum available capacitor banks. Voltage limits at generator as
well as load bus has been set to 0.90pu to 1.1pu according to steady state voltage operating
range in [12].
Table summarizes the results for optimal capacitor places for 16 bus system whereas

P1: Control methodologies of Distributed Generation for enhanced network stability and control
Milestone 6 & 7 Report: April 2011 4/19/2011 17
Table 6 shows the optimal capacitor places for 43 bus test system. Both tables contain
sensitivity values dQdV / and RdIdV / at the optimal compensation nodes, which minimizes
iterations to find best node for dynamic compensation. These values are calculated
numerically with small perturbations. For 16 bus system, even at peak load, bus voltages
are not out of range of specified limits. But along with maintaining the voltage limits at nodes,
placing capacitor reduces the grid loss significantly. Grid loss has been found to reduce from
1.20MW to 0.90 MW with an inclusion of total 10.2MVAr of fixed capacitor at the listed nodes
in
Table . In 43 bus system, grid loss is reduced to 0.45MW from 0.54MW with an inclusion of
11.20MVAr of fixed capacitor, which is not very significant. But voltage profile along all the
load buses have been recovered to specified limit.
Table 5 Optimal capacitor solution for 16 bus system Optimal
Node
Capacitor Size (MVAr) Sensitivity index
dQdV /
(Vp.u./MVAr)
RdIdV / (Vp.u./Ip.u.)
7 1.8×2 0.0069 -0.1428 (Inductive)
5 1.8 0.0038 0.0769 (Capacitive)
11 1.8 0.0034 0.0667 (Capacitive)
15 1.8 0.0049 0.1 (Capacitive)
3 1.2 0.0048 0.11 (Capacitive)

P1: Control methodologies of Distributed Generation for enhanced network stability and control
Milestone 6 & 7 Report: April 2011 4/19/2011 18
Table 6 Optimal capacitor solution for 43 bus system Optimal
Node
Capacitor Size (MVAr) Sensitivity index
dQdV /
(Vp.u./MVAr)
RdIdV / (Vp.u./Ip.u.)
49 0.6 0.044 0.20 (Capacitive)
29 0.6 0.046 0.25 (Capacitive)
21 0.6 0.088 0.33 (Capacitive)
51 0.6 0.046 0.2 (Capacitive)
41 0.6 0.048 0.2 (Capacitive)
25 0.6 0.006 0.03 (Capacitive)
30 0.6 0.047 0.25 (Capacitive)
39 1.1 0.044 -0.25 (Inductive)
17 1.1 0.055 0.25 (Capacitive)
35 1.2 0.049 0.2 (Capacitive)
18 1.2 0.048 0.2 (Capacitive)
37 1.2 0.068 0.33 (Capacitive)
33 1.2 0.049 0.25 (Capacitive)
5. Voltage recovery and STATCOM placement
According to [1] and [12], voltage recovery requirement specifies that the DG terminal
voltage must come back to 90% of its normal operating voltage within 2 sec after a fault
takes place. For the verification of dynamic voltage restoring capability of generator and load
buses, portion of static loads are converted to dynamic motor loads according to proper
percentages (as given in Table 2). Then, to check the voltage profile under abnormal
conditions, both systems are subjected to a three phase fault (with a fault reactance of 0.05
Ω) near the generator bus and the fault is cleared after 12 cycles.

P1: Control methodologies of Distributed Generation for enhanced network stability and control
Milestone 6 & 7 Report: April 2011 4/19/2011 19
The following test cases are investigated to find out possible solution for supporting above
requirement:
- Case 1: Without Capacitors;
- Case 2: With Capacitor at optimal locations;
- Case 3: Replacing capacitor with STATCOM at a bus with highest dQdV / ;
- Case 4: Replacing capacitor with STATCOM at a bus with highest RdIdV / (For both
inductive and capacitive values).
Figure 5-7 show the time domain simulation for 16 bus system at peak load condition. Figure
5-6 show excursions in voltage at buses 3 and 6 respectively with fault at bus 5. Load
terminal voltage profile has been plotted for the faulty bus 5 in Figure 7. A STATCOM is
placed at bus 7 and bus 3 alternately to find the effect of placement on voltage recovery time
and also to investigate effectiveness of sensitivity indices dQdV / and RdIdV / . Without
capacitors, the system fails to reach required voltage after three phase fault takes place. For
generator bus 3, capacitors at optimal places with optimal sizes help to recover the bus
voltage within 1.15sec. STATCOM at bus 7 reduces the restoring time significantly to only
0.26sec.
Figure 5 Voltage at bus 3 for peak load (16 bus system).
It is interesting to find that, though bus 3 is a DG bus, placing STATCOM on bus 3 results in
longer recovery time (1.26sec) than that on bus 7. Table 7 summarizes the voltage recovery

P1: Control methodologies of Distributed Generation for enhanced network stability and control
Milestone 6 & 7 Report: April 2011 4/19/2011 20
time for both generator buses of 16 bus system. As the simulation results for 16-bus system
under peak load condition does not reflect any problem of slow recovery of voltage on DG
buses, base case study has not been considered.
Figure 6 Voltage at bus 6 for peak load (16 bus system).
Figure 7 Voltage at bus 5 for peak load (16 bus system)
Table 7 Voltage recovery time for 16 bus system (peak load) DG node Without
Capacitors
With Capacitors
With STATCOM
at bus 3
With STATCOM
at bus 7
3 (DG1) N/A 1.15 Sec 1.26 Sec 0.26 Sec
6 (DG2) N/A 1.59 Sec 1.97 Sec 1.26 Sec

P1: Control methodologies of Distributed Generation for enhanced network stability and control
Milestone 6 & 7 Report: April 2011 4/19/2011 21
Time domain simulations for 43-bus system has been plotted with two cases- base load and
peak load. Simulation is carried out for all four cases mentioned earlier. Figure 8 and 9
show the simulation results for generator bus voltages with a three phase fault at bus 31 at
the base load condition. Sensitivity indices, dQdV / and RdIdV / (capacitive), both have their
highest value at bus 21. RdIdV / (Inductive) is found only at bus 39 with a value of 0.25
(Vp.u. /I p.u.) as shown in
Table .
Figure 8 Voltage at bus 4 for base load (43 bus system)
Figure 9 Voltage at bus 50 for base load (43 bus system)
P1: Control methodologies of Distributed Generation for enhanced network stability and control
Milestone 6 & 7 Report: April 2011 4/19/2011 22
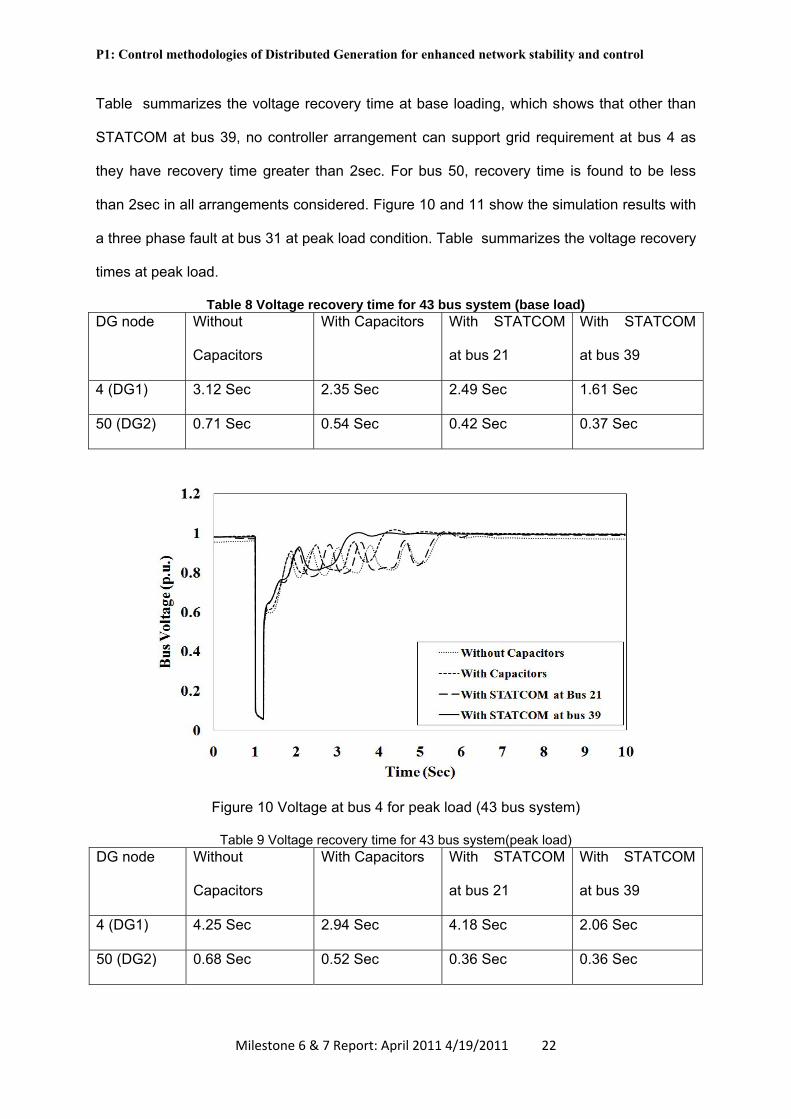
Table summarizes the voltage recovery time at base loading, which shows that other than
STATCOM at bus 39, no controller arrangement can support grid requirement at bus 4 as
they have recovery time greater than 2sec. For bus 50, recovery time is found to be less
than 2sec in all arrangements considered. Figure 10 and 11 show the simulation results with
a three phase fault at bus 31 at peak load condition. Table summarizes the voltage recovery
times at peak load.
Table 8 Voltage recovery time for 43 bus system (base load) DG node Without
Capacitors
With Capacitors With STATCOM
at bus 21
With STATCOM
at bus 39
4 (DG1) 3.12 Sec 2.35 Sec 2.49 Sec 1.61 Sec
50 (DG2) 0.71 Sec 0.54 Sec 0.42 Sec 0.37 Sec
Figure 10 Voltage at bus 4 for peak load (43 bus system)
Table 9 Voltage recovery time for 43 bus system(peak load) DG node Without
Capacitors
With Capacitors With STATCOM
at bus 21
With STATCOM
at bus 39
4 (DG1) 4.25 Sec 2.94 Sec 4.18 Sec 2.06 Sec
50 (DG2) 0.68 Sec 0.52 Sec 0.36 Sec 0.36 Sec

P1: Control methodologies of Distributed Generation for enhanced network stability and control
Milestone 6 & 7 Report: April 2011 4/19/2011 23
Figure 11 Voltage at bus 50 for peak load (43 bus system). It shows that placement of STATCOM on bus 39 results in reduced voltage recovery time
though it fails to meet grid requirement establishing the need for optimal size of STATCOM
and proper tuning of control parameters. Analysing the voltage recovery time from all three
Table 7-9, it can be concluded that, STATCOM should be placed at a bus with the highest
inductive RdIdV / to support voltage recovery requirement of DG units in the system. This
scheme works efficiently as during the post fault recovery capacitive VAR is required, which
is made available by STATCOM. For a small radial system like 16 bus system, it has been
found that STATCOM is not even necessary to support voltage recovery, though wrong
placement of STATCOM leads to longer recovery time. But for 43 bus system with large
mesh configuration, STATCOM is required at both base and peak loading conditions to
support the voltage recovery within the specified limit.
V. Conclusions In this chapter, we have investigated a new sensitivity index based methodology for
placement of shunt reactive power compensators. This approach helps in placing capacitor
banks and STATCOM in distributed manner to improve voltage profile at DG and load bus.
Results show that dynamic compensation may not be necessary for a small radial

P1: Control methodologies of Distributed Generation for enhanced network stability and control
Milestone 6 & 7 Report: April 2011 4/19/2011 24
distribution system though further investigations are required to generalize this finding. The
new sensitivity index RdIdV / has been proved to be effective in detecting appropriate
location of STATCOM in presence of fixed compensation. As a result, small scale DG units
remain connected to grid under abnormal conditions improving their uptime.

P1: Control methodologies of Distributed Generation for enhanced network stability and control
Milestone 6 & 7 Report: April 2011 4/19/2011 25
Chapter 2 An approach to control a photovoltaic generator to damp low frequency oscillations in an emerging distribution system
I. Introduction Conventional distribution systems are regarded as passive networks, which do not have any
active source of power generation. The power flow pattern in such networks are
unidirectional[27]. However, structure of emerging distribution systems are changing from
passive to active network due to the integration of local energy resources in the form of
distributed generation (DG) units and their controllers [28]. The DG units may be either
utilizing renewable energy resources such as wind and solar or using conventional fossil
fuels such as cogeneration[27]. However, more concerns on rapidly diminishing fossil
resources and environmental degradation have encouraged integration of renewable
resources rather than fossil fuels. With the integration of DG units, there are more concerns
on stable operation of distribution networks under various disturbances. Assessment of low-
voltage-ride-through (LVRT) capability has become an important issue before a DG unit can
be connected to an existing power system[29],[30]. Given the smaller geographical area, the
generators and controllers are in a close proximity in a distribution system as compared to
transmission systems. Such proximity may induce interactions among the machines leading
to low frequency oscillations and improper tuning of controllers [31],[32]. As a result, issues
of oscillatory instability may become a threat to secured operation of an emerging
distribution system. Oscillatory instabilities in the form of low frequency oscillations are highly
undesirable. These oscillations must have acceptable damping ratios to ensure stable
operation of a power system[29]. In case of transmission systems, various controllers such
as power system stabilizers (PSS), Static Var Compensators (SVC) and STAtic
COMpensators (STATCOM) are commonly used for oscillation damping [32]. There are
various methods reported in the literatures to determine suitable locations and design
approaches of these damping controllers in a power system[33], [34]. However, installation
of such devices in a low voltage distribution system may not always be technically and
P1: Control methodologies of Distributed Generation for enhanced network stability and control
Milestone 6 & 7 Report: April 2011 4/19/2011 26
economically attractive. Instead, one of the DG units in the system may be controlled to
improve system stability [35]. Given the structure of a photovoltaic (PV) system, which is
dominated by controllers, one of the controllers of PV system may be employed for
improving the oscillation damping. In this research, damping of a low frequency oscillation in
a distribution network is discussed and analysed. The network consists of synchronous
generators, induction generator and a PV source. The impact of PV system on a low
frequency mode is systematically assessed. Then, a control methodology is proposed for PV
system to enhance the damping of low frequency oscillations. Chapter 2 is organized as
follows: Section II discusses about the modelling of PV generator and its associated
controllers. Section III assesses the small signal stability of a test distribution system by
eigenvalue analysis. The impact of PV on system stability is demonstrated in section IV. An
approach to design a suitable controller for a PV system to damp the low frequency
oscillations on the system is presented in section V. This section also discusses the
effectiveness of the proposed controller. Finally, section VI summarizes the conclusions
drawn from the study.
II. Model of a Photovoltaic System One of the popular DG units in present power distribution system is solar photovoltaic
(PV) system. The technology of PV system is different from the conventional synchronous
and induction generators used for power generation. Unlike conventional generators, PV
systems do not have any rotating mechanical parts and their system dynamics are
dominated by controllers[10]. The analysis of impact of PV on stability of a distribution
network requires an appropriate model of a PV system. A number of literatures discuss on
the modelling of photovoltaic systems[10],[11],[12]. Some of the works employ detailed
modelling for transient stability studies[10]. Approximate models are used for small signal
and steady state stability analysis [12],[13]. A comparison of detailed model and approximate
models for assessment of small signal stability is presented in [12]. It is recommended that
approximate models are enough to represent the small signal behaviour of a power system.

P1: Control methodologies of Distributed Generation for enhanced network stability and control
Milestone 6 & 7 Report: April 2011 4/19/2011 27
Similarly, some literatures have discussed the impact of PV system on transient and small
signal stability of a power system[10],[12]. In many cases, PV system has been reported to
improve the damping of low frequency oscillations. The modelling approach of a PV
generator and power factor controller considered in this report is discussed in this section.
1. Model of Photovoltaic Generator A schematic diagram of grid connected photovoltaic (PV) system is shown in Figure 12.
phI
Sun Rays
),( SQSD vv),( QD ii
dcv+−
⎯⎯ →⎯PVP
VSC
C
QD mm ,
R+jX
⎯⎯⎯ →⎯DCP
⎯⎯⎯ →⎯+ jQP
Figure 12 : A schematic diagram of grid connected PV system.
Incidence of sun rays on PV panels induces photovoltaic current, which causes PV power
flow ( PVP ) from PV panels to DC link capacitor. PVP can be given as (2.1) [10],[11].
⎥⎥⎦
⎤
⎢⎢⎣
⎡
⎭⎬⎫
⎩⎨⎧
−⎟⎟⎠
⎞⎜⎜⎝
⎛−= 1exp
s
dcrsphdcpPV n
vkTAqIIvnP
(2.1)
Where, pn and sn are numbers of parallel strings and number of series connected PV
panels per string respectively. Similarly, dcv is dc-link capacitor voltage.
Quantities q , k ,T and A denote the unit charge, Boltzmann’s constant, cell temperature, and
p-n junction ideality factor respectively. Now, phI is the photovoltaic current and is given by
(2.2).
100)]([ STTkII RTSCph −+=
(2.2)
Where, RT is the reference temperature of cell and SCI is the short circuit current of a unit
cell of PV at reference temperature and solar irradiation S. Tk is the temperature coefficient.
Similarly, cell reverse saturation current ( rsI ) is given by (2.3).

P1: Control methodologies of Distributed Generation for enhanced network stability and control
Milestone 6 & 7 Report: April 2011 4/19/2011 28
⎟⎟⎠
⎞⎜⎜⎝
⎛⎥⎦
⎤⎢⎣
⎡−⎥
⎦
⎤⎢⎣
⎡=
TTkAqE
TTII
R
G
RRRrs
11exp3
(2.3)
Where, RRI is the reverse saturation current at reference temperature RT , and GE is the
band gap energy of a cell. For a particular grid connected PV system, PVP depends on dcv
for given conditions of solar irradiations and cell temperature. For the grid connected PV
system considered in this report, the variation pvP with dcv is shown in Figure 13. It can be
observed that the PV system output becomes maximum 1 MW at dcv set at 1.1 kV. The
voltage of DC link capacitor ( dcv ) is set to extract maximum power from PV panel using
maximum power point tracking (MPPT) control[11]. In this paper, dcv is set to 1.1 kV. The
irradiation level (S) and cell temperature (T) considered are 700 W/m2 and 300K,
respectively.
Figure 13: Relationship between dc-link voltage and output power of a PV array.
DC link capacitor voltage dynamics can be given by power balance equation as in (2.4).
DCPVdc PP
dtdvC
−=2
2 (2.4)
Where, DCP is the power transferred from capacitor to voltage source converter (VSC).
VSC feeds the power into the grid by converting the dc-signal into an appropriate ac-signal.
If P is the power supplied to the grid, the expression for DCP can be given as (2.5).

P1: Control methodologies of Distributed Generation for enhanced network stability and control
Milestone 6 & 7 Report: April 2011 4/19/2011 29
LOSSDC PPP += (2.5)
Where, LOSSP is the power loss in VSC and interface impedance (R + j X). It is obvious
from, (2.4) and (2.5) that any disturbance in P will ultimately induces oscillations in dcv ,
which must settle to dcrefv determined by MPPT.
1. Power Factor Control In Figure 12, relationship of active power (P) and reactive power (Q) with voltages and
currents in d- and q- axis reference can be given as in (2.6).
( )( )⎪⎩
⎪⎨⎧
−=
+=
QSDDSQ
QSQDSD
ivivQ
ivivP
23
23
(2.6)
Where, SDv and SQv are the d- and q- axis components of PV terminal voltage.
Similarly, Di and Qi are d- and q- axis components of PV current into the distribution
network. In this paper, PV is desired to operate in power factor control mode. Since, SDv and
SQv are determined by distribution network, power factor control can be achieved by
independent control of Di and Qi .
9
12
10
17
22
13
18
23
25
28
33 41 38
29
34
30
35
27
3
5
49 39 26 11 19 20
6 15
16
21
8
100
24
3132
36 37
4
1 250
51
UTIL
G1 G2
G3PV
Figure 14: Single line diagram of a case distribution system[14].

P1: Control methodologies of Distributed Generation for enhanced network stability and control
Milestone 6 & 7 Report: April 2011 4/19/2011 30
III. Small Signal Stability of Distribution System
1. Description of Distribution System The distribution system under study is shown in
Figure 14. This is a 43-bus distribution network with total load of 21MW and 8 MVAR [14].
The system is connected to external utility grid through Bus 100. The system is supplied by
two synchronous generators (G1 and G2) located at buses 50 and 4, respectively. In this
paper, a squirrel cage induction generator (SCIG) is added as a source (G3) of wind power
at bus 5. Similarly, VSC based photovoltaic generator (PV) is added at bus 10 as a source of
solar power. The capacity and operating modes of the generators are summarized in Table
1.
Table 1 Summary of Generators of Case Distribution System
Generator Generation
(MW) Mode of operation
Power
factor
G1 5 Power factor control 1
G2 9 Terminal Voltage Control -
G3 5 Reactive power
consumption -
PV 1 Power factor control 1
Synchronous generators are modeled by considering dynamics of rotor flux and rotor inertia
[8]. Exciter and governor models are also included in the synchronous generator model.
Similarly, wind generator is modeled by considering the dynamics of rotor flux and rotor
inertia[15]. The reactive power required by wind generator is partially supplied by a shunt
capacitor installed at the generator terminal. Rating of the shunt capacitor is taken to be one-
fourth of the active power generated by wind generator. PV is modeled by considering
dynamics of dc-link and d-axis and q-axis current controllers as discussed in Section II. Now,
using the models of the generators, controllers and distribution network, small signal stability
can be assessed by eigenvalue analysis.

P1: Control methodologies of Distributed Generation for enhanced network stability and control
Milestone 6 & 7 Report: April 2011 4/19/2011 31
2. Oscillatory Modes Eigen values of the test distribution system are plotted in Figure 15. Since all the Eigen
values lie on left half of the complex plane, the system is asymptotically stable.
-250 -200 -150 -100 -50 0 50-30
-20
-10
0
10
20
30
Real Axis
Imag
inar
y A
xis
Eigenvalue Plot
Figure 15: Eigenvalues of the distribution system.
The complex eigenvalue represent the oscillatory modes of the system. The dynamic
characteristics of the system depend on the damping ratio and frequency of the oscillatory
modes. Lower values of damping ratio for any oscillatory modes are undesirable for the
stability of a power system. In this paper, threshold value of damping ratio for any oscillatory
modes is taken as 5% to ensure the oscillatory stability of a system [3]. There are four
oscillatory modes, which are summarized in Table 2.
Table 2 Oscillatory Modes of Distribution System
Mode Eigenvalues Damping
Ratio (%)
Frequency
(Hz)
1 -7.6 ± j 25.7 28.3 4.2
2 -5.6 ± j19.2 28.2 3.2
3 -8.8 ± j19.6 41.0 3.4
4 -0.15 ± j5.7 2.74 0.9
It can be observed that oscillatory modes 1, 2 and 3 have frequencies of around 3 to 4 Hz
and well damped. However, mode 4 has lower values of frequencies and damping. Lower

P1: Control methodologies of Distributed Generation for enhanced network stability and control
Milestone 6 & 7 Report: April 2011 4/19/2011 32
damping ratio of a low frequency mode is unacceptable for secured operation of a power
system [3]. Hence, mode 4 is a critical mode of the system in terms of stability.
The relationship among oscillatory modes and state variables of the system can be
observed by evaluating the participation factors (PFs) of each state on a particular mode.
For a particular mode, a generator and its state variables, which have the largest values of
participation factors is identified as dominant generator for that mode. The participation of
thk state in the thi eigenmode may be given by (2.7).
ikkikip ψφ= (2.7)
Where,
kiφ : thk Entry of right eigenvector iφ
ikψ : thk Entry of left eigenvector iψ
The modes, their dominant generators and corresponding dominant state variables are
shown in Table 3.
Table 3 Dominant Generators of Oscillatory Modes
Mode Dominant
generator
Dominant
states
Participation
factor
1 G2 Rotor angle 0.56
Speed deviation 0.56
2 G1 Rotor angle 0.58
Speed deviation 0.58
3 G3 d-axis rotor flux 0.73
Rotor speed 0.67
4 G2 d-axis rotor flux 0.48
Exciter 0.50
It can be observed that G2 is the dominant generator for the critical mode. Critical mode is
associated with the excitation system of G2. This suggests that the damping of critical mode

P1: Control methodologies of Distributed Generation for enhanced network stability and control
Milestone 6 & 7 Report: April 2011 4/19/2011 33
may be improved by controlling the excitation system of G2. Alternatively, a controller can be
installed at any bus of the distribution network to enhance the damping. In this paper, a PV
generator installed at the network has been proposed to be controlled to enhance the
damping of critical mode.
IV. Impact of PV on Critical Mode
1. Participation Factor The impact of PV on system oscillatory modes can be observed by evaluating participation
factors of PV state variables on oscillatory modes of the system. In this paper, three state
variables of PV system, i.e. Di , Qi and dcv have been considered. The participation factors of
PV state variables were evaluated by using (10). The results are shown in Figure 16. It can
be observed that participation factors of PV states on system oscillatory modes are very
small. This suggests that an additional dynamic controller is required for a PV system to
effectively damp low frequency oscillation of a distribution system. Among the three state
variables of PV, dc-link voltage ( dcv ) has the least participations on the system modes. The
participation factor of Qi on critical mode (Mode 4) is larger than Di . This suggests that Qi
may be more effective than Di to control damping of critical mode. This is elaborated with
more results in section V.
iD vdc
iQ0
0.00005
0.0001
0.00015
0.0002
Mode 1 Mode 2 Mode 3Mode 4
Part
icip
atio
n Fa
ctor
Figure 16: Participation factors of PV states on oscillatory modes.

P1: Control methodologies of Distributed Generation for enhanced network stability and control
Milestone 6 & 7 Report: April 2011 4/19/2011 34
2. Eigenvalue Sensitivity Since PV can supply power at various power factors, different values of active and
reactive powers generated have different impacts on oscillatory modes. The impact on
system modes may be measured by eigenvalue sensitivity. In this paper, eigenvalue
sensitivity with respect to active and reactive power perturbations has been taken as a
sensitivity index. If PVS denotes active or reactive power supplied by PV, then eigenvalue
sensitivity of a mode iλ with respect to perturbations in PVS is given by (2.8).
iTi
iPV
Ti
PV
i SA
S φψ
φψλ
.
⎟⎟⎠
⎞⎜⎜⎝
⎛∂∂
=∂∂
(2.8)
Vectors iφ and iψ are right and left eigenvectors, respectively as defined in (2.7).
Eigenvalue sensitivity may be computed either by an analytical approach or by a numerical
approach [7]. In a numerical approach, sensitivity may be computed by evaluating two
eigenvalue at PVS and slightly perturbed value PVPV SS Δ+ . The sensitivities of the critical
mode with active and reactive powers calculated numerically are shown in Figure 17.
0
0.0005
0.001
0.0015
0.002
0.0025
50% Load Full Load 50% Overload
Sens
itivi
ty o
f cri
tical
mod
e
δλ/δPδλ/δQ
Figure 17: Sensitivities of critical mode with active and reactive power output of PV at different loading of distribution system.
The sensitivities are calculated at 50% loading, full loading and 50% overloading of the
distribution system. It can be observed that the critical mode is more sensitive with
perturbation of reactive power than active power in all cases of distribution system loading
conditions. Hence, PV reactive power control is more effective for critical mode damping as

P1: Control methodologies of Distributed Generation for enhanced network stability and control
Milestone 6 & 7 Report: April 2011 4/19/2011 35
compared to active power control. This suggests that reactive power supply from PV is
better for damping of critical mode. Existing standards suggest the unity power factor
operation of a PV system in a distribution system [16],[17]. However, future development
may allow reactive power support from a PV system utilizing advanced features of
inverters[18]. Reactive power support is sometimes beneficial to damping of low frequency
oscillations as demonstrated in Section IV-3.
3. Time Domain Analysis The impact of PV power factor on oscillation damping was observed through time domain
analysis. PV was operated in different power factors and corresponding impact on time
domain behavior was observed. A disturbance was imposed to the steady state system by
applying a three phase fault at bus number 3. The fault duration was assumed to be 90 ms.
The voltage across PV terminal was observed. The result is shown in Figure 18.
0.780.830.880.930.981.031.081.13
0 2 4 6 8 10
PV te
rmin
al v
olta
ge (p
.u.)
Time (sec)
Power factor = 1Power factor = 0.8
Figure 18: Response of PV terminal voltage against fault at bus 3. It can be observed that system is slightly better damped when PV supplies power at 0.8
power factor as compared to unity power factor. This shows that reactive power control can
be utilized to damp the system oscillations. However, operating PV at different power factors
slightly improves the damping, which may not be sufficient to achieve desired damping of
critical modes. Hence, additional controller for PV may be required to achieve desired
damping of critical mode. This will be discussed in the following sections.

P1: Control methodologies of Distributed Generation for enhanced network stability and control
Milestone 6 & 7 Report: April 2011 4/19/2011 36
V. Design of feedback Controller In this section, a design procedure of an additional controller for PV power factor for
system oscillation damping is presented. The first step towards the controller design is
selection of the most appropriate control signals.
1. Selection of control signals A state space formulation of the distribution system with control input and output is given
as (2.9).
⎩⎨⎧
Δ+Δ=ΔΔ+Δ=Δ
UDXCYUBXAX
(2.9)
Now, controllability factor of mode i from thj input is given by (10).
jiij Bw ψ= (2.10)
Where, iψ is thi left eigenvector. The input signal is modulated by a controller to achieve
desired response of the system. Similarly, observability factor of mode i from thk output is
given by (2.11).
ikik Cv φ= (2.11)
Where, iφ is the thi right eigenvector. The output is used as a signal for feedback controller.
Now, residues of thi mode with respect to thj input when thk output is used at feedback
signal can be given as (12)[7].
ikijijk vwR = (2.12)
Residue has been used as an index for selection of control signals. The combination of
signals giving the highest magnitude of residue was selected for input modulation signal and
feedback signal for controller. In this report, two local signals i.e. deviations of PV terminal
voltage magnitude (ΔV ) and angle (Δδ ) were taken as possible signals for feedback

P1: Control methodologies of Distributed Generation for enhanced network stability and control
Milestone 6 & 7 Report: April 2011 4/19/2011 37
controller. The outputs of the controller are used to modulate the reference signals, i.e. Drefi
and Qrefi . The residues of critical mode, when Drefi is modulated is shown in Figure 19.
00.0010.0020.0030.0040.0050.0060.007
50% load Full load 50% Overload
Res
idue
s of c
ritic
al m
ode
Modulating iDref
∆V∆δ
Figure 19: Residues of system when d-axis current of PV is modulated. It can be observed that using ΔV as feedback signal gives larger values of residues at full
load and at 50% overload of distribution system. However, Δδ as feedback signal gives
larger value of residue at 50% load of the distribution system. Hence, the controller designed
for full load using ΔV as feedback signal may not be effective at 50% load of the distribution
system. Similarly, the residues of critical mode when Qrefi is modulated is shown in Figure
20.
00.020.040.060.080.1
0.120.14
50% Load Full Load 50% Overload
Res
idue
s of c
ritic
al m
ode
Modulating iQref
∆V∆δ
Figure 20: Residues of system when q-axis current of PV is modulated. It can be observed that ΔV has larger magnitude of residues than Δδ in different loading
conditions of the distribution system. Hence, ΔV is an appropriate feedback signal for a
controller when Qrefi is modulated. It is obvious from (2.6) that power factor control can be

P1: Control methodologies of Distributed Generation for enhanced network stability and control
Milestone 6 & 7 Report: April 2011 4/19/2011 38
achieved by modulating either Drefi or Qrefi . Hence, the input signal which gives larger values
of residues when ΔV or Δδ is used as feedback signal can be used as input modulating
signal. It can be observed from Figure 19 and Figure 20 that using Qrefi as modulating signal
gives larger values of residues in all the cases. Hence, Qrefi has been used as modulating
signal.
2. Controller Design We can design a lead lag compensator to place a mode at a desired location at negative
half of s - plane. The standard form of compensator design is given as (2.13) [8].
m
sTsT
sTsTKsKH ⎥
⎦
⎤⎢⎣
⎡++
+=
2
1
11
1)( (2.13)
Where,
)arg(180 ijko R−=φ (2.14)
)(sin1)(sin1
1
2
mm
TT
φφα
−−
== (2.15)
αωi
T 11 = (2.16)
12 TT α= (2.17)
Here, T is the washout time constant, which is usually taken as 5 – 10 sec, iω is the
frequency of the mode in rad/sec and K is the positive constant gain. φ is the amount of
phase compensation required and m is the number of compensation stages. The angle
compensated by each stage should not exceed 60 degree. A controller was designed for
modulating Qrefi to improve damping of critical mode. The calculated values of constants of
the controller are given in

P1: Control methodologies of Distributed Generation for enhanced network stability and control
Milestone 6 & 7 Report: April 2011 4/19/2011 39
Table 4.

P1: Control methodologies of Distributed Generation for enhanced network stability and control
Milestone 6 & 7 Report: April 2011 4/19/2011 40
Table 4 Parameters of the power factor controller φ
(degree) m
α
(degree)
T1
(seconds)
T2
(seconds)
102.8° 2 7.02° 1.78 0.22
The gain of the controller (K) was obtained by using root-locus technique. The trace of ζ with
K is shown in Figure 21. Here, K was gradually increased from zero until the desired
damping ratio of the critical mode was obtained. It can be observed from Figure 12 that ζ can
be increased by increasing the value of K. When K equals to zero, ζ has the initial value of
2.74%. Similarly, K equals 0.38 makes ζ equals to 10%. In this paper, K is set at 0.14 to
make ζ equals to 5%.
0.020.030.040.050.060.070.080.090.1
0 0.1 0.2 0.3 0.4
Dam
ping
ratio
of c
ritic
al
mod
e(ζ)
Gain (K)
0.14
Figure 21: Variation of damping ratio of critical mode with controller gain.
3. Effectiveness of the Controller The effectiveness of the controller was evaluated by observing the damping ratios before
and after installing the controller for PV. The results are shown in Figure 22.
00.05
0.10.15
0.20.25
0.30.35
0.40.45
Mode 1 Mode 2 Mode 3 Mode 4
Dam
ping
ratio
(ζ) With Controller
Without Controller
Figure 22: Comparison of damping ratios with and without controller. It can be observed that the supplementary controller effectively improves damping ratio of

P1: Control methodologies of Distributed Generation for enhanced network stability and control
Milestone 6 & 7 Report: April 2011 4/19/2011 41
critical modes to the targeted value of 5%. The damping ratios of other modes are
unaffected. The impact of controller on time domain response of the system was observed.
A three phase fault was applied at bus 3. The fault was cleared after 90 ms and the
responses of voltage at Bus 10 with and without controller are shown in Figure 23. It can be
observed that the controller effectively improves damping of low frequency oscillations in a
distribution system.
0.78
0.83
0.88
0.93
0.98
1.03
1.08
1.13
0 2 4 6 8 10
Vol
tage
of B
us 1
0 (p
.u.)
Time (Sec)
Without Controller With Controller
Figure 23: Comparison of time domain responses of voltage at Bus 10 with and without controller.
Similarly, time domain response of dc-link voltage of PV was observed under similar
disturbance scenario. The result is shown in Figure 24. It can be observed that oscillation in
dc-link voltage is better damped by the controller.
0.99
0.995
1
1.005
1.01
0 2 4 6 8 10
DC
link
vol
tage
(p.u
.)
Time (Sec)
Without ControllerWith Controller
Figure 24: Comparison of time domain responses of dc-link voltage with and without controller.
VI. Conclusions In this chapter, small signal stability analysis of a renewable energy based electricity
distribution system has been presented. The modeling approaches for different DG units
have been discussed briefly. A PV system has been modeled using DC-link dynamics and

P1: Control methodologies of Distributed Generation for enhanced network stability and control
Milestone 6 & 7 Report: April 2011 4/19/2011 42
dynamics of d-axis and q-axis components of output currents. A controller for PV generator
has been proposed and designed for enhancing the damping of a low damped critical mode.
Eigenvalue analysis for linearized system was used for assessment of small signal stability
and design of a controller for a PV generator. The effectiveness of the controller was
evaluated both by eigenvalue analysis and time domain simulation to justify the proposed
control methodology.
The chapter demonstrates that q-axis component of PV current participates more
effectively on critical mode as compared to the d-axis component. In different loading
conditions of the distribution system, q-axis component of PV current has been found to be a
better modulating signal to be utilized for designing an additional damping controller. Next,
critical mode was better damped when there is reactive power support from a PV generator
in a distribution system. Hence, operating PV at lower factor than unity has better impact on
damping of critical mode. In different loading conditions of distribution system, the critical
mode has higher sensitivity with respect to reactive power of PV as compared to the active
power. So, reactive power control of PV seems to be better for damping of low damped
excitation modes. Finally, the additional controller has been found to improve the damping of
the critical mode effectively by shifting the Eigen-values at desired location. Also, a desired
damping ratio can be achieved by selecting an appropriate value of controller gain. The
controller is found to affect only the critical mode while the other modes are mostly
unaffected.

P1: Control methodologies of Distributed Generation for enhanced network stability and control
Milestone 6 & 7 Report: April 2011 4/19/2011 43
Chapter 3 Conclusions of milestones 6 and 7
I. Conclusions Based on the analysis presented in chapters 1 & 2 following conclusions are drawn:
- The reactive compensation device placement strategy devised in chapter I not only
helps in improving the voltage at DG bus but also improves the voltage at load bus,
thus helping in utilizing the natural damping provided by the load.
- The placement strategy use only voltage at a node as a feedback signal to control the
STATCOM output that helps in reducing the cost.
- The simulation platform which has been developed in DIGISILENT not only helps in
testing the performance of controller under all operating conditions but also allows
improving performance of the methodology and controller functioning.
- Reactive power support from a PV generator is beneficial for damping of low frequency
oscillations of a distribution system.
- The proposed control methodology of PV generator can effectively improve the
damping of low frequency oscillations.
- An appropriate placement of STATCOM and a PV controller design on PV can
enhance the voltage and small signal stability respectively. With these outcomes, more
DG’s can be incorporated into the distribution and sub-transmission grid without
violating the voltage limit and oscillations due to small perturbations.

P1: Control methodologies of Distributed Generation for enhanced network stability and control
Milestone 6 & 7 Report: April 2011 4/19/2011 44
Appendix Software environment
1. DIgSILENT platform for capacitor and STATCOM placement for Voltage stability
A DIgSILENT PowerFactory R14.0 based dynamic model of a distribution system has been constructed for the work. Following PowerFactory core functions have been used with required modification and organization of cases.
1. Optimization Tools for Distribution Networks
By means of command edit dialogues it is possible to calculate the optimal placement, type and size of capacitors in radial distribution networks; the optimal separation points of meshed networks and the optimal type of reinforcement cables and overhead lines.
PowerFactory applies 2 different optimization approaches for capacitor placement:
Gradient Search: This search is fast and mostly will find a solution that performs well - even if not the mathematically exact global optimum.
Reactive Tabu Search: This search finds the exact optimum, but may be more time-consuming.
In our work, Reactive Tabu search algorithm has been utilized to get optimal location and size of cap-banks.
2. Models for Stability Analysis
In the majority of cases the standard IEEE definitions for controllers, prime movers and other associated devices and functions are used. For systems and configurations for which no IEEE models exist, such as STATCOM, composite model with composite frame has been built to represent the device. The composite models are based on composite frames and are used to combine and interconnect several elements (built-in models) and/or common models. The composite frames enable the reuse of the basic structure of the composite model.
3. Stability and EMT Simulations
The transient simulation functions available in DIgSILENT PowerFactory are able to analyze the dynamic behavior of small systems and large power systems in the time domain. These functions therefore make it possible to model complex systems such as industrial networks and large transmission grids in detail, taking into account electrical and mechanical parameters. The process of performing a transient simulation typically involved the following steps:
a) Calculation of initial condition with a load flow calculation b) Definition of result variables and/or simulation events where 2phase short circuit fault
has been considered c) Optional definition of result graphs and/or other virtual instruments d) Execution of simulation e) Creating additional result plots or virtual instruments, or editing existing ones f) Changing settings, parameters, repeating calculations.

P1: Control methodologies of Distributed Generation for enhanced network stability and control
Milestone 6 & 7 Report: April 2011 4/19/2011 45
2. MatLab tools for small signal stability studies
A MATLAB/Simulink based dynamic model of a distribution system has been constructed
for the research. This software utilizes some of the MatLab commands and other user
defined routines for the analysis. It has the flexibility to expand in the future as per the
requirement. Currently, the software has following major capabilities applicable for small
signal stability analysis as follows:
1) Initialization: This command initializes the dynamic variables of the machines for
dynamic simulation. Inputs to this command are line data, bus data, generator data
and constants of the controllers.
2) Networksolver: Network solver is a Simulink model of the distribution system with
DG units and controllers. It has facilities of observing time domain responses of the
bus voltages, generator rotor angles and rotor speeds.
3) Eigensensitivity: This command calculates eigenvalue sensitivity of a mode with the
specified parameter of distribution system.
4) Participation: this command calculates participation factors of the state variables on
different modes.
5) Rlplot: This command generates the root-locus plot of the steady state system.
6) Controllerdesign: this command evaluates the parameters of controller designed
based on classical residue technique.

P1: Control methodologies of Distributed Generation for enhanced network stability and control
Milestone 6 & 7 Report: April 2011 4/19/2011 46
References [1] "IEEE Application Guide for IEEE Std 1547, IEEE Standard for Interconnecting
Distributed Resources with Electric Power Systems," IEEE Std 1547.2-2008, pp. 1-207, 2009.
[2] "International Grid Code Comparison (IGCC-list) online available at: http://www.gl-group.com/pdf/IGCC_list.pdf." [3] Z. Wenjuan, L. Fangxing, and L. M. Tolbert, "Review of Reactive Power Planning:
Objectives, Constraints, and Algorithms," Power Systems, IEEE Transactions on, vol. 22, pp. 2177-2186, 2007.
[4] C. Chompoo-inwai, C. Yingvivatanapong, K. Methaprayoon, and L. Wei-Jen, "Reactive compensation techniques to improve the ride-through capability of wind turbine during disturbance," Industry Applications, IEEE Transactions on, vol. 41, pp. 666-672, 2005.
[5] N. K. Ardeshna and B. H. Chowdhury, "Supporting islanded microgrid operations in the presence of intermittent wind generation," in Power and Energy Society General Meeting, 2010 IEEE, 2010, pp. 1-8.
[6] M. Noroozian, N. A. Petersson, B. Thorvaldson, A. B. Nilsson, and C. W. Taylor, "Benefits of SVC and STATCOM for electric utility application," in Transmission and Distribution Conference and Exposition, 2003 IEEE PES, 2003, pp. 1143-1150 vol.3.
[7] R. Caldon, S. Spelta, V. Prandoni, and R. Turri, "Co-ordinated voltage regulation in distribution networks with embedded generation," in Electricity Distribution, 2005. CIRED 2005. 18th International Conference and Exhibition on, 2005, pp. 1-4.
[8] F. A. Viawan and D. Karlsson, "Voltage and Reactive Power Control in Systems with Synchronous Machine-Based Distributed Generation," Power Delivery, IEEE Transactions on, vol. 23, pp. 1079-1087, 2008.
[9] S. Foster, L. Xu, and B. Fox, "Coordinated reactive power control for facilitating fault ride through of doubly fed induction generator- and fixed speed induction generator-based wind farms," Renewable Power Generation, IET, vol. 4, pp. 128-138, 2010.
[10] A. Keane, L. F. Ochoa, E. Vittal, C. J. Dent, and G. P. Harrison, "Enhanced Utilization of Voltage Control Resources With Distributed Generation," Power Systems, IEEE Transactions on, vol. PP, pp. 1-1, 2010.
[11] Qiuwei Wu, Zhao Xu, and J. Ostergaard, "Grid integration issues for large scale wind power plants (WPPs)," in Power and Energy Society General Meeting, 2010 IEEE, 2010, pp. 1-6.
[12] "IEEE Standard for Interconnecting Distributed Resources with Electric Power Systems," IEEE Std 1547-2003, pp. 0_1-16, 2003.
[13] Federal Energy Regulatory Commission (FERC), "Interconnection for Wind Energy” Issued June 2, 2005.
[14] A. E. M. Commission, "National Electricity Amendment (Technical Standards for wind and other generators connections) Rule 2007," 8 March, 2007, www.aemc.gov.au.
[15] P. W. Sauer and M. A. Pai, Power system dynamics and stability. Upper Saddle River, N.J.: Prentice Hall, 1998.
[16] M. M. A. S. N. Mithulananthan, C. A. Can˜izares and J. Reeve, "Distribution system voltage regulation and var compensation for different static load models," International Journal of Electrical Engineering Education, vol. 37, pp. 384-395, 2000
[17] T. Aziz, T. K. Saha, and N. Mithulananthan, "Identification of the weakest bus in a distribution system with load uncertainties using reactive power margin " in Australasian Universities Power Engineering Conference (AUPEC 2010), New Zealand, 2010.
[18] H. Yann-Chang, Y. Hong-Tzer, and H. Ching-Lien, "Solving the capacitor placement problem in a radial distribution system using Tabu Search approach," Power Systems, IEEE Transactions on, vol. 11, pp. 1868-1873, 1996.

P1: Control methodologies of Distributed Generation for enhanced network stability and control
Milestone 6 & 7 Report: April 2011 4/19/2011 47
[19] Z. Wen, L. Yutian, and L. Yuanqi, "Optimal VAr planning in area power system," in Power System Technology, 2002. Proceedings. PowerCon 2002. International Conference on, 2002, pp. 2072-2075 vol.4.
[20] DIgSILENTGmbH, "DIgSILENT PowerFactory V14.0 -User Manual," DIgSILENT GmbH, 2008.
[21] N. G. Hingorani and L. Gyugyi, Understanding FACTS : concepts and technology of flexible AC transmission systems. Delhi: IEEE Press, 2001.
[22] C. Schauder and H. Mehta, "Vector analysis and control of advanced static VAr compensators," Generation, Transmission and Distribution, IEE Proceedings C, vol. 140, pp. 299-306, 1993.
[23] S. Civanlar, J. J. Grainger, H. Yin, and S. S. H. Lee, "Distribution feeder reconfiguration for loss reduction," Power Delivery, IEEE Transactions on, vol. 3, pp. 1217-1223, 1988.
[24] "IEEE Recommended Practice for Industrial and Commercial Power Systems Analysis," IEEE Std 399-1997, p. I, 1998.
[25] K. Morison, H. Hamadani, and W. Lei, "Load Modeling for Voltage Stability Studies," in Power Systems Conference and Exposition, 2006. PSCE '06. 2006 IEEE PES, 2006, pp. 564-568.
[26] G. Levitin, A. Kalyuzhny, A. Shenkman, and M. Chertkov, "Optimal capacitor allocation in distribution systems using a genetic algorithm and a fast energy loss computation technique," Power Delivery, IEEE Transactions on, vol. 15, pp. 623-628, 2000.
[27] N. Jenkins, R. Allan, P. Crossley, D. S. Kirschen, and G. Strbac, Embedded Generations, 1st ed. London, U.K., 2000.
[28] A. Ipakchi and F. Albuyeh, "Grid of the future," IEEE Power and Energy Magazine, vol. 7, pp. 52-62, 2009.
[29] "Australian Energy Market Operator (AEMO), "National Electricity Amendment (Technical Standards for Wind Generation and other Generator Connections) Rule 2007," 2007.
[30] S. M. Muyeen, R. Takahashi, T. Murata, and J. Tamura, "A Variable Speed Wind Turbine Control Strategy to Meet Wind Farm Grid Code Requirements," IEEE Transactions on Power Systems vol. 25, pp. 331-340.
[31] S. Dahal, N. Mithulananthan, and T. Saha, "Investigation of small signal stability of a renewable energy based electricity distribution system," in Proceedings of IEEE Power and Energy Society General Meeting, 2010 pp. 1-8.
[32] N. Mithulananthan, C. A. Canizares, and J. Reeve, "Tuning, performance and interactions of PSS and FACTS controllers," in Proceedings of IEEE Power Engineering Society Summer Meeting, 2002, pp. 981-987 vol.2.
[33] G. J. Rogers, Power System Oscillations. Boston/London/Dordrecht: Kluwer Academic Publishers, 2000.
[34] P. Kundur, "Power System Stability and Control," Electric Power Research Institute. [35] F. Katiraei, M. R. Iravani, and P. W. Lehn, "Micro-grid autonomous operation during
and subsequent to islanding process," IEEE Transactions on Power Delivery, vol. 20, pp. 248-257, 2005.

P1: Control methodologies of Distributed Generation for enhanced network stability and control
Milestone 6 & 7 Report: April 2011 4/19/2011 48
Published & Submitted Papers
1. T. Aziz, U. P. Mhaskar, T. K. Saha and N. Mithulananthan. “A Grid Compatible Methodology for Placement of Reactive Power Compensation in Renewable Based Distribution System”-accepted for the proceedings of the IEEE Power & Energy Society General Meeting (PESGM) 2011, to be held in Detroit, Michigan, USA during 24-28th July 2011.
2. S. Dahal, N. Mithulananthan, T. Saha, “An approach to control a photovoltaic generator to damp low frequency oscillations in an emerging distribution system”, accepted for the proceedings of the IEEE Power & Energy Society General Meeting (PESGM) 2011, to be held in Detroit, Michigan, USA during 24-28th July 2011.
3. T. Aziz, U. P. Mhaskar, T. K. Saha and N. Mithulananthan. “An Index and Grid Compatible Methodology for Reactive Power Compensation in Renewable Based Distribution System” submitted to IEEE transactions on Power systems.

1
Abstract— In recent years, the penetration level of renewable
based Distributed Energy Resource units (DER) with varying
sizes has increased significantly. System standards that have been
developed to accommodate the DER units demand small size of
DER units to operate with constant power factor mode and large
size of DER units in voltage control mode. The constant power
factor operational mode of small scale DER units results in
exposing them to the problem of slow voltage recovery. This
paper proposes an index and a methodology for placement of
shunt FACTS controllers to improve the voltage recovery at all
buses of interest. The case studies involving two different IEEE
test systems validate the proposed Index and methodology.
Index Terms— Distributed Energy Resources, sensitivity index,
STATCOM, voltage recovery.
I. INTRODUCTION
n recent years several environmental and economic benefits
and policies have led to increased penetration of intermittent
Distributed Energy Resource (DER) units into the electricity
grid. System operators have addressed the issue of increased
penetration by specifying the grid integration requirements at a
Point of Common Coupling (PCC). The independent power
producers are placing fast and slow acting reactive power
controllers at PCC to meet grid requirements. The static
reactive power controllers maintain a steady state voltage
profile while dynamic reactive controllers are more effective in
maintaining the voltage profile during sub-transient/transient
conditions. For example, in the case of a large wind farm
system, a placement of STATCOM at PCC improves its Low
Voltage Ride Through (LVRT) capability [1].
A comprehensive literature review of the placement of
STATCOM and other reactive power compensation systems
suggests that the present studies and methods are focused
towards large DER unit based systems and their integration,
especially to fulfill voltage related grid interconnection
requirements under all operating conditions [2], [3], [4], [5].
The voltage related issues reach a new dimension when small
scale DER units in an area tend to increase. The grid codes and
This work was supported by the CSIRO Intelligent Grid Flagship
Collaboration Research Fund. Tareq Aziz ([email protected]),
U.P.Mhaskar ([email protected]), T. K. Saha ([email protected])
and N. Mithulananthan ([email protected]) are with the School of
Information Technology and Electrical Engineering, The University of
Queensland, Qld 4072, Australia.
standards address these issues by requesting DER units below
a certain size to operate with constant power factor control
mode and request them to trip if abnormal conditions persists
for more than a stipulated period [6]. This not only affects the
uptime of small scale DER unit but also reduces the maximum
utilization of renewable energy resources in the system. The
problems mentioned can be alleviated by choosing an
appropriate location and type of reactive power controller in
such a manner that results in cost effective quick recovery of a
voltage at all nodes of interest. This paper addresses the issues
mentioned above in two steps. The first step develops a
sensitivity index that utilizes the characteristic and essential
variables (current and voltage) of Voltage Source Converter
(VSC) based series and shunt FACTS controllers. The second
step develops a method that utilizes that sensitivity index along
with an optimization procedure and time domain simulation to
find out the location of shunt reactive power controllers. The
paper is organized as follows:
Section II gives a brief introduction to the available grid
interconnection requirements for the DER unit. Section III
describes the detail methodology proposed to improve the
voltage profile in pre-fault and post-fault scenarios. Section IV
presents and compares the results obtained towards the
improvement in DER unit uptime. Section V describes the
conclusions and contributions of the work.
II. GRID INTERCONNECTION REQUIREMENTS
Grid interconnection standards specify the required behaviour
of renewable and non-renewable independent power plants at
PCC under all operating conditions. Generally, they deal with
the following issues of power system control [6],[7],[8]:
1. Steady state voltage and reactive power control;
2. Steady state frequency and active power control;
3. Response to abnormal voltage;
4. Voltage flicker and harmonics;
5. Data exchange with system operator.
A. Reactive power generation capability
In order to ensure increased real power generation in the
system and for ease of control, different grid codes around the
world limit the usage of reactive power capability of DER unit
to a minimum level. For example, IEEE std. 1547-2003 does
not allow a DER unit to regulate voltage at point of common
coupling actively [6]. Federal Electric Regulatory Commission
An Index and Grid Compatible Methodology
for Reactive Power Compensation in Renewable
Based Distribution System T. Aziz, Student Member, IEEE U. P. Mhaskar, T. K. Saha, Senior Member, IEEE and
N. Mithulananthan, Senior Member, IEEE
I

2
(FERC), USA, specify power factor at a point of common
coupling as 0.95 leading to 0.95 lagging for large wind parks
as found from system impact studies [7]. In Australia,
Australian Electricity Market Operator (AEMO) request
distributed generation with a capacity of less than 30MW to
maintain a power factor between 1 to 0.95 leading for both
100% and 50% real power generation [8].
B. Steady state voltage: continuous operation range
Steady state voltage level at each node is one of the most
important parameters for the quality of supply. In general, it is
expected that voltage of a node remains within the range of
±10% of nominal value irrespective of the presence of DER
units in the network [8].
C. Response of DER unit to abnormal voltage
IEEE and other standards request DER units of below a
certain size to cease energizing during abnormal system
conditions according to the clearing time shown in Table I [6].
TABLE I
DER UNIT RESPONSE TO ABNORMAL VOLTAGE [6]
Voltage Range (p.u.) Clearing time (sec)
V < 0.5 0.16
0.5 ≤ V < 0.88 2.00
1.1 < V < 1.2 1.00
V ≥ 1.2 0.16
The clearing time listed in Table I is a maximum threshold
for DER units with a capacity of 30 kW or less. For DER units
with generation capacity greater than 30 kW, the listed
clearing time is a default value though this can vary amongst
the utilities.
D. Voltage flicker and harmonics
IEEE and IEC standards request DER units to maintain the
harmonics injected and flicker level below optimal value [6].
The issue of slow voltage recovery demands more attention
above all mentioned requirements to improve the uptime and
hence renewable energy penetration/utilization. The next
section describes the sensitivity index and methodology
developed to alleviate this problem.
III. SENSITIVITY INDEX AND FORMULATION OF METHODOLOGY
FOR SHUNT REACTIVE POWER CONTROLLERS
Based on the literature review and analysis of grid
interconnection requirements, a new sensitivity index and a
methodology are proposed to improve the uptime of small
scale DER units. The following section describes detailed
derivation of index and methodology.
A. Formulation of sensitivity Index for VSC based series and
shunt FACTS controller
For incorporation of VSC based FACTS controllers in voltage
stability studies the following issues are important:
1) Formulation of Equations:
Choice of controllable variables (Node voltage
and angle in conventional tools)
Choice of output variables (shunt, real and
reactive power injections and/or current
injected)
2) Methods of Solution:
Stability assessment using P-V curve.
Time domain simulation representing load
dynamics, control strategy for excursion in
voltage at nodes of interest.
The above choices are dictated by the basic operating
characteristics, response time, control capability of the devices
and intended duration of a study [9]. The indices and
methodologies use power balance equations to carry out the
analysis. However, for a system with large dispersed DER
units, a fault may trigger a delayed voltage recovery in a
system, tripping DER units in a few seconds. The VSC based
series and shunt FACTS controllers inject real and reactive
components of voltage/current independent of a node
voltage/line current within a few milliseconds. Thus, for the
studies intended (placement and sizing of VSC based reactive
power controllers); the power system along with VSC based
FACTS controllers need different representation.
Fig.1. Branch with series FACTS controllers.
List of symbols
Xsh State of a shunt connected system;
V node voltage magnitude;
ush Damping controller input for shunt connected
controller;
user Damping controller input for series connected
controller;
Ish magnitude of current injected by shunt FACTS
controller;
Xser State of series connected system;
Ө Phase angle of voltage at node;
β Phase angle of current flowing in a branch;
I Magnitude of current flowing in a branch;
IR Injected shunt reactive current;
VR Series injected voltage in quadrature with line- current;
Psh Shunt injected real power;
Pser Series injected real power;
Qsh Shunt injected reactive power;
Qser Series injected reactive power;
|Yij| Magnitude of element in Ynode matrix, connected
between i and j node;
θij Angle of element in Ynode matrix, connected between ith
and jth
node;
nj Set of nodes connected to node j where series FACTS
controller are not connected;
rj Set of branches connected to node j where series
FACTS controllers are connected;
P Node incident matrix connected ith
FACTS controller
with jth
node (Pt is a transpose of P matrix).

3
The set of governing eqns. for a power system with series
connected VSC based FACTS controller (see Fig. 1) is as
follows: .
( , , )sh sh shshX f X V u (1)
.
( , , )ser ser ser serX f X I u (2)
sh node
t
brbr
I Y P V
P ZV I
.
(3)
Utilizing the variables such as injected series real power,
reactive voltage and shunt real power and reactive current and
rearranging those results in eqn. 4-5.
ser p j j i i
R ser j j i i
P V I V Icos( ) VIcos( )
V (Q / I) V Isin( ) VIsin( ) (4)
j
sh j j i ij j i ij j l j l
i nj l rj
sh j
R i ij j i ij j l j l
i nj l rjj
P V V | Y | cos( ) V I cos( )
QI V | Y | sin( ) V I sin( )
V
(5)
For sensitivity analysis, linearising eqns. 4-5 around the
operating point, we have:
sh 11 12 13 14
R 21 22 23 24
31 32 33 34ser
41 42 43 44R
P A A A A
I A A A A V
A A A AP
A A A A IV
(6)
Where, elements of various sub-matrices in eqn. 6 are as
follows:
i i i i
i i i i
i i i
sh sh sh sh
11 12 13 14
j j j j
R R R R
21 22 23 24
j j j j
ser ser ser
31 32 33 34
j j j
P P P PA (i, j) ,A (i, j) ,A (i, j) ,A (i, j)
V I
I I I IA (i, j) ,A (i, j) ,A (i, j) ,A (i, j)
V I
P P PA (i, j) ,A (i, j) ,A (i, j) ,A (i
V
i
i i i i
ser
j
R R R R
41 42 43 44
j j j j
P, j)
I
V V V VA (i, j) ,A (i, j) ,A (i, j) ,A (i, j) .
V I
Considering the power system with only shunt VSC based
FACTS controllers, we have:
sh RA P B I (7)
sh RV C P D I
Simplification of set of eqns. (7) results in the expression of
sensitivity as in eqn. 9.
1
1
22 21 11 12
R
VA A [A A ]
I (8)
The next section describes the algorithm that utilizes RΔV/ΔI as
a sensitivity index to find out the best location for a shunt
dynamic reactive power controller along with placement of a
capacitor bank in a distribution system to alleviate the slow
voltage recovery problems.
B. Methodology for placement of shunt reactive power
controller
The major steps followed to secure the voltage profile
throughout the system for all operating conditions steady state
and transient are depicted in Fig. 2. Inclusion of a DER unit
results in reduction of real power intake from the utility grid.
This approach converts the test system to a weak
interconnected micro-grid. Using “Tabu-search” based multi-
objective optimization; functions like grid loss and placement
of static reactive power compensation are optimized; eqn. 10
describes the cost function utilized [10]. I L
i i loss.j j
i=1 j=1
MinF= C q +K× P ×T (9)
Steady state voltage requirement (at generator and load
terminals) is set as constraints for the optimization problem.
In eqn. 10, L and I represent the number of load levels and
candidate locations to install the capacitors. iq is a set of fixed
capacitors for optimal solution, jq is the control scheme
vector at load level j whose components are discrete variables.
Investment cost associated with a capacitor installed at
location i is given byi iC q . Power loss at a load level j with
time duration jT is given by
loss jP ×T and K stands for electricity
price. With application of various faults in the system, time
domain simulations were carried out to check dynamic voltage
restoring capability at the generator and load bus.
Fig.2. Flow chart for determination of reactive power controller location.
The placement of STATCOM is considered only when a static
compensator (capacitor bank) fails to maintain the voltage
profile as required by the system operator. For the placement
of STATCOM, the proposed sensitivity RΔV/ΔI along with its
direction is used to find out the single best location amongst
the optimal capacitor nodes. The node having the highest
inductive RΔV/ΔI indicates the necessity of STATCOM at that
node. Replacing the optimal capacitor on that node by
STATCOM, a voltage recovery time is obtained with the help
of time domain simulation for the generator as well as load
node. The procedure is repeated till the voltage excursion of
all nodes concerned falls within the boundary specified by

4
standard/grid code. Performance of RΔV/ΔI is compared with
an existing sensitivity index ΔV/ΔQ .
IV. RESULTS AND ANALYSIS
A. Test distribution systems
To test the effectiveness of the proposed methodology, two
distribution test systems with different configurations and load
compositions are considered in this work. All studies reported
are carried out using DigSILENT [11]. The first test
distribution system consists of 16 buses as shown in Fig. 3.
Total load in the system is 28.7MW and 9.48MVAr,
respectively. This system is treated as a commercial feeder for
the intended study. The second system has been obtained from
[12], with 21.76MW and 9MVAr of real and reactive power
load as shown in Fig. 4. This system is treated as an industrial
feeder for the intended study.
Fig.3. Single line diagram: 16 bus test system.
B. Load composition and load curves
This study considers practical scenarios of load
composition as they have a profound impact on voltage at
various nodes. The breakdown typically used by the utilities
for commercial and industrial feeders have been shown in
Table II [13]. Here, motors with power ratings greater than
100 hp have been treated as large motors, which are principal
loads in an industrial feeder. A commercial feeder is
dominated (51%) by small motors representing air
conditioners. This breakdown of loads is utilized for static
load modeling of both feeders.
TABLE II TYPICAL LOAD COMPOSITION [13]
Load type Load composition
Commercial feeder (16 node system)
Industrial feeder (43 node system)
Resistive 14 5
Small motor 51 20
Large motor 0 56
Discharge lighting 35 19
For each type of feeder, the customer load has its typical daily
load curve (DLC) set [14]. Pavg/Pmax found from these DLC
sets is presented in Table III and has been used in this work.
C. Distributed generator and its size
DER units considered in this study are conventional
synchronous generators (this is mainly due to rotor angle
stability issues) with unity power factor operation. The DER
unit connection details for both systems have been shown in
Table IV at base load condition. The location of DER units in
the 16 node system are chosen randomly at node 3 and node 6,
whereas for the 43 node system locations is maintained as
given by the system data.
Fig.4. Single line diagram: 43 bus test system.
TABLE III
PEAK LOAD DATA [14]
Load type Load composition
Commercial feeder (16 node system)
Industrial feeder (43 node system)
Pavg/Pmax 0.68 0.61
Peak load (MW) 42.72 28.82
TABLE IV
DISTRIBUTED GENERATION: CAPACITY AND LOCATION
Distributed generation
Commercial feeder (16 node system)
Industrial feeder (43 node system)
DER unit 1
DER unit 2
DER unit 1
DER unit 2
Location node 3 6 4 50
MVA rating 10 19.58 20 20
Power factor 1 1 1 1
D. Optimal capacitor placement and sensitivity Index values
As described in section III-B, „Tabu search‟ technique has
been used to find out the proper location of a fixed
compensator in the system at peak load conditions followed
from Table III. The number of candidate nodes has been
chosen to 50% with an objective function of minimizing grid
loss with minimum available capacitor banks. Voltage limits
at generator as well as load node have been set to 0.90 p.u. to
1.1 p.u. according to steady state voltage operating range in
[6]. Table V summarizes the results for optimal capacitor
places for the 16 node system whereas Table VI shows the
optimal capacitor places for the 43 node test system. For the
16 node system, placing capacitors of 10.2 MVAr reduces the
grid loss significantly from 1.20 MW to 0.90 MW (see Table
V) and helps in maintaining the voltage profile within steady
state limit.
TABLE V
OPTIMAL CAPACITOR SOLUTION FOR 16 BUS SYSTEM
Optimal
Node
Capacitor size
(MVAr)
Sensitivity index
V / Q
(Vpu/MVAr)
RV / I
(Vp.u/Ip.u.)
7 3.6 0.0069 -0.1428 (Inductive)
5 1.8 0.0038 0.0769 (Capacitive)
11 1.8 0.0034 0.0667 (Capacitive)
15 1.8 0.0049 0.1 (Capacitive)
3 1.2 0.0048 0.11 (Capacitive)

5
In the 43 node system, with inclusion of 11.20 MVAr of
fixed capacitor bank, has improved voltage profile but
marginal reduction in grid loss from 0.54 MW to 0.45 MW has
been obtained. TABLE VI
OPTIMAL CAPACITOR SOLUTION FOR 43 BUS SYSTEM
Optimal
Node
Capacitor size
(MVAr)
Sensitivity index
V / Q
(Vp.u./MVAr) RV / I
(Vp.u/Ip.u.)
49 0.6 0.044 0.20 (Capacitive)
29 0.6 0.046 0.25 (Capacitive)
21 0.6 0.088 0.33 (Capacitive)
51 0.6 0.046 0.2 (Capacitive)
41 0.6 0.048 0.2 (Capacitive)
25 0.6 0.006 0.03 (Capacitive)
30 0.6 0.047 0.25 (Capacitive)
39 1.1 0.044 -0.25 (Inductive)
17 1.1 0.055 0.25 (Capacitive)
35 1.2 0.049 0.2 (Capacitive)
18 1.2 0.048 0.2 (Capacitive)
37 1.2 0.068 0.33 (Capacitive)
33 1.2 0.049 0.25 (Capacitive)
E. Voltage recovery and STATCOM placement
According to [6], voltage at DER units must come back to
90% of their normal operating voltage within 2 sec after
initiation of abnormal condition. For the verification of
dynamic voltage restoring capability using STATCOM for
generator and load nodes, a portion of static loads is converted
to dynamic motor loads according to the percentages as given
in Table II. Tables V and VI contain sensitivity values ΔV/ΔQ
and RΔV/ΔI at the optimal compensation nodes, which
minimizes iterations to find best node for dynamic
compensation. These values are calculated numerically with
small perturbations. To check the voltage profile under
abnormal conditions, both systems are subjected to a three
phase fault (with a fault reactance of 0.05 Ω) near the
generator node and the fault is cleared after 12 cycles. The
following test cases were investigated to find out possible
solutions for supporting the above requirements:
Case 1: Without capacitor;
Case 2: With capacitor at optimal locations;
Case 3: Replacing capacitor with STATCOM at a node with
highest V / Q ;
Case 4: Replacing capacitor with STATCOM at a node with
highest RV / I (For both inductive and capacitive values).
During the simulation studies, STATCOM is equipped with a
voltage controller [15]. Figs. 5 to 7 show the time domain
simulation for the 16 node system at peak load condition. Figs.
5 and 6 show excursions in voltage at nodes 3 and 6 (which are
DG nodes) respectively with fault at node 5. Load terminal
voltage profile is plotted for the fault at node 5 in Fig. 7. A
STATCOM is placed at node 7 and node 3 alternately to find
the effect of placement on voltage recovery time and also to
investigate effectiveness of sensitivity indices
V / Q andRV / I respectively. As shown in Fig. 5
without capacitors, the system fails to reach the required
voltage due to three phase fault contingency. For generator
node 3, capacitors at optimal places with optimal sizes help to
recover the node voltage within 1.15sec. STATCOM at node 7
reduces the restoring time significantly to only 0.26 sec. It is
interesting to find that, though node 3 is a DER unit node,
placing STATCOM on node 3 results in a longer recovery
time (1.26 sec) than that on node 7. Table VII summarizes the
voltage recovery time for both generator nodes of the 16 node
system. As simulation results for the 16 node system under
peak load condition does not reflect any problem of slow
recovery of voltage of DER unit nodes, base case is not
considered. Time domain simulations for the 43 node system is
plotted with two cases- base load and peak load. Simulation is
carried out for all four cases mentioned earlier. Figs. 8 and 9
show the simulation results for generator node voltages with a
three phase fault at node 31 at base load condition. Sensitivity
indices, V / Q and RV / I (Capacitive), both have their
highest value at node 21. RV / I (Inductive) is found only
at node 39 with a value of 0.25 (V p.u. /IR p.u.) as shown
in Table VI.
Fig.5. Voltage at bus 3 of 16 bus test at peak load conditions.
TABLE VII VOLTAGE RECOVERY TIME FOR 16 BUS SYSTEM -PEAK LOAD
DER unit node Without
capacitors
With
capacitors
With
STATCOM
at node 3
With
STATCOM
at node 7
3 (DER unit 1) N/A 1.15 sec 1.26 sec 0.26 sec
6 (DER unit 2) N/A 1.59 sec 1.97 sec 1.26 sec
Table VIII summarizes the voltage recovery time at base
loading, which shows that other than STATCOM at node 39,
no controller arrangement can support grid requirement at
node 4 as they have a recovery time greater than 2sec. For
node 50, recovery time is found to be less than 2sec in all
arrangements considered. Figs. 10 and 11 show the simulation
results with a three phase fault at node 31 at peak load
condition. Table IX summarizes the voltage recovery times at
peak load. It shows that placement of STATCOM on node 39
results in reduced voltage recovery time supporting grid
requirement whereas the other arrangements fail to meet the
standard. Analyzing the voltage recovery time from all three
Tables VII-IX, it can be concluded that STATCOM should be
placed at a node with the highest inductive RV / I to

6
support voltage recovery requirement of DER units in the
system. Also, it is important to note that SVC behaves as a
fixed capacitor or variable inductor as compared to
STATCOM, hence when needed the reactive power supplied
by the SVC is a strong function of voltage of a terminal to
which it is connected [16].
TABLE VIII
VOLTAGE RECOVERY TIME FOR 43 BUS SYSTEM -BASE LOAD
DER unit node Without
Capacitor
s
With
Capacitor
s
With
STATCOM
at node 21
With
STATCOM
at node 39
4 (DER unit 1) 3.12 sec 2.35 sec 2.49 sec 1.61 sec
50 (DER unit 2) 0.71 sec 0.54 sec 0.42 sec 0.37 sec
For a small radial system like the 16 node system, it has
been found that STATCOM is not even necessary to support
voltage recovery, though wrong placement of STATCOM
leads to longer recovery time.
Fig.6. Voltage at bus 6 of 16 bus system at peak load conditions.
Fig.7. Voltage at bus 5 of 16 bus system at peak load conditions.
But for the 43 node system with large mesh configuration,
STATCOM is required at both base and peak loading
condition to support voltage recovery. Further tuning of
control parameters of STATCOM can result in reduction of
voltage recovery time. Figs. 12 and 13 show excursion in
generator rotor angle as a function of placement of
STATCOM and capacitors. From Figs. 12-13 it can be
concluded that the fast recovery of voltage not only leads to
improvement in voltage profile at all concerned nodes but also
allows in utilizing inherent damping capability of the power
system.
Fig.8. Voltage at bus 4 of 43 bus system at base load conditions.
Fig.9. Voltage at bus number 50 of 43 bus system at base load conditions.
Fig.10. Voltage at bus 4 of 43 bus system at peak load conditions.
TABLE IX VOLTAGE RECOVERY TIME FOR 43 BUS SYSTEM –PEAK LOAD
DER unit node Without
Capacitor
s
With
Capacitor
s
With
STATCOM
at node 21
With
STATCOM
at node 39
4 (DER unit 1) 2.95 sec 2.10 sec 2.24 sec 1.67 sec
50 (DER unit 2) 0.60 Sec 0.42 Sec 0.39 Sec 0.30 Sec

7
Fig.11. Voltage at bus number 50 of 43 bus system at peak load conditions.
Fig.12. Excursion in rotor angle for generator at bus 4 of 43 bus system at
peak load condition.
Fig.13. Excursion in rotor angle for generator at bus number 50 of 43 bus
system at peak load condition.
V. CONCLUSIONS
In this paper, we have developed and investigated a new
sensitivity index based methodology for placement of shunt
reactive power compensators. This approach helps in placing
capacitor banks and STATCOM in a distributed manner to
improve voltage profile at all nodes of interest. Results show
that dynamic compensation may not be necessary for a small
radial distribution system though further investigations are
required to generalize this finding. The new sensitivity index
RV / I has been proved effective in detecting the
appropriate location of STATCOM also in the presence of
fixed compensation. As a result, small scale DER units remain
connected to the grid under abnormal conditions improving
their uptime. Further work is required to obtain a precise and
quantitative relationship between disturbance magnitude, post
fault recovery of voltage and the required controllable range.
Future work will focus on the optimal mixture of static and
dynamic compensation and sizing of STATCOM and
optimizing its controller parameters for achieving voltage
control with improvement in DER unit uptime.
VI. APPENDIX
Although not investigated in this paper another closely related
formulation can be obtained, by making large sub-matrices of
the Jacobean in eqn. 6 constant, with assumptions as follows
[17]:
i jcos( ) 1;
i jsin( ) 0;
voltage at the node approximately 1 p.u.;
effect of shunts and tap changing action of
transformers are neglected in calculating A11;
effect of phase shifters in neglected in calculating A22;
effect of series devices on the diagonal elements of
A11, A12, A21, A22, is neglected;
effect of resistances is neglected in the calculation of
A11;
Then it can be shown that
A11= B' = A constant matrix;
A22= B'' = A constant matrix;
and
A12=A21=0.
As a result the linearised Jacobean becomes
sh 13 14
R 23 24
31 32 33 34ser
41 42 43 44R
P B' 0 A A
I 0 B'' A A V
A A A AP
A A A A IV
(10)
Thus simplified relation for sensitivity index RV / I can be
as follows:
1
R
VB''
I (11)
Similar relationship for sensitivity index with series FACTS
controllers can be obtained using eqn. 11 but not discussed
here.
VII. REFERENCES
[1] C. Chompoo-inwai, C. Yingvivatanapong, K. Methaprayoon, and
L. Wei-Jen, "Reactive compensation techniques to improve the
ride-through capability of wind turbine during disturbance", IEEE
Transactions on Industry Applications, vol. 41,no. 3, pp. 666-672,
2005.

8
[2] R. Caldon, S. Spelta, V. Prandoni and R. Turri, "Co-ordinated
voltage regulation in distribution networks with embedded
generation," 18th International Conference and Exhibition on
Electricity Distribution, pp. 1-4, 2005.
[3] F. A. Viawan and D. Karlsson, "Voltage and Reactive power
control in systems with synchronous machine-based distributed
generation", IEEE Transactions on Power Delivery, vol. 23, no. 2,
pp. 1079-1087, 2008.
[4] S. Foster, L. Xu, and B. Fox, "Coordinated reactive power control
for facilitating fault ride through of doubly fed induction
generator- and fixed speed induction generator-based wind farms",
IET, Renewable Power Generation, vol. 4,no. 2 , pp. 128-138,
2010.
[5] A. Keane, L. F. Ochoa, E. Vittal, C. J. Dent, and G. P. Harrison,
"Enhanced utilization of voltage control resources with distributed
generation," IEEE Transactions on Power Systems, 2010.
[6] "IEEE Standard for Interconnecting Distributed Resources with
Electric Power Systems," IEEE std. 1547-2003, 2003.
[7] Federal Energy Regulatory Commission (FERC), "Interconnection
for Wind Energy” Issued June 2, 2005.
[8] A. E. M. Commission, "National Electricity Amendment
(Technical Standards for wind and other generators connections)
Rule 2007", 8 March, 2007, www.aemc.gov.au.
[9] M. M. Begovic, A.G. Phadke, "Control of voltage stability using
sensitivity analysis", IEEE Transactions on Power Systems, vol. 7,
no. 1, pp. 114-123, 1992.
[10] H. Yann-Chang, Y. Hong-Tzer, and H. Ching-Lien, "Solving the
capacitor placement problem in a radial distribution system using
Tabu search approach," IEEE Transactions on Power Systems, vol.
11, no. 4, pp. 1868-1873, 1996.
[11] DIgSILENTGmbH, "DIgSILENT PowerFactory V14.0 -User
Manual," DIgSILENT GmbH, 2008.
[12] "IEEE Recommended Practice for Industrial and Commercial
Power Systems Analysis," IEEE Std 399-1997, 1998.
[13] K. Morison, H. Hamadani, and W. Lei, "Load modeling for
voltage stability studies", IEEE Power Systems Conference and
Exposition, pp. 564-568, 2006.
[14] G. Levitin, A. Kalyuzhny, A. Shenkman, and M. Chertkov,
"Optimal capacitor allocation in distribution systems using a
genetic algorithm and a fast energy loss computation technique",
IEEE Transactions on Power Delivery, vol. 15,no.2, pp. 623-628,
2000.
[15] C. Schauder, H. Mehta, "Vector analysis and control of advanced
static VAr compensators", IEE Proceedings C Generation,
Transmission and Distribution, vol. 140,no.4 , pp. 299-306, 1993.
[16] M. Noroozian, N. Anderson, B. Thorvaldson, A. Nilsson, C.
Taylor, "Benefits of SVC and STATCOM for electric utility
application", IEEE Transmission and Distribution Conference and
Exposition, 2003, vol. 3, pp. 1143- 1150, 2003.
[17] O. Alsac, B. Stott, "Fast decoupled load flow," IEEE Transactions
on Power Apparatus and Systems, vol. PAS-93, no.3,pp. 859-869,
May 1974.
VIII. BIOGRAPHIES
Tareq Aziz (M’09) was born in Dhaka,
Bangladesh. He completed his B.Sc. (Engg.) and
M.Sc. (Engg.) in Electrical & Electronic
Engineering both from Bangladesh University of
Engineering & Technology (BUET) in 2002 and
2005 respectively. He worked as a faculty member
in Khulna University of Engineering & Technology
and American International University-Bangladesh.
Currently he is doing his PhD in School of ITEE,
The University of Queensland. His research
interests include renewable energy integration in power system, power system
stability and signal processing.
U. P. Mhaskar is presently working as a post-doctoral fellow at The
University of Queensland. He received his Ph. D. in 2003. His research areas
include control system design, power electronics and drives, renewable energy
and HIL simulation studies.
Tapan Kumar Saha (M‟93, SM‟97) was born in
Bangladesh in 1959 and immigrated to Australia in
1989. He received B.Sc.Eng. Degree in 1982 from
Bangladesh University of Engineering &
Technology, Dhaka, Bangladesh, M.Tech. in 1985
from the Indian Institute of Technology, New Delhi,
India and PhD in 1994 from the University of
Queensland, Brisbane, Australia. Tapan is currently
a Professor in Electrical Engineering in the School
of Information Technology and Electrical
Engineering, University of Queensland, Australia.
Previously he has had visiting appointments for a semester at both the Royal
Institute of Technology (KTH), Stockholm, Sweden and at the University of
Newcastle (Australia). He is a Fellow of the Institution of Engineers,
Australia. His research interests include condition monitoring of electrical
plants, power systems and power quality.
Nadarajah Mithulananthan (M‟02, SM‟10)
received his Ph.D. from University of Waterloo,
Canada in Electrical and Computer Engineering in
2002. His B.Sc. (Eng.) and M. Eng. Degrees are
from the University of Peradeniya, Sri Lanka, and
the Asian Institute of Technology, Bangkok,
Thailand, in May 1993 and August 1997,
respectively. He has worked as an electrical
engineer at the Generation Planning Branch of the
Ceylon electricity Board, and as a researcher at
Chulalongkorn University, Bangkok, Thailand. Dr. Mithulan is currently a
senior lecture at the University of Queensland (UQ), Brisbane, Australia.
Prior to joining UQ he was associate Professor at Asian Institute of
Technology, Bangkok, Thailand. His research interests are integration of
renewable energy in power systems and power system stability and dynamics.

1
Abstract—Factors like diminishing fossil fuels and
environmental concerns are driving the integration of locally available energy resources at a distribution level. As a result, a number of stability issues have become a concern for utilities at distribution systems. One of the important stability concerns is the small signal stability caused by electromechanical or other low frequency oscillations. The oscillations with lower values of frequency and damping may cause instabilities. In such cases, a suitable control methodology must be applied to ensure the stability of an emerging distribution system. In this paper, a methodology to control the power factor of photovoltaic generator (PV) is proposed for enhancement of system stability. The impact of PV power factor control on a low damped mode is assessed by using both eigenvalue sensitivity and time domain analysis. An appropriate signal for the proposed controller is identified by residue technique. The effectiveness of the controller is tested in IEEE 43 bus test distribution system with distributed generators. Results show that reactive power support from PV is better for damping of critical mode.
Index Terms— Damping controller, distributed generation, eigenvalue analysis, photovoltaic generation, small signal stability.
I. INTRODUCTION ONVENTIONAL distribution systems are regarded as passive networks, which do not have any active source of
power generation. The power flow pattern in such networks are unidirectional[1]. However, structure of emerging distribution systems are changing from passive to active network due to the integration of local energy resources in the form of distributed generation (DG) units and their controllers [2]. The DG units may be either utilizing renewable energy resources such as wind and solar or using conventional fossil fuels such as cogeneration[1]. However, more concerns on rapidly diminishing fossil resources and environmental degradation have encouraged integration of renewable resources rather than fossil fuels.
With the integration of DG units, there are more concerns
This work was supported by the University of Queensland through APA
award and the CSIRO Australia under Intelligent Grid Flagship Project. S. Dahal (email: [email protected]), N. Mithulananthan (email:
[email protected]) and T. Saha (email: [email protected]) are with School of Information Technology and Electrical Engineering, The University of Queensland, 4072, QLD, Australia.
on stable operation of distribution networks under various disturbances. Assessment of low-voltage-ride-through (LVRT) capability has become important before a DG unit can be connected to existing power system[3],[4]. Given the smaller geographical area, the generators and controllers are in a close proximity in a distribution system as compared to transmission systems. Such proximity may induce interactions among the machines leading to low frequency oscillations and improper tuning of controllers [5],[6]. As a result, issues of oscillatory instability may become a threat to secure operation of an emerging distribution system.
Oscillatory instabilities in the form of low frequency oscillations are highly undesirable. These oscillations must have acceptable damping ratios to ensure stable operation of a power system[3]. In case of transmission systems, various controllers such as power system stabilizers (PSS), static var compensators (SVC) and static compensators (STATCOM) are commonly used for oscillation damping [6]. There are various methods reported in the literatures to determine suitable locations and design approaches of these damping controllers in a power system[7], [8]. However, installation of such devices in a low voltage distribution system may not always be technically and economically attractive. Instead, one of the DG units in the system may be controlled to improve system stability [9]. Given the structure of a photovoltaic (PV) system, which is dominated by controllers, one of the controllers of PV system may be employed for improving the oscillation damping. In this paper, damping of a low frequency oscillation in a distribution network is discussed. The network consists of synchronous generators, induction generator and a PV. The impact of PV system on a low frequency mode is systematically assessed. Then, a control methodology is proposed for PV system to enhance the damping of low frequency oscillations.
The paper is organized as follows: Section II discusses about the modeling of PV generator and its associated controllers. Section III assesses the small signal stability of a test distribution system by eigenvalue analysis. The impact of PV on system stability is demonstrated in section IV. An approach to design a suitable controller for a PV system to damp the low frequency oscillations on the system is presented in section V. This section also discusses the effectiveness of the proposed controller. Finally, section VI summarizes the conclusions drawn from the study.
An Approach to Control a Photovoltaic Generator to Damp Low Frequency Oscillations
in an Emerging Distribution System S. Dahal, Student Member, IEEE, N. Mithulananthan, Senior Member, IEEE, T. Saha, Senior Member,
IEEE
C

2
II. MODEL OF A PHOTOVOLTAIC SYSTEM One of the popular DG units in present power distribution
system is solar photovoltaic (PV) system. The technology of PV system is different from the conventional synchronous and induction generators used for power generation. Unlike conventional generators, PV systems do not have rotating mechanical parts and their system dynamics are dominated by controllers[10].
The analysis of impact of PV on stability of a distribution network requires an appropriate model of a PV system. A number of literatures discuss on the modeling of photovoltaic systems[10],[11],[12]. Some of the works employ detailed modeling for transient stability studies[10]. Approximate models are used for small signal and steady state stability analysis [12],[13]. A comparison of detailed model and approximate models for assessment of small signal stability is presented in [12]. It is recommended that approximate models are enough to represent the small signal behavior of a power system. Similarly, some literatures have discussed the impact of PV system on transient and small signal stability of a power system[10],[12]. In many cases, PV system has been reported to improve the damping of low frequency oscillations.
The modeling approach of a PV generator and power factor controller considered in this paper is discussed in this section.
A. Model of Photovoltaic Generator A schematic diagram of grid connected photovoltaic (PV)
system is shown in Fig. 1.
phI
Sun Rays
),( SQSD vv),( QD ii
dcv+−
⎯⎯ →⎯PVP
VSC
C
876
QD mm ,
R+jX
⎯⎯⎯ →⎯DCP
⎯⎯⎯ →⎯+ jQP
Fig. 1. A schematic diagram of grid connected PV system.
Incidence of sun rays on PV panels induces photovoltaic
current, which causes PV power flow ( PVP ) from PV panels to DC link capacitor. PVP can be given as (1) [10],[11].
⎥⎥⎦
⎤
⎢⎢⎣
⎡
⎭⎬⎫
⎩⎨⎧
−⎟⎟⎠
⎞⎜⎜⎝
⎛−= 1exp
s
dcrsphdcpPV n
vkTA
qIIvnP
(1)
where, pn and sn are numbers of parallel strings and number of series connected PV panels per string respectively. Similarly, dcv is dc-link capacitor voltage. Quantities q , k ,Tand A denote the unit charge, Boltzmann’s constant, cell temperature, and p-n junction ideality factor respectively. Now, phI is the photovoltaic current and is given by (2).
100)]([ STTkII RTSCph −+=
(2)
where, RT is the reference temperature of cell and SCI is the short circuit current of a unit cell of PV at reference temperature and solar irradiation S. Tk is the temperature coefficient. Similarly, cell reverse saturation current ( rsI ) is given by (3).
⎟⎟⎠
⎞⎜⎜⎝
⎛⎥⎦
⎤⎢⎣
⎡−⎥
⎦
⎤⎢⎣
⎡=
TTkAqE
TTII
R
G
RRRrs
11exp3
(3)
where, RRI is the reverse saturation current at reference temperature RT , and GE is the band gap energy of a cell.
For a particular grid connected PV system, PVP depends on dcv for given conditions of solar irradiations and cell
temperature. For the grid connected PV system considered in this paper, the variation pvP with dcv is shown in Fig. 2. It can be observed that the PV system output becomes maximum 1 MW at dcv set at 1.1 kV. The voltage of DC link capacitor (
dcv ) is set to extract maximum power from PV panel using maximum power point tracking (MPPT) control[11]. In this paper, dcv is set to 1.1 kV. The irradiation level (S) and cell temperature (T) considered are 700 W/m2 and 300K, respectively.
Fig. 2. Relationship between dc-link voltage and output power of a PV
array. DC link capacitor voltage dynamics can be given by power
balance equation as (4).
DCPVdc PP
dtdvC −=
2
2 (4)
where, DCP is the power transferred from capacitor to voltage source converter (VSC). VSC feeds the power into the grid by converting the dc-signal into an appropriate ac-signal. If P is the power supplied to the grid, the expression for
DCP can be given as (5).
LOSSDC PPP += (5)
where, LOSSP is the power loss in VSC and interface impedance (R + j X). It is obvious from, (4) and (5) that any disturbance in P will ultimately induces oscillations in dcv , which must settle to dcrefv determined by MPPT.
B. Power Factor Control In Fig. 1, relationship of active power (P) and reactive
power (Q) with voltages and currents in d- and q- axis reference can be given as (6).
( )( )⎪⎩
⎪⎨⎧
−=
+=
QSDDSQ
QSQDSD
ivivQ
ivivP
23
23
(6)
where, SDv and SQv are the d- and q- axis components of PV terminal voltage. Similarly, Di and Qi are d- and q- axis components of PV current into the distribution network.

3
9
12
10
17
22
13
18
23
25
28
33 41 38
29
34
30
35
27
3
5
49 39 26 11 19 20
6 15
16
21
8
100
24
3132
36 37
4
1 250
51
UTIL
G1 G2
G3PV
Fig. 5. Single line diagram of a case distribution system[14].
In this paper, PV is desired to operate in power factor
control mode. Since, SDv and SQv are determined by distribution network, power factor control can be achieved by independent control of Di and Qi . For a given network condition, PV power factor can be set to desired value by appropriate values of currents, i.e. Drefi and Qrefi . Then, Di and Qi can be controlled to follow Drefi and Qrefi by using proportional and integral (PI) controllers as shown in Figs. 3 and 4. The outputs of the controllers, i.e. Dm and Qm are control parameters of VSC.
sTK
D
D
+1Drefi
Di−+ Dm
Fig. 3. d- axis current controller.
sTK
Q
Q
+1Qrefi
Qi−+ Qm
Fig. 4. q-axis current controller.
III. SMALL SIGNAL STABILITY OF DISTRIBUTION SYSTEM
A. Description of Distribution System The distribution system under study is shown in Fig. 5. This
is a 43-bus distribution network with total load of 21MW and 8 MVAR [14]. The system is connected to external utility grid through Bus 100. The system is supplied by two synchronous generators (G1 and G2) located at buses 50 and 4, respectively. In this paper, a squirrel cage induction generator
(SCIG) is added as a source (G3) of wind power at bus 5. Similarly, VSC based photovoltaic generator (PV) is added at bus 10 as a source of solar power. The capacity and operating modes of the generators are summarized in Table I.
TABLE I
SUMMARY OF GENERATORS OF CASE DISTRIBUTION SYSTEM
Generator Generation(MW) Mode of operation Power
factor G1 5 Power factor control 1 G2 9 Terminal Voltage Control - G3 5 Reactive power consumption - PV 1 Power factor control 1
Synchronous generators are modeled by considering
dynamics of rotor flux and rotor inertia [8]. Exciter and governor models are also included in the synchronous generator model. Similarly, wind generator is modeled by considering the dynamics of rotor flux and rotor inertia[15]. The reactive power required by wind generator is partially supplied by a shunt capacitor installed at the generator terminal. Rating of the shunt capacitor is taken to be one-fourth of the active power generated by wind generator. PV is modeled by considering dynamics of dc-link and d-axis and q-axis current controllers as discussed in Section II. Now, using the models of the generators, controllers and distribution network, small signal stability can be assessed by eigenvalue analysis.
B. Oscillatory Modes A distribution network with DG units and their controllers
can be represented by sets of differential and algebraic equations (DAEs). If x is a set of dynamic variables and y is a set of algebraic variables, then DAEs can be written as (7) [7].

4
( )( )⎩
⎨⎧
==
yxgyxfx
,0,&
(7)
The differential and algebraic equations (DAEs) of (7) can be linearized and rearranged at an operating point ),( oo yx as (8).
⎥⎦
⎤⎢⎣
⎡ΔΔ
⎥⎥⎦
⎤
⎢⎢⎣
⎡=⎥
⎦
⎤⎢⎣
⎡ΔYX
gg
ffX
yx
yx
0
& (8)
where ox Xff |/ ∂∂= , oy Yff |/ ∂∂= , ox Xgg |/ ∂∂= , and oy Ygg |/ ∂∂= . If yg is a non singular matrix, (6) can be reduced as (9).
XAX Δ=Δ & (9) where )( 1
xyyx ggffA −−= represents the system state matrix
of the distribution system.
The system is stable, if all the eigenvalues of A have negative real part. Eigenvalues of the test distribution system are plotted in Fig. 6. Since all the eigenvalues lie on left half of the complex plane, the system is asymptotically stable.
Fig. 6. Eigenvalues of the distribution system.
The complex eigenvalues represent the oscillatory modes of
the system. The dynamic characteristics of the system depend on the damping ratio and frequency of the oscillatory modes. Lower values of damping ratio for any oscillatory modes are undesirable for the stability of a power system. In this paper, threshold value of damping ratio for any oscillatory modes is taken as 5% to ensure the oscillatory stability of a system [3].
There are four oscillatory modes which are summarized in Table II.
TABLE II OSCILLATORY MODES OF DISTRIBUTION SYSTEM
Mode Eigenvalues Damping
Ratio (%) Frequency
(Hz) 1 -7.6 ± j 25.7 28.3 4.2 2 -5.6 ± j19.2 28.2 3.2 3 -8.8 ± j19.6 41.0 3.4 4 -0.15 ± j5.7 2.74 0.9
It can be observed that oscillatory modes 1, 2 and 3 have
frequencies of around 3 to 4 Hz and well damped. However,
mode 4 has lower values of frequencies and damping. Lower damping ratio of a low frequency mode is unacceptable for secure operation of a power system [3]. Hence, mode 4 is a critical mode of the system in terms of stability.
The relationship among oscillatory modes and state variables of the system can be observed by evaluating the participation factors (PFs) of each state on a particular mode. For a particular mode, a generator and its state variables, which have the largest values of participation factors is identified as dominant generator for that mode. The participation of thk state in the thi eigenmode may be given by (10).
ikkikip ψφ= (10) where,
kiφ : thk entry of right eigenvector iφ
ikψ : thk entry of left eigenvector iψ The modes, their dominant generators and corresponding
dominant state variables are shown in Table III.
TABLE III DOMINANT GENERATORS OF OSCILLATORY MODES
Mode Dominant
generator Dominant
states Participation
factor
1 G2 Rotor angle 0.56
Speed deviation 0.56
2 G1 Rotor angle 0.58
Speed deviation 0.58
3 G3 d-axis rotor flux 0.73
Rotor speed 0.67
4 G2 d-axis rotor flux 0.48
Exciter 0.50
It can be observed that G2 is the dominant generator for the critical mode. Critical mode is associated with the excitation system of G2. This suggests that the damping of critical mode may be improved by controlling the excitation system of G2. Alternatively, a controller can be installed at any bus of the distribution network to enhance the damping. In this paper, a PV generator installed at the network has been proposed to be controlled to enhance the damping of critical mode.
IV. IMPACT OF PV ON CRITICAL MODE
A. Participation Factor The impact of PV on system oscillatory modes can be
observed by evaluating participation factors of PV state variables on oscillatory modes of the system. In this paper, three state variables of PV system, i.e. Di , Qi and dcv have been considered. The participation factors of PV state variables were evaluated by using (10). The results are shown in Fig. 7. It can be observed that participation factors of PV states on system oscillatory modes are very small. This suggests that an additional dynamic controller is required for a PV system to effectively damp low frequency oscillation of a distribution system. Among the three state variables of PV, dc-link voltage ( dcv ) has the least participations on the system modes. The participation factor of Qi on critical mode (Mode
-250 -200 -150 -100 -50 0 50-30
-20
-10
0
10
20
30
Real Axis
Imag
inar
y A
xis
Eigenvalue Plot

5
4) is larger than Di . This suggests that Qi may be more effective than Di to control damping of critical mode. This is elaborated with more results in Section V.
iD
vdciQ
0
0.00005
0.0001
0.00015
0.0002
Mode 1 Mode 2 Mode 3Mode 4
Part
icip
atio
n Fa
ctor
Fig. 7. Participation factors of PV states on oscillatory modes.
B. Eigenvalue Sensitivity Since PV can supply power at various power factors,
different values of active and reactive powers generated have different impacts on oscillatory modes. The impact on system modes may be measured by eigenvalue sensitivity. In this paper, eigenvalue sensitivity with respect to active and reactive power perturbations has been taken as a sensitivity index. If PVS denotes active or reactive power supplied by PV, then eigenvalue sensitivity of a mode iλ with respect to perturbations in PVS is given by (11).
iTi
iPV
Ti
PV
i SA
S φψ
φψλ
.
⎟⎟⎠
⎞⎜⎜⎝
⎛∂∂
=∂∂ (11)
Vectors iφ and iψ are right and left eigenvectors, respectively as defined in (10). Eigenvalue sensitivity may be computed either by an analytical approach or by a numerical approach [7]. In a numerical approach, sensitivity may be computed by evaluating two eigenvalues at PVS and slightly perturbed value PVPV SS Δ+ . The sensitivities of the critical mode with active and reactive powers calculated numerically are shown in Fig. 8.
0
0.0005
0.001
0.0015
0.002
0.0025
50% Load Full Load 50% Overload
Sens
itivi
ty o
f cri
tical
mod
e
δλ/δPδλ/δQ
Fig. 8. Sensitivities of critical mode with active and reactive power output of PV at different loading of distribution system.
The sensitivities are calculated at 50% loading, full loading
and 50% overloading of the distribution system. It can be observed that the critical mode is more sensitive with
perturbation of reactive power than active power in all cases of distribution system loading conditions. Hence, PV reactive power control is more effective for critical mode damping as compared to active power control. This suggests that reactive power supply from PV is better for damping of critical mode.
Existing standards suggest the unity power factor operation of a PV system in a distribution system [16],[17]. However, future development may allow reactive power support from a PV system utilizing advanced features of inverters[18]. Reactive power support is sometimes beneficial to damping of low frequency oscillations as demonstrated in Section IV-C.
C. Time Domain Analysis The impact of PV power factor on oscillation damping was
observed through time domain analysis. PV was operated in different power factors and corresponding impact on time domain behavior was observed. A disturbance was imposed to the steady state system by applying a three phase fault at bus number 3. The fault duration was assumed to be 90 ms. The voltage across PV terminal was observed. The result is shown in Fig. 9.
0.780.830.880.930.981.031.081.13
0 2 4 6 8 10
PV te
rmin
al v
olta
ge (p
.u.)
Time (sec)
Power factor = 1Power factor = 0.8
Fig. 9. Response of PV terminal voltage against fault at bus 3.
It can be observed that system is slightly better damped when PV supplies power at 0.8 power factor as compared to unity power factor. This shows that reactive power control can be utilized to damp the system oscillations. However, operating PV at different power factors slightly improves the damping, which may not be sufficient to achieve desired damping of critical modes. Hence, additional controller for PV may be required to achieve desired damping of critical mode. This will be discussed in the following sections.
V. DESIGN OF FEEDBACK CONTROLLER In this section, a design procedure of an additional
controller for PV power factor for system oscillation damping is presented. The first step towards the controller design is selection of the most appropriate control signals.
A. Selection of Control Signals A state space formulation of the distribution system with
control input and output is given as (12).
⎩⎨⎧
Δ+Δ=ΔΔ+Δ=Δ
UDXCYUBXAX& (12)
Now, controllability factor of mode i from thj input is given by (13).

6
jiij Bw ψ= (13)
where, iψ is thi left eigenvector. The input signal is modulated by a controller to achieve desired response of the system. Similarly, observability factor of mode i from thk output is given by (14).
ikik Cv φ= (14)
where, iφ is the thi right eigenvector. The output is used as a signal for feedback controller. Now, residues of thi mode with respect to thj input when thk output is used at feedback signal can be given as (15)[7].
ikijijk vwR = (15) Residue has been used as an index for selection of control signals. The combination of signals giving the highest magnitude of residue was selected for input modulation signal and feedback signal for controller.
In this paper, two local signals i.e. deviations of PV terminal voltage magnitude (ΔV ) and angle (Δδ ) were taken as possible signals for feedback controller. The outputs of the controller are used to modulate the reference signals, i.e.
Drefi and Qrefi . The residues of critical mode, when Drefi is modulated is shown in Fig. 10.
00.0010.0020.0030.0040.0050.0060.007
50% load Full load 50% Overload
Res
idue
s of c
ritic
al m
ode
Modulating iDref
∆V∆δ
Fig. 10. Residues of system when d-axis current of PV is modulated.
It can be observed that using ΔV as feedback signal gives
larger values of residues at full load and at 50% overload of distribution system. However, Δδ as feedback signal gives larger value of residue at 50% load of the distribution system. Hence, the controller designed for full load using ΔV as feedback signal may not be effective at 50% load of the distribution system.
Similarly, the residues of critical mode when Qrefi is modulated is shown in Fig. 11.
00.020.040.060.080.1
0.120.14
50% Load Full Load 50% Overload
Res
idue
s of c
ritic
al m
ode
Modulating iQref
∆V∆δ
Fig. 11. Residues of system when q-axis current of PV is modulated.
It can be observed that ΔV has larger magnitude of residues than Δδ in different loading conditions of the distribution system. Hence, ΔV is an appropriate feedback signal for a controller when Qrefi is modulated.
It is obvious from (6) that power factor control can be achieved by modulating either Drefi or Qrefi . Hence, the input signal which gives larger values of residues when ΔV or Δδ is used as feedback signal can be used as input modulating signal. It can be observed from Figs. 10 and 11 that using
Qrefi as modulating signal gives larger values of residues in all the cases. Hence, Qrefi has been used as modulating signal.
B. Controller Design We can design a lead lag compensator to place a mode at a
desired location at negative half of s - plane. The standard form of compensator design is given as (16) [8].
m
sTsT
sTsTKsKH ⎥
⎦
⎤⎢⎣
⎡++
+=
2
1
11
1)( (16)
where, )arg(180 ijk
o R−=φ (17)
)(sin1)(sin1
1
2
mm
TT
φφα
−−== (18)
αωi
T 11 = (19)
12 TT α= (20) Here, T is the washout time constant, which is usually
taken as 5 – 10 sec, iω is the frequency of the mode in rad/sec and K is the positive constant gain. φ is the amount of phase compensation required and m is the number of compensation stages. The angle compensated by each stage should not exceed 60 degree.
A controller was designed for modulating Qrefi to improve damping of critical mode. The calculated values of constants of the controller are given in Table IV.
TABLE IV
PARAMETERS OF THE POWER FACTOR CONTROLLER
φ (degree) m
α (degree)
T1 (seconds)
T2 (seconds)
102.8° 2 7.02° 1.78 0.22 The gain of the controller (K) was obtained by using root-
locus technique. The trace of ζ with K is shown in Fig. 12. Here, K was gradually increased from zero until the desired damping ratio of the critical mode was obtained. It can be observed from Fig. 12 that ζ can be increased by increasing the value of K. When K equals to zero, ζ has the initial value of 2.74%. Similarly, K equals 0.38 makes ζ equals to 10%. In this paper, K is set at 0.14 to make ζ equals to 5%.

7
0.020.030.040.050.060.070.080.090.1
0 0.1 0.2 0.3 0.4
Dam
ping
ratio
of c
ritic
al
mod
e(ζ)
Gain (K)
0.14
Fig. 12. Variation of damping ratio of critical mode with controller gain.
C. Effectiveness of the Controller The effectiveness of the controller was evaluated by
observing the damping ratios before and after installing the controller for PV. The results are shown in Fig. 13.
00.05
0.10.15
0.20.25
0.30.35
0.40.45
Mode 1 Mode 2 Mode 3 Mode 4
Dam
ping
ratio
(ζ) With Controller
Without Controller
Fig. 13. Comparison of damping ratios with and without controller.
It can be observed that the supplementary controller effectively improves damping ratio of critical modes to the targeted value of 5%. The damping ratios of other modes are unaffected.
The impact of controller on time domain response of the system was observed. A three phase fault was applied at bus 3. The fault was cleared after 90 ms. The responses of voltage at Bus 10 with and without controller are shown in Fig. 14. It can be observed that the controller effectively improves damping of low frequency oscillations in a distribution system.
0.78
0.83
0.88
0.93
0.98
1.03
1.08
1.13
0 2 4 6 8 10
Vol
tage
of B
us 1
0 (p
.u.)
Time (Sec)
Without Controller With Controller
Fig. 14. Comparison of time domain responses of voltage at Bus 10 with and without controller.
Similarly, time domain response of dc-link voltage of PV was observed under similar disturbance scenario. The result is shown in Fig. 15. It can be observed that oscillation in dc-link voltage is better damped by the controller.
0.99
0.995
1
1.005
1.01
0 2 4 6 8 10
DC
link
vol
tage
(p.u
.)
Time (Sec)
Without ControllerWith Controller
Fig. 15. Comparison of time domain responses of dc-link voltage with and without controller.
VI. CONCLUSION In this paper, small signal stability analysis of a renewable
energy based electricity distribution system has been presented. The modeling approaches for different DG units have been discussed briefly. A PV system has been modeled using DC-link dynamics and dynamics of d-axis and q-axis components of output currents. A controller for PV generator has been proposed for enhancing the damping of a low damped critical mode. Eigenvalue analysis for linearized system was used for assessment of small signal stability and design of a controller for a PV generator. The effectiveness of the controller was evaluated both by eigenvalue analysis and time domain simulation to justify the proposed control methodology.
The paper demonstrates that q-axis component of PV current participates more effectively on critical mode as compared to the d-axis component. In different loading conditions of the distribution system, q-axis component of PV current has been found to be a better modulating signal to be utilized for designing an additional damping controller.
Next, critical mode was better damped when there is reactive power support from a PV generator in a distribution system. Hence, operating PV at lower factor than unity has better impact on damping of critical mode. In different loading conditions of distribution system, the critical mode has higher sensitivity with respect to reactive power of PV as compared to the active power. So, reactive power control of PV seems to be better for damping of low damped excitation modes.
Finally, the additional controller has been found to be able to improve the damping of the critical mode effectively by shifting the eigenvalues at desired location. Also, a desired damping ratio can be achieved by selecting an appropriate value of controller gain. The controller is found to affect only the critical mode while the other modes are unaffected.
VII. REFERENCES [1] N. Jenkins, R. Allan, P. Crossley, D. S. Kirschen, and G. Strbac,
Embedded Generations, 1st ed. London, U.K., 2000. [2] A. Ipakchi and F. Albuyeh, "Grid of the future," IEEE Power and
Energy Magazine, vol. 7, pp. 52-62, 2009.

8
[3] Australian Energy Market Operator (AEMO), "National Electricity Amendment (Technical Standards for Wind Generation and other Generator Connections) Rule 2007," 2007.
[4] S. M. Muyeen, R. Takahashi, T. Murata, and J. Tamura, "A Variable Speed Wind Turbine Control Strategy to Meet Wind Farm Grid Code Requirements," IEEE Transactions on Power Systems vol. 25, pp. 331-340.
[5] S. Dahal, N. Mithulananthan, and T. Saha, "Investigation of small signal stability of a renewable energy based electricity distribution system," in Proceedings of IEEE Power and Energy Society General Meeting, 2010 pp. 1-8.
[6] N. Mithulananthan, C. A. Canizares, and J. Reeve, "Tuning, performance and interactions of PSS and FACTS controllers," in Proceedings of IEEE Power Engineering Society Summer Meeting, 2002, pp. 981-987 vol.2.
[7] G. J. Rogers, Power System Oscillations. Boston/London/Dordrecht: Kluwer Acadamic Publishers, 2000.
[8] P. Kundur, "Power System Stability and Control," Electric Power Research Institute.
[9] F. Katiraei, M. R. Iravani, and P. W. Lehn, "Micro-grid autonomous operation during and subsequent to islanding process," IEEE Transactions on Power Delivery, vol. 20, pp. 248-257, 2005.
[10] A. Yazdani and P. P. Dash, "A Control Methodology and Characterization of Dynamics for a Photovoltaic (PV) System Interfaced With a Distribution Network," IEEE Transactions on Power Delivery, vol. 24, pp. 1538-1551, 2009.
[11] T. Yun Tiam, D. S. Kirschen, and N. Jenkins, "A model of PV generation suitable for stability analysis," IEEE Transactions on Energy Conversion vol. 19, pp. 748-755, 2004.
[12] R. Shah, N. Mithulananthan, A. Sode-Yome, and K. Y. Lee, "Impact of large-scale PV penetration on power system oscillatory stability," in Proceedings of IEEE Power and Energy Society General Meeting, 2010 pp. 1-7.
[13] L. Dong-Jing and W. Li, "Small-Signal Stability Analysis of an Autonomous Hybrid Renewable Energy Power Generation/Energy Storage System Part I: Time-Domain Simulations," IEEE Transactions on Energy Conversion, vol. 23, pp. 311-320, 2008.
[14] "IEEE Recommended Practice for Industrial and Commercial Power Systems Analysis," IEEE Std 399-1997, p. I, 1998.
[15] V. Akhmatov, Induction Generators for Wind Power: Multi-Science Publishing Company Ltd, 2005.
[16] E. Liu and J. Bebic, "Distribution System Voltage Performance Analysis for High-Penetration Photovoltaics," NREL/SR-581-42298; Other: ADC-7-77032-01; TRN: US200809%%556, 2008.
[17] "IEEE Recommended Practice for Utility Interface of Photovoltaic (PV) Systems," IEEE Std 929-2000, 2000.
[18] F. Delfino, R. Procopio, M. Rossi, and G. Ronda, "Integration of large-size photovoltaic systems into the distribution grids: a p-q chart approach to assess reactive support capability," IET Renewable Power Generation, vol. 4, pp. 329-340.
VIII. BIOGRAPHIES
Sudarshan Dahal (S’09) was born in Nepal. He received Bachelor’s degree in Electrical Engineering in 2003 from Tribhuvan University, Nepal and Masters in Engineering in 2008 from Tokyo Institute of Technology, Japan. He has worked as an electrical engineer at Nepal Electricity Authority from 2004 to 2006. Currently, he is working towards his PhD in School of Information Technology and Electrical Engineering, The University of Queensland,
Australia. His research interests include dynamic stability and control, distributed generations and load modeling.
Nadarajah Mithulananthan (M’02) received his Ph.D. from University of Waterloo, Canada in Electrical and Computer Engineering in 2002. His B.Sc. (Eng.) and M. Eng. Degrees are from the University of Peradeniya, Sri Lanka, and the Asian Institute of Technology, Bangkok, Thailand, in May 1993 and August 1997, respectively. He has worked as an electrical engineer at the Generation Planning Branch of the Ceylon electricity Board, and as a
researcher at Chulalongkorn University, Bangkok, Thailand. Dr. Mithulan is currently a senior lecture at the University of Queensland
(UQ), Brisbane, Australia. Prior to joining UQ he was associate Professor at Asian Institute of Technology, Bangkok, Thailand. His research interests are integration of renewable energy in power systems and power system stability and dynamics.
Tapan Kumar Saha (M’93, SM’97) was born in Bangladesh in 1959 and immigrated to Australia in 1989. He received B.Sc.Eng. Degree in 1982 from Bangladesh University of Engineering & Technology, Dhaka, Bangladesh, M.Tech. in 1985 from the Indian Institute of Technology, New Delhi, India and PhD in 1994 from the University of Queensland, Brisbane, Australia. Tapan is currently a Professor in Electrical Engineering in the School of Information Technology and Electrical Engineering, University of Queensland, Australia. Previously he
has had visiting appointments for a semester at both the Royal Institute of Technology (KTH), Stockholm, Sweden and at the University of Newcastle (Australia). He is a Fellow of the Institution of Engineers, Australia. His research interests include condition monitoring of electrical plants, power systems and power quality.

1
Abstract— In recent years, the penetration level of renewable
based Distributed Energy Resource units (DER) with varying
sizes has increased significantly. System standards that have been
developed to accommodate the DER units demand small size of
DER units to operate with constant power factor mode and large
size of DER units in voltage control mode. The constant power
factor operational mode of small scale DER units results in
exposing them to the problem of slow voltage recovery. This
paper proposes an index and a methodology for placement of
shunt FACTS controllers to improve the voltage recovery at all
buses of interest. The case studies involving two different IEEE
test systems validate the proposed Index and methodology.
Index Terms— Distributed Energy Resources, sensitivity index,
STATCOM, voltage recovery.
I. INTRODUCTION
n recent years several environmental and economic benefits
and policies have led to increased penetration of intermittent
Distributed Energy Resource (DER) units into the electricity
grid. System operators have addressed the issue of increased
penetration by specifying the grid integration requirements at a
Point of Common Coupling (PCC). The independent power
producers are placing fast and slow acting reactive power
controllers at PCC to meet grid requirements. The static
reactive power controllers maintain a steady state voltage
profile while dynamic reactive controllers are more effective in
maintaining the voltage profile during sub-transient/transient
conditions. For example, in the case of a large wind farm
system, a placement of STATCOM at PCC improves its Low
Voltage Ride Through (LVRT) capability [1].
A comprehensive literature review of the placement of
STATCOM and other reactive power compensation systems
suggests that the present studies and methods are focused
towards large DER unit based systems and their integration,
especially to fulfill voltage related grid interconnection
requirements under all operating conditions [2], [3], [4], [5].
The voltage related issues reach a new dimension when small
scale DER units in an area tend to increase. The grid codes and
This work was supported by the CSIRO Intelligent Grid Flagship
Collaboration Research Fund. Tareq Aziz ([email protected]),
U.P.Mhaskar ([email protected]), T. K. Saha ([email protected])
and N. Mithulananthan ([email protected]) are with the School of
Information Technology and Electrical Engineering, The University of
Queensland, Qld 4072, Australia.
standards address these issues by requesting DER units below
a certain size to operate with constant power factor control
mode and request them to trip if abnormal conditions persists
for more than a stipulated period [6]. This not only affects the
uptime of small scale DER unit but also reduces the maximum
utilization of renewable energy resources in the system. The
problems mentioned can be alleviated by choosing an
appropriate location and type of reactive power controller in
such a manner that results in cost effective quick recovery of a
voltage at all nodes of interest. This paper addresses the issues
mentioned above in two steps. The first step develops a
sensitivity index that utilizes the characteristic and essential
variables (current and voltage) of Voltage Source Converter
(VSC) based series and shunt FACTS controllers. The second
step develops a method that utilizes that sensitivity index along
with an optimization procedure and time domain simulation to
find out the location of shunt reactive power controllers. The
paper is organized as follows:
Section II gives a brief introduction to the available grid
interconnection requirements for the DER unit. Section III
describes the detail methodology proposed to improve the
voltage profile in pre-fault and post-fault scenarios. Section IV
presents and compares the results obtained towards the
improvement in DER unit uptime. Section V describes the
conclusions and contributions of the work.
II. GRID INTERCONNECTION REQUIREMENTS
Grid interconnection standards specify the required behaviour
of renewable and non-renewable independent power plants at
PCC under all operating conditions. Generally, they deal with
the following issues of power system control [6],[7],[8]:
1. Steady state voltage and reactive power control;
2. Steady state frequency and active power control;
3. Response to abnormal voltage;
4. Voltage flicker and harmonics;
5. Data exchange with system operator.
A. Reactive power generation capability
In order to ensure increased real power generation in the
system and for ease of control, different grid codes around the
world limit the usage of reactive power capability of DER unit
to a minimum level. For example, IEEE std. 1547-2003 does
not allow a DER unit to regulate voltage at point of common
coupling actively [6]. Federal Electric Regulatory Commission
An Index and Grid Compatible Methodology
for Reactive Power Compensation in Renewable
Based Distribution System T. Aziz, Student Member, IEEE U. P. Mhaskar, T. K. Saha, Senior Member, IEEE and
N. Mithulananthan, Senior Member, IEEE
I

2
(FERC), USA, specify power factor at a point of common
coupling as 0.95 leading to 0.95 lagging for large wind parks
as found from system impact studies [7]. In Australia,
Australian Electricity Market Operator (AEMO) request
distributed generation with a capacity of less than 30MW to
maintain a power factor between 1 to 0.95 leading for both
100% and 50% real power generation [8].
B. Steady state voltage: continuous operation range
Steady state voltage level at each node is one of the most
important parameters for the quality of supply. In general, it is
expected that voltage of a node remains within the range of
±10% of nominal value irrespective of the presence of DER
units in the network [8].
C. Response of DER unit to abnormal voltage
IEEE and other standards request DER units of below a
certain size to cease energizing during abnormal system
conditions according to the clearing time shown in Table I [6].
TABLE I
DER UNIT RESPONSE TO ABNORMAL VOLTAGE [6]
Voltage Range (p.u.) Clearing time (sec)
V < 0.5 0.16
0.5 ≤ V < 0.88 2.00
1.1 < V < 1.2 1.00
V ≥ 1.2 0.16
The clearing time listed in Table I is a maximum threshold
for DER units with a capacity of 30 kW or less. For DER units
with generation capacity greater than 30 kW, the listed
clearing time is a default value though this can vary amongst
the utilities.
D. Voltage flicker and harmonics
IEEE and IEC standards request DER units to maintain the
harmonics injected and flicker level below optimal value [6].
The issue of slow voltage recovery demands more attention
above all mentioned requirements to improve the uptime and
hence renewable energy penetration/utilization. The next
section describes the sensitivity index and methodology
developed to alleviate this problem.
III. SENSITIVITY INDEX AND FORMULATION OF METHODOLOGY
FOR SHUNT REACTIVE POWER CONTROLLERS
Based on the literature review and analysis of grid
interconnection requirements, a new sensitivity index and a
methodology are proposed to improve the uptime of small
scale DER units. The following section describes detailed
derivation of index and methodology.
A. Formulation of sensitivity Index for VSC based series and
shunt FACTS controller
For incorporation of VSC based FACTS controllers in voltage
stability studies the following issues are important:
1) Formulation of Equations:
Choice of controllable variables (Node voltage
and angle in conventional tools)
Choice of output variables (shunt, real and
reactive power injections and/or current
injected)
2) Methods of Solution:
Stability assessment using P-V curve.
Time domain simulation representing load
dynamics, control strategy for excursion in
voltage at nodes of interest.
The above choices are dictated by the basic operating
characteristics, response time, control capability of the devices
and intended duration of a study [9]. The indices and
methodologies use power balance equations to carry out the
analysis. However, for a system with large dispersed DER
units, a fault may trigger a delayed voltage recovery in a
system, tripping DER units in a few seconds. The VSC based
series and shunt FACTS controllers inject real and reactive
components of voltage/current independent of a node
voltage/line current within a few milliseconds. Thus, for the
studies intended (placement and sizing of VSC based reactive
power controllers); the power system along with VSC based
FACTS controllers need different representation.
Fig.1. Branch with series FACTS controllers.
List of symbols
Xsh State of a shunt connected system;
V node voltage magnitude;
ush Damping controller input for shunt connected
controller;
user Damping controller input for series connected
controller;
Ish magnitude of current injected by shunt FACTS
controller;
Xser State of series connected system;
Ө Phase angle of voltage at node;
β Phase angle of current flowing in a branch;
I Magnitude of current flowing in a branch;
IR Injected shunt reactive current;
VR Series injected voltage in quadrature with line- current;
Psh Shunt injected real power;
Pser Series injected real power;
Qsh Shunt injected reactive power;
Qser Series injected reactive power;
|Yij| Magnitude of element in Ynode matrix, connected
between i and j node;
θij Angle of element in Ynode matrix, connected between ith
and jth
node;
nj Set of nodes connected to node j where series FACTS
controller are not connected;
rj Set of branches connected to node j where series
FACTS controllers are connected;
P Node incident matrix connected ith
FACTS controller
with jth
node (Pt is a transpose of P matrix).

3
The set of governing eqns. for a power system with series
connected VSC based FACTS controller (see Fig. 1) is as
follows: .
( , , )sh sh shshX f X V u (1)
.
( , , )ser ser ser serX f X I u (2)
sh node
t
brbr
I Y P V
P ZV I
.
(3)
Utilizing the variables such as injected series real power,
reactive voltage and shunt real power and reactive current and
rearranging those results in eqn. 4-5.
ser p j j i i
R ser j j i i
P V I V Icos( ) VIcos( )
V (Q / I) V Isin( ) VIsin( ) (4)
j
sh j j i ij j i ij j l j l
i nj l rj
sh j
R i ij j i ij j l j l
i nj l rjj
P V V | Y | cos( ) V I cos( )
QI V | Y | sin( ) V I sin( )
V
(5)
For sensitivity analysis, linearising eqns. 4-5 around the
operating point, we have:
sh 11 12 13 14
R 21 22 23 24
31 32 33 34ser
41 42 43 44R
P A A A A
I A A A A V
A A A AP
A A A A IV
(6)
Where, elements of various sub-matrices in eqn. 6 are as
follows:
i i i i
i i i i
i i i
sh sh sh sh
11 12 13 14
j j j j
R R R R
21 22 23 24
j j j j
ser ser ser
31 32 33 34
j j j
P P P PA (i, j) ,A (i, j) ,A (i, j) ,A (i, j)
V I
I I I IA (i, j) ,A (i, j) ,A (i, j) ,A (i, j)
V I
P P PA (i, j) ,A (i, j) ,A (i, j) ,A (i
V
i
i i i i
ser
j
R R R R
41 42 43 44
j j j j
P, j)
I
V V V VA (i, j) ,A (i, j) ,A (i, j) ,A (i, j) .
V I
Considering the power system with only shunt VSC based
FACTS controllers, we have:
sh RA P B I (7)
sh RV C P D I
Simplification of set of eqns. (7) results in the expression of
sensitivity as in eqn. 9.
1
1
22 21 11 12
R
VA A [A A ]
I (8)
The next section describes the algorithm that utilizes RΔV/ΔI as
a sensitivity index to find out the best location for a shunt
dynamic reactive power controller along with placement of a
capacitor bank in a distribution system to alleviate the slow
voltage recovery problems.
B. Methodology for placement of shunt reactive power
controller
The major steps followed to secure the voltage profile
throughout the system for all operating conditions steady state
and transient are depicted in Fig. 2. Inclusion of a DER unit
results in reduction of real power intake from the utility grid.
This approach converts the test system to a weak
interconnected micro-grid. Using “Tabu-search” based multi-
objective optimization; functions like grid loss and placement
of static reactive power compensation are optimized; eqn. 10
describes the cost function utilized [10]. I L
i i loss.j j
i=1 j=1
MinF= C q +K× P ×T (9)
Steady state voltage requirement (at generator and load
terminals) is set as constraints for the optimization problem.
In eqn. 10, L and I represent the number of load levels and
candidate locations to install the capacitors. iq is a set of fixed
capacitors for optimal solution, jq is the control scheme
vector at load level j whose components are discrete variables.
Investment cost associated with a capacitor installed at
location i is given byi iC q . Power loss at a load level j with
time duration jT is given by
loss jP ×T and K stands for electricity
price. With application of various faults in the system, time
domain simulations were carried out to check dynamic voltage
restoring capability at the generator and load bus.
Fig.2. Flow chart for determination of reactive power controller location.
The placement of STATCOM is considered only when a static
compensator (capacitor bank) fails to maintain the voltage
profile as required by the system operator. For the placement
of STATCOM, the proposed sensitivity RΔV/ΔI along with its
direction is used to find out the single best location amongst
the optimal capacitor nodes. The node having the highest
inductive RΔV/ΔI indicates the necessity of STATCOM at that
node. Replacing the optimal capacitor on that node by
STATCOM, a voltage recovery time is obtained with the help
of time domain simulation for the generator as well as load
node. The procedure is repeated till the voltage excursion of
all nodes concerned falls within the boundary specified by

4
standard/grid code. Performance of RΔV/ΔI is compared with
an existing sensitivity index ΔV/ΔQ .
IV. RESULTS AND ANALYSIS
A. Test distribution systems
To test the effectiveness of the proposed methodology, two
distribution test systems with different configurations and load
compositions are considered in this work. All studies reported
are carried out using DigSILENT [11]. The first test
distribution system consists of 16 buses as shown in Fig. 3.
Total load in the system is 28.7MW and 9.48MVAr,
respectively. This system is treated as a commercial feeder for
the intended study. The second system has been obtained from
[12], with 21.76MW and 9MVAr of real and reactive power
load as shown in Fig. 4. This system is treated as an industrial
feeder for the intended study.
Fig.3. Single line diagram: 16 bus test system.
B. Load composition and load curves
This study considers practical scenarios of load
composition as they have a profound impact on voltage at
various nodes. The breakdown typically used by the utilities
for commercial and industrial feeders have been shown in
Table II [13]. Here, motors with power ratings greater than
100 hp have been treated as large motors, which are principal
loads in an industrial feeder. A commercial feeder is
dominated (51%) by small motors representing air
conditioners. This breakdown of loads is utilized for static
load modeling of both feeders.
TABLE II TYPICAL LOAD COMPOSITION [13]
Load type Load composition
Commercial feeder (16 node system)
Industrial feeder (43 node system)
Resistive 14 5
Small motor 51 20
Large motor 0 56
Discharge lighting 35 19
For each type of feeder, the customer load has its typical daily
load curve (DLC) set [14]. Pavg/Pmax found from these DLC
sets is presented in Table III and has been used in this work.
C. Distributed generator and its size
DER units considered in this study are conventional
synchronous generators (this is mainly due to rotor angle
stability issues) with unity power factor operation. The DER
unit connection details for both systems have been shown in
Table IV at base load condition. The location of DER units in
the 16 node system are chosen randomly at node 3 and node 6,
whereas for the 43 node system locations is maintained as
given by the system data.
Fig.4. Single line diagram: 43 bus test system.
TABLE III
PEAK LOAD DATA [14]
Load type Load composition
Commercial feeder (16 node system)
Industrial feeder (43 node system)
Pavg/Pmax 0.68 0.61
Peak load (MW) 42.72 28.82
TABLE IV
DISTRIBUTED GENERATION: CAPACITY AND LOCATION
Distributed generation
Commercial feeder (16 node system)
Industrial feeder (43 node system)
DER unit 1
DER unit 2
DER unit 1
DER unit 2
Location node 3 6 4 50
MVA rating 10 19.58 20 20
Power factor 1 1 1 1
D. Optimal capacitor placement and sensitivity Index values
As described in section III-B, „Tabu search‟ technique has
been used to find out the proper location of a fixed
compensator in the system at peak load conditions followed
from Table III. The number of candidate nodes has been
chosen to 50% with an objective function of minimizing grid
loss with minimum available capacitor banks. Voltage limits
at generator as well as load node have been set to 0.90 p.u. to
1.1 p.u. according to steady state voltage operating range in
[6]. Table V summarizes the results for optimal capacitor
places for the 16 node system whereas Table VI shows the
optimal capacitor places for the 43 node test system. For the
16 node system, placing capacitors of 10.2 MVAr reduces the
grid loss significantly from 1.20 MW to 0.90 MW (see Table
V) and helps in maintaining the voltage profile within steady
state limit.
TABLE V
OPTIMAL CAPACITOR SOLUTION FOR 16 BUS SYSTEM
Optimal
Node
Capacitor size
(MVAr)
Sensitivity index
V / Q
(Vpu/MVAr)
RV / I
(Vp.u/Ip.u.)
7 3.6 0.0069 -0.1428 (Inductive)
5 1.8 0.0038 0.0769 (Capacitive)
11 1.8 0.0034 0.0667 (Capacitive)
15 1.8 0.0049 0.1 (Capacitive)
3 1.2 0.0048 0.11 (Capacitive)

5
In the 43 node system, with inclusion of 11.20 MVAr of
fixed capacitor bank, has improved voltage profile but
marginal reduction in grid loss from 0.54 MW to 0.45 MW has
been obtained. TABLE VI
OPTIMAL CAPACITOR SOLUTION FOR 43 BUS SYSTEM
Optimal
Node
Capacitor size
(MVAr)
Sensitivity index
V / Q
(Vp.u./MVAr) RV / I
(Vp.u/Ip.u.)
49 0.6 0.044 0.20 (Capacitive)
29 0.6 0.046 0.25 (Capacitive)
21 0.6 0.088 0.33 (Capacitive)
51 0.6 0.046 0.2 (Capacitive)
41 0.6 0.048 0.2 (Capacitive)
25 0.6 0.006 0.03 (Capacitive)
30 0.6 0.047 0.25 (Capacitive)
39 1.1 0.044 -0.25 (Inductive)
17 1.1 0.055 0.25 (Capacitive)
35 1.2 0.049 0.2 (Capacitive)
18 1.2 0.048 0.2 (Capacitive)
37 1.2 0.068 0.33 (Capacitive)
33 1.2 0.049 0.25 (Capacitive)
E. Voltage recovery and STATCOM placement
According to [6], voltage at DER units must come back to
90% of their normal operating voltage within 2 sec after
initiation of abnormal condition. For the verification of
dynamic voltage restoring capability using STATCOM for
generator and load nodes, a portion of static loads is converted
to dynamic motor loads according to the percentages as given
in Table II. Tables V and VI contain sensitivity values ΔV/ΔQ
and RΔV/ΔI at the optimal compensation nodes, which
minimizes iterations to find best node for dynamic
compensation. These values are calculated numerically with
small perturbations. To check the voltage profile under
abnormal conditions, both systems are subjected to a three
phase fault (with a fault reactance of 0.05 Ω) near the
generator node and the fault is cleared after 12 cycles. The
following test cases were investigated to find out possible
solutions for supporting the above requirements:
Case 1: Without capacitor;
Case 2: With capacitor at optimal locations;
Case 3: Replacing capacitor with STATCOM at a node with
highest V / Q ;
Case 4: Replacing capacitor with STATCOM at a node with
highest RV / I (For both inductive and capacitive values).
During the simulation studies, STATCOM is equipped with a
voltage controller [15]. Figs. 5 to 7 show the time domain
simulation for the 16 node system at peak load condition. Figs.
5 and 6 show excursions in voltage at nodes 3 and 6 (which are
DG nodes) respectively with fault at node 5. Load terminal
voltage profile is plotted for the fault at node 5 in Fig. 7. A
STATCOM is placed at node 7 and node 3 alternately to find
the effect of placement on voltage recovery time and also to
investigate effectiveness of sensitivity indices
V / Q andRV / I respectively. As shown in Fig. 5
without capacitors, the system fails to reach the required
voltage due to three phase fault contingency. For generator
node 3, capacitors at optimal places with optimal sizes help to
recover the node voltage within 1.15sec. STATCOM at node 7
reduces the restoring time significantly to only 0.26 sec. It is
interesting to find that, though node 3 is a DER unit node,
placing STATCOM on node 3 results in a longer recovery
time (1.26 sec) than that on node 7. Table VII summarizes the
voltage recovery time for both generator nodes of the 16 node
system. As simulation results for the 16 node system under
peak load condition does not reflect any problem of slow
recovery of voltage of DER unit nodes, base case is not
considered. Time domain simulations for the 43 node system is
plotted with two cases- base load and peak load. Simulation is
carried out for all four cases mentioned earlier. Figs. 8 and 9
show the simulation results for generator node voltages with a
three phase fault at node 31 at base load condition. Sensitivity
indices, V / Q and RV / I (Capacitive), both have their
highest value at node 21. RV / I (Inductive) is found only
at node 39 with a value of 0.25 (V p.u. /IR p.u.) as shown
in Table VI.
Fig.5. Voltage at bus 3 of 16 bus test at peak load conditions.
TABLE VII VOLTAGE RECOVERY TIME FOR 16 BUS SYSTEM -PEAK LOAD
DER unit node Without
capacitors
With
capacitors
With
STATCOM
at node 3
With
STATCOM
at node 7
3 (DER unit 1) N/A 1.15 sec 1.26 sec 0.26 sec
6 (DER unit 2) N/A 1.59 sec 1.97 sec 1.26 sec
Table VIII summarizes the voltage recovery time at base
loading, which shows that other than STATCOM at node 39,
no controller arrangement can support grid requirement at
node 4 as they have a recovery time greater than 2sec. For
node 50, recovery time is found to be less than 2sec in all
arrangements considered. Figs. 10 and 11 show the simulation
results with a three phase fault at node 31 at peak load
condition. Table IX summarizes the voltage recovery times at
peak load. It shows that placement of STATCOM on node 39
results in reduced voltage recovery time supporting grid
requirement whereas the other arrangements fail to meet the
standard. Analyzing the voltage recovery time from all three
Tables VII-IX, it can be concluded that STATCOM should be
placed at a node with the highest inductive RV / I to

6
support voltage recovery requirement of DER units in the
system. Also, it is important to note that SVC behaves as a
fixed capacitor or variable inductor as compared to
STATCOM, hence when needed the reactive power supplied
by the SVC is a strong function of voltage of a terminal to
which it is connected [16].
TABLE VIII
VOLTAGE RECOVERY TIME FOR 43 BUS SYSTEM -BASE LOAD
DER unit node Without
Capacitor
s
With
Capacitor
s
With
STATCOM
at node 21
With
STATCOM
at node 39
4 (DER unit 1) 3.12 sec 2.35 sec 2.49 sec 1.61 sec
50 (DER unit 2) 0.71 sec 0.54 sec 0.42 sec 0.37 sec
For a small radial system like the 16 node system, it has
been found that STATCOM is not even necessary to support
voltage recovery, though wrong placement of STATCOM
leads to longer recovery time.
Fig.6. Voltage at bus 6 of 16 bus system at peak load conditions.
Fig.7. Voltage at bus 5 of 16 bus system at peak load conditions.
But for the 43 node system with large mesh configuration,
STATCOM is required at both base and peak loading
condition to support voltage recovery. Further tuning of
control parameters of STATCOM can result in reduction of
voltage recovery time. Figs. 12 and 13 show excursion in
generator rotor angle as a function of placement of
STATCOM and capacitors. From Figs. 12-13 it can be
concluded that the fast recovery of voltage not only leads to
improvement in voltage profile at all concerned nodes but also
allows in utilizing inherent damping capability of the power
system.
Fig.8. Voltage at bus 4 of 43 bus system at base load conditions.
Fig.9. Voltage at bus number 50 of 43 bus system at base load conditions.
Fig.10. Voltage at bus 4 of 43 bus system at peak load conditions.
TABLE IX VOLTAGE RECOVERY TIME FOR 43 BUS SYSTEM –PEAK LOAD
DER unit node Without
Capacitor
s
With
Capacitor
s
With
STATCOM
at node 21
With
STATCOM
at node 39
4 (DER unit 1) 2.95 sec 2.10 sec 2.24 sec 1.67 sec
50 (DER unit 2) 0.60 Sec 0.42 Sec 0.39 Sec 0.30 Sec
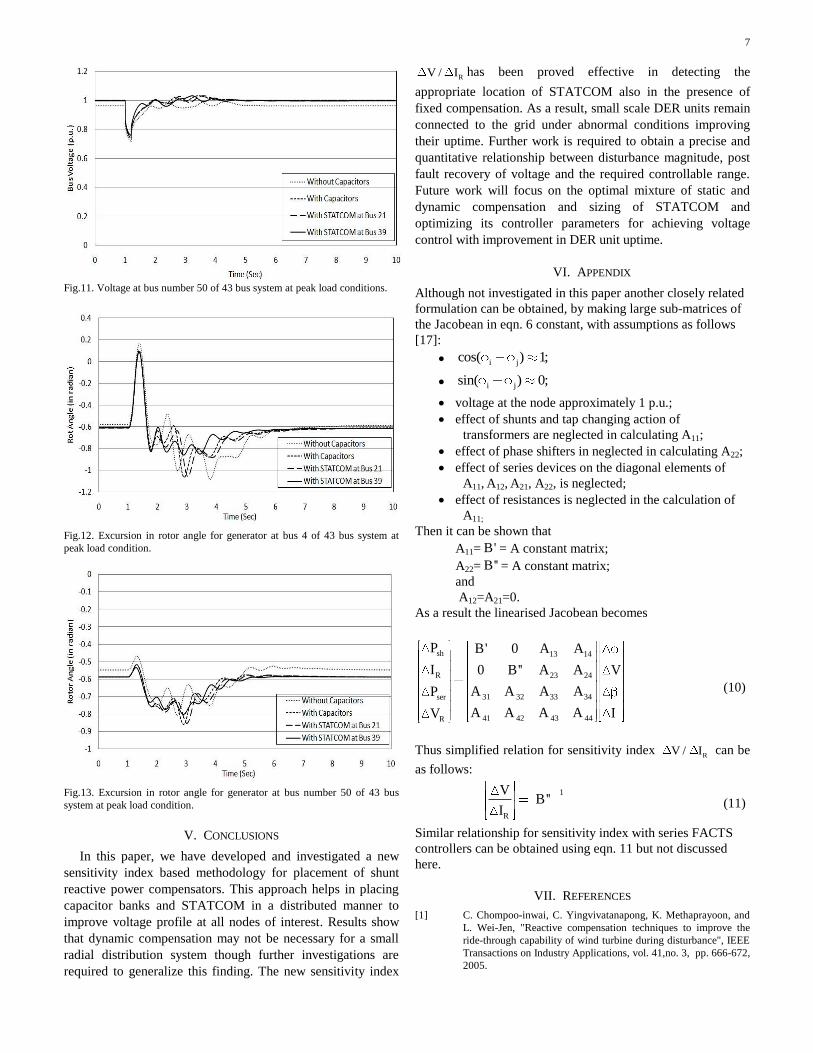
7
Fig.11. Voltage at bus number 50 of 43 bus system at peak load conditions.
Fig.12. Excursion in rotor angle for generator at bus 4 of 43 bus system at
peak load condition.
Fig.13. Excursion in rotor angle for generator at bus number 50 of 43 bus
system at peak load condition.
V. CONCLUSIONS
In this paper, we have developed and investigated a new
sensitivity index based methodology for placement of shunt
reactive power compensators. This approach helps in placing
capacitor banks and STATCOM in a distributed manner to
improve voltage profile at all nodes of interest. Results show
that dynamic compensation may not be necessary for a small
radial distribution system though further investigations are
required to generalize this finding. The new sensitivity index
RV / I has been proved effective in detecting the
appropriate location of STATCOM also in the presence of
fixed compensation. As a result, small scale DER units remain
connected to the grid under abnormal conditions improving
their uptime. Further work is required to obtain a precise and
quantitative relationship between disturbance magnitude, post
fault recovery of voltage and the required controllable range.
Future work will focus on the optimal mixture of static and
dynamic compensation and sizing of STATCOM and
optimizing its controller parameters for achieving voltage
control with improvement in DER unit uptime.
VI. APPENDIX
Although not investigated in this paper another closely related
formulation can be obtained, by making large sub-matrices of
the Jacobean in eqn. 6 constant, with assumptions as follows
[17]:
i jcos( ) 1;
i jsin( ) 0;
voltage at the node approximately 1 p.u.;
effect of shunts and tap changing action of
transformers are neglected in calculating A11;
effect of phase shifters in neglected in calculating A22;
effect of series devices on the diagonal elements of
A11, A12, A21, A22, is neglected;
effect of resistances is neglected in the calculation of
A11;
Then it can be shown that
A11= B' = A constant matrix;
A22= B'' = A constant matrix;
and
A12=A21=0.
As a result the linearised Jacobean becomes
sh 13 14
R 23 24
31 32 33 34ser
41 42 43 44R
P B' 0 A A
I 0 B'' A A V
A A A AP
A A A A IV
(10)
Thus simplified relation for sensitivity index RV / I can be
as follows:
1
R
VB''
I (11)
Similar relationship for sensitivity index with series FACTS
controllers can be obtained using eqn. 11 but not discussed
here.
VII. REFERENCES
[1] C. Chompoo-inwai, C. Yingvivatanapong, K. Methaprayoon, and
L. Wei-Jen, "Reactive compensation techniques to improve the
ride-through capability of wind turbine during disturbance", IEEE
Transactions on Industry Applications, vol. 41,no. 3, pp. 666-672,
2005.

8
[2] R. Caldon, S. Spelta, V. Prandoni and R. Turri, "Co-ordinated
voltage regulation in distribution networks with embedded
generation," 18th International Conference and Exhibition on
Electricity Distribution, pp. 1-4, 2005.
[3] F. A. Viawan and D. Karlsson, "Voltage and Reactive power
control in systems with synchronous machine-based distributed
generation", IEEE Transactions on Power Delivery, vol. 23, no. 2,
pp. 1079-1087, 2008.
[4] S. Foster, L. Xu, and B. Fox, "Coordinated reactive power control
for facilitating fault ride through of doubly fed induction
generator- and fixed speed induction generator-based wind farms",
IET, Renewable Power Generation, vol. 4,no. 2 , pp. 128-138,
2010.
[5] A. Keane, L. F. Ochoa, E. Vittal, C. J. Dent, and G. P. Harrison,
"Enhanced utilization of voltage control resources with distributed
generation," IEEE Transactions on Power Systems, 2010.
[6] "IEEE Standard for Interconnecting Distributed Resources with
Electric Power Systems," IEEE std. 1547-2003, 2003.
[7] Federal Energy Regulatory Commission (FERC), "Interconnection
for Wind Energy” Issued June 2, 2005.
[8] A. E. M. Commission, "National Electricity Amendment
(Technical Standards for wind and other generators connections)
Rule 2007", 8 March, 2007, www.aemc.gov.au.
[9] M. M. Begovic, A.G. Phadke, "Control of voltage stability using
sensitivity analysis", IEEE Transactions on Power Systems, vol. 7,
no. 1, pp. 114-123, 1992.
[10] H. Yann-Chang, Y. Hong-Tzer, and H. Ching-Lien, "Solving the
capacitor placement problem in a radial distribution system using
Tabu search approach," IEEE Transactions on Power Systems, vol.
11, no. 4, pp. 1868-1873, 1996.
[11] DIgSILENTGmbH, "DIgSILENT PowerFactory V14.0 -User
Manual," DIgSILENT GmbH, 2008.
[12] "IEEE Recommended Practice for Industrial and Commercial
Power Systems Analysis," IEEE Std 399-1997, 1998.
[13] K. Morison, H. Hamadani, and W. Lei, "Load modeling for
voltage stability studies", IEEE Power Systems Conference and
Exposition, pp. 564-568, 2006.
[14] G. Levitin, A. Kalyuzhny, A. Shenkman, and M. Chertkov,
"Optimal capacitor allocation in distribution systems using a
genetic algorithm and a fast energy loss computation technique",
IEEE Transactions on Power Delivery, vol. 15,no.2, pp. 623-628,
2000.
[15] C. Schauder, H. Mehta, "Vector analysis and control of advanced
static VAr compensators", IEE Proceedings C Generation,
Transmission and Distribution, vol. 140,no.4 , pp. 299-306, 1993.
[16] M. Noroozian, N. Anderson, B. Thorvaldson, A. Nilsson, C.
Taylor, "Benefits of SVC and STATCOM for electric utility
application", IEEE Transmission and Distribution Conference and
Exposition, 2003, vol. 3, pp. 1143- 1150, 2003.
[17] O. Alsac, B. Stott, "Fast decoupled load flow," IEEE Transactions
on Power Apparatus and Systems, vol. PAS-93, no.3,pp. 859-869,
May 1974.
VIII. BIOGRAPHIES
Tareq Aziz (M’09) was born in Dhaka,
Bangladesh. He completed his B.Sc. (Engg.) and
M.Sc. (Engg.) in Electrical & Electronic
Engineering both from Bangladesh University of
Engineering & Technology (BUET) in 2002 and
2005 respectively. He worked as a faculty member
in Khulna University of Engineering & Technology
and American International University-Bangladesh.
Currently he is doing his PhD in School of ITEE,
The University of Queensland. His research
interests include renewable energy integration in power system, power system
stability and signal processing.
U. P. Mhaskar is presently working as a post-doctoral fellow at The
University of Queensland. He received his Ph. D. in 2003. His research areas
include control system design, power electronics and drives, renewable energy
and HIL simulation studies.
Tapan Kumar Saha (M‟93, SM‟97) was born in
Bangladesh in 1959 and immigrated to Australia in
1989. He received B.Sc.Eng. Degree in 1982 from
Bangladesh University of Engineering &
Technology, Dhaka, Bangladesh, M.Tech. in 1985
from the Indian Institute of Technology, New Delhi,
India and PhD in 1994 from the University of
Queensland, Brisbane, Australia. Tapan is currently
a Professor in Electrical Engineering in the School
of Information Technology and Electrical
Engineering, University of Queensland, Australia.
Previously he has had visiting appointments for a semester at both the Royal
Institute of Technology (KTH), Stockholm, Sweden and at the University of
Newcastle (Australia). He is a Fellow of the Institution of Engineers,
Australia. His research interests include condition monitoring of electrical
plants, power systems and power quality.
Nadarajah Mithulananthan (M‟02, SM‟10)
received his Ph.D. from University of Waterloo,
Canada in Electrical and Computer Engineering in
2002. His B.Sc. (Eng.) and M. Eng. Degrees are
from the University of Peradeniya, Sri Lanka, and
the Asian Institute of Technology, Bangkok,
Thailand, in May 1993 and August 1997,
respectively. He has worked as an electrical
engineer at the Generation Planning Branch of the
Ceylon electricity Board, and as a researcher at
Chulalongkorn University, Bangkok, Thailand. Dr. Mithulan is currently a
senior lecture at the University of Queensland (UQ), Brisbane, Australia.
Prior to joining UQ he was associate Professor at Asian Institute of
Technology, Bangkok, Thailand. His research interests are integration of
renewable energy in power systems and power system stability and dynamics.