project squid - apps.dtic.mil · o 'project squid technical report mit-50-pu viscosity of...
TRANSCRIPT

o 'PROJECT SQUIDTECHNICAL REPORT MIT-50-PU
VISCOSITY OF NITROGEN, HELIUM,HYDROGEN, AND ARGON FROM -1000 TO 250C
UP TO 150-250 ATMOSPHERES
BYJ. A. GRACKI
BROWN UNIVERSITYPROVIDENCE, RHODE ISLAND
and
G. P. FLYNN AND J. ROSSMASSACHUSETTS INSTITUTE OF TECHNOLOGY
CAMBRIDGE, MASSAC'. JSETTS
PROJECT SQUID HEA')OQUAR-'EREJET PROPULSION CENTER
SCHOOL OF MECHANICAL ENGINEERINGPI)JRDUE UNIVERCITY
LAFAYETTE, INDIANA
MAY 1969
Projell SQUID is a cooperative prugram of basw research relating to Jet Propul-sion. It Is spnsoend by the Office of Naovl Research and is administered byPurdue Univenity through Contract N00014-67-A-0226-0006, NR-098-038.
This document has been approved for public release and sale;its distribution is unlimited.
i 'I
S. ...• =• I,..,

Technical Report MIT-50-PU
PROJECT SQUI D
A COOPERATIVE PROGRAM OF FUNDAMENTAL RESEARCHAS RELATED TO JET PROPULSION
OFFICE OF NAVAL RESEARCH,DEPAITMENT OF THE NAVY
Contract N00014-67-A-0226-0005, NR-098-038
VISCOSITY OF NITROGEN, HELIUM, HYDROGEN, AND ARGON
FROM -lO0 TO 25°C UP TO 150-250 ATMOSPHERES
by
J. A. GrackiBrown University
Providence, Rhode Island
G. P. Flynn and J. RossMassachusetts Institute of Technology
Cambridge, Massachusetts
May 1969
PROJECT SQUID HEADQUARTERSJET PROPULSION CENTER
SCHOOL OF MECHANICAL ENGINEERINGPURDUE UNIVERSITYLAFAYETTE, INDIANA
This document has been approved for public release and sale;its distribution is unlimited.

TABLE OF CONTENTS
Section Page
Abstract. . . . . . . . . . . . . . . . . . . . . . . . . . . 1Introduction ...... ......................... 2
Apparatus and Procedures ......................... 3
Experimental Results ........................... 5
Density Dependence of Viscosities ...... .............. 7
Accuracy ......... ........................... 11
Acknowledgments . . . . ................... 12
References . . . . . . .. . . . . . . . . . . . . . . . . . . 13
Figure Captions .. ... ........ .... . . . . . . 16

Viscosity of Nitrogen, Helium, Hydrogen, and Argon
from -100 to 250C up to 150-250 Atmospheres*
t
J. A. Gracki
Metcalf Chemical Laboratories
Brown University
Providence, Rhode Island
and
G. P. Flynn and J. Ross
Department of Chemistry
Massachusetts Institute of Technology
Cambridge, Massachusetts
The range of a previously developed capillary-flow visccmeter has
been extended to -100°C,and the techniques of obtaining and determining
the attainment of steady state have been improved. The viscosities of
nitrogen, helium, hydrogen, and argon have been measured by an absolute
method from -1000 or -900 to 25°C and up to 150-175 atm (250 atm for N2
at 25 0 C). The accuracy is estimated to be 0.1 - 0.2%, but is scu-ewat
worse for Ar at -1000 C. A number of empirical and theoretical amxyses of
the viscosity-density dependence have been made; while inconclusive, the
evidence tends not to support the presence of a logarithmic term in the
density expansion. Correlations of the second and the third virial
coefficients of viscosity have been made.
1YI

-2-
We report here a series of absolute measurements of the viscosity
of four gases as a function of . ikrrPture and density. The purpose of
this work is to obtain experimental data on this transport property in
regions where such information is unavailable or insufficient; to investi-
gate the temperature dependence of the virial coefficients for the viscosity;
and to provide, if possible, a test of proposed theories on the density
expansion.
We have in previous publications1,2 described our viscometer and given
results for a number of gases at temperatures from -50° to 150 0C. The
present work extends the temperature range to -90 C for N2 and He and to
-100C for H2 and Ar, and repeats the previous measurements at -500 and
250C for more closely spaced values of the density. As before, the upper
pressure limits are in the range 150-175 atm, except for N2 at 25°C, which
we studied to about 250 atm. The precision of the data is better than 0.1%,
and the results should be accurate to 0.1 - 0.2%, with the exception of Ar
at -l00°C (see discussion below).
At the time of publication of Ref. 1, there were hardly arn other
published measurements of the viscosity of gases below 00 C and above 1 atm,
and none of comparable accuracy. This situation has improved in recent years,
especially with Kao and Kobayashi's3 work on N2 emd He from -900 to 50°C and
Diller's4 on p-H2 below 100K, as well as some extensive measurements of much
lesser accuracy mentioned below. However, none of these papers contains
enough low-density data to give good values of the second virial coefficient
of viscosity which is of theoretical interest. 5-9 For this reason the
present measurements have been extended to lower pressures than our previous
work. 1,2

APPARATUS AND PROCEDURES
The apparatus and technique of measurement have been described in
Ref. 1, and only some changes need be noted here; for a more extensive
di3cussion, see Ref. 10. The apparatus is a constant-volume capillary-
flow viscometer, in which an injector at 25°C drives gas at a known flow
rate through a capillary at the experimental temperature, the resulting
pressure difference being determined with a differential manometer.
The only major change is the addition of a fused-quartz precision
pressure gage (Texas Instruments Inc., Houston, Texas) in parallel
with the differential manometer. This instrument registers a pressure
difference by deflection of a quartz Bourdon tube. We had hoped to use it
for absolute measurements, but found that the variation of the index of
refraction of a gas with pressure affects the optical path in the instru-
ment, so that its calibration varies with pressure. We therefore continued
to use the mercury manometer, but made use of the pressure gage to monitor
the approach to steady state.
Steady state is defined here as invariance with time of the pressure
difference across the capillary during a run. Strictly speaking, such steady-
state behavior is impossible in a constant-volume apparatus, since the
ll11pressure difference steadily increases with time; however, we have shown1 0
that this increase is negligible for the dimensions of our apparatus. A
more serious problem is the relaxation of the transient process set in
motion when a run begins: in particular, the rupid imposition of the pressure
difference is an essentially adiabatic process, Droducing a temnerature
difference across the capillary. For most ,of the measurements reported her.-e,
we in f'act observed the aLttainament oi' steady state (constant within c. C.wi

-4-
in. Hg) with the pressure gage as noted above. In addition, a rough but
adequate model of the transient behavior has been derived and approx-
imately confirmed experimentally, to the extent that we believe steady
state to have been reached in virtually all the previous measuremerrts
with this apparatus. (This applies even for injector flow rates up to 0.05
cm3/sec, although we now work only at < 0.03 cm 3/sec.)
Three capillaries were used in the present work, all about 36 cm long
and 0.019 cm in diameter. The last two were calibrated by the electrical-
resistance method, which we have found to be both more convenient and more
precise than the gravimetric method.12 More careful analysis of our previous
techniques with the latter method led us to the conclusion that the
viscosity values in Refs. 1 and 2 should be decreased by about 0.12%. 13
For each capillary the value of the kinetic-cnergr constant m was
determined in the same way as beforel, except that individual runs were
10weighted in accordance with their a priori precision. le again took an
uoper Reynolds-number limit oif 1600, below which we found no correlation
oif' m with Reynolds number or other variables. For the three canillaries
the values of m obtained were 1.199 + 0.013, 1.162 + 0.016, and 1.199 + 0.025;
these values were used to calculate the viscosities in Table I.
-5-
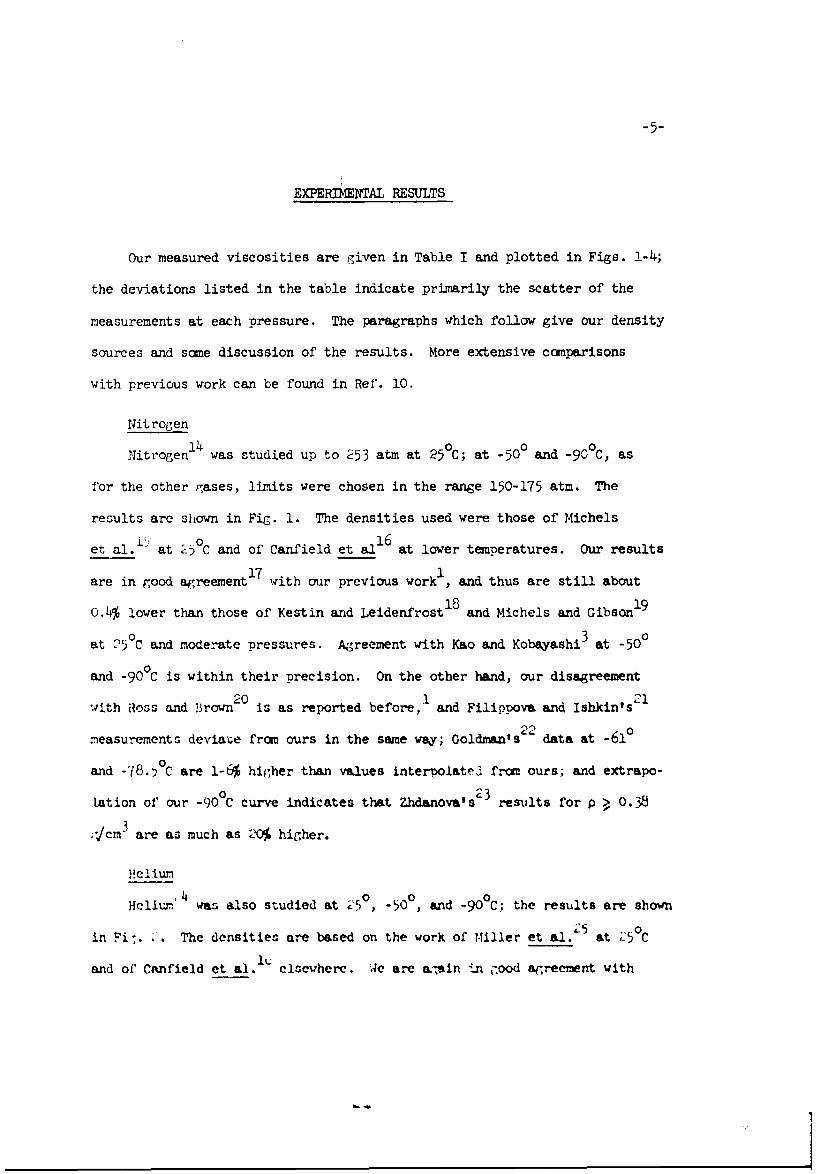
EXPEP0ENTAL RESULTS
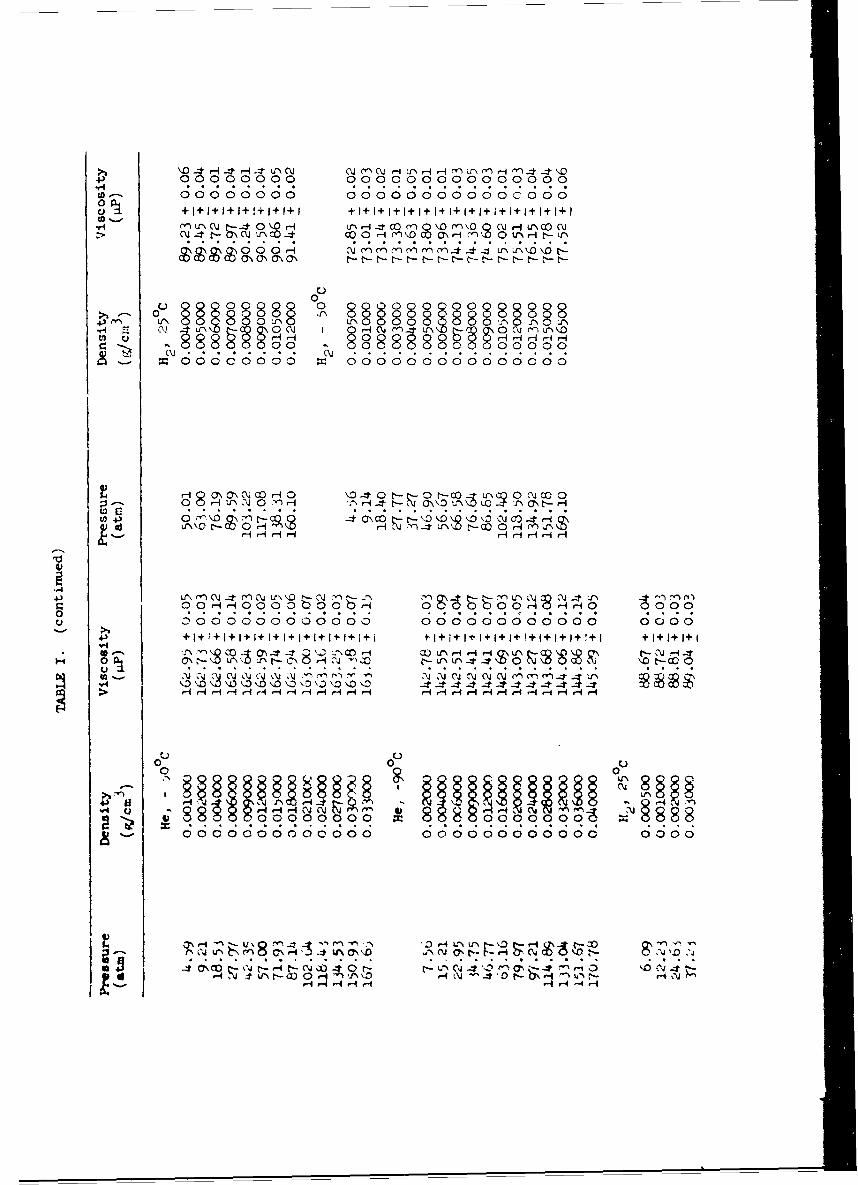
Our measured viscosities are given in Table I and plotted in Figs. 1-4;
the deviations listed in the table indicate primarily the scatter of the
measurements at each pressure. The paragraphs which follow give our density
sources and some discussion of the results. More extensive comparisons
with previous work can be found in Ref. 10.
Nitrogen
Nitrogen14 was studied up to 253 atm at 25°C; at -500 and -90°C, as
for the other gases, limits were chosen in the range 150-175 atm. The
results are shown in Fig. 1. The densities used were those of Michels
et al.i11 at L5°C and of Canfield et al16 at lower temperatures. Our results
are in good agreement17 with our previous work , and thus are still about
0.4% lower than those of Kestin and Leidenfrost18 and Michels and Gibson19
at 250 C and moderate pressures. Agreement with Kao and Kobayashi 3 at -500
and -90 0 C is within their precision. On the other hand, our disagreementBrw20 1 shn's2
wiith Ross and Brown is as reported before, and Filippovs and Ishkin's 21
measurements deviate from ours in the same way; Goldmans22 data at -61O
and '8 0.C are 1-6% higher than values interpolated from ours; and extrapo-
lation of our -90 0 C curve indicates that Zhdanova's2 3 results for p >, 0.38
;V'cm3 are as much as L% higher.
Heliun
Helium,.4 was also studied at 25 , -50 , and -90°C; the results are shown
in 'Fi:. . The densities are based on the work of M4iller et al. at -50C
and of Canfield et al.lu elsewhere. .e are &-,sin in -,ood agreement with

-6-
our previous work1 and about 0.3% lower than the results of Kestin et al.18
around 25°C. At -50' and -90°C, Kao and Kobayashi's3 results average
0.2-0.3% lower than ours. Golubev and Gnezdilov26 obtain viscosities
consistently steeper in the density than all the above work, but closely
resembling those of Ross and Brown 20, which we regard as unreliable. 1
Kestin's results, Kao and Kobayashi's, and our's all tend to confirm the
existence of very shallow minima in t.,e viscosity-density curves.
IHydrogen
Wdrogren27 was studied at 25 , -500, and -100°C; the results are
shorn in Fig. 3. The densities were all taken from Michels et al.28 Agree-
ment with our previous work' was excellent at 250C and fairly good (the
present data averaging slightly higher) at -500C. Near 25°C, Kestin and
Lcidenfrost's18 results are about 1% higher than ours, but the recent work
of Kestin and Yata29 is only about 0.5% higher, being thus in good agree-
ment with Michels, Schipper, and Rintoul.30 There is no other high-precision
work in our lower-temperature range; both Golubev and Shepeleva 31 and
Rudenko and Slyusar obtain results which increase with density somewhat
more rapidly than ours or Michels'.
A-.on3j was also studied at 2.) , -50 , and -100iC; the results are sho.n
in Fi;g. 4. The densities were obtained fran Michels, WiJkew nid 'Wiker " at
25°C, and fron Michels, Levelt, ani de GreaffaI at the loirer termperatures.
Agreement with our earlier workI is aiqain fairly good. As before, at .`50C
and moderate densities ire are about 0.1% below Kestin et &1l6 and 0.20 above
Michels. 3otzen, and Schuurnan. PFilinva ane Ishkin's21 low-temperature
data deviate frtm o•ur., in t.,oc :t.ue way as nr ., u: -•1Xh 0 Icothe;t. requires

-7-
special discussion, which must be postponed until the questions of density
dependence have been considered.
DENSITY DEPENDENCE OF VISCOSITIES
For each isotherm the viscosity was fitted to a least-squares power
series in the density:2
r a + bp + cp + .... (i)
These fits were tried for polynonials of different degrees, the "best"
fit (to all the points of the isotherm) beirZ chosen by a variety of
,7statistical tests;> the constants of the resulting series are listed
in Table I1. The standard deviations (a) of the fits are in each case
well under O.P%, except for N at -90°C and Ar at -100 C (for both of
which the individuea. viscosities also have quite hi,0h deviations), thus
confirminj our estimate of precision (see below).
The "best" fits just described, however, do not necessarily yield
the best values or the virial coefficients, as has been shown by .anley,
N'cCarty, and Senl :e:s. 11hese authors found, by fittirv series to data
subsets of increasim- density rawe, that (for examnle) a ,;ood linear fit
could be obtained u-, to some tLt.it.ir4 density p•, beyond which the data
deviated from linearity, but that good coefficients for a quadratic fit
were ncot ootained bela.t some density anmreciably ;reater than 1ý Most of
our izotherm rzv•es fall in such intermediate re.;ions. *,'e have therefore
carried out such subset fits i'or our data, and the resulting, estir.ates for
the best of" values of a, lb, c are -iven in Taule TIT for N and Ar: the

scatter was t(oo great for satisfactory results by this technique for He
and H2 . The values in Table III should thus be taken as our best estimates
of these virial :oefficicnt7, while those in Table II are best for interpola-
tion over our entire density range.
For h2 and Ar fits we-e also made to the series22
a + bp + P- (ci + ditenp). 2:
which has been proposed on theoretirhal ,-&o.ds.38 In each case1 O the good-
ness of fit was no bet.er k, (usually) slightly worse than for the power
series (1) with an equal number of coefficients. Our work thus offers no
suoport for the logarithznic-term hynothesis, whereas Hanley, McCarty, and
Sengers 9 did find some support in an analysis based primarily on thermal
conductivity data.
In addition to our individual-isotherm fits, further tests were made
of the hypothesis that the residual viscosity is a function of density
only, i.e., thzt
q(T,p) T q(T,0) + Z\Tj(p) . 3)
This is an ..mpirical correlation, the breakdown of which at low temperatures
and high densities has been fairly well established. 4 )23 However, where it
is valid it not only is quite useful for purposes of estimation, but holds
to a remarkable degree of accuracy. Such fits were therefore made, as
described in Ref. 1, for each of the gases studied; the standard deviations
of the "best" fits are O.' 6•iP for N0, 0.14 for He 0.14 for H2 , 1.41 for Ar
(0.46 with -1000C omitted). (See Ref. 10 for the constants in these series
and detailed comparison graphs showingr to what extent the isotherms are in
fact parallel.) Except for Ar, these results are quite consistent
with the validity of Eq. (J) for our gases, within our experimental accuracy.

-9-
The Ar results, however, are problematical. Even the 25 and -500C
results are definitely not parallel within their own precision (the 25 C
data being, parallel to Kestin's and Michels' results), but the discrepancy
here is only of the order of 1 4P. The -100C data, in contrast, dip as
rmuch as 4% below the islues predicted from Eq. (3) and Michels' An(p), then
rise more steeply at higher densities. (It may be significant that the
,reetest discrepancy, nearly 10 uP, is at 0.5 g/cm3 , quite close to the
3. - o0critical density of 0.531 g/cm .) The -50,C deviations, while much smaller,
are in the same direction (as are the previous rcugh results1 at -78.5°C).
As noted above, Eq. (3) is known to fail in the low-temperature liquid-
4,23ýdensity rFz..ge, but the previous evidence indicates that the departure
is in the direction of higher values of tAx)(p), the opposite of what we
observe here; no effect of either kind appears in the present N2 data, at
similar reduced temperatures and densit.es. The poor precision of the -100 0C
data is far too small an effect to account for this discrepancy, and further
low-temperature Ar measurements are clearly desirable.
To return to the individual-isotherm fits, we have reduced the values
of the second virial coefficient of viscosity, b, from Table III for N2
and Ar, Table II for H2 and He for ccmparison with the theories of Kim
and Ross8 and Hoffman and Curtiss.7 The reduced values, b* , are shown
in Fig. 5, along with the tu'o theoretical curves; see Refs. 8 for compar-
ison with several other theoretical models, 5,6,39 none of which fit the
experimental data well. Also shown in Fig. 5 are the values of b from18
the data of Kestin and Leidenfrost, to which the parameters in Kim and Ross's
theory were fitted; the present values are in general higher. but the shape
of the curve remains unchanged.40 The theory cf Kim and Ross seems reasonably

-3.0-
correct, except for its failure to predict the negative values of b for
He; on the other hand, that of Hoffman and Curtiss agrees well with the
He data but fails at lower reduced temperatures. These results can be ex-
plained as due to Kim and Ross taking inadequate account of repulsive
interactions and Hoffman and Curtiss's neglect of orbiting, effects
important at high and low reduced temperatures respectively. The plateau
predicted by Kim and Ross for (l/T*) A 0.3 presumably is related to the
nearly temperature independent residual viscosity discussed above, although
the latter appears to apply even at densities where higher virial coefficients
are dominant.
In connection with the point just made, a correlation of the third
virial coefficient should be useful; to our knowledge, this has not been
attempted before. While no theory for the value of c exists, the appro-
oriate reduction is easily made by dimensional analysis: since we have 8
bn (T*) 6/ a) (4)I T1
(e/m)2
where a and E are Lennard-Jones parameters and T Wk/e, it is clear
that a dimensionless c• should be given by
c (T*) = c (5)
1 (C/m 3)_9
If a is given in A and (E/k) in 0 K, the reduction factor U4 (e/mIfua is given in A•/ and• (-k n 0 ,terdcinfco Ci
equals 54.92 a~ 4E/k M 3) p-cm6 /g 2, where M is the molecular weight.
Values of c1 were therefore obtained from our data as just described
for b n, the results being plotted in Fig. 6. Once again a plateau is
obtained over most of the temperature range.

-11-
ACCURACY
Our previous estimateI of experimental precision was 0.001 in.
Hg in the pressure difference. Although in our low-temperature work we
were frequently restricted (by steady-state considerations) to pressure
differences much less than an inch, the reproducibility of the viscosities
(Table I) remained better than 0.1% in nearly all cases (even for H2 at -1000 C,
where none of the pressure differences exceeded 0.4 in. Hg). The exceptions
to the above statement are of course N2 at -90°C and Ar at -100°C. As
mentioned in the previous section, the standard deviations of our isotherm
least-squares fits are consistent with these estimates of precision. Our
averagwe orecision is thus about 0.05% near room temperature, but becomes
worse than 0.1% at low temperatures and high densities (perhaps due to lack
of thermal equilibrium in the apparatus).
Our accuracy should be somewhat worse than this. For our low-temperature
N2 and He measurements, there is the possibilityl0 of errors larger than
0.1% in the density ratios and thus the viscosities, due to our having
combined densities from two different sources; the single-source H_ and Ar
density ratios should be good to about 0.02%. Combining this with other
knoim sources of error in the calibrations and measurements, we estimate
our accuracy as 0.1 - 0.250.
However, accuracy can be established objectively only by comparison
with other work, and the situation in this respect is unsettled. Our aw ree-
ment with previous work with this apparatus 1 ' 2 is within the limits just
stated, but at -50 0 C there are some apparently systematic discrepancies1 0
at the outer range of these limits. The most precise other work available
1
-12-
for comparison is that of Kestin et al.,18,29 done with oscillating-disc
viscometers, and the discussions above have indicated that our results are
consistently several tenths of a percent lower than Kestints; the possibility
of flaws in the theory of either or both instruments may be worth investigat-
ing. We are in good agreement with Kao and Kobayashi3 for N2 and slightly
higher for He, while our discrepancies with Michels et al.19,30036 are not
consistent (both of these being capillary measurements). There are no
other dense-gas data sufficiently accurate for useful comparison, but it
should be noted that our 1-atm viscosities (based on Table II), except for
He, are consistently an average of about 0.5% lower than the bulk of previous
work l; since we deliberately extended our work to lower densities than
before, this can no longer be attributed to extrapolation error. The weight
of the evidence sulgests the possibility of systematic errors, but is not
sufficiently consistent to be conclusive.
ACKNOWLEDGMENTS
We thank Professors J. Kestin and E. F. Greene for helpful discussions,
and B. Pilz for assistance with some of the measurements.

-13-
References
Supported in part by Project Squid, Office of Naval Research, and
the National •'ience Foundation.
Present address: Pratt and Thitney Aircraft, Div. United Aircraft
Corp., East Hartford, Connecticut.
1. G. P. Flynn, R. V. Hanks, N. A. Lemaire, and J. Ross, J. Chiem. Phys.
38, 154 (1963). For corrections to the data given irn Res. 1-2, see
comments below, especially Ref. 13, or Ref. 10 for more details.
2. A. K. Barua, M. Afzal, G. P. Flynn, and J. Ross, J. Chem. Phys. 41,
374 (1964). In Table V of this paper, b for H2 at 75°C should read
74.6 rather than 7.5.
J. J. T. F. Kao anC R. Kobayashi, J. Chem. Phys. 47, 2836 (1967).
4. D. E. Diller, J. Chem. Phys. 42, 2089 (1965).
>. D. E. Stogryn and J. 0. Hirschfelder, J. Chem. Mrs. 31, 1545 (1959);
33, 94c (1960).
6. R. F. Snider and C. F. Curtiss, Phys. Fluids 1, 122 (1958);
C. F. Curtiss, M. B. McElroy, and D. K. Hoffman, Int. J. Eng. Sci.3, ':69 (1965).
7. D. K Hoffman and C. F. Curtiss, Thys. Fluids 8, 890 (1965).
8. S. K. Kim and J. Ross, J. Chem. Phys. 4,-, 263 (1965); S. K. Kim,G. P. Flynn, and J. Ross, ibid. 43, 4166 (1965).
9. H. J. M Hanley, R. D. McCarty, and J. V. Senders, J. Chem. Pbys.
50, 857 (1969).
10. J. A. (, racki, Ph.D. thesis, Brown University, 1969.
11. K. R. Van Dore'n, R. A. Guereca, H. P. Richardson, and D. Cummins,
(2 articles submitteC to J. Appl. Mech.)

12. For these methods, see J. F. Swindells, J. R. Coe, Jr., and T. B.
Godfrey, J. Res. Nat. Bur. Stand. (u.s.) 48, 1 (1952).
13. In addition, the measurements reported at -50'C in Refs. 1 and 2 were
actually made at -49.90 C, so that these values should be corrected by
an additional amount. The correction is in most cases onLly slightly
pressure-dependent, and averages -0.05 jiP for H2 , -0.071 for D2, -0.11
for He, -0.12 for N2 and CO, -0.17 for Ar, and -0.19 for Ne; for CH4
(near its critical temperature) the pressure variation is too great
for accurate estimation of the correction.
14. Purity 99.998%, from Air Reduction Co.
15. A. Michels, R. J. Lunbeck, and G. J. Wolkers, Physics 1(, 801 (1951).
16. F. B. Canfield, T. W. Leland, and R. Kobayashi, J. Chem. Eng. Data
10, 92 (1965). These densities (for both N_ and He) differ appreciably
fran those used in Ref. 1. For reduction of our earlier data to the same
basis as the present data, see Ref. 10; the values thus obtained are used
in Figs. 1-2 and in the discussion of ccmparative results belc,.
17. "Good agreement" with our previous work, for all the ,;ases in this
paper, means agreement within the combined postulated limits ofaccuracy (see section "Accuracy" below), after correctionl3,1 6 of
the earlier data.
18. J. Kestin and W. Leidenfrost, Physica 25, 1.033 (1959); see also several
more recent papers by Kestin et al., primarily devoted to mixtures at
20 0- 300 C.
19. P.Michels and R. 0. Gibson, Proc. Roy. Soc. (London) A134, 28F (1931).
20. J. F. Rose and G. M. Brown, Id. Eng. Chem. 4, ý026 (1957).
21. G. P. Filippova and I. P. Ishkin, Inzh.-Fiz. Zh., Akad. Nauk Belorus.
SSR 4, 105 (1961).
22. K. Goldman, faysica 2, 499 (1963).
23. N. F. Zhdanova, Zh. Ekap. Teor. Fiz. 3l, 14 (1956); Soy. Phys.-JB'rP
4i, 19 (1957).
-15-
24. Purity 99.995%, from Matheson Co.
25. J. E. Miller, L. '. Brandt, and L. Stroud, U. S. Bur. Mines, Rep.-
Invest., No. 5845 (1961).
26. J. F. Golubev and N. E. Gnezdilov, Gazov. Prom. 10, (12), 38 (1965).
27. Purity 99.95%, from Matheson Co.
28. A. Michels, W. de Graaff, J. Wassenaar, J. M. H. Levelt, and P. Louwerse,
Physica 25, 25 (1959).
29. J. Kestin and J. Yata, J. Chem. Phys. 49, 4780 (1968).
30. A. Michels, A. C. J. Schipper, and W. H. Rintoul, Physica 19, 1011 (1953).
31. J. F. Golubev and R. I. Shepeleva, Gazov. Prom. 11 (4), 54 (1966).
3'. N. S. Rudenko and V. P. Slyusar, Ukr. Fiz. Zh. (Russ. Ed.) 13, 917 (1968).
J3. Purity 99.998%, from Matheson Co.
j4. A. Michels, Hub. Wijker, and Hk. Wijker, Physica 15, 627 (1949).
,i. A. Michels, J. M. Levelt, and '. de Graaff, Physica 24, 659 (1958).
3u. A. Michels, A. Botzen, and W. Schuurman, Physica 20, 1141 (1954).
37. A. Michels, J. C. Abels, C. A. Ten Seldam, and W. de Graaff, Physica
co, 3El (1960); K. R. Hall and F. B. Canfield, ibid. 33, 481 (1967).
See Ref. 10 for details of the application to the present data.
36. A recent review of the theory on this subject is given by J. V. Serers,
Boulder Lectures in Theoretical Physics, vol. 9C, Kinetic Theory
(cordon and B3reach, New York, 1967), 335.
39. D. Enskoir, 1,.l. Sv. Vetenskansakad. Handl. (2] 63, No. 4 (1922).
40. A :rath similar to Fig.. ', but inludin, data from many other sources,
is -iven by Hanley, McCarty and Semtters; 9 although their arma1sis of
the data was carried out largely by fitting to Eq. (2), the resulta
apear qualitatively the same.

-16-
FIGURE CAPTIONS
Fig. 1 Viscosity of nitrogen versus density: 0 present results; o Flynn,
Hanks, Lemaire, and Ross (points nearly coinciding with present
data indicated by (P ); X Kao and Kobayashi. 3
Fig. 2 Viscosity of helium versus density: 0 present results; 0 Flynn,
Hanks, Lemaire, and Ross 1 ; > Kao and Kobayashi. 3
Fig. 3 Viscosity of hydrogen versus density: o present results; 0 Barua,
Afzal, Flynn, and Ross2; A Diller. 4
Fig. 4 Viscosity of ar-on versus density: 0 present results; 0 Flynn,
Hanks, Lemaire, and Ross (points nearly coinciding with present
data indicated by (1).
Fig. 5 Comparison of theoretical5,8 and experimental values of b. the
reduced second virial coefficient of viscosity: present data,18
* N2 , M He, I H2, A Ar; Kestin and Leidenfrost, o N2,
0 He, V H2 , A Ar, () 02, e D2 , + Ne, X Kr, * Xe. See
Refs. 8 for the method of calculating b ; the experimental values
for the present data are from Table I! for N2 and Ar, Table III
for He and H2 .
Fig. 6 Values of c. , the reduced third virial coefficient of viscosity,
fron our data: • N2, U He, A H2 , A Ar (fror Table II for N,
and Ar, Table III for He and H,).

0 0 rn H N NrOI~ 00 00000
Hry)\100 _tt J\ t-L. a\ CC C a\H
-) 0L 0000 -7 0 t:C6
4.) 0
00 ~ Y 1 8 8 H00000
Noe rýr'0O ly co C (\ CN - DN\-O Ci;- J UON GN O\ O j r\0 ON
0000 0 OH LH-4 00 OH 'q HH0CHHHJH
H 4HN , 4 -1 C\In JO t'iH rn L
Pý 8i 1ý 10,I,)- I-. t -- ~-(\CA 00 li r - ~cl ýý Il
00 - 0 00000000000.- -1 0 C\- 000000000I, rl)Co l ýN\ 000 00
0 *. .
4. 0000000 000000000000000. . . .. . . . . . .
CD- 00000000 000000000000000
040
-H (n0 U \C N --10 \0H Ul\H _:rco 0n \0 l...................
Cs, 4.00,\ 0 0~ 0NZ O JC) ~ H
4.3 rnO O ~ O Hr 08 0t O ~ H 0 0U\ 8o8 F yýF
o ~00000000808 000000 0 00 0 0
UN , "o CAr I t ' c H r) U's1
H H rHlHHH HH H HH HiHHH HH
00
u00 00;00 00 000000000000 0300 C
1- H ~ VN -- 0-:t- Sr~' S' ý8 R' a 0
to cl ýC

C\ 4H\O. 0i 0 X%~ ý;~\D XN HC!OH ) HHHJ
>1 0000000000000000
+ ItL~Q + ~ c I ~ ~ + ++1111++++1 + lI +Ea -i 0 0 1r -4-r O\C'\ n rdNc (y)-z C Q r) Xr
0 0088
H8 - H H- N\ N.0. NV C-) 44 1-z :
-4crý~-Ner)000000O00000
C) 0 \.~~(70 1- 0 0 -*1.1 0 a\( C~i C\j 1Lr,0\ 0 H @r\ v' H- al\ Hi 01\ Q -i CQ .
P - \,p t - 7t H- -N -4 >- -H - \,.D -4 -\~
C)
u 0~000 0 000000Cý 0 3~00H H8"N- rf2: o
4- r4. +1+1+ IIjIjIII++4III + 1+1+-il+i+1+1+1+1
~-C\ - Js0 u"'\,jr\a\ 0 \0NCIs 3.. . . . . ..
HH-4 .-4 'A "1 -1),- Dcc) H4 *a\Qr'~-I'D z \0-' "I -
.r4 0H H . '
i- 14 A ~' : ' ŽC - 000 -60,06
1 -4' ~-* n''- ~~')H X

C11 8 H _tO NN\D \D 0 -*co N oL\ (J ~CUl\ C~UN-7LC\
co crI Cof __)I I- \1 r\ t- H N f\ _r 0 tr\ 0r4 oor'Hin' 1UIN 0 RN' r e- O\4)O\D O'\ 0'
HHr _4H'-. HHH H H C- Q.J riN C\j N I C\J
C)ý
9,8 o."Ns"\ o
0- 4L- N "
U-\ 00iC N0H~~~~ H HC~O~OO~~

0 0 0 0 H0 0 0 0 0
cl~
I ('
HW+ +1C) +1
0 n r\ CON N'
fn H
4- ON CC) L.'N H 4: V)
00 H C 0 0vl H 0 0 C \ O l--
-s H; H ' O H C6 C6 oH- H H H H-
4!i +!~ ++ +1 4 +4+ + +1
H ~ Nr a0 4- Co \,DN
5 H O, 4: _:t _:t 0\. N1 0 cow ' H H H H 1H H
0 C
o 0 0 0 0; 0; 0 0 0
H ++ +1 + + + +1++ 1+ + I
m- '0 O CC) H 21j H 0'
"0r 0 r - C oj 1 CC) cU'-\ aI.! 46 H C\ 2 -ý
LrN 0 0 UrN 0 0 \ 0 80 8E1 0' NN Lr C~ 8rl cr 8r
H H
L.)

-22-
TABLE III. Best estimates for first three virial coefficients of
viscosity, from fits to subsets of the present data.
a b c
Gas T (PP) (PP-cmB/g) (4P-cm6/g2)
( C)
N2 25 176.96 116.5 633
-50 140.49 111.6 655
-90 117.52 122.7 603
Ar 25 225.17 116.2 359
-50 175.19 103.2 363
-100 137.83 91.0 338

000
0 0 \ \0
o
x F-
0 0)0 0 o OUOOU
x \0 0\x&
0 0 0
0f 0 f)o 0\ N -

x x
X 0 -0
x 1 6
01010 I
I 0 E~i
0 xr
1 0
0 Lx 0
a X 0 0 0 00
xC N 0
N~ N Nq
(dT) A1ilSOOS IA

0
0
00
ot
U HP
00
0 )~
00
1U1 0
• _______.1
0 0 0t0 0 LISO: 1A
LO 0

00
6
L))
to 0o 0 o Er r11 ) ) ~lCo
(dT/) A.I.IO6S-

1.5
v A 0aA
110-
tmrr KIM ANDcliv ROSS0.50
E IS0.0
-- \HOFFMAN AND\ CURTISS
0~-.5-1
I'-1.0
-1.5 I0.0 0.2 0.4 0.6 0.8 1.0 1.2
I/T * r E/kT
FIGURE 5.

3.0
2.5
20
1.5
A
0 .5
0.0 0. 0 . 0. . . .
I/T rek
FIGURE 6.

UNCLASSIFIEDS•., ,,ty C'j• f,.i.•.ation ...... ... . ... _-.
DOCUMENT CONTROL DATA - R & 0.Sr'C,,,tv n01srfII tr o•, t o. 1 itle, hodt of abstii-Ct m:J ,,cjc~r na,4 , 1 ...... I •,. b" c'N ered ethe, , i a,, ' ep. !, !:le.
- i7 1;1 NA 1 1 -4C, A( Try 'T tCo ,•,re ,.aI cci 2. IV# D IC.T I' •. f I I()". Ia S' cc
Project SQUID JKCLASSIFIEDJet Propulsion Center, School of Mechanical Eng'9 _2h QC-- .Purdue University, Lafayette, &rdiana 47907 , f'n'OAD TI7L E
VISCOSITY OF NITROGEN, HELIUM, HYDROGEN, AND ARGON FROM -100* TO'230 C, UP TO
150-250 ATMOSPHERES
IE : tr'T Iv E NO rEs (Tpe of report arnd nclu.ive dates,
_ AJ , Fiw name. middle intil, last name,
J. A. Gracki, G. P. Flynn and John Ross
NtPC)N! OCA'C 110, TO-At NO0 OFPAGCES --- 7 040. I, F~tS
May 1969 28 40_____
. kA(- I G R T NO LN ORIGINAc-ORS REPO RT NUIIIIFIERSI
NOOO14-67-A-0226-0005"t, I - •- %V MIT-SO-PUNR-098-038
0'OT.-.R qEPORý P.0111 IAnv other ,,riu birts that mo h s, is, Ca'his report)
This document has been approved for public release and sale; its distributionis unlimited.
Office of Naval ResearchPower Branch, Code 473
I_ I A ok I, Iii ADept. of the Navy, Washington, D.C. 20360
The range of a previously developed capillary-flow viscometer has been extended
to -100°C. and the techniques of obtaining and determining the attainment ot steady
state have been imoroved. The viscosities of nitrogen, helium, hydrogen, and argon
have been measured by an absolute method from -100° or -90" to 25*C and up to 150-
175 atm (250 atm for N 2 at 25C). The accuracy is estimated to be 0.1 - 0.2%, but is
somewhat worse for Ar at -100"C. A nuffber of empirical and theoretical analyses of
the viscosity-density dependence have been made; while inconclusive. the evidence
tends not to support the presence of a logarithmic term in the density expansion.
Correlations of the second and the third virial coefficients of viscosity have been
made.
DD -'1..1473 I A. F1

Security C1assification'4-
KEY WCPD$ L0INK A LINK 6 LINK C
__0 R L C WIT ROLE MWI ROLE WY
N2 , He, H2 , A-
viscosity-density dependencevirial coefficients
low temperature
high pressure
vi scometer
capillary flow
-.. .6 -", I .
--. .. .* ! t ' ,I ,: .r "- ,r .;4 I*, , ." . •
Best Available Copy
DD, F'°R..1473 (BACK)(PAGE 2) Securlty Classificatlon