project proposal - na u · project proposal by daniel andenmatten, ... implementation of this...
TRANSCRIPT
Project Proposal
By
Daniel Andenmatten, Brandon Hoffman, Nathan Kish,
Chris Simpson, Pengfei Wu
Team 2
Purina Dryer Efficiency
Submitted towards partial fulfillment of the requirements for
Mechanical Engineering Design – Fall 2012
Department of Mechanical Engineering
Northern Arizona University
Flagstaff, AZ 86011
2
Contents
Problem Statement .......................................................................................................................... 3
Introduction ................................................................................................................................. 3
Objectives .................................................................................................................................... 4
Constraints ................................................................................................................................... 4
Criteria Tree ................................................................................................................................ 4
Quality Function Deployment ..................................................................................................... 6
Concept Generation ........................................................................................................................ 8
Concept Selection ......................................................................................................................... 13
Engineering Analysis .................................................................................................................... 16
Current System .......................................................................................................................... 16
Analysis of Steam...................................................................................................................... 17
Natural Gas Conversion ............................................................................................................ 20
Future Tasks .................................................................................................................................. 21
Project Plan ................................................................................................................................... 23
Conclusion .................................................................................................................................... 24
References ..................................................................................................................................... 24
Appendix ....................................................................................................................................... 25
3
Problem Statement
Introduction
Nestlé Purina is one of the top manufactures of pet food in the United States. The
Flagstaff, AZ plant produces about 1,000 tons of pet food each day. When the food is done
cooking it contains 35% moisture content. Therefore, all of the food produced needs to be
properly dried to meet the 11.5% moisture content requirement. This requirement was set forth to
reduce the risk of mold growth due to the build-up of condensation in the bags while cooling. To
dry the food, the Flagstaff plant has five steam powered dryers, each responsible for about 20%.
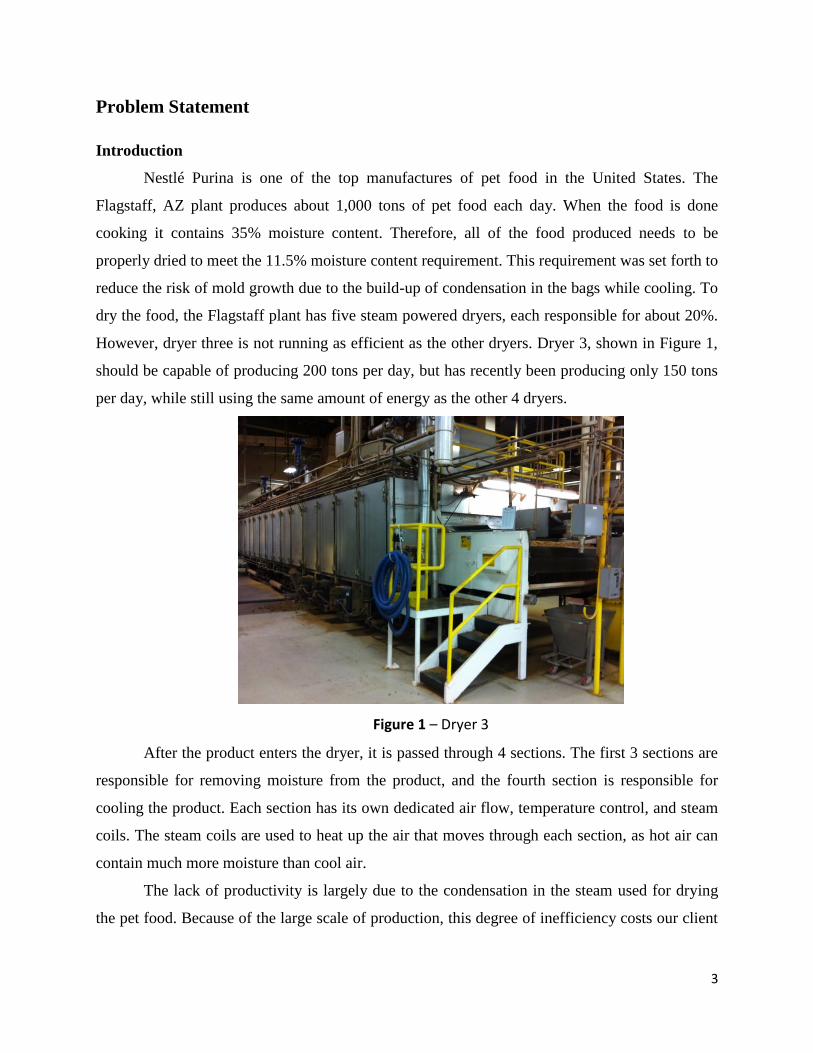
However, dryer three is not running as efficient as the other dryers. Dryer 3, shown in Figure 1,
should be capable of producing 200 tons per day, but has recently been producing only 150 tons
per day, while still using the same amount of energy as the other 4 dryers.
Figure 1 – Dryer 3
After the product enters the dryer, it is passed through 4 sections. The first 3 sections are
responsible for removing moisture from the product, and the fourth section is responsible for
cooling the product. Each section has its own dedicated air flow, temperature control, and steam
coils. The steam coils are used to heat up the air that moves through each section, as hot air can
contain much more moisture than cool air.
The lack of productivity is largely due to the condensation in the steam used for drying
the pet food. Because of the large scale of production, this degree of inefficiency costs our client
4
a large amount of money in terms of unmade product. Our goal is to increase the efficiency and
throughput of dryer 3 for Nestlé Purina.
Objectives
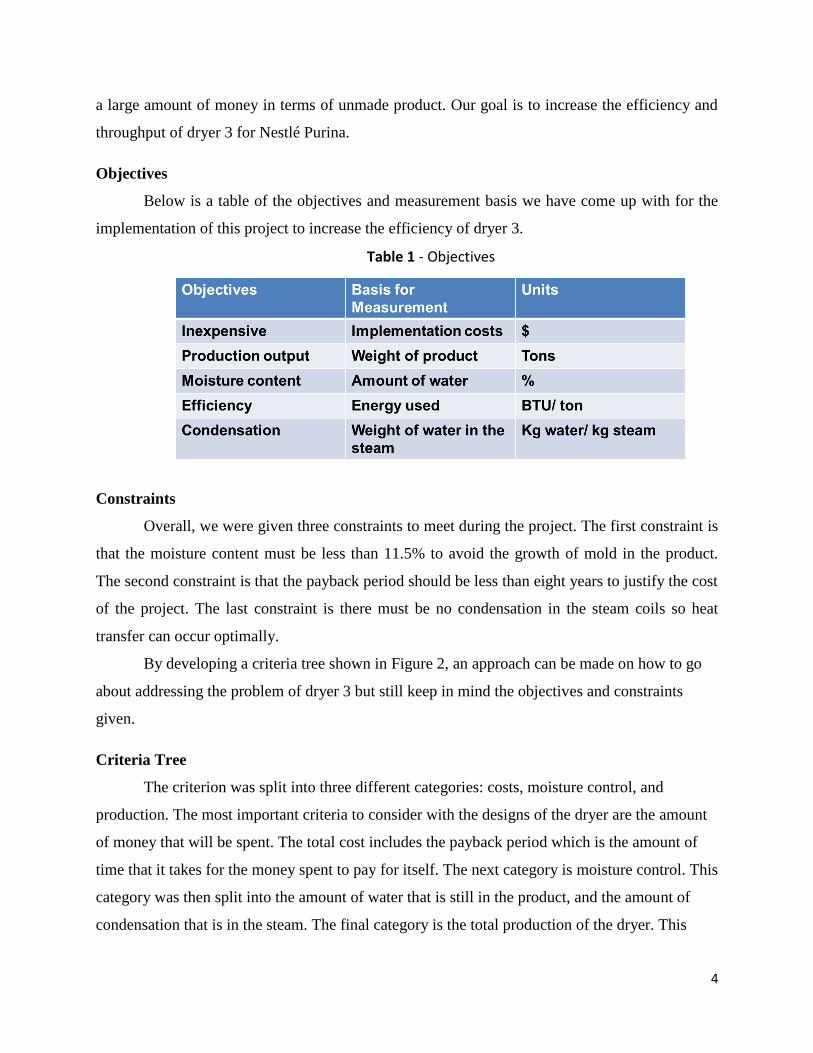
Below is a table of the objectives and measurement basis we have come up with for the
implementation of this project to increase the efficiency of dryer 3.
Table 1 - Objectives
Constraints
Overall, we were given three constraints to meet during the project. The first constraint is
that the moisture content must be less than 11.5% to avoid the growth of mold in the product.
The second constraint is that the payback period should be less than eight years to justify the cost
of the project. The last constraint is there must be no condensation in the steam coils so heat
transfer can occur optimally.
By developing a criteria tree shown in Figure 2, an approach can be made on how to go
about addressing the problem of dryer 3 but still keep in mind the objectives and constraints
given.
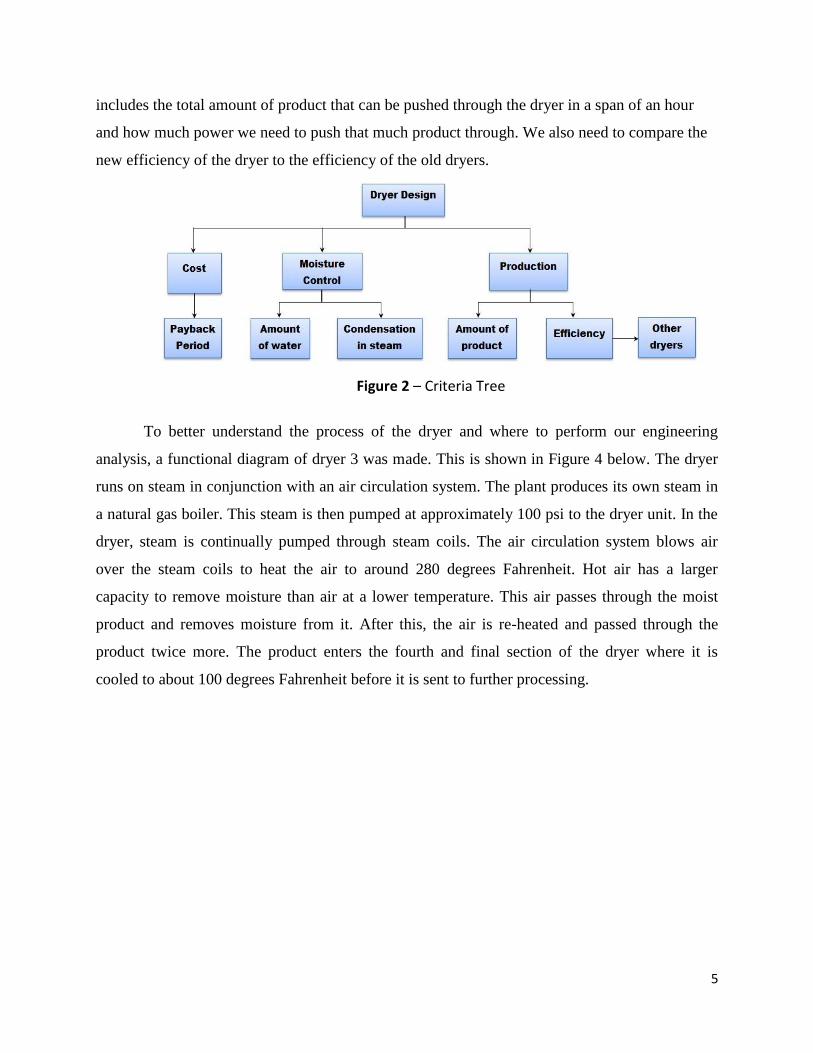
Criteria Tree
The criterion was split into three different categories: costs, moisture control, and
production. The most important criteria to consider with the designs of the dryer are the amount
of money that will be spent. The total cost includes the payback period which is the amount of
time that it takes for the money spent to pay for itself. The next category is moisture control. This
category was then split into the amount of water that is still in the product, and the amount of
condensation that is in the steam. The final category is the total production of the dryer. This
5
includes the total amount of product that can be pushed through the dryer in a span of an hour
and how much power we need to push that much product through. We also need to compare the
new efficiency of the dryer to the efficiency of the old dryers.
Figure 2 – Criteria Tree
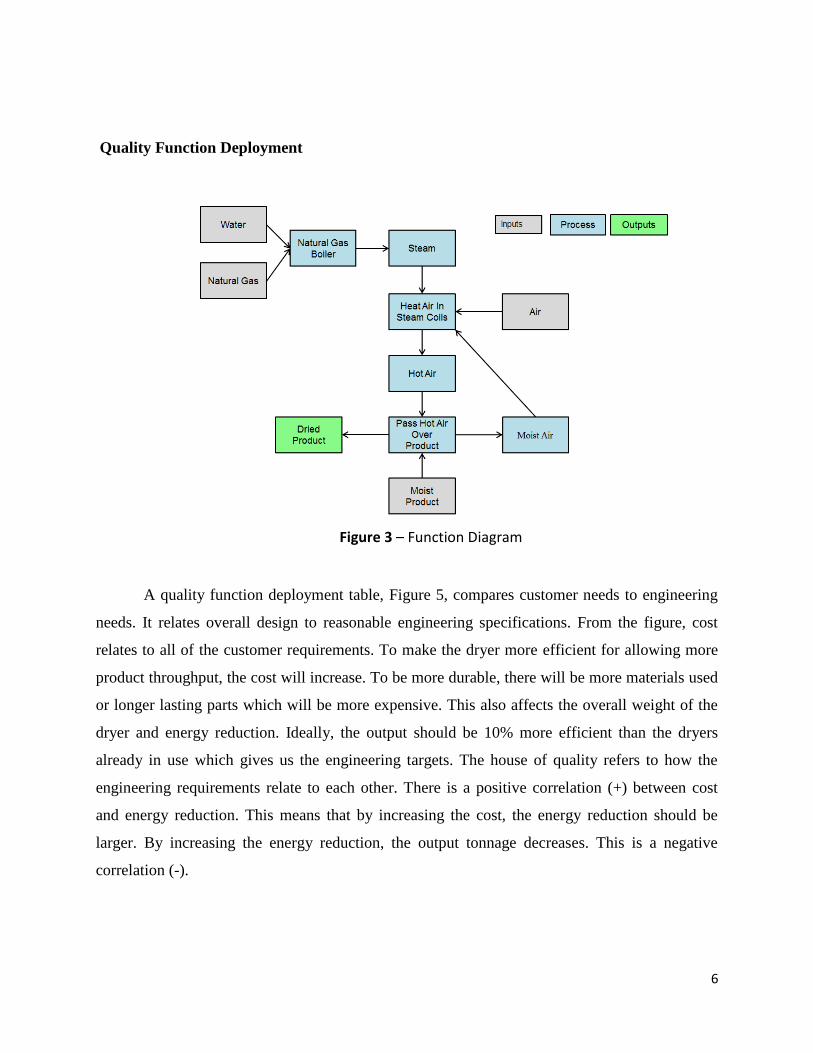
To better understand the process of the dryer and where to perform our engineering
analysis, a functional diagram of dryer 3 was made. This is shown in Figure 4 below. The dryer
runs on steam in conjunction with an air circulation system. The plant produces its own steam in
a natural gas boiler. This steam is then pumped at approximately 100 psi to the dryer unit. In the
dryer, steam is continually pumped through steam coils. The air circulation system blows air
over the steam coils to heat the air to around 280 degrees Fahrenheit. Hot air has a larger
capacity to remove moisture than air at a lower temperature. This air passes through the moist
product and removes moisture from it. After this, the air is re-heated and passed through the
product twice more. The product enters the fourth and final section of the dryer where it is
cooled to about 100 degrees Fahrenheit before it is sent to further processing.
6
Quality Function Deployment
Figure 3 – Function Diagram
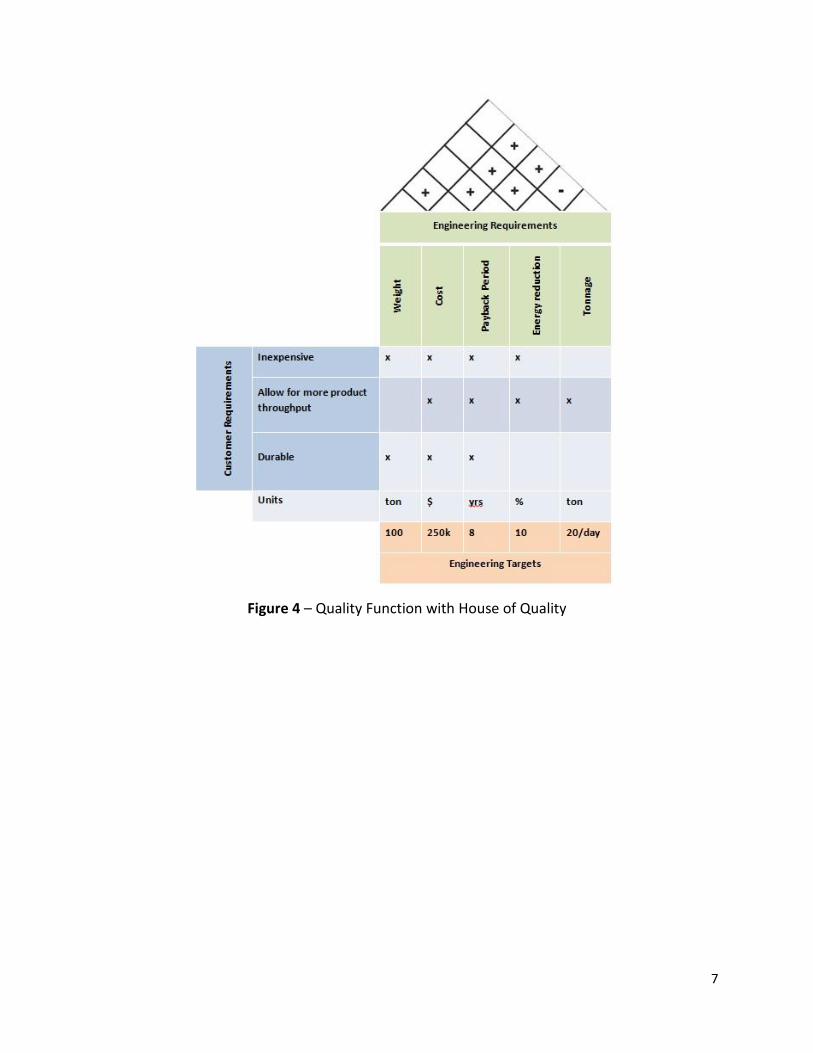
A quality function deployment table, Figure 5, compares customer needs to engineering
needs. It relates overall design to reasonable engineering specifications. From the figure, cost
relates to all of the customer requirements. To make the dryer more efficient for allowing more
product throughput, the cost will increase. To be more durable, there will be more materials used
or longer lasting parts which will be more expensive. This also affects the overall weight of the
dryer and energy reduction. Ideally, the output should be 10% more efficient than the dryers
already in use which gives us the engineering targets. The house of quality refers to how the
engineering requirements relate to each other. There is a positive correlation (+) between cost
and energy reduction. This means that by increasing the cost, the energy reduction should be
larger. By increasing the energy reduction, the output tonnage decreases. This is a negative
correlation (-).
7
Figure 4 – Quality Function with House of Quality
8
Concept Generation
Before we were able to select a design to move forward with, we first had to generate a multitude
of concepts to choose from. We accomplished this by breaking the concept generation section
into multiple stages. These stages are: defining the problem, defining the system, brainstorming,
using Osborn’s Checklist to expand these ideas, and then refining the ideas to prepare for
concept selection. Through our previous work, we were able to interpret our client’s need and
generate a concrete problem statement. We determined that the problem was: Dryer 3 at Nestle
Purina uses significantly more energy than the other four dryers to extract moisture from the
product.
The next step in our concept generation and selection process was to define the system
and understand it as completely as possible. We were able to meet with Chad Girvin, the
processing maintenance team leader at the Nestle Purina plant in Flagstaff. Chad was able to
provide us detail about the system that one would only learn by spending years with a specific
system.
We realize now that the drying process at Nestle Purina is very complicated, but we were
able to take note of the most critical pieces of the system and its operation. The first step of the
drying process is bringing the product to the front of the dryer from the exit of the extruder, or
product cooker. This is done with a vacuum conveyance system. Each dryer has a dedicated
blower that creates a vacuum to pull the product to the dryer. The vacuum conveyance system is
a very important part of the drying process as it provides about ¼ of the moisture removal as a
fraction of the entire drying process.
Once the product is pulled through the vacuum conveyance system, it is deposited onto
the dryer bed by an oscillating belt. This belt speed can be controlled, and helps to control the
product depth and uniformity. The belt speed also affects the time the product spends in the
dryer. After the product enters the dryer, it is passed through 4 sections of the dryer. The first 3
sections are responsible for removing moisture from the product, and the fourth section is
responsible for cooling the product. Each section has its own dedicated air flow, temperature
control, and steam coils. The steam coils are used to heat up the air that moves through each
section, as hot air can contain much more moisture than cool air.

9
In addition to using Chad Girvin as a resource for information, we were also able to use
Nestle Purina’s process monitoring system called iFix to gather information on the system. The
computer interface with this system is shown in figures 1 and 2. Figure 1 depicts all of the
relevant information for dryer 3, which is the focus of our project. iFix provides a large amount
of data, and we focused on a few key details to determine the relative efficiency of dryer 3. We
used dryer 1 as a reference; data for dryer 1 can be found in figure 2.
The percentages displayed along the dryer bed represent the percentage of dryer steam
usage as a comparison to the dryer capacity. Figures 1 and 2 show that dryer 3 is running at near
capacity, while dryer 1 is running at approximately 70% capacity. To quantify the dryer steam
usage, we were able to access the steam flow rate for each dryer, in terms of pounds of steam per
hour, or pph. The steam flow rate for dryer 3 was 4009.3 pph at the time of measurement and
the steam flow rate for dryer 1 was 3414.6 pph.
Figure 5 - Dryer 3 Source: Nestle Purina Process Monitoring System
10
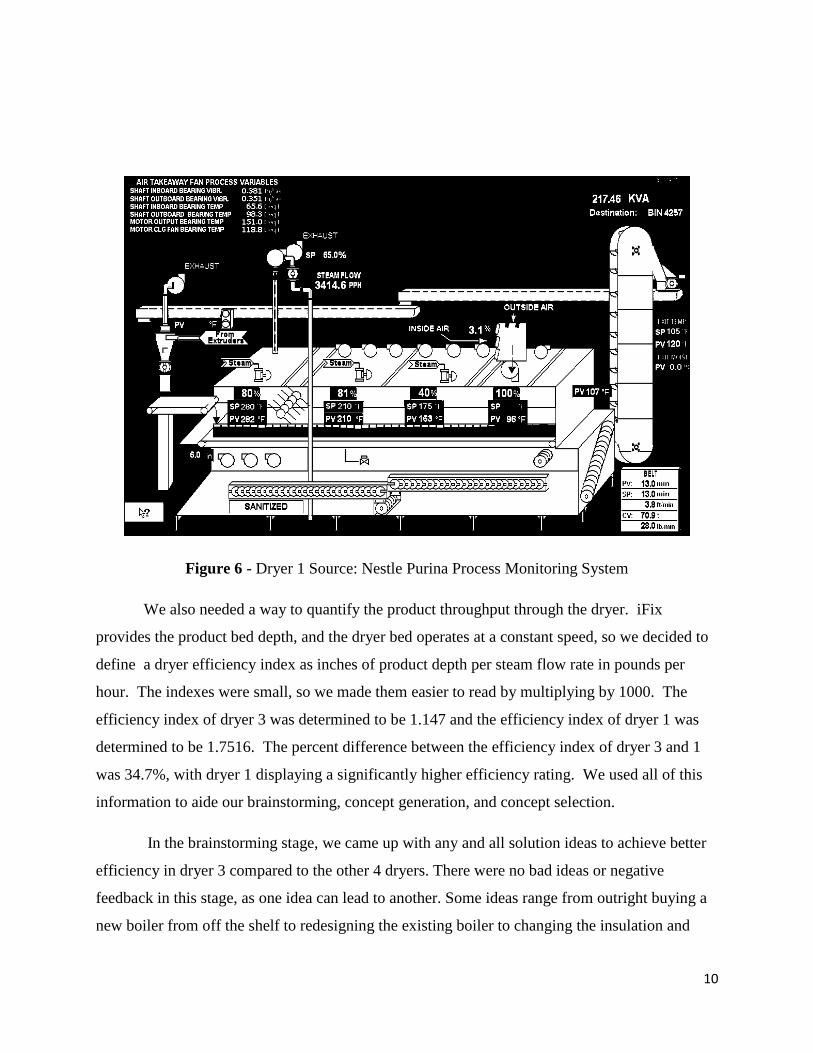
Figure 6 - Dryer 1 Source: Nestle Purina Process Monitoring System
We also needed a way to quantify the product throughput through the dryer. iFix
provides the product bed depth, and the dryer bed operates at a constant speed, so we decided to
define a dryer efficiency index as inches of product depth per steam flow rate in pounds per
hour. The indexes were small, so we made them easier to read by multiplying by 1000. The
efficiency index of dryer 3 was determined to be 1.147 and the efficiency index of dryer 1 was
determined to be 1.7516. The percent difference between the efficiency index of dryer 3 and 1
was 34.7%, with dryer 1 displaying a significantly higher efficiency rating. We used all of this
information to aide our brainstorming, concept generation, and concept selection.
In the brainstorming stage, we came up with any and all solution ideas to achieve better
efficiency in dryer 3 compared to the other 4 dryers. There were no bad ideas or negative
feedback in this stage, as one idea can lead to another. Some ideas range from outright buying a
new boiler from off the shelf to redesigning the existing boiler to changing the insulation and
11
fuel for the boiler itself. Initial research and price quotes for these solutions range upward of half
a million dollars so a careful inspection of these ideas are necessary.
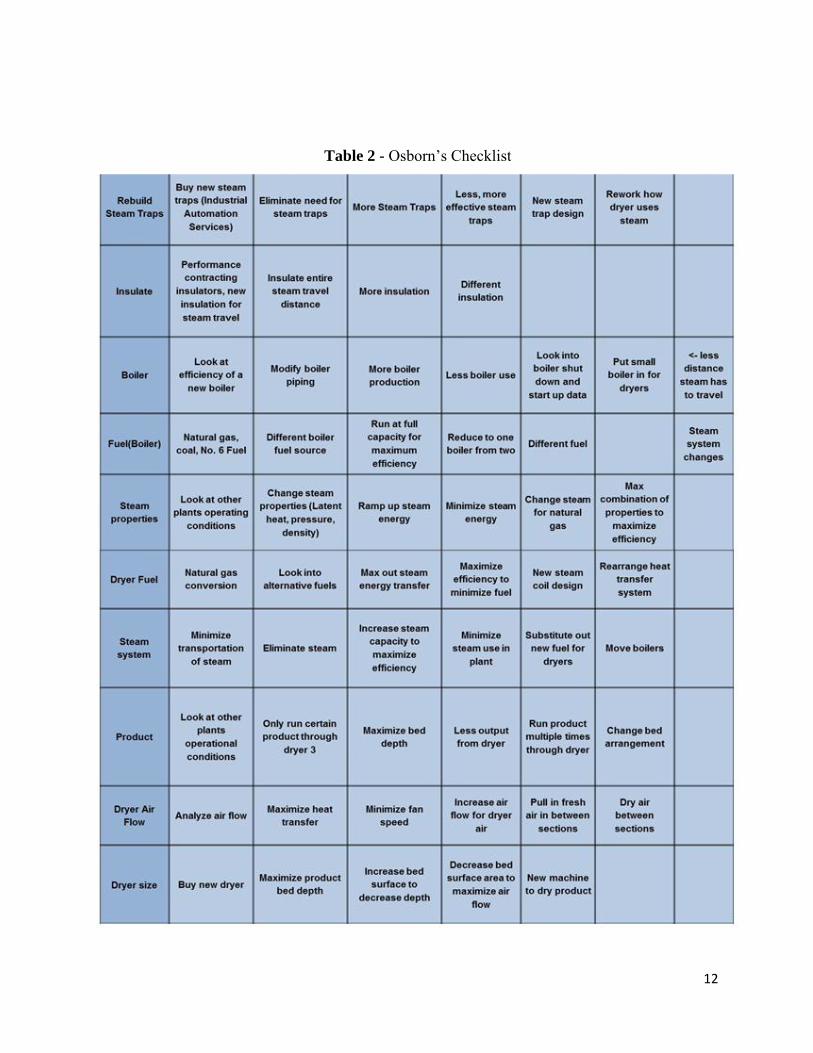
To further generate concepts from the brainstorming stage, we used Osborn’s Checklist
shown in Table 1. This method allows one to expand the list of ideas by asking how to adapt,
modify, magnify, minify, substitute, rearrange, and combine. By following this procedure, we
obtain many more concepts; some good and some unreasonable. For example, by taking the
original concept of insulation, we can increase the amount of insulation around main pipes,
decrease insulation around other pipes, use different insulation material, or a combination of
these designs. Then, to refine the list for top, viable concepts, we used a weighted criteria tree
with a decision matrix.
12
Table 2 - Osborn’s Checklist
13
Concept Selection
Since there are three criteria, the team needs to determine the overall importance for the
criteria. So the team can make a decision matrix for the concepts. Therefore the Analytical
Hierarchy Process is applied to determine the overall importance.
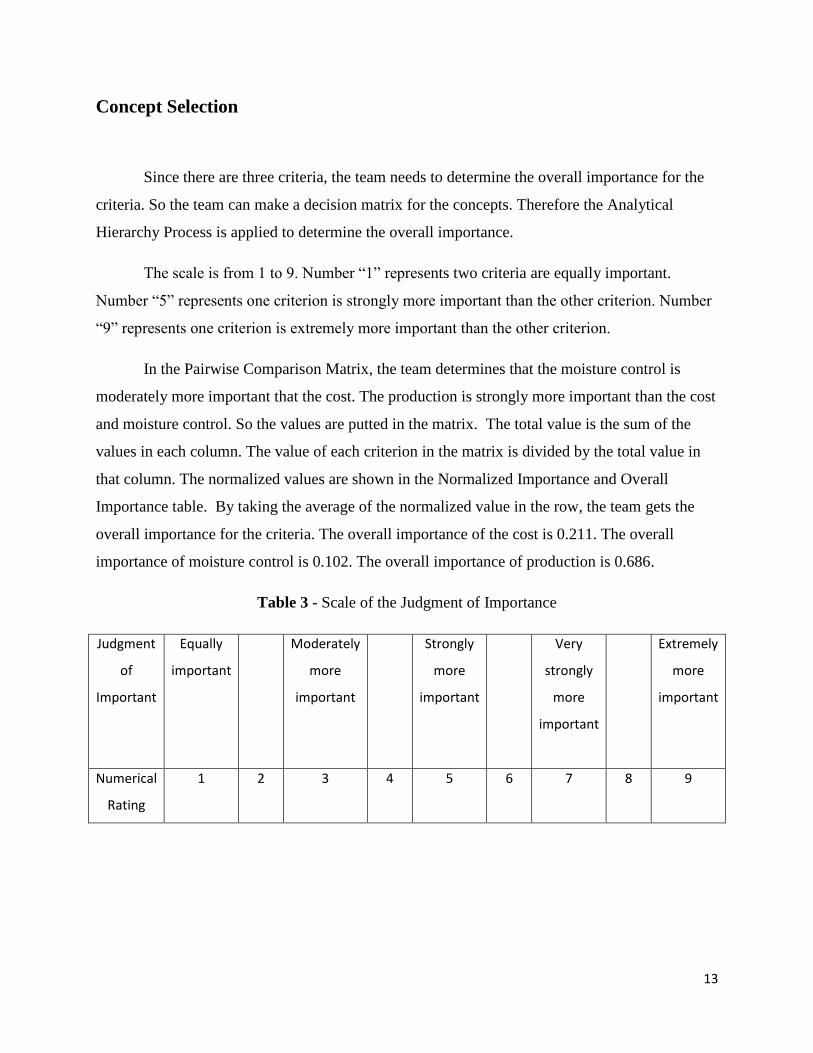
The scale is from 1 to 9. Number “1” represents two criteria are equally important.
Number “5” represents one criterion is strongly more important than the other criterion. Number
“9” represents one criterion is extremely more important than the other criterion.
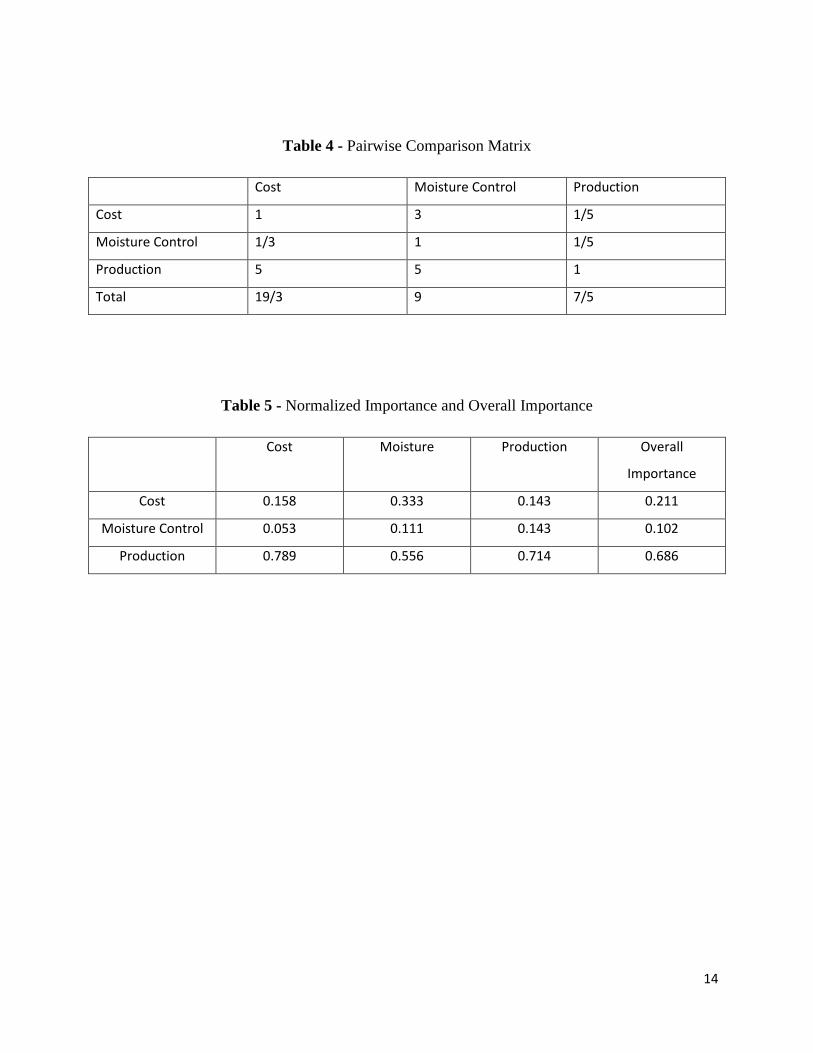
In the Pairwise Comparison Matrix, the team determines that the moisture control is
moderately more important that the cost. The production is strongly more important than the cost
and moisture control. So the values are putted in the matrix. The total value is the sum of the
values in each column. The value of each criterion in the matrix is divided by the total value in
that column. The normalized values are shown in the Normalized Importance and Overall
Importance table. By taking the average of the normalized value in the row, the team gets the
overall importance for the criteria. The overall importance of the cost is 0.211. The overall
importance of moisture control is 0.102. The overall importance of production is 0.686.
Table 3 - Scale of the Judgment of Importance
Judgment
of
Important
Equally
important
Moderately
more
important
Strongly
more
important
Very
strongly
more
important
Extremely
more
important
Numerical
Rating
1 2 3 4 5 6 7 8 9
14
Table 4 - Pairwise Comparison Matrix
Cost Moisture Control Production
Cost 1 3 1/5
Moisture Control 1/3 1 1/5
Production 5 5 1
Total 19/3 9 7/5
Table 5 - Normalized Importance and Overall Importance
Cost Moisture Production Overall
Importance
Cost 0.158 0.333 0.143 0.211
Moisture Control 0.053 0.111 0.143 0.102
Production 0.789 0.556 0.714 0.686
15
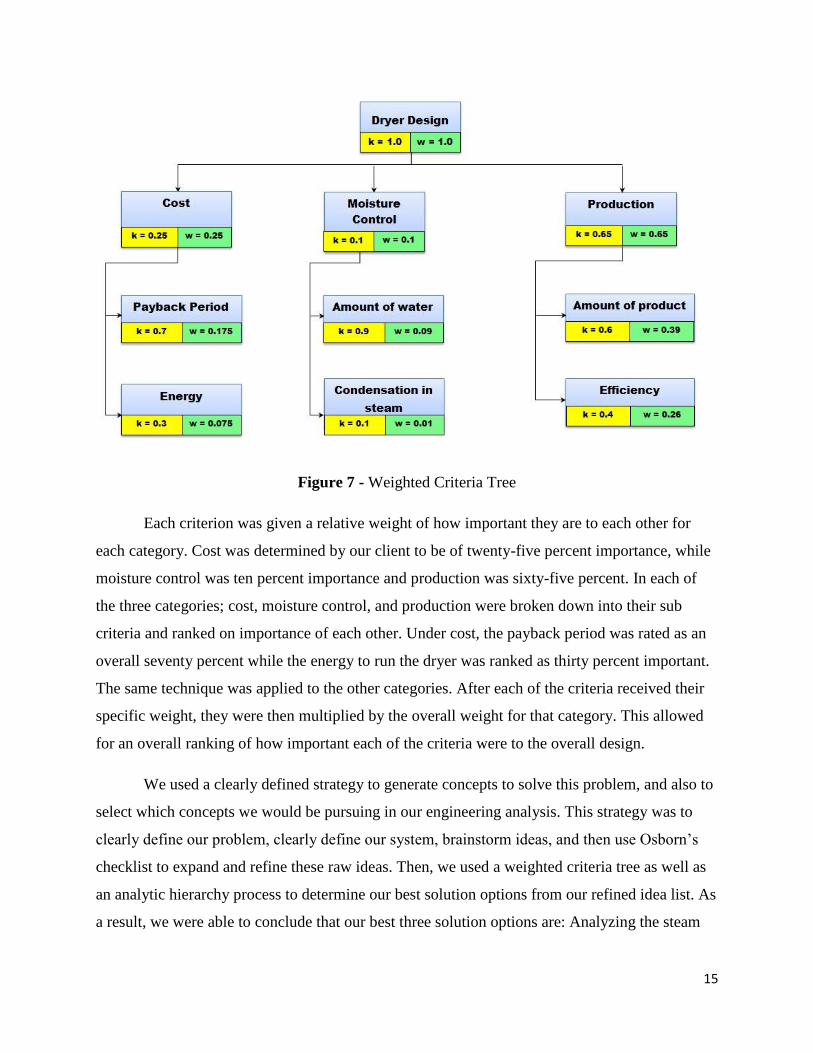
Figure 7 - Weighted Criteria Tree
Each criterion was given a relative weight of how important they are to each other for
each category. Cost was determined by our client to be of twenty-five percent importance, while
moisture control was ten percent importance and production was sixty-five percent. In each of
the three categories; cost, moisture control, and production were broken down into their sub
criteria and ranked on importance of each other. Under cost, the payback period was rated as an
overall seventy percent while the energy to run the dryer was ranked as thirty percent important.
The same technique was applied to the other categories. After each of the criteria received their
specific weight, they were then multiplied by the overall weight for that category. This allowed
for an overall ranking of how important each of the criteria were to the overall design.
We used a clearly defined strategy to generate concepts to solve this problem, and also to
select which concepts we would be pursuing in our engineering analysis. This strategy was to
clearly define our problem, clearly define our system, brainstorm ideas, and then use Osborn’s
checklist to expand and refine these raw ideas. Then, we used a weighted criteria tree as well as
an analytic hierarchy process to determine our best solution options from our refined idea list. As
a result, we were able to conclude that our best three solution options are: Analyzing the steam
16
characteristics, analyzing the air flow inside the dryers, and re-designing the dryer air flow.
These three ideas will be our basis when we begin to look into the engineering analysis section
of our design process.
Engineering Analysis
Current System
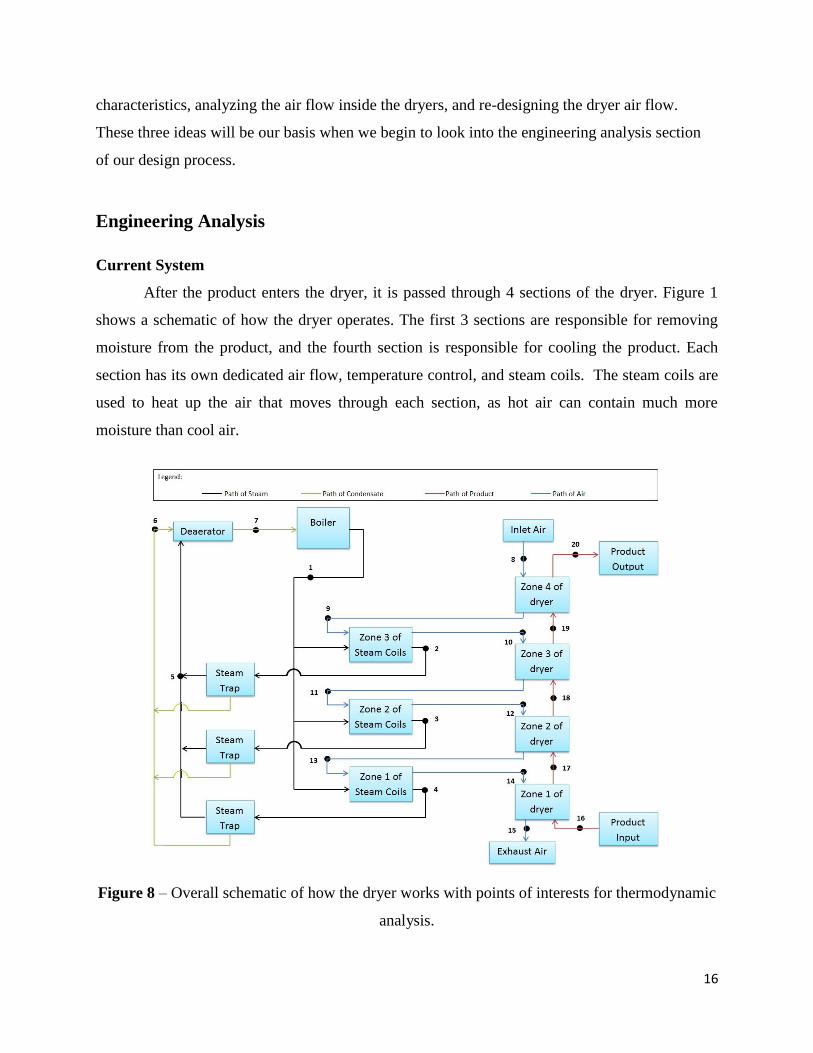
After the product enters the dryer, it is passed through 4 sections of the dryer. Figure 1
shows a schematic of how the dryer operates. The first 3 sections are responsible for removing
moisture from the product, and the fourth section is responsible for cooling the product. Each
section has its own dedicated air flow, temperature control, and steam coils. The steam coils are
used to heat up the air that moves through each section, as hot air can contain much more
moisture than cool air.
Figure 8 – Overall schematic of how the dryer works with points of interests for thermodynamic
analysis.
17
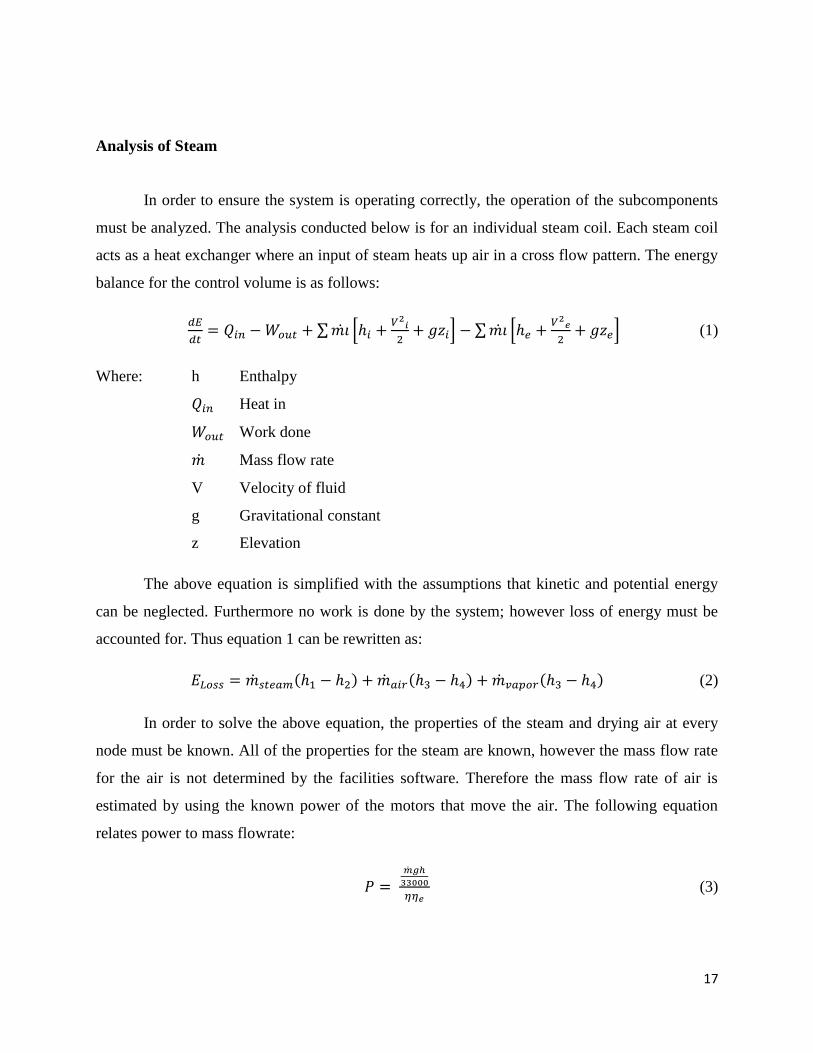
Analysis of Steam
In order to ensure the system is operating correctly, the operation of the subcomponents
must be analyzed. The analysis conducted below is for an individual steam coil. Each steam coil
acts as a heat exchanger where an input of steam heats up air in a cross flow pattern. The energy
balance for the control volume is as follows:
∑ [
] ∑ [
] (1)
Where: h Enthalpy
Heat in
Work done
Mass flow rate
V Velocity of fluid
g Gravitational constant
z Elevation
The above equation is simplified with the assumptions that kinetic and potential energy
can be neglected. Furthermore no work is done by the system; however loss of energy must be
accounted for. Thus equation 1 can be rewritten as:
( ) ( ) ( ) (2)
In order to solve the above equation, the properties of the steam and drying air at every
node must be known. All of the properties for the steam are known, however the mass flow rate
for the air is not determined by the facilities software. Therefore the mass flow rate of air is
estimated by using the known power of the motors that move the air. The following equation
relates power to mass flowrate:
(3)
18
Where: Mass flow rate
` g Gravitational constant
h Total head
η Efficiency of the motor
ηe Mechanical energy (converting electricity)
Since the values for the amount of power for the motor is known (10 horsepower), we
can determine the overall expected mass flow rate once we get the data about the overall
efficiency of the motor, the mechanical energy, and the total head caused by the velocity and
pipe frictions. Once we have calculated the mass flow rate, we need to determine how much of
the mass is made up of water vapor and how much is made up of air. By using the equation for
moisture content it allows us to determine the ratio of vapor to air:
(4)
Equation 2 will be utilized to determine the operational condition of each independent
heat exchanger of the dryer. Those values will be compared to each of the heat exchangers in
another dryer found in the plant. This will allow us to determine how differently dryer three is
operating from dryer one.
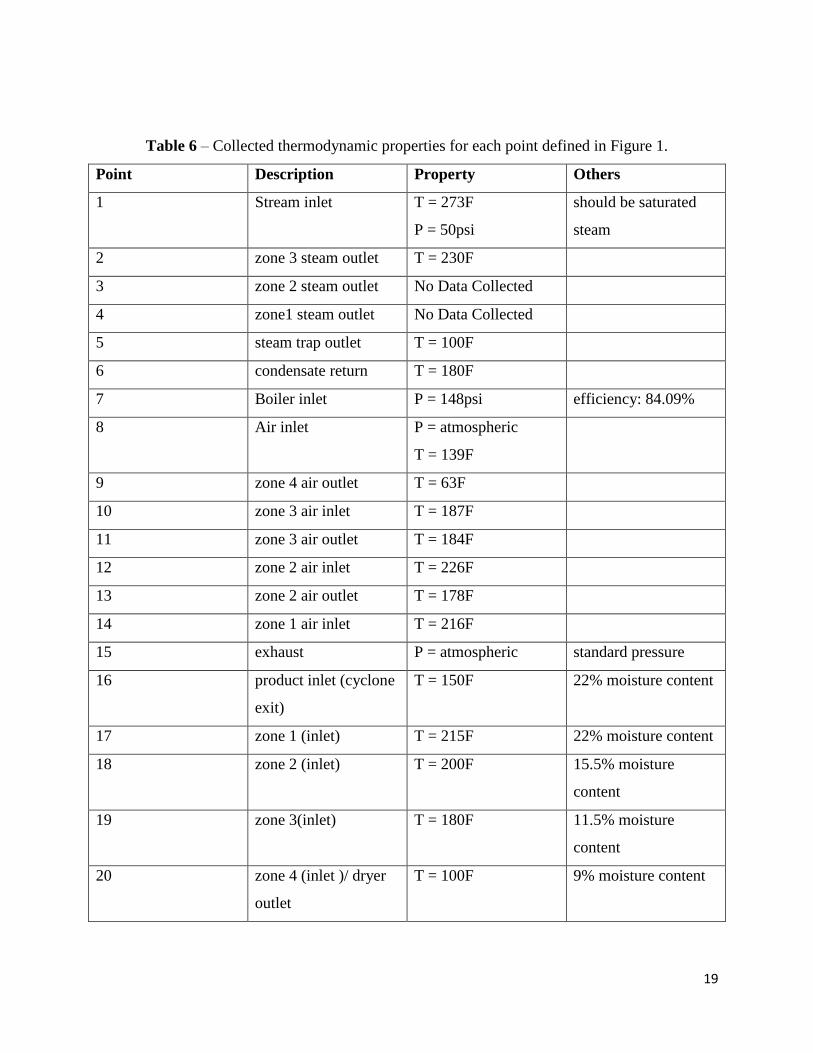
The only data that we have collected so far is listed in Table 1, where each point was
defined earlier in Figure 1. This data in combination with the data from the other dryers will
allow us to determine if there is a discrepancy with the heat exchangers.
19
Table 6 – Collected thermodynamic properties for each point defined in Figure 1.
Point Description Property Others
1 Stream inlet T = 273F
P = 50psi
should be saturated
steam
2 zone 3 steam outlet T = 230F
3 zone 2 steam outlet No Data Collected
4 zone1 steam outlet No Data Collected
5 steam trap outlet T = 100F
6 condensate return T = 180F
7 Boiler inlet P = 148psi efficiency: 84.09%
8 Air inlet P = atmospheric
T = 139F
9 zone 4 air outlet T = 63F
10 zone 3 air inlet T = 187F
11 zone 3 air outlet T = 184F
12 zone 2 air inlet T = 226F
13 zone 2 air outlet T = 178F
14 zone 1 air inlet T = 216F
15 exhaust P = atmospheric standard pressure
16 product inlet (cyclone
exit)
T = 150F 22% moisture content
17 zone 1 (inlet) T = 215F 22% moisture content
18 zone 2 (inlet) T = 200F 15.5% moisture
content
19 zone 3(inlet) T = 180F 11.5% moisture
content
20 zone 4 (inlet )/ dryer
outlet
T = 100F 9% moisture content
20
After our analysis, we are going to determine the best way to fix whatever is causing the
problem. To determine the best way of fixing the problem, we are going to perform a cost
analysis. This will allow us to determine exactly how much the increase in cost will be, and how
long it will take for the increase in productivity to pay for the increase in costs.
Natural Gas Conversion
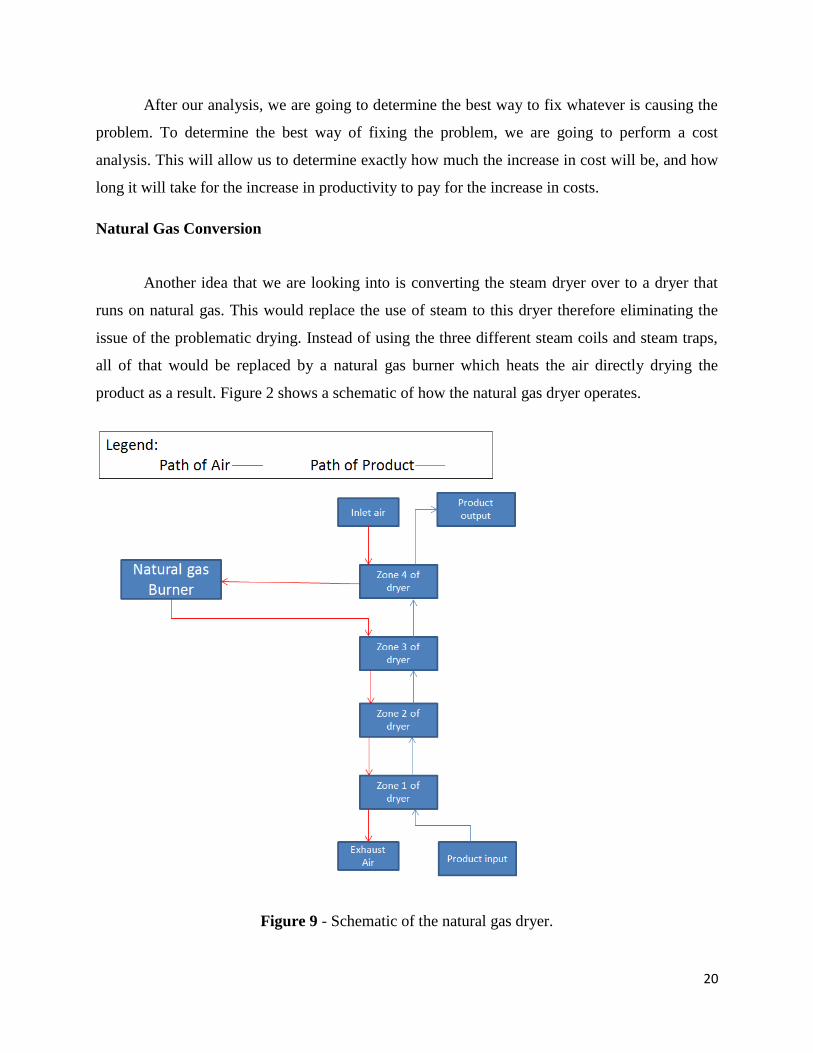
Another idea that we are looking into is converting the steam dryer over to a dryer that
runs on natural gas. This would replace the use of steam to this dryer therefore eliminating the
issue of the problematic drying. Instead of using the three different steam coils and steam traps,
all of that would be replaced by a natural gas burner which heats the air directly drying the
product as a result. Figure 2 shows a schematic of how the natural gas dryer operates.
Figure 9 - Schematic of the natural gas dryer.
21
After the product enters the dryer, it is passed through 4 sections of the dryer. Air enters
the fourth zone to cool the product down. Then the air will be heated up by the natural gas
burner. After air being heated up, it enters the other 3 sections of the dryer which will remove the
moisture from the product.
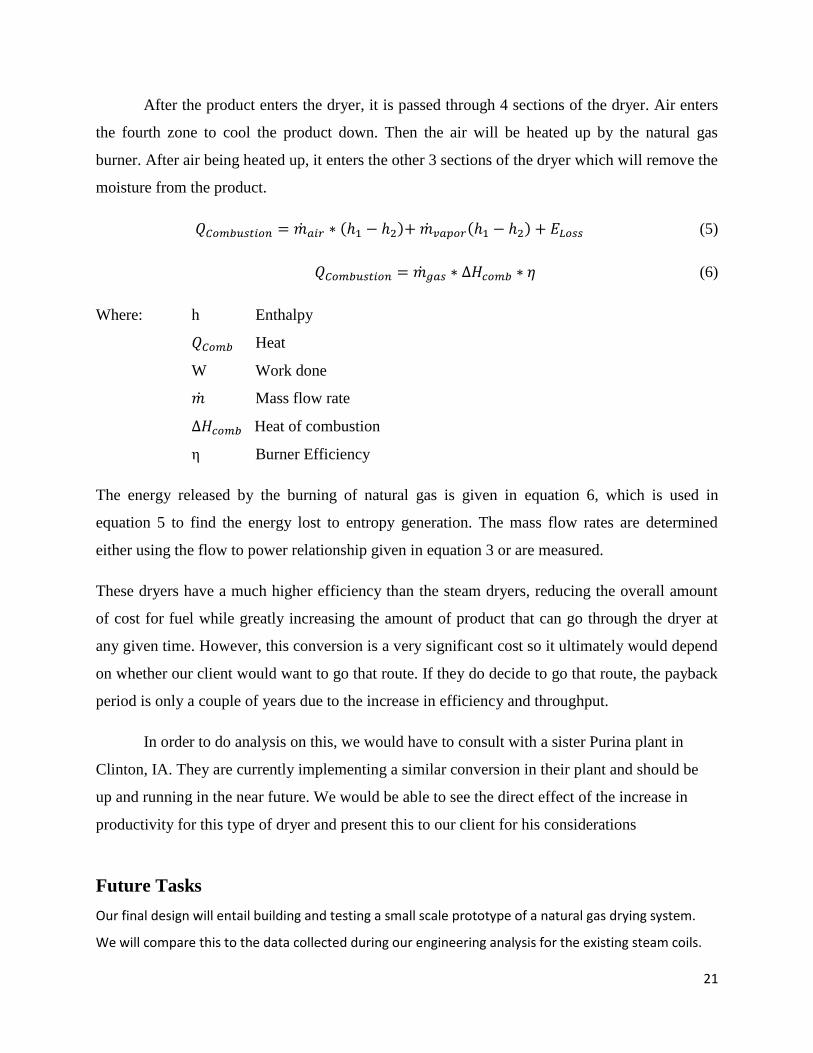
( ) ( ) (5)
(6)
Where: h Enthalpy
Heat
W Work done
Mass flow rate
Heat of combustion
η Burner Efficiency
The energy released by the burning of natural gas is given in equation 6, which is used in
equation 5 to find the energy lost to entropy generation. The mass flow rates are determined
either using the flow to power relationship given in equation 3 or are measured.
These dryers have a much higher efficiency than the steam dryers, reducing the overall amount
of cost for fuel while greatly increasing the amount of product that can go through the dryer at
any given time. However, this conversion is a very significant cost so it ultimately would depend
on whether our client would want to go that route. If they do decide to go that route, the payback
period is only a couple of years due to the increase in efficiency and throughput.
In order to do analysis on this, we would have to consult with a sister Purina plant in
Clinton, IA. They are currently implementing a similar conversion in their plant and should be
up and running in the near future. We would be able to see the direct effect of the increase in
productivity for this type of dryer and present this to our client for his considerations
Future Tasks
Our final design will entail building and testing a small scale prototype of a natural gas drying system.
We will compare this to the data collected during our engineering analysis for the existing steam coils.
22
Through this comparison, we intend to prove the increased efficiency of the natural gas drying system.
The steam coils may be a cheap solution to the problem that Nestle Purina is experiencing, but this is
not a viable long term solution, which is what our client needs. Next semester, we hope to build and
test this natural gas prototype to prove that this system has an increased efficiency, and relate this
efficiency to a tangible payback period that meets our requirement of 8 years or less.
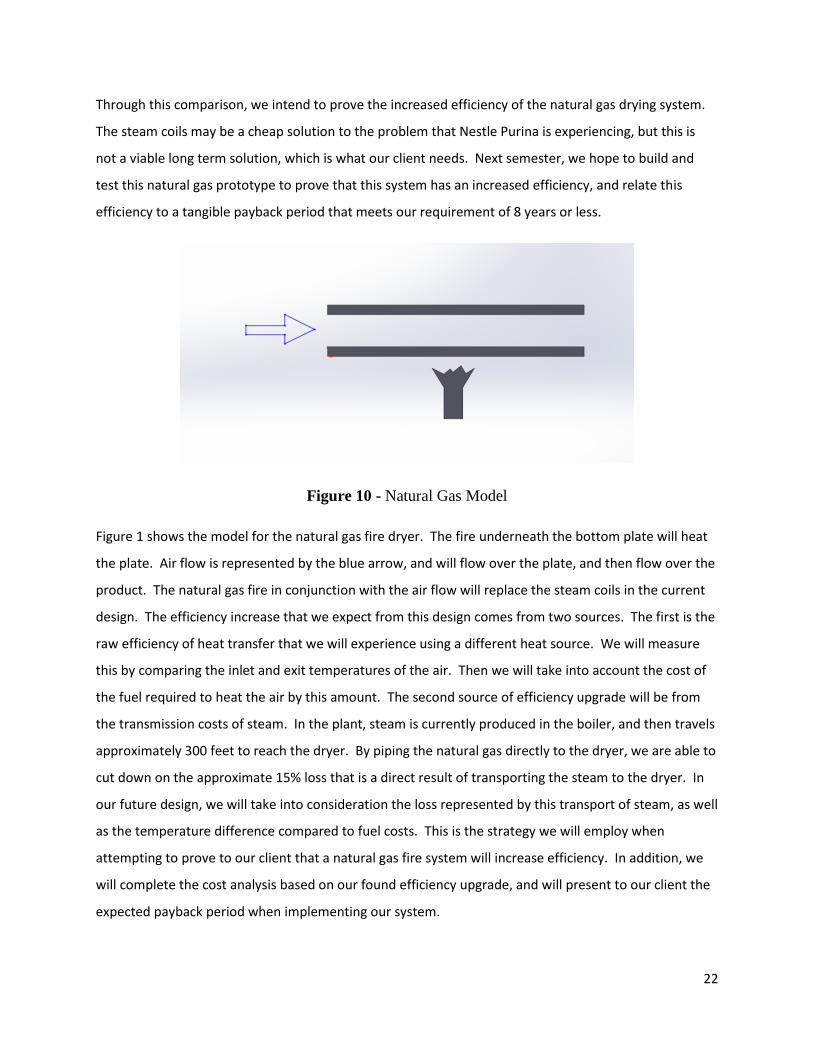
Figure 10 - Natural Gas Model
Figure 1 shows the model for the natural gas fire dryer. The fire underneath the bottom plate will heat
the plate. Air flow is represented by the blue arrow, and will flow over the plate, and then flow over the
product. The natural gas fire in conjunction with the air flow will replace the steam coils in the current
design. The efficiency increase that we expect from this design comes from two sources. The first is the
raw efficiency of heat transfer that we will experience using a different heat source. We will measure
this by comparing the inlet and exit temperatures of the air. Then we will take into account the cost of
the fuel required to heat the air by this amount. The second source of efficiency upgrade will be from
the transmission costs of steam. In the plant, steam is currently produced in the boiler, and then travels
approximately 300 feet to reach the dryer. By piping the natural gas directly to the dryer, we are able to
cut down on the approximate 15% loss that is a direct result of transporting the steam to the dryer. In
our future design, we will take into consideration the loss represented by this transport of steam, as well
as the temperature difference compared to fuel costs. This is the strategy we will employ when
attempting to prove to our client that a natural gas fire system will increase efficiency. In addition, we
will complete the cost analysis based on our found efficiency upgrade, and will present to our client the
expected payback period when implementing our system.
23
We hope to implement a low cost prototype to function as a proof of concept for our client. Once we
have proved that the natural gas conversion will increase the efficiency of the dryer significantly, we will
be able to justify the creation of a more expensive and accurate prototype. This is the end result that
we will wish to present to our client.
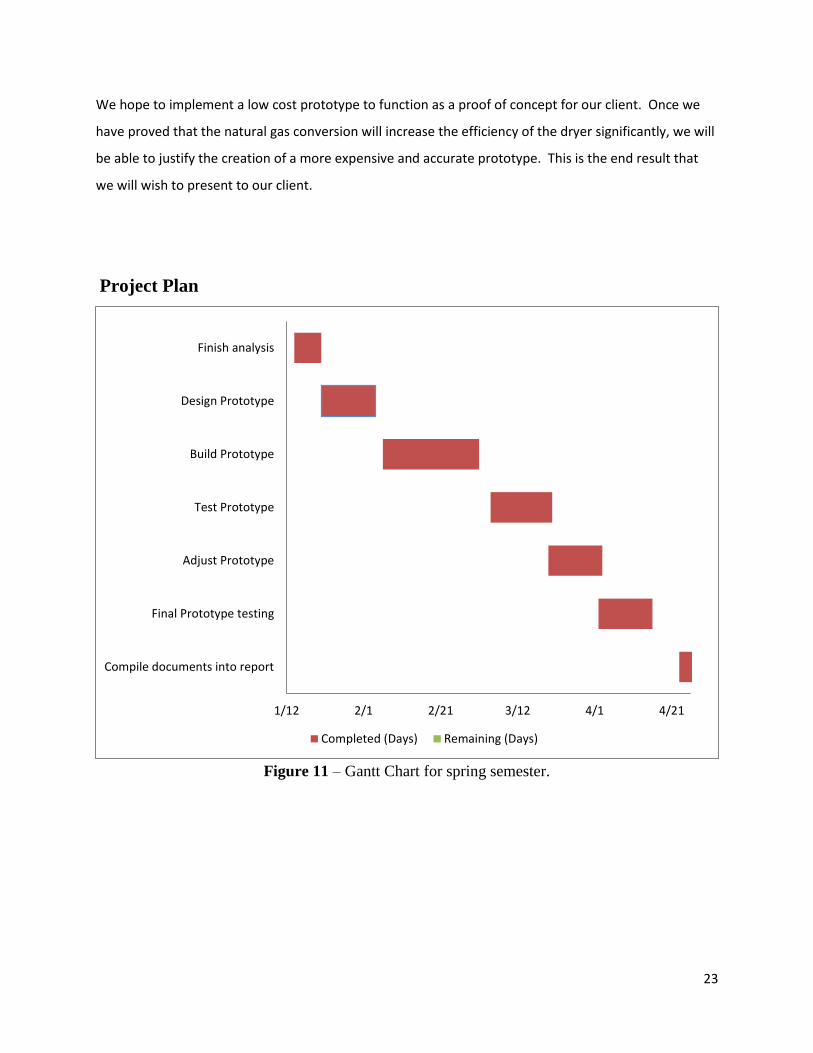
Project Plan
Figure 11 – Gantt Chart for spring semester.
1/12 2/1 2/21 3/12 4/1 4/21
Finish analysis
Design Prototype
Build Prototype
Test Prototype
Adjust Prototype
Final Prototype testing
Compile documents into report
Completed (Days) Remaining (Days)
24
Conclusion
Dryer 3 having efficiency problems, we decided to fix this with two design solutions. The first is to fix
the steam coils, and the second is to convert the system to natural gas. After performing
thermodynamic analysis on the steam coils and comparing this to natural gas conversion, we decided to
implement a natural gas conversion system for dryer 3. This is a more expensive solution, but in the
long term, it will produce more revenue for our client than the steam coil solution. After analysis of the
prototype models, we will prove that the natural gas conversion is the correct solution for our client.
We will provide the client with a proposal and will await approval for the design as this is a high cost
solution. To implement and design an actual natural gas system for a multi-million dollar system is
beyond the scope of this class. Therefore, the final product of this class will be to prove the efficiency of
a natural gas fire system through the implementation of the prototypes mentioned previously.
25
References
Clint Chadwick
Environmental Coordinator
Nestle Purina Pet Care, Flagstaff, AZ
Chad Girvin
Processing Maintenance Team Leader
Nestle Purina Pet Care, Flagstaff, AZ
Bergman, T. L., and Frank P. Incropera. Fundamentals of Heat and Mass Transfer.Hoboken, NJ:
Wiley, 2011. Print.
Figliola, R. S., and Donald E. Beasley. Theory and Design for Mechanical Measurements.
Hoboken, NJ: J. Wiley, 2011. Print.
Baumeister, Theodore, Ali M. Sadegh, and Eugene A. Avallone. Marks' Standard Handbook for
Mechanical Engineers. New York: McGraw-Hill, 2007. Print.
White, Frank M. Fluid Mechanics. New York, NY: McGraw Hill, 2011. Print.
26
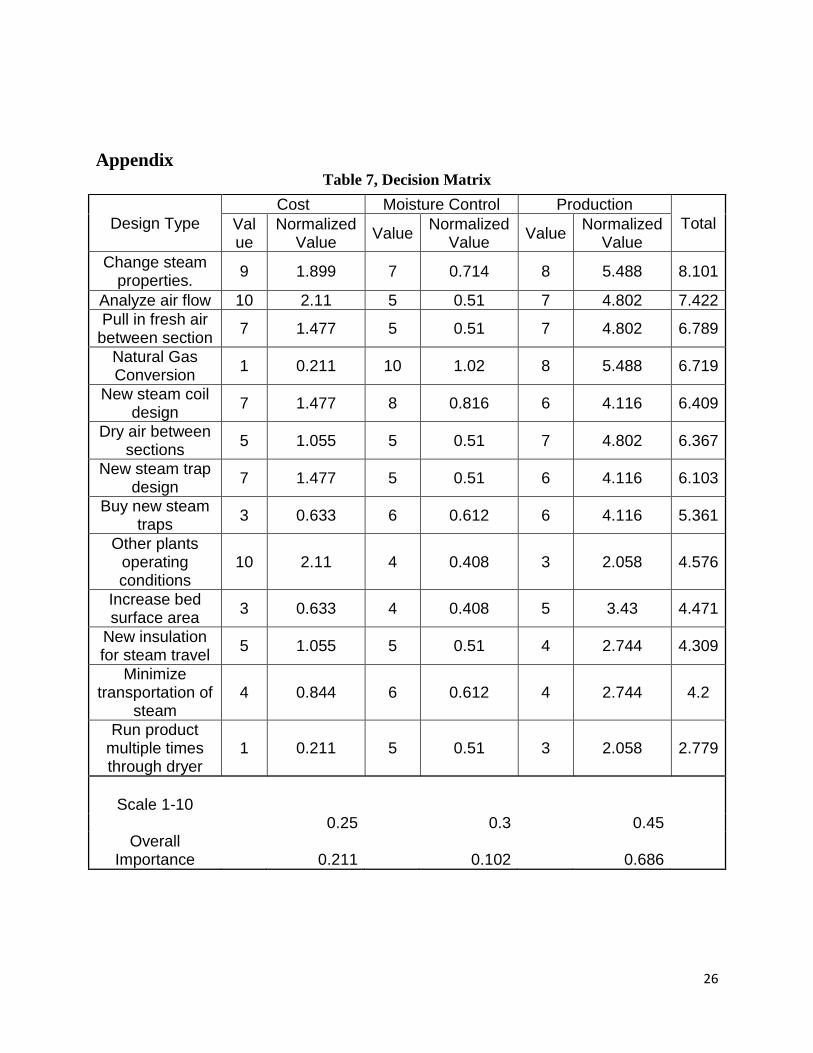
Appendix Table 7, Decision Matrix
Design Type
Cost Moisture Control Production
Total Value
Normalized Value
Value Normalized
Value Value
Normalized Value
Change steam properties.
9 1.899 7 0.714 8 5.488 8.101
Analyze air flow 10 2.11 5 0.51 7 4.802 7.422
Pull in fresh air between section
7 1.477 5 0.51 7 4.802 6.789
Natural Gas Conversion
1 0.211 10 1.02 8 5.488 6.719
New steam coil design
7 1.477 8 0.816 6 4.116 6.409
Dry air between sections
5 1.055 5 0.51 7 4.802 6.367
New steam trap design
7 1.477 5 0.51 6 4.116 6.103
Buy new steam traps
3 0.633 6 0.612 6 4.116 5.361
Other plants operating conditions
10 2.11 4 0.408 3 2.058 4.576
Increase bed surface area
3 0.633 4 0.408 5 3.43 4.471
New insulation for steam travel
5 1.055 5 0.51 4 2.744 4.309
Minimize transportation of
steam 4 0.844 6 0.612 4 2.744 4.2
Run product multiple times through dryer
1 0.211 5 0.51 3 2.058 2.779
Scale 1-10
0.25
0.3
0.45 Overall
Importance 0.211 0.102 0.686