project progress report reporting period: june 2016
TRANSCRIPT

PROJECT PROGRESS REPORT REPORTING PERIOD: JUNE 2016 – NOVEMBER 2016

Page 2 of 54
SIX MONTHLY PROGRESS REPORTREPORTING PERIOD: JUNE 2016 – NOVEMBER 2016
Document Control
Name Date
Prepared by: Jonathan Berry 09.12.2016
Reviewed by: Roger Hey 12.12.2016
Recommended by: Nigel Turvey 13.12.2016
Approved (WPD): Philip Swift 15.12.2016
Revision History
Date Issue Status
25.11.2016 1 DRAFT
09.12.2016 2 FINAL
Report Title : Six monthly progress report Reporting period: JUNE 2016 to NOVEMBER 2016
Report Status : FINAL
Project Ref : WPDT2006 ‐ Equilibrium
Date : 09.12.2016

Page 3 of 54
SIX MONTHLY PROGRESS REPORTREPORTING PERIOD: JUNE 2016 – NOVEMBER 2016
Contents
1 Executive Summary ................................................................................................................ 6 1.1 Business Case ............................................................................................................... 6 1.2 Project Progress ............................................................................................................ 6 1.3 Project Delivery Structure ............................................................................................ 7
1.3.1 Project Review Group ......................................................................................... 7 1.3.2 Resourcing ........................................................................................................... 7
1.4 Procurement ................................................................................................................. 7 1.5 Installation .................................................................................................................... 7 1.6 Project Risks ................................................................................................................. 8 1.7 Project Learning and Dissemination ............................................................................ 8
2 Project Manager’s Report ...................................................................................................... 9 2.1 Project Background ...................................................................................................... 9 2.2 Project Progress ............................................................................................................ 10 2.3 Enhanced Voltage Assessment ..................................................................................... 10
2.3.1 Advanced Planning Tool ...................................................................................... 10 2.4 System Voltage Optimisation ....................................................................................... 17
2.4.1 SVO Software System .......................................................................................... 18 2.4.2 SVO Site Works ................................................................................................... 24 2.4.3 Network Monitoring ........................................................................................... 30
2.5 Flexible Power Link ....................................................................................................... 32 2.5.1 Introduction ........................................................................................................ 32 2.5.2 Overview ............................................................................................................. 32 2.5.3 Technology .......................................................................................................... 32 2.5.4 Site Enabling Works ............................................................................................ 34 2.5.5 33kV switchgear .................................................................................................. 36 2.5.6 Layout .................................................................................................................. 37 2.5.7 FPL Control Module ............................................................................................ 39
3 Business Case Update ............................................................................................................ 45 4 Progress against Budget ........................................................................................................ 46 5 Successful Delivery Reward Criteria (SDRC) .......................................................................... 47 5.1 Future SDRCs ................................................................................................................ 47
6 Learning Outcomes ................................................................................................................ 48 7 Intellectual Property Rights ................................................................................................... 48 8 Risk Management .................................................................................................................. 48 8.1 Current Risks ................................................................................................................. 49 8.2 Update for risks previously identified .......................................................................... 51
9 Consistency with Full Submission .......................................................................................... 53 10 Accuracy Assurance Statement ............................................................................................. 53

Page 4 of 54
SIX MONTHLY PROGRESS REPORTREPORTING PERIOD: JUNE 2016 – NOVEMBER 2016
DISCLAIMER Neither WPD, nor any person acting on its behalf, makes any warranty, express or implied, with respect to the use of any information, method or process disclosed in this document or that such use may not infringe the rights of any third party or assumes any liabilities with respect to the use of, or for damage resulting in any way from the use of, any information, apparatus, method or process disclosed in the document. © Western Power Distribution 2016 No part of this publication may be reproduced, stored in a retrieval system or transmitted, in any form or by any means electronic, mechanical, photocopying, recording or otherwise, without the written permission of the Future Networks Manager, Western Power Distribution, Herald Way, Pegasus Business Park, Castle Donington. DE74 2TU. Telephone +44 (0) 1332 827446. E‐mail [email protected]
Glossary Term Definition
ABSD Air Break Switch Disconnector
AC Alternating Current
AIS Air Insulated Switchgear
APT Advanced Planning Tool
AVC Automatic Voltage Control
BAU Business as usual
BSP Bulk Supply Point
CB Circuit Breaker
CT Current Transformer
DC Direct Current
DG Distributed Generation
DNO Distribution Network Operator
EHV Extra High Voltage
ENA Energy Networks Association
ER Engineering Recommendation
EU European Union
EVA Enhanced Voltage Assessment
FPL Flexible Power Link
FTP File Transfer Protocol
GB Great Britain
GIS Gas Insulated Switchgear
HSOC High Set Overcurrent
HV High Voltage
IDMT Inverse Definite Minimum Time
IPR Intellectual Property Register
ITT Invitation to Tender
LCT Low Carbon Technologies

Page 5 of 54
SIX MONTHLY PROGRESS REPORTREPORTING PERIOD: JUNE 2016 – NOVEMBER 2016
LV Low Voltage
LVAC Low Voltage Auto Changeover
NMS Network Management System
NOP Normal Open Point
OCEF Overcurrent Earth Fault
OHL Overhead Line
OLTC On Load Tap Changer
RTU Remote Terminal Unit
SCADA Supervisory Control and Data Acquisition
SDRC Successful Delivery Reward Criteria
SLD Single Line Diagram
SVO System Voltage Optimisation
TSDS Time Series Data Store
UK United Kingdom
VLA Voltage Level Assessment
VT Voltage Transformer
WG Working Group
WPD Western Power Distribution

Page 6 of 54
SIX MONTHLY PROGRESS REPORTREPORTING PERIOD: JUNE 2016 – NOVEMBER 2016
1 Executive Summary
Network Equilibrium is funded through Ofgem’s Low Carbon Networks Second Tier funding mechanism. Network Equilibrium was approved to commence in March 2015 and will be complete by 14th June 2019. Network Equilibrium aims to develop and trial an advanced voltage and power flow control solution to further improve the utilisation of Distribution Network Operators’ (DNO) 11kV and 33kV electricity networks in order to facilitate cost‐effective and earlier integration of customers’ generation and demand connections, as well as an increase an customers’ security of supply. This report details progress of the project, focusing on the last six months, June 2016 to November 2016.
1.1 Business Case
The business case for Network Equilibrium remains unchanged. The request for low carbon load and generation connections in the project area, Somerset and Devon, continues to grow.
1.2 Project Progress
This is the fourth progress report. The period covered in this report is further focussed on the method designs, technical contract provision and data gathering for the successful delivery of each method. The Advance Planning Tool (APT) as part of the Enhanced Voltage Assessment (EVA) method has developed significantly. The planning tool has now been developed to a stage where the System Voltage Optimisation (SVO) and Flexible Power Link (FPL) devices can be accurately modelled in the tool, which will be used to support the successful delivery of SDRC‐4. As part of this reporting period the design freeze has taken place for the Siemens’ system as part of the SVO Method. This means that the next reporting period will focus on the build stage of this method along with the build stage of the AVC relay and monitoring installations at the related sites. During this reporting period the contract for the Flexible Power Link (FPL) has been awarded (to ABB). Significant preparatory works at the site, Exebridge, have also been undertaken. These works focus on clearing and enabling the FPL and auxiliary equipment to be installed in the next reporting period. The control module activity for the FPL was also awarded; this has been awarded to Nortech. During this reporting period Network Equilibrium has also made significant progress working towards the next three SDRCs, 4, 5 and 6.

Page 7 of 54
SIX MONTHLY PROGRESS REPORTREPORTING PERIOD: JUNE 2016 – NOVEMBER 2016
1.3 Project Delivery Structure
1.3.1 Project Review Group
The Network Equilibrium Project Review Group met once during this reporting period. The main focus of this meeting was the immediate progress of the FPL method following the award of the device contract to ABB and the progress on the EVA method to support the successful delivery of SDRC‐4.
1.3.2 Resourcing
The resourcing of the project remains as described in the previous reporting period, where the design team is led by WPD engineers and supported by WSP|PB engineers.
1.4 Procurement
The procurement activities for Network Equilibrium focus on the SVO and FPL methods. Throughout the project supporting procurement activities will take place in order to facilitate the successful delivery of all project methods; however, there are two formal procurement activities as part of the project.
Manufacturer Technology Applicable Substations
Anticipated Delivery Dates
Siemens SVO System 16 Substations (Installed in 1
central location) October 2017
ABB FPL Exebridge April 2018
1.5 Installation
Following the completion of the detailed design SDRCs the next reporting period will see the first elements of installation works progressed. These first installation activities have been:
AVC relay changes; and
Cable and Overhead Line diversionary works at Exebridge.
Into the next reporting period the change and upgrading of the AVC relays will continue and the work at Exebridge to include the FPL will continue with a new 33kV switchboard building being constructed.

Page 8 of 54
SIX MONTHLY PROGRESS REPORTREPORTING PERIOD: JUNE 2016 – NOVEMBER 2016
1.6 Project Risks
A proactive role in ensuring effective risk management for Network Equilibrium is taken. This ensures that processes have been put in place to review whether risks still exist, whether new risks have arisen, whether the likelihood and impact of risks have changed, reporting of significant changes that will affect risk priorities and deliver assurance of the effectiveness of control. Contained within Section 8.1 of this report are the current top risks associated with successfully delivering Network Equilibrium as captured in our Risk Register along with an update on the risks captured in our last six monthly project report. Section 8.2 provides an update on the most prominent risks identified at the project bid phase.
1.7 Project Learning and Dissemination
Project lessons learned and what worked well are captured throughout the project lifecycle. These are captured through a series of on‐going reviews with stakeholders and project team members, and will be shared in lessons learned workshops at the end of the project. These are reported in Section 6 of this report. A key aim of Network Equilibrium is to ensure that significant elements of the work carried out for network modelling, monitoring, design and installation are captured and shared within WPD and the wider DNO community. During this period the main focus has been to capture the learning of all three methods’ progress and specifically the APT developments for the delivery of SDRC‐4. An Advanced Planning Tool Workshop was held on the 23rd November 2016 in Birmingham. This workshop was attended by several DNOs and enabled the wider DNO community to input into the design requirements for the APT method and to shape the final tool at the stage of the SRDC‐4 delivery. The learning to date from the project was also shared at this year’s Low Carbon Networks and Innovation Conference. Also, three papers for the CIRED conference were accepted for presentation at next year’s conference in 2017 (Glasgow). In addition to this we have shared our learning (where applicable), through discussions and networking at a number of knowledge sharing events hosted by other organisations.

Page 9 of 54
SIX MONTHLY PROGRESS REPORTREPORTING PERIOD: JUNE 2016 – NOVEMBER 2016
2 Project Manager’s Report
2.1 Project Background
The focus of Network Equilibrium is to balance voltages and power flows across the distribution system, using three Methods to integrate distributed generation within electricity networks more efficiently and delivering major benefits to distribution customers. The Problem that Network Equilibrium addresses is that electricity infrastructure in the UK was originally designed and developed for passive power distribution requirements. As a result, the integration of significant levels of low carbon technologies (LCTs) within our present electricity networks can cause voltage management and thermal issues. For business as usual (BAU) roll‐out we need to develop solutions, which take a strategic engineering approach, considering the whole system and not solving constraints on a piecemeal basis. The Problem will be investigated using three Methods, and their applicability to 33kV and 11kV distribution networks assessed. Each will involve testing within South West England: (1) Enhanced Voltage Assessment (EVA); (2) System Voltage Optimisation (SVO); and (3) Flexible Power Link (FPL). The aims of Equilibrium are to:
Increase the granularity of voltage and power flow assessments, exploring potential amendments to ENA Engineering Recommendations and statutory voltage limits, in 33kV and 11kV networks, to unlock capacity for increased levels of low carbon technologies, such as distributed generation (DG);
Demonstrate how better planning for outage conditions can keep more customers (generation and demand) connected to the network when, for example, faults occur. This is particularly important as networks become more complex, with intermittent generation and less predictable demand profiles, and there is an increased dependence on communication and control systems;
Develop policies, guidelines and tools, which will be ready for adoption by other GB DNOs, to optimise voltage profiles across multiple circuits and wide areas of the network;
Improve the resilience of electricity networks through FPL technologies, which can control 33kV voltage profiles and allow power to be transferred between two, previously distinct, distribution systems; and
Increase the firm capacity of substations, which means that the security of supply to distribution customers can be improved during outage conditions, leading to a reduction in customer interruptions (CIs) and customer minutes lost (CMLs).

Page 10 of 54
SIX MONTHLY PROGRESS REPORTREPORTING PERIOD: JUNE 2016 – NOVEMBER 2016
2.2 Project Progress
This is the fourth progress report. The focus of this reporting period was transitioning from the design activities, as documented in SDRCs 1, 2 and 3 to the designs being ready for build. The work on the APT has significantly advanced and has now been presented to all other DNOs in a usable format and will enable SDRC‐4 to be delivered on time to demonstrate the modelled benefits of all three methods. The Siemens Spectrum Power 5 system has now been designed in readiness to transition to the build phase throughout the next reporting period. During this reporting period the FPL device contract has been awarded to ABB following the completion of the tender exercise. Following the award of the contract and design discussion with ABB the site designs have had advanced to being device specific. Work to facilitate the installation of the FPL in early 2018 will be undertaken throughout the next two reporting periods.
2.3 Enhanced Voltage Assessment
Enhanced Voltage Assessment (EVA) consists of two parts. Part 1 is the Advanced Planning Tool (APT) and part 2 is the Voltage Limits Assessment (VLA) work package. Part 2 of EVA was completed in the previous reporting period. In this reporting period, work was focused on further developing and testing the Advanced Planning Tool, emphasising among others on its network capacity evaluation functionality as part of the preparations for SDRC‐4, Trialling and demonstrating the EVA method.
2.3.1 Advanced Planning Tool
The APT is the first part of EVA and involves the creation of a planning tool which aims to enable better network and outage planning of distribution networks with increasing penetration of variable generation and demands. This will be achieved through the tool’s advanced functionalities. These include the production of estimated power flows using weather forecasts and the network analysis using typical demand and generation profiles.
Progress since previous reporting period
After refining the tool’s functionalities in the previous reporting period, the delivery plan was reviewed and agreed with TNEI in June 2016. When creating the delivery programme, the aim was to ensure that the completion of the main deliverables, including SDRC‐4, remained as originally scheduled but also that the Equilibrium team would have an active role in the development of the tool. This was achieved by prioritising the additional functionalities and including a number of interim releases which provided the capability to test the tool and provide feedback as it was being developed. In November 2016, the version of the tool produced included the following functionalities:
Analysis using typical profiles;
Analysis using forecast profiles;
Network demand and generation capacity evaluation;
Simulation of the SVO plugin; and
Simulation of the FPL plugin.

Page 11 of 54
SIX MONTHLY PROGRESS REPORTREPORTING PERIOD: JUNE 2016 – NOVEMBER 2016
Network Model Development
The refinement of the tool started with the IPSA import of the full 11kV network from WPD’s Geographical Information System (GIS), called EMU. The entire process offered significant learning as it was the first time EMU was used to create an IPSA network model. This initially involved consultation with WPD’s mapping teams to understand and analyse the structure of the EMU database and interpret the information available. From these consultations, the “EMU Network Data Guide” was created and was provided to TNEI, which they used to create a script that automatically converts the EMU database to an IPSA network model. An extract from the Guide showing the demonstrations included is displayed in Figure 2‐1.
Figure 2‐1 ‐ Extract from EMU Network Data Guide
Although EMU provided sufficient information on the network connectivity and equipment, a number of other data sources were also used to create the full electrical model including impedance per unit length values for each type of cable, transformer information and generation information. The main challenge in the network model development procedure, however, was establishing a way of linking the model with WPD’s Network Management System (NMS), PowerOn. This was as part of the work required to build the functionality within the tool of performing analysis using actual, historic SCADA data to simulate the real network operation. The source of the SCADA data is PowerOn, therefore a methodology was necessary for the transfer of data from PowerOn to the “SCADA database” of the APT. These data include: • BSP Feeder demands; • Primary substation feeder demands; • Outputs of 33kV connected generators; • Demand of 33kV connected loads; • BSP Transformer load; • Primary Transformer load; and • Statuses of Circuit Breakers.

Page 12 of 54
SIX MONTHLY PROGRESS REPORTREPORTING PERIOD: JUNE 2016 – NOVEMBER 2016
To be able to perform power system analysis, the tool would need to update all the loads and generation in the model with the historic data in its “SCADA database”. In other words, it would need to be able to allocate each data point from its SCADA database to the correct component in the network model. This is demonstrated in Figure 2‐2.
Figure 2‐2 ‐ SCADA Data Mapping from PowerOn to network model
When creating the methodology for the mapping between the SCADA data and the model, it was important to ensure that the procedures that would need to be followed were efficient and suitable if the tool was to be rolled out as BAU. This was achieved by including the unique identifier for each piece of data, called ALIAS, within the “extended data” field of the relevant network components. By keeping the naming convention of each component the same as in PowerOn, all the ALIAS were automatically imported to the extended data fields of the appropriate network components ensuring that if they need to be updated in the future, this could be done automatically. Figure 2‐3 shows the ALIAS of the SCADA data point representing the total demand of transformer T1, being included in the extended data of the transformer’s circuit breaker.

Page 13 of 54
SIX MONTHLY PROGRESS REPORTREPORTING PERIOD: JUNE 2016 – NOVEMBER 2016
Figure 2‐3 ‐ ALIAS of SCADA data points in model
Therefore, any historic SCADA data can be directly mapped to the network model, without any manual intervention. This now forms the basis of the work to follow to complete the SCADA analysis functionality in the next development stages of the tool. After checking each primary network individually, the full 11kV network model was merged to the already modelled 33kV network, resulting in a large model of 93 Primaries and 48 BSPs.
User Interface
The User Interface of the tool has seen a number of changes to reflect the modifications to its functionalities. As shown in Figure 2‐4, the user can now select the area they wish to analyse, with each area being defined as the network fed by the BSP or the Primary selected. The split of the network model into areas ensures that the speed of the tool is not compromised by the large size of the model.

Page 14 of 54
SIX MONTHLY PROGRESS REPORTREPORTING PERIOD: JUNE 2016 – NOVEMBER 2016
Figure 2‐4 ‐ APT New Job User Interface
Furthermore, the user can choose the period they want to analyse using the typical or forecast profiles and specify whether they want to evaluate the network capacity by selecting the constraint analysis option.
Network Model View
Figure 2‐5 ‐ Network Model View
The user can explore the network model through the APT interface or in IPSA. When pressing the “Modify” button within the APT as shown in Figure 2‐5, IPSA gets initiated and

Page 15 of 54
SIX MONTHLY PROGRESS REPORTREPORTING PERIOD: JUNE 2016 – NOVEMBER 2016
the user can modify the network model by adding or removing components. Then, the user can return to the APT to perform typical profile or capacity evaluation analysis on the modified network.
Results Display
The display of the results for the capacity evaluation studies was created, to enable the user to easily see the demand and generation headroom in the network. Figure 2‐6 shows the demand capacity at the Blackmoor Vodaphone 11kV busbar as a function of time for the period analysed.
Figure 2‐6 ‐ Demand capacity evaluation results example
FPL and SVO Plugins
Significant amount of learning was gained in the development and testing of the FPL and SVO plugins.
The work began with an initial technical workshop between WPD and TNEI in May 2016, to discuss the required functionalities of the plugins based on their success criteria and create the modelling specifications. Having the technical face‐to‐face meetings was a very efficient way of clarifying any open points, establishing the requirements and agreeing on the next actions. This approach is therefore recommended for making key decisions in the design and development process.
After finalising the specifications of both plugins, the delivery plan originally allowed a month for their development and testing, after which the APT would be released to WPD in the end of June 2016.

Page 16 of 54
SIX MONTHLY PROGRESS REPORTREPORTING PERIOD: JUNE 2016 – NOVEMBER 2016
It was found, however, that this process requires significantly more time to allow for the detailed testing of the software and its continuous development before it can be accepted by WPD for further user acceptance testing. It is also very important to note that the involvement of WPD in this development testing was crucial as the test results could be easily misinterpreted due to the complex nature of the technologies simulated. For this reason, the tests had to be reviewed by WPD before considered successful. Therefore, the delivery of the plugins was re‐planned and split into a number of stages. More specifically, 3 rounds of development‐testing‐review were required extending their delivery timescales by 3 months, following the procedure shown in Figure 2‐7.
Figure 2‐7 ‐ Plugin Development Procedure
When the plugins were run in the APT, it was discovered that their behaviour was different than in IPSA where they were developed and tested, due to the different way they are used in the planning tool. Therefore, additional time was allocated for the testing of the plugins within the planning tool, with the troubleshooting procedure providing good learning on the interaction of the plugins with the tool.
Simulation work has commenced with the FPL connected at the location it will be trialled as part of the Network Equilibrium project. Figure 2‐8 shows the results of one of the simulations with the active power transferred by the FPL (red line) and the reactive power support (blue line) on one of its two sides.

Page 17 of 54
SIX MONTHLY PROGRESS REPORTREPORTING PERIOD: JUNE 2016 – NOVEMBER 2016
Figure 2‐8 ‐ FPL Simulation
DNO Workshop
The tool was demonstrated to other DNOs at Workshop 3 on the 23rd of November. The attendees, representing their network planning and innovation teams, provided valuable feedback on the design and functionalities of the tool. It was generally recognised that the 48‐hour ahead forecast studies specifically could play an important role in the changing way that electricity distribution networks are operated.
Next steps
The current version of the tool will be used for further simulation work, as part of SDRC‐4, Trialling and demonstrating the EVA method.
The development of the tool will continue with the incorporation of the SCADA analysis functionality and the creation of the network model update procedures. Once the development of the tool is completed, User Acceptance Testing will take place to be followed by the training of the users in May/June 2017.
2.4 System Voltage Optimisation
The SVO method of Network Equilibrium aims to dynamically manage the voltages in the network to maximise the level of Low Carbon Technologies (LCT) that can be connected to network while maintaining statutory limits. This reporting period has seen significant progress in the design of the technology, with the technical specifications being finalised in November 2016.
Page 18 of 54
SIX MONTHLY PROGRESS REPORTREPORTING PERIOD: JUNE 2016 – NOVEMBER 2016
2.4.1 SVO Software System
Progress since initial planning meeting
After the initial planning meeting in the previous reporting period, the technical workshop was held between the 7th and 9th June at Siemens’ offices in Newcastle, with the Siemens technical team, the Network Equilibrium team and a representative from WPD’s PowerOn team. The workshop initiated the technical work, with key decisions made and future actions agreed. The main outputs included among others:
The usage of the IPSA model being developed for the APT, to import the network model into the SVO system.
Planning of further discussions between WPD Information Resources and Siemens to agree on the hardware arrangements.
Clarification of information and documents required by Siemens as part of the design phase.
After the technical workshop, a teleconference was arranged between WPD Information Resources and Siemens for the discussion of the hardware requirements. This meeting significantly changed the implementation of the SVO technology, as it led to the decision of implementing the hardware architecture following a VMWare approach, shown in Figure 2‐9.
Figure 2‐9 ‐ SVO VMWare Architecture
The VMWare architecture ensures that the system follows WPD’s preferred implementation approaches and agrees with the company’s existing procedures and systems, making it suitable for a potential future BAU roll‐out.
Page 19 of 54
SIX MONTHLY PROGRESS REPORTREPORTING PERIOD: JUNE 2016 – NOVEMBER 2016
After this, work was focused on creating the first extracts of the network model and the associated ICCP bilateral table, defining the interaction of the system with PowerOn in different operating conditions and finalising the system specifications. In October 2016, Control and PowerOn engineers received an overview training session, where Siemens presented the functionalities of the Spectrum Power 5 system. This was followed by two days of technical workshops to discuss the design specifications which are currently under review.
Network Model Development‐Identifying the information to include in the model
It was decided that the IPSA network model developed as part of the APT work, would be used to import the electrical model of the network into Spectrum Power 5. Therefore, a very important part of the work was to ensure that the model had all the information required. SVO will be receiving SCADA data in real time from PowerOn through an ICCP link. Therefore, it would be necessary for the SVO system to know to which component in the model each received analogue corresponds to. This is exactly what the role of the ICCP Bilateral Table is, as shown in Figure 2‐10. On the “SVO side” of the table, the ICCP Bilateral table associates each component in the model, identified by its unique id within the model to an ICCP ID. That ICCP ID is then associated with the analogues related to that component, identified by their unique identifiers within PowerOn (ALIAS). This means that each component in the network model associated with PowerOn Analogues should have an ICCP ID. For this reason, in the creation of the model within ISPA, an ICCP ID field was created in the extended data of such components. SVO will be receiving the following data over ICCP: • BSP Feeder demands; • Primary substation feeder demands; • Outputs of 33kV connected generators; • Demand of 33kV connected loads; • BSP Transformer load; • Primary Transformer load; • Statuses of Tele‐controlled Circuit Breakers and switches; and • Statuses of Manually Operated Circuit Breakers and switches. Therefore, the ALIAS of the above analogues had to be mapped to their unique ICCP ID, which in turn had to be mapped to the unique component ID within the model.
Page 20 of 54
SIX MONTHLY PROGRESS REPORTREPORTING PERIOD: JUNE 2016 – NOVEMBER 2016
Figure 2‐10 ‐ ICCP Link and Mapping of Analogues to the model
Network Model Development‐Reducing the model size
The network model created for the APT, however, includes the entire Network Equilibrium area of 93 Primaries and 48 BSPs. System Voltage Optimisation will be controlling the voltages in the networks of only eight BSPs and eight Primaries, therefore it was necessary to establish a methodology to only extract the network of interest for the SVO implementation. Additionally, keeping the network model size as small as possible offers the following advantages:
1. Easier management of the ICCP Bilateral table since fewer points will be transferred over ICCP.
2. Management and updating of the network model requires fewer resources and is more manageable.
However, there are certain limitations when trying to establish the network that needs to be modelled. In order for SVO to do all the appropriate calculations to find the optimal voltage set point for the substation it is controlling, the entire feeders fed by the substation need to be represented. This needs to be taken into account when deciding the boundaries of the network to be modelled. Overall, the feeders can be separated in two categories based on their end point:
Category 1: Radial feeders that have no interconnections to other feeders.
Category 2: Radial feeders that interconnect to feeders through Normal Open Points (NOP).

Page 21 of 54
SIX MONTHLY PROGRESS REPORTREPORTING PERIOD: JUNE 2016 – NOVEMBER 2016
For each substation to be modelled, the start and finish points of each feeder had to be defined. The start point of each feeder is the feeder circuit breaker at the substation under consideration. The finish point, however, is more challenging to define and depends on the feeder category. Radial feeders with no interconnections to other 33kV feeders (Category 1) are the easiest to define as the end point is simply the end of the feeder. A typical example is shown in Figure 2‐11.
Figure 2‐11 ‐ Category 1 Feeders model end boundary
Radial feeders with interconnections to other feeders through Normal Open Points (NOP) are more complicated. One could suggest that the end point of such feeders is the NOP, so the network should be modelled up to that point. This, however, is true only under normal running arrangements. If the network is modelled only up to that point within the SVO system, then in the case of network reconfiguration (either permanent or in fault situations), SVO will not be able to have a true picture of network operation and will result in incorrect state estimation. This is shown in Figure 2‐12.
Figure 2‐12 ‐ (a) SVO model End boundary at NOP and (b) effect in abnormal running conditions.
Therefore, it is clear that for Category 2 feeders, the network beyond the NOP should be modelled too, with the model end point being the circuit breaker of the neighbour BSP. In this example, the end point is CB2 of BSP2 as shown in Figure 2‐13.

Page 22 of 54
SIX MONTHLY PROGRESS REPORTREPORTING PERIOD: JUNE 2016 – NOVEMBER 2016
Figure 2‐13 ‐ Category 2 Feeders correct model boundary
It is important to note that the same holds for any feeder T‐offs that reach a NOP. The network model should include the feeder beyond the NOP, up to the circuit breaker of the neighbour BSP. This is for every feeder category. Furthermore, if there are further NOPs after the first NOP, the network beyond those should be included in the model, as demonstrated in Figure 2‐14, if the feeders are to be fully modelled to keep the optimisation running under any network configuration.
Figure 2‐14 ‐ Modelling beyond all NOPs.
When considering the 11kV network due to its complex interconnectivity, if the feeders of each SVO controlled substation were to be modelled beyond all NOPs then a large number of substations would need to be modelled. To be able to establish the most appropriate model boundaries, a detailed network connectivity investigation study was undertaken. As part of this work, a spreadsheet was extracted from the PowerOn system that listed all switches connected to the feeders of each primary up to the first NOP. A python script was then created to analyse this data. By finding with which substations each SVO controlled Primary substation has common switches, its immediate neighbours were identified. This is demonstrated in Figure 2‐14 where NOP1 is the common switch between the SVO substation and one of its neighbours, BSP2. In summary, the analysis has shown that in order to model the eight SVO primaries beyond their NOPs and up to their first neighbour, around 40 Primary substations would need to be modelled (assuming the full networks of the neighbour substations are modelled). As shown in Figure 2‐14, it is very likely that another NOP could exist beyond the first (NOP2). If the feeder beyond that NOP is not modelled, and both NOP1 and NOP2 move in the case of real‐time network reconfiguration, the SVO system will have errors in its state estimation as it will be considering the wrong network model.

Page 23 of 54
SIX MONTHLY PROGRESS REPORTREPORTING PERIOD: JUNE 2016 – NOVEMBER 2016
Therefore, further analysis has been performed to find the substation feeding the network beyond the second NOP, following a similar logic as before. This substation has been called “the second degree neighbour”. The analysis performed has shown that if both first and second degree neighbours are included in the model, around 60 Primary substations would need to be modelled. It is clear that even if all SVO controlled substations were to be modelled only up to their first neighbour, a large number of substations would need to be modelled. For this reason, it was decided to model four Primary substations up to their first NOP and four substations up to their first neighbour. By prioritising the substations with the largest number of neighbours, it was decided to model the following substations up to their first NOP: 1. Waterlake; 2. Millfield; 3. Colley Lane; and 4. Marsh Green. Substations 1 and 3 will have a MicroTapp relay and 2 and 4 will have the SuperTapp SG, enabling us to trial the partly modelled substations with both relays. In the case of abnormal running conditions, optimisation will automatically stop for the substations modelled only up to their first NOP. The substations that will be modelled beyond their first NOP are: 1. Nether Stowey; 2. Lydeard St Lawrence; 3. Tiverton Moorhayes; and 4. Dunkeswell. For these substations the feeder up to the first neighbour will be modelled. The neighbour’s 11kV busbars, and 33/11kV transformers will also be modelled. This is demonstrated in Figure 2‐15.

Page 24 of 54
SIX MONTHLY PROGRESS REPORTREPORTING PERIOD: JUNE 2016 – NOVEMBER 2016
Figure 2‐15 ‐ Demonstration of modelling beyond the first NOP
In the case that the first NOP moves, optimisation will continue to run for the fully modelled substations since SVO will have the correct model to base its state estimation on. Discussions are currently ongoing on whether two of these substations should be modelled up to their second degree neighbours, to ensure that even if the second NOP moves, SVO can continue optimising. Similar work is currently undertaken for the 33kV network to determine the networks to be modelled for the SVO controlled BSPs.
Next Steps
After the import of the network model into Spectrum Power 5 is completed, the ICCP Bilateral table will be agreed between WPD and Siemens and the model and data validation work will commence. The Factory Acceptance Testing will then follow in May 2017, after which the network model will be re‐imported and validated just before the installation of the system at WPD’s premises. Then, in June 2017, Siemens will provide training on the updating of the model such that this can be undertaken while the System Integration Testing is being done in July 2017, ensuring that the system doesn’t go out of date before the User Acceptance Testing and the System Acceptance Testing.
2.4.2 SVO Site Works
In the last reporting period, analysis was carried out to select the 16 substations participating in the SVO trials and to determine the AVC relay that would be used on those sites to implement SVO. The sixteen substations were broken down to eight Bulk Supply Points and eight Primary substations. Of the 16 sites, three contained MicroTAPP relays that have the ability to programme multiple pre‐determined voltage settings and would be used to test the ability of the SVO when operating a previous generation relay. The remaining 13 substations would all have the Fundamentals SuperTAPP SG installed that has the ability to receive new voltage set points directly from the existing WPD Control system. During this reporting period, design work has started on the integration of new hardware to enable SVO at the selected substations, the SuperTAPP SG relay has been approved for use on the WPD network and work has progressed on the understanding of the real world operation of the SVO system.

Page 25 of 54
SIX MONTHLY PROGRESS REPORTREPORTING PERIOD: JUNE 2016 – NOVEMBER 2016
Relay Approval
As previously reported, the Fundamentals SuperTAPP SG was selected as the AVC relay for the SVO Method but was still undergoing type testing and therefore was not approved by the WPD policy team for installation on the network. The SuperTAPP SG is an upgraded model of the SuperTAPP N+ that is currently approved for use on the WPD network. The SG version of the relay enables the ability to send fine voltage set points via the existing WPD communications network. During this reporting period work continued with both the manufacturer and WPD Policy Engineers with approval of the relay for the project being granted in August 2016.
Substation Design Works
To ensure the successful delivery of the SVO method, the project design team have worked closely with WPD Engineering Design, Primary System Design and Telecoms engineers. This work has focused primarily on the development of a standard design for the SVO method that can then modified to tie in with the existing equipment at each substation. Table 2‐1 below shows the current status of the SVO substation design works at the end of this reporting period. It is forecast for all substation design works to be completed by the end of February 2017.
Table 2‐1: SVO Substation Design Completion to Date
Substation SVO Design Completion Date
Waterlake 09/09/2016
Colley Lane 16/09/2016
Lydeard St Lawrence 16/06/2016
Tiverton BSP 09/09/2016
Tiverton Moorhayes 16/09/2016
Radstock 30/09/2016
Bowhays Cross 30/09/2016
Exeter City 14/10/2016
Millfield 28/10/2016
Exeter Main 28/10/2016
Common Design Decisions
The following design decisions were made to provide consistent operation philosophy across all the SVO substations. Firstly, it was decided that the design would have a single SVO control switch that would enable/disable the SVO system for the whole substation. This requirement was identified during the design risk analysis where if the SVO system could be turned on and off for individual transformers within a substation it would cause a substantial operational risk. For example, if two AVC relays operating in parallel were placed in different operating modes with different voltage set points, it is likely that the relays would operate against each other leading to a run‐away of both transformer tap changers.

Page 26 of 54
SIX MONTHLY PROGRESS REPORTREPORTING PERIOD: JUNE 2016 – NOVEMBER 2016
The second feature added for safe operation of the SVO system was the inclusion of a “Communications Fail” switch for each substation. On the loss of the communications between WPD Control and the substation, the Remote Terminal Unit (RTU) in the substation will issue a command to the disable the SVO system, returning all the AVC relays to the pre‐determined safe voltage setting. Finally, it was decided to retain the existing logic system which determined if the site was running with two or more transformers in parallel. Despite the SVO control system knowing the configuration of each substation, due to the inherent delays in the communications network, the on‐site logic must be maintained when operating in SVO mode and not determined by the remote SVO control system.
MicroTAPP Relay
The MicroTAPP relay has the ability to be pre‐programmed with eight individual settings groups. However, for any given voltage set point two settings groups are required; one for parallel operation and one for independent operation. This reduces the number of user defined voltage set points to four as outlined in Table 2‐2 below.
Table 2‐2: MicroTAPP Setting Designation for SVO Operation
Group Setting
Setting 1 Existing Setting (Parallel)
Setting 2 Existing Setting (Independent)
Setting 3 New ‘X’ Setting (Parallel)
Setting 4 New ‘X’ Setting (Independent)
Setting 5 New ‘Y’ Setting (Parallel)
Setting 6 New ‘Y’ Setting (Independent)
Setting 7 New ‘Z’ Setting (Parallel)
Setting 8 New ‘Z’ Setting (Independent)
In order for the SVO system to select the most appropriate setting group from those listed in Table 2‐2 above the MicroTAPP relay requires four interposing relays that are controlled via SCADA. In order to implement the common design principles and safeguards a large amount of additional wiring is required to ensure consistent and reliable operation of the SVO system. The complexity of the wiring has also led to an increase in the number of design checks required and also moves away from the general WPD philosophy to keep things simple. Figure 2‐16 below shows the schematic diagram for the telecontrol wiring required to select and automatically deselect SVO settings for the MicroTAPP relay.

Page 27 of 54
SIX MONTHLY PROGRESS REPORTREPORTING PERIOD: JUNE 2016 – NOVEMBER 2016
Figure 2‐16: Schematic Diagram of SVO Group Selection Telecontrol Wiring
The amount of hardware required to implement SVO on the MicroTAPP relay has meant that all the equipment can not fit within the existing control cabinets. This has meant the equipment will be installed in an additional cabinet at each site. The benefit of this is that assembly and initial commissioning can be carried out off site minimising any site outages.
SuperTAPP SG Relay
Design work to integrate the SuperTAPP SG has focused on the integration of the relay with existing transformer tap change controllers. The increased functionality of the relay over the existing relays installed at each site requires additional I/O to be wired out. The most critical function not currently utilised is the indication of tap change in progress, potentially requiring additional wiring within the tap changer mechanism within the transformer.

Page 28 of 54
SIX MONTHLY PROGRESS REPORTREPORTING PERIOD: JUNE 2016 – NOVEMBER 2016
The existing tap change control panels at each substation are up to 30 years old and as such have been designed around different sized relays. In order to get a balance between cost, transformer outage time and total installation/commissioning time, each site is being assessed on a case by case basis to determine the most suitable installation method. Typically this has been the manufacture of replacement doors for the sites currently utilising KVGC relays and the modification of existing panels for MVGC and SuperTAPP N+ sites.
Figure 2‐17: Outline GA of SuperTAPP SG Tap Change Control Panel
Installation Works
During this reporting period, AVC relays and interposing relays have been purchased and the first orders placed with a panel manufacturer. Installation works will being in the next reporting period with all substation installation works currently scheduled for completion by the end of September 2017.

Page 29 of 54
SIX MONTHLY PROGRESS REPORTREPORTING PERIOD: JUNE 2016 – NOVEMBER 2016
Relay Settings
All AVC relay voltage settings are programmed with an allowable voltage bandwidth where the relay will not issue a tap change operation command. This is to prevent the relay from hunting for a suitable tap position.
MicroTAPP
To determine the most suitable settings for the MicroTAPP relay, three potential options were examined.
1. Separate setting around 3% apart, to minimise the amount of bandwidth overlap between settings
2. Separate setting 1.5% apart, with the top half of one settings bandwidth being covered by another settings lower bandwidth
3. Ignore bandwidth and apply set points at any voltage to cover the most frequent voltage targets (as per study results).
It was decided to initially configure the relay settings as per option 2 above. Figure 2‐18 below provides a overview of how the different settings groups would overlap. This option limits the spread of the settings ensuring a high probability of all groups being used while still providing a wide enough spread that a full assessment of the SVO can be made.
Figure 2‐18: MicroTAPP SVO Settings Example
SuperTAPP SG
The SuperTAPP SG relay, being an iteration of the existing N+ relay, will be programmed and commissioned as per the current WPD policy. To enable the relay for SVO, additional groups will be set up as a direct copy of the standard settings but will be enabled to accept updated voltage set points via DNP3.

Page 30 of 54
SIX MONTHLY PROGRESS REPORTREPORTING PERIOD: JUNE 2016 – NOVEMBER 2016
2.4.3 Network Monitoring
11kV Remote Voltage Monitoring
Identification
Following the completion of network studies, the points on the 11kV network with the theoretical minimum voltage were identified. To determine the most suitable point of connection for monitoring equipment further detailed analysis of the network was carried out to ensure the identified points were not on the same feeders from the substation and then to choose the most suitable connection point based on the ease of installation. Initially four remote end points have been identified for each substation with each point requiring either a pole mounted or ground mounted monitoring solution. Network studies also identified key generation sites also requiring installation of voltage monitoring equipment. Table 2‐3 below provides a breakdown of the required design solutions.
Table 2‐3: Breakdown of 11kV Voltage Monitoring Installation Types
Installation Type Number of Connections Required
11kV Generation Sites 15
11kV Overhead Line 26
Ground Mounted Distribution Substation 9
Design Solutions
For each voltage monitoring connection type outlined in Table 2‐3, a single design solution is being created for each installation type. Existing key generation sites contain a WPD RTU that is used for the control of WPD circuit breakers and interfacing with the customer’s substation. All sites have a Voltage Transformer (VT) installed for metering purposes and therefore the output from this VT, depending on the installed RTU, will either be connected direct or through a transducer to the RTU to be sent back to WPD Control. For pole mounted installations it is proposed to install a single phase VT directly to the 11kV overhead line to provide a direct HV voltage reading. For ground mounted substations where it is not possible to install a VT on the HV network, it is proposed to connect directly to the LV network recording both LV voltage and currents to allow for the calculation of the HV voltage using the static distribution impedance value. For both pole mounted and ground mounted solutions it is proposed to use a single monitoring cabinet design with a WPD approved RTU and modem to report the analogue information back to PowerON. As the monitoring of the network is used for the verification of the SVO control system and not for making control decisions, the hardware required can be simplified to reduce maintenance requirements and potential points of failure. Figure 2‐19 below provides an overview of the connection method for the three types of monitoring location.

Page 31 of 54
SIX MONTHLY PROGRESS REPORTREPORTING PERIOD: JUNE 2016 – NOVEMBER 2016
11kV Generation Site 11kV Overhead Line 11kV Ground Mounted
Substation Figure 2‐19: Overview of Proposed Monitoring Connection Options
Transformer Tap Position Indication
For the SVO control system to ensure that all tap changers on the primary transformers connected to an SVO enable BSP remain within a safe operating window, accurate tap position indications are required in PowerON. Analysis of the existing data has shown that there are currently 22 number of primaries without tap position information being sent to PowerON. Further onsite investigations are required to determine if monitoring equipment is installed or not and if so what modifications are required for the data to be recorded. For sites without any tap position indication installed, a retro fit solution to be installed within the existing tap change control panel has been designed.

Page 32 of 54
SIX MONTHLY PROGRESS REPORTREPORTING PERIOD: JUNE 2016 – NOVEMBER 2016
2.5 Flexible Power Link
2.5.1 Introduction
The Flexible Power Link (FPL) Method aims to overcome voltage and thermal issues associated with paralleling different network groups by coupling them together using back‐to‐back AC‐DC converters. Implementation of the FPL Method will increase the level of flexibility in the network by transferring excess power from one network group to another. The FPL Method involves the following stages:
Specification of the FPL;
Procurement of the FPL;
Determine substation location for FPL installation;
Design of the FPL network connection;
Design review of the chosen FPL technology;
Tender documentation for the installation of the FPL and associated works;
Production of policy documentation for the operation, control, inspection and maintenance of the FPL;
Assembly and testing of the FPL;
Installation and commissioning of the FPL; and
Trial period of the FPL including knowledge capture and dissemination of the method.
2.5.2 Overview
During the last reporting period the site selection process for the FPL was completed. Exebridge 33/11kV substation was found to have the best overall score and this site was selected for the installation of the FPL. In addition, work was carried out to specify the switchgear, auxiliary systems and telecom requirements to integrate the FPL into the 33kV network. In this reporting period the contract with the FPL supplier (ABB) has been signed and work has proceeded with the detailed design of the FPL and the works to integrate the FPL into the 33kV network at Exebridge 33/11kV substation. The following sections detail the progress made in this reporting period in more detail.
2.5.3 Technology
The ABB FPL will be designed and built at their office and factory facilities in Turgi, Switzerland. An initial design meeting was held with ABB at their Turgi facilities on the 30th June 2016. A number of topics were discussed including the site layout; the design of the converter, transformer and harmonic filter; the testing requirements and health and safety. During this time WPD also attended a due diligence visit of the factory facilities where the converter will be built and tested as well as a site visit to a previous converter installation. A second design meeting took place between WPD and ABB engineers in WPD’s Taunton office in August 2016. This meeting focussed on the FPL design in more detail prior to the submission of the stage 1 detailed design documentation. The converter transformer was

Page 33 of 54
SIX MONTHLY PROGRESS REPORTREPORTING PERIOD: JUNE 2016 – NOVEMBER 2016
the highest priority as this piece of equipment has the longest build lead time. Significant progress was made on refining the transformer specification to suit the requirements of WPD. The layout of the FPL at Exebridge was further discussed with particular emphasis on the most efficient positioning of the equipment to reduce the extent of the civil works and to identify and mitigate risks associated with the installation. The interface between the FPL and WPD control systems was discussed at this meeting as well as the protection philosophy of the device.
Detailed Design Submissions
The contract for the FPL includes two main milestones for the design of the FPL:
Stage 1 detailed design; and
Stage 2 detailed design The submission of the two stages of detailed design allowed WPD to review and comment on ABB’s design proposals prior to the device being built. The stage 1 detailed design was submitted to WPD during this reporting period, on 28th September 2016. The stage 1 detailed design consists of the following design documentation:
Outline design report;
Single Line Diagram;
Foundation plan;
Earthing layout;
Control concept description;
Protection concept description;
Transformer specification; and
Draft testing specification. A thorough design review of the ABB documentation has taken place. Comments for the complete design pack were issued to ABB on 11th October 2016 and ABB resubmitted the documentation to address the comments on 31st October 2016. The stage 2 detailed designs followed after finalising the documentation reviewed under stage 1. The list of documentation for stage 2 is now agreed with ABB and consists of:
General arrangements;
Control specification;
Interface signal list;
Electrical circuit diagrams;
Protection settings;
HMI specification;
Transformer detailed design documentation;
Filer detailed design;

Page 34 of 54
SIX MONTHLY PROGRESS REPORTREPORTING PERIOD: JUNE 2016 – NOVEMBER 2016
Cooling system specification;
Earthing plan; and
Installation and operation manuals. A detailed design review will take place for the stage 2 designs prior to final design approval, January 2017, and the start of the build activities.
2.5.4 Site Enabling Works
Overview
The ownership boundary of Exebridge 33/11kV substation is defined by a wire fence around the circumference of the site. The western edge of the site is bordered by the main road between Exebridge and Dulverton with the rest of the site surrounded by third party arable land. The site has a relatively large footprint, however the space is currently taken up by a large outdoor 33kV compound. In addition, there are a number of wooden poles which are located around the site for the incoming 33kV Overhead Line (OHL) supplies and auxiliary supplies to the substation. Enabling works have been planned to allow for the 33kV outdoor compound to be removed and areas cleared to enable the FPL to be located within the existing site. The existing outdoor 33kV switchgear will be replaced by a new 33kV indoor switchboard as detailed in SDRC‐3.
Surveys
A number of site surveys have been implemented at Exebridge 33/11kV substation during this reporting period. The surveys provide an accurate model of the site to inform the design, layout and staging of the works. This reduces the risk associated with the installation of the FPL and the associated equipment. The site surveys that have been undertaken are as follows:
Topographical Survey – this survey accurately mapped and identified the existing equipment, civil structures, levels and surrounding vegetation. This survey has formed the basis of the layout drawings that have been produced in conjunction with ABB.
Underground Utility Survey – this survey accurately mapped the location and depth of the various underground utilities at the Exebridge site. It has identified that there are no major underground services or structures in the vicinity of the proposed location for the installation of the FPL and the new switchroom building.
Geotechnical Survey – this survey involved investigating the ground conditions in the compound to establish the bearing capacity. This is required to inform the design for the foundations for the new equipment, in particular the converter transformer which will have a largest mass of all the new equipment being installed.
3D Laser Scan – a full survey of Exebridge substation using the latest 3D scanning technology was undertaken. The information from this 3D laser scan can be used to accurately measure the existing position of equipment allowing for efficient design for the integration of new equipment.

Page 35 of 54
SIX MONTHLY PROGRESS REPORTREPORTING PERIOD: JUNE 2016 – NOVEMBER 2016
Terminal Poles
There are a number of wooden terminal poles located inside the compound at Exebridge substation. One is an existing 33kV OHL terminal pole connecting the OHL feeder from Taunton to the switchgear in the Exebridge 33kV substation compound. The pole is to be moved because it is impeding the extension of the 33kV substation compound for the FPL equipment. An additional 33kV OHL terminal pole has been installed and connected into the OHL feeder circuit to Taunton during this reporting period. It has been installed outside the substation boundary fence in an adjacent field and connected to the existing terminal pole. The new terminal pole will replace the existing pole when it is removed as part of the staging works for the FPL installation. A photograph of the new 33kV OHL terminal pole is shown in Figure 2‐20.
Figure 2‐20: Photograph of the new OHL terminal pole on the OHL feeder to Taunton
There are also two pole mounted 11/0.415kV transformers (refer to Figure 2‐21) within the compound which provide the existing LVAC supply at Exebridge. The two pole mounted transformers are rated 25kVA each and provide the complete substation auxiliary load. The capacity of these transformers is insufficient for the combined additional auxiliary loads of the new 33kV switchgear and the FPL. In addition, they require to be removed to create sufficient space outside the 33kV substation compound for transport and delivery of materials to site. The two pole mounted units will be removed and replaced by two 500kVA unit substations.

Page 36 of 54
SIX MONTHLY PROGRESS REPORTREPORTING PERIOD: JUNE 2016 – NOVEMBER 2016
Figure 2‐21: Photograph of the existing pole mounted 11/0.415kV transformers supplying Exebridge auxiliary loads
2.5.5 33kV switchgear
As detailed in SDRC‐3 the existing 33kV outdoor switchgear at Exebridge will be replaced with new indoor 33kV switchgear to create space to install the new FPL equipment. The new switchboard will replace the existing equipment to include circuit breakers to enable the connection of the FPL. A single line diagram of the new arrangement is shown in Figure 2‐22.

Page 37 of 54
SIX MONTHLY PROGRESS REPORTREPORTING PERIOD: JUNE 2016 – NOVEMBER 2016
Figure 2‐22: Single Line Diagram showing the new 33kV switchboard
The 33kV switchgear chosen for installation is Siemens NX Plus 33kV 1250A single busbar. The switchgear has been specified in line with WPD’s framework contract with modifications for the FPL circuit breakers. These modifications include:
VTs for check sync purposes across the FPL;
Additional CTs for ABB control and measurement;
Interlocking to allow safe earthing of the FPL; and
Additional controls for the operation of the FPL.
These items have been included in the switchgear order following technical discussions with Siemens and the order for the switchgear has now been placed.
2.5.6 Layout
One key milestone that has been achieved during this reporting period was finalising the layout of the new FPL equipment and switchgear at Exebridge. Through discussions with ABB the optimal layout has been determined based on:
Safe access to equipment for operation and maintenance;
Sufficient clearance and lay down area for installation; and
Optimal equipment positioning to limit the extent of civil works.
These discussions included changes to the original equipment layout proposed by ABB to improve the overall safety of the design. Principally, the position of the transformer was changed to allow “skidding” as a method of off‐loading the transformer and the harmonic filter was raised in height to prevent operatives coming into contact with exposed live conductors. Cost and risk analysis was carried out to establish whether the new 33kV switchgear should be installed within a purpose built container or a brick built building. The analysis revealed that the costs for the brick built building were much lower than the container solution and

Page 38 of 54
SIX MONTHLY PROGRESS REPORTREPORTING PERIOD: JUNE 2016 – NOVEMBER 2016
there was much more flexibility in the configuration of the brick solution. A final layout of the site can be seen in Figure 2‐23 with the modifications and additions shown in red.
Figure 2‐23: Layout of new equipment at Exebridge 33/11kV
The final arrangement of the site is achieved through a number of individual steps. These steps have been carefully considered and a staging plan has been developed detailing how each step will be carried out. In developing the staging plan it was critical to ensure that each step could be carried out safely with as low a risk to customers’ supplies as reasonably as practicable. The main stages of the plan are as follows:
Enabling works to replace LV supplies;
Construction of the new 33kV switchroom;
Installation of 33kV switchgear and auxiliary systems;
Swapping of 33kV circuits from the old switchgear to the new switchgear;
Clearing of the existing 33kV outdoor compound; and
Installation and connection of the FPL equipment.
The staging plan has now been finalised and work is progressing to produce the detailed civil and electrical design for each phase.

Page 39 of 54
SIX MONTHLY PROGRESS REPORTREPORTING PERIOD: JUNE 2016 – NOVEMBER 2016
2.5.7 FPL Control Module
Network Equilibrium’s FPL will be used to transfer active power (P) between two separate 33kV networks and will also provide independent reactive power (Q) support on both sides. The amount of active power to be transferred (P set point) and reactive power to be absorbed/supplied (Q set points) will be determined dynamically, in real‐time by an external control system which will then send the calculated set points to the FPL. This external control system will have a complete view of the network operation by receiving real‐time information including power flows, voltages and currents. Using the received information, the active power to be transferred and the reactive power to be supplied/absorbed will be determined such that any network thermal or voltage constraints are removed. Siemens’ Spectrum Power 5 will be used for this purpose and will communicate with Western Power Distribution’s (WPD’s) Network Management System (NMS) to exchange all necessary information. This is demonstrated in Figure 2‐24.
Progress in this reporting period
At the beginning of the work, a number of power system studies have been performed to simulate the behaviour of the FPL and specify the objective of its operation. From this, the first draft of the Control Logic was created and the requirements for the FPL Control Module were identified, creating the specification of the technology at the beginning of this reporting period.
Figure 2‐24 ‐ FPL Control System Architecture

Page 40 of 54
SIX MONTHLY PROGRESS REPORTREPORTING PERIOD: JUNE 2016 – NOVEMBER 2016
Following the creation of the specification, a number of suppliers that have good experience in systems that interact with PowerOn were invited to submit implementation proposals for the FPL Control Module. After careful consideration of the options available, in October 2016, Nortech was awarded the contract. The kick‐off meeting took place on the 21st October, when the delivery plan was agreed, formally commencing the work. A number of meetings followed, to discuss the control logic already developed by WPD, the IPSA network model and licensing requirements and the preparations required for the ICCP work.
The development of the control logic
In order to develop the FPL control logic a number of Power System studies were performed which simulated the FPL operation under different scenarios and provided valuable knowledge on the complexity of the FPL operation. The aim of the Network Equilibrium project is to release network capacity to enable more LCTs to connect. It follows that the objective of the FPL should be to minimise the two biggest constraints that prevent the connection of LCTs: system voltage approaching the statutory limits and network assets reaching their thermal capacity. The general way it will achieve is by using its reactive power support capability for voltage support, addressing the voltage constraints, while the active power transfers will be used to balance the demand and generation between the two networks, removing any thermal constraints. The first objective of the analysis was to specify the degree of optimisation that was required and determine the cases when the FPL would be required to act. It was therefore of interest to understand the impact the network balancing has in the system losses and whether its benefits were comparable to the FPL losses.

Page 41 of 54
SIX MONTHLY PROGRESS REPORTREPORTING PERIOD: JUNE 2016 – NOVEMBER 2016
Figure 2‐25 ‐ Power transfer simulations logic
If for example, the benefit from the decrease in losses due to a power transfer appeared to be greater than the losses within the FPL device, then it would suggest that the FPL should be used for optimal balancing at all times. If the opposite was proved, then it would recommend using the FPL only when it’s needed, just to remove the network constraints. The network was considered in a number of scenarios, each representing different loading conditions. The aim was to understand the impact of the FPL power transfers in the losses under each scenario, as this would indicate the expected overall benefit in all operating conditions. With the use of a Python script, a number of active power transfers were simulated between the two sides and the impact on the losses was captured in each case. Note that only active power transfers were taken into account and for simplicity, no voltage limit or thermal checks have been performed. The logic programmed to calculate and perform the power transfers is shown in the flow chart of Figure 2‐25.

Page 42 of 54
SIX MONTHLY PROGRESS REPORTREPORTING PERIOD: JUNE 2016 – NOVEMBER 2016
Initially, the percentage loading of each BSP is calculated to indicate how loaded each BSP is. Then, if one of the two BSPs is loaded by more than 80%, the minimum amount of power to be transferred to remove the overload is calculated. This is done using the equation:
∗
where is the power to be transferred, is the percentage loading of the
BSP and is the firm capacity of the BSP. The calculated was then
simulated and the change in losses was recorded. The analysis has shown that the total system losses can actually increase even if the transformer losses are improved with the improvement in their loading. This is because of the way the power transfer affects the loading of the feeders, increasing the feeder losses and causing an overall increase in total system losses. This is demonstrated in Figure 2‐26.
Figure 2‐26 ‐ Feeder loading affected by power transfers
Therefore, the main conclusion from the power system studies was that the FPL should not continuously optimise the network but only act when it is necessary to remove constraints. After the power system studies were completed, the first draft of the logic was created. The logic was generally shaped around the following principles:
The FPL acts only when a voltage or a thermal violation occurs;
A voltage violation is defined as any busbar on the two feeders going outside pre‐defined threshold limits;
A thermal violation is defined as the percentage loading of any of the two BSPs exceeding the pre‐defined threshold limits; and
By being able to change the pre‐defined voltage and thermal threshold limits that trigger the FPL to act, the optimisation degree can be fully adjustable.

Page 43 of 54
SIX MONTHLY PROGRESS REPORTREPORTING PERIOD: JUNE 2016 – NOVEMBER 2016
The logic diagram is shown in Figure 2‐27.
Figure 2‐27 ‐ Basic FPL Control Logic
The FPL Control Module System
The system will consist of two i‐Host servers communicating with PowerOn, in a configuration that provides redundancy with one running as the Primary server and the other as the Standby server. The communication between PowerOn and the FPL Control Module will be achieved through an ICCP link, to enable the exchange of monitoring information and controls between the two. This is shown in Figure 2‐29. The servers will be implemented as virtual machines that will be running on different hosts, as shown in Figure 2‐28.

Page 44 of 54
SIX MONTHLY PROGRESS REPORTREPORTING PERIOD: JUNE 2016 – NOVEMBER 2016
Figure 2‐28 ‐ Virtual system implementation
Figure 2‐29 ‐ FPL Control Module System
Next steps
The already developed control logic has been reviewed and a number of modifications have been agreed to optimise it. The first draft of the revised logic will be prepared by the end of November as part of the preparation work for the FPL Control Logic Specification. The FPL Control Logic and Functional Specifications will be the main design documents produced, finalising the design stage at the end of March 2017. Following the design finalisation, the Factory Acceptance Testing will be completed, proving the operation of the system, before the System Integration Testing (SIT) between the Control Module and the offline PowerOn system in May 2017. After the SIT, WPD will trial the system before proceeding to the Site Acceptance Testing (SAT) during which the system will be connected to the online PowerOn and fully tested. The SAT is scheduled to be completed the first week of October 2017.

Page 45 of 54
SIX MONTHLY PROGRESS REPORTREPORTING PERIOD: JUNE 2016 – NOVEMBER 2016
3 Business Case Update
There is no change to the business case. The business case to further facilitate the connection of low carbon loads and generation in the project area, on both the 11kV and 33kV are still applicable.

Page 46 of 54
SIX MONTHLY PROGRESS REPORTREPORTING PERIOD: JUNE 2016 – NOVEMBER 2016
4 Progress against Budget
Table 4‐1: Progress against budget
Total Budget Ex
pected
Spend to
Date Nov
2016
Actual Spend
to date
Variance £
Variance %
Labour 1262 316.3 307.0 ‐9.3 ‐3%
WPD Project Management & Programme office 510 191.0 189.2 -1.8 -1% Project Kick Off & Partner / Supplier Selection 33 33.0 33.0 0.0 0% Detailed design & modelling 101 81.3 74.1 -7.2 -9% Installation of Equipment ‐ 11kV & 33kV 390 0.0 0.0 0.0 0% FPL Technologies ‐ Substation Installation 33kV 141 5.5 5.4 -0.1 -2% Capture, analyse & verify data for EVA, SVO & FPL 58 0.0 0.0 0.0 0% Dissemination of lessons learnt 29 5.5 5.3 -0.2 -3% Equipment 6691 567.0 566.0 ‐1.0 0%
Project Kick Off & Partner / Supplier Selection 2 2.0 2.0 0.0 0%
Procurement of SVO Equipment 1540 220.5 219.5 ‐1.0 0%
Procurement of FPL Technologies 33kV 4550 344.5 344.5 0.0 0%
FPL Technologies ‐ Substation equipment 33kV 599 0.0 0.0 0.0 0%
Contractors 3339 758.0 737.5 ‐20.5 ‐3%
Detailed design & modelling 804 605.0 593.3 -11.7 -2% Delivery of SVO Technique ‐ 11kV & 33kV 392 80.0 75.5 -4.5 -6% Installation of Equipment ‐ 11kV & 33kV 850 0.0 0.0 0.0 0% Implementation of Solution 46 22.5 20.8 -1.7 -8% Implementation of Solution 139 0.0 0.0 0.0 0% FPL Technologies ‐ Substation Installation 33kV 540 22.0 20.6 -1.4 -7% Capture, analyse & verify data for EVA, SVO & FPL 445 7.5 6.9 -0.6 -8% Dissemination of lessons learnt 123 21.0 20.5 -0.5 -2% IT 396 66.2 62.3 ‐3.9 ‐6%

Page 47 of 54
SIX MONTHLY PROGRESS REPORTREPORTING PERIOD: JUNE 2016 – NOVEMBER 2016
1. WPD ‐ Advanced Network Modelling and Data Recovery 130 35.0 32.1 -2.9 -8% 1. WPD ‐ Procurement of SVO Equipment 60 9.2 8.6 -0.6 -7% Installation of Equipment ‐ 11kV & 33kV 60 0.0 0.0 0.0 0% 6. WPD ‐ Implementation of Solution 46 21.0 20.8 -0.2 -1% FPL Technologies ‐ Substation Installation 33kV 100 1.0 1.0 0.0 -5% Travel & Expenses 159 65.0 61.7 ‐3.3 ‐5%
Travel & Expenses 159 65.0 61.7 ‐3.3 ‐5%
Contingency 1190 0.0 0.0 0.0 0%
Contingency 1190 0.0 0.0 0.0 0%
Other 53 10.0 9.9 ‐0.1 ‐1%
Other 53 10.0 9.9 ‐0.1 ‐1%
TOTAL 13091 1782.5 1744.4 ‐38.1 ‐2%
5 Successful Delivery Reward Criteria (SDRC)
5.1 Future SDRCs
Table 5‐1 captures the remaining SDRCs for completion during the project life cycle.
Table 5‐1 ‐ SDRCs to be completed
SDRC Status Due Date Comments
4 ‐ Trialling and demonstrating the EVA Method Green 27/01/2017 On track
5 ‐ Trialling and demonstrating the SVO Method Green 20/04/2018 On track
6 ‐ Trialling and demonstrating the FPL Method Green 05/10/2018 On track
7 ‐ Trialling and demonstrating the integration of the EVA, SVO and FPL Methods
Green 28/12/2018 On track
8 ‐ Knowledge capture and dissemination Green 12/04/2019 On track
Status Key:
Red Major issues – unlikely to be completed by due date
Amber Minor issues – expected to be completed by due date
Green On track – expected to be completed by due date

Page 48 of 54
SIX MONTHLY PROGRESS REPORTREPORTING PERIOD: JUNE 2016 – NOVEMBER 2016
6 Learning Outcomes
Significant learning has been generated throughout all three methods to support the next SDRCs. The next SDRC, SDRC‐4, will be delivered on or before the 27th January 2017 and the learning captured will be robustly captured and shared in this report. This learning focusses on the design requirements of an active model to be used for both long term and outage planning, along with the requirements to facilitate its regular updating.
7 Intellectual Property Rights
A complete list of all background IPR from all project partners has been compiled. The IP register is reviewed on a quarterly basis. No relevant foreground IP has been identified and recorded in this reporting period.
8 Risk Management
Our risk management objectives are to:
• Ensure that risk management is clearly and consistently integrated into the project management activities and evidenced through the project documentation;
• Comply with WPDs risk management processes and any governance requirements as specified by Ofgem; and
• Anticipate and respond to changing project requirements.
These objectives will be achieved by:
Defining the roles, responsibilities and reporting lines within the Project Delivery Team for risk management
Including risk management issues when writing reports and considering decisions Maintaining a risk register Communicating risks and ensuring suitable training and supervision is provided Preparing mitigation action plans Preparing contingency action plans Monitoring and updating of risks and the risk controls.

Page 49 of 54
SIX MONTHLY PROGRESS REPORTREPORTING PERIOD: JUNE 2016 – NOVEMBER 2016
8.1 Current Risks
The Network Equilibrium risk register is a live document and is updated regularly. There are currently 60 live project related risks. Mitigation action plans are identified when raising a risk and the appropriate steps then taken to ensure risks do not become issues wherever possible. In Table 8‐1, we give details of our top five current risks by category. For each of these risks, a mitigation action plan has been identified and the progress of these are tracked and reported.
Table 8‐1 ‐ Top five current risks (by rating)
Details of the Risk Risk Rating
Mitigation Action Plan Progress
The full and final APT will not be available to support the delivery of SDRC‐4
Major
Ensuring appropriate plan is in place and resource.
Weekly Updates are being provided.
Key personnel leave the project
Major
Rigorous and robust documentation of work. Induction Package to aid new starters
All work and learning is robustly captured to ensure changes to personnel would cause minimal disruption
Correct level of network data can't be gathered to benchmark SVO and FPL performance
Major
Installation of additional network monitoring points to ensure data can be appropriately gathered
Overview designs for monitoring installations is complete and moving to installation packs for delivery
Required data from several WPD systems in to the Siemens SVO system to enable it to function is unmanageable and non‐updatable
Major
Develop a team structure and a process to enable the required timely updates to be carried out
This work is being developed as part of the SVO build activities
SVO method is delivered behind schedule
Moderate
Ensure all elements of the method and communications interface are understood
Key personnel for each element is identified and working on the method.

Page 50 of 54
SIX MONTHLY PROGRESS REPORTREPORTING PERIOD: JUNE 2016 – NOVEMBER 2016
Table 8‐2 provides a snapshot of the risk register, detailed graphically, to provide an on‐going understanding of the projects’ risks.
Table 8‐2 ‐ Graphical view of Risk Register
Table 8‐3 provides an overview of the risks by category, minor, moderate, major and severe. This information is used to understand the complete risk level of the project.
Table 8‐3 ‐ Percentage of Risk by category
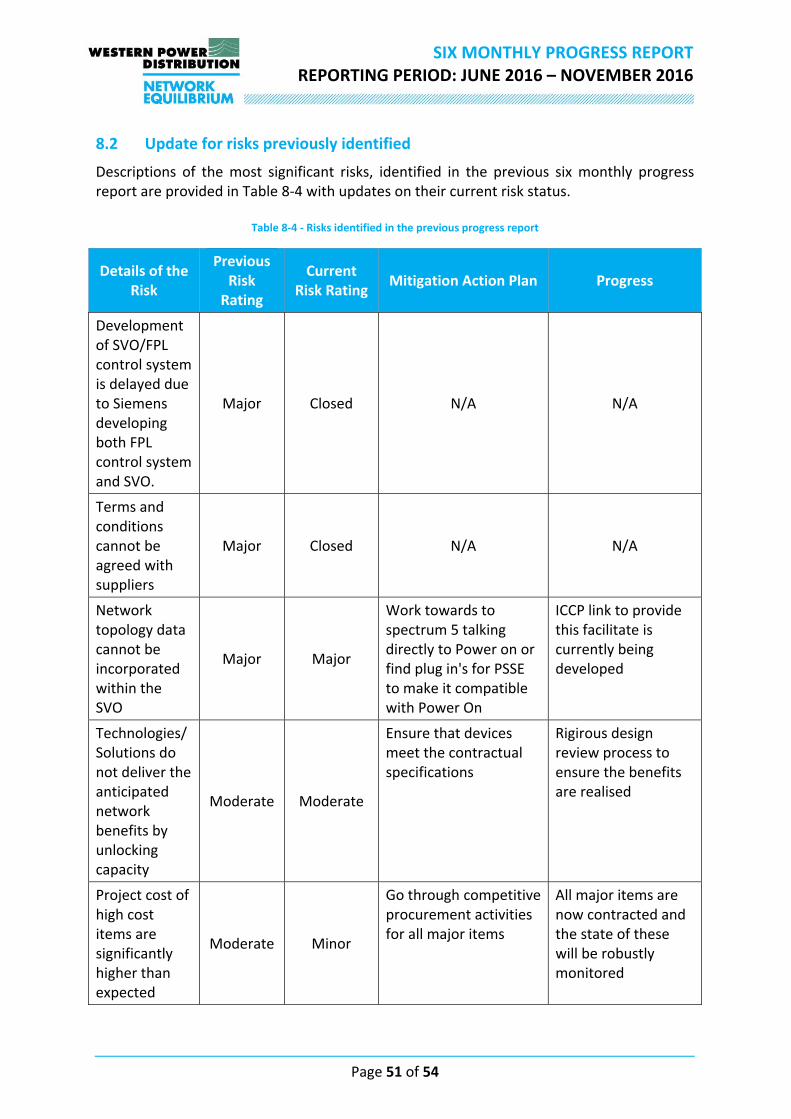
Page 51 of 54
SIX MONTHLY PROGRESS REPORTREPORTING PERIOD: JUNE 2016 – NOVEMBER 2016
8.2 Update for risks previously identified
Descriptions of the most significant risks, identified in the previous six monthly progress report are provided in Table 8‐4 with updates on their current risk status.
Table 8‐4 ‐ Risks identified in the previous progress report
Details of the Risk
Previous Risk Rating
Current Risk Rating
Mitigation Action Plan Progress
Development of SVO/FPL control system is delayed due to Siemens developing both FPL control system and SVO.
Major Closed N/A N/A
Terms and conditions cannot be agreed with suppliers
Major Closed N/A N/A
Network topology data cannot be incorporated within the SVO
Major Major
Work towards to spectrum 5 talking directly to Power on or find plug in's for PSSE to make it compatible with Power On
ICCP link to provide this facilitate is currently being developed
Technologies/Solutions do not deliver the anticipated network benefits by unlocking capacity
Moderate Moderate
Ensure that devices meet the contractual specifications
Rigirous design review process to ensure the benefits are realised
Project cost of high cost items are significantly higher than expected
Moderate Minor
Go through competitive procurement activities for all major items
All major items are now contracted and the state of these will be robustly monitored

Page 52 of 54
SIX MONTHLY PROGRESS REPORTREPORTING PERIOD: JUNE 2016 – NOVEMBER 2016
Descriptions of the most prominent risks, identified at the project bid phase, are provided in Table 8‐5 with updates on their current risk status.
Table 8‐5 ‐ Risks identified at the Bid Phase
Risk Previous Risk Rating
Current Risk Rating
Comments
Project team does not have the knowledge required to deliver the project
Minor Minor
A Technical Lead role has now been appointed for the project and a contract has been signed with WSP|PB to provide specialist engineering resource to successfully deliver the project
No SVO available from the contracted supplier
Major Closed The SVO system procurement activity is now complete
Project cost of high cost items are significantly higher than expected
Major Minor
All major items are now contracted and the state of these will be robustly monitored
No FPL available from the contracted supplier
Major Minor An FPL supplier has been contracted (ABB).
Selected sites for technology installations become unavailable
Moderate Moderate
Significant design work has now been completed and the site owners have been involved to ensure their suitability and availability

Page 53 of 54
SIX MONTHLY PROGRESS REPORTREPORTING PERIOD: JUNE 2016 – NOVEMBER 2016
9 Consistency with Full Submission
During this reporting period a core team of both WPD and WSP|PB engineers has been formed, which has and will continue to ensure that there will be consistency and robust capturing of learning moving forwards. This has ensured that the information provided at the full submission stage is still consistent with the work being undertaken in the project phase. The scale of the project has remained consistent for all three methods:
EVA – Develop and demonstrate an Advanced Planning and Operational tool for 33kV and 11kV networks;
SVO – Install and trial advanced voltage control schemes at 16 substations; and
FPL – Install and trial a Flexible Power Link at a 33kV substation.
10 Accuracy Assurance Statement
This report has been prepared by the Equilibrium Project Manager (Jonathan Berry), reviewed by the Future Networks Manager (Roger Hey), recommended by the Network Strategy and Innovation Manager (Nigel Turvey) and approved by the Operations Director (Philip Swift). All efforts have been made to ensure that the information contained within this report is accurate. WPD confirms that this report has been produced, reviewed and approved following our quality assurance process for external documents and reports.
