project number pzw-bd06 · project number pzw-bd06 comparative terpenoid metabolism in artemisia...
TRANSCRIPT

Project Number PZW-BD06
Comparative Terpenoid Metabolism in Artemisia annua Seedlings
A Major Qualifying Project Report:
submitted to the Faculty
of the
WORCESTER POLYTECHNIC INSTITUTE
in partial fulfillment of the requirements for the
Degree of Bachelor of Science
by
_____________________________ Elisabeth A. Drenzek
____________________________
Lacey J. Larson
Date: December 14, 2006
Approved:
______________________________________ Professor Pamela J. Weathers, Advisor

Abstract
This MQP compares the effects of sugars on growth and terpenoid production in the plant Artemisia annua. It also includes a review of hexokinase locations in plants. Seedlings were grown in media containing sucrose, glucose, or fructose. The growth of the seedlings was measured in biomass and number of leaves per plant. Terpenoids were measured by a TLC profile made from extractions of the seedlings. This MQP furthers the study of hexokinase localization and terpenoid production and regulation in plants.
i

Acknowledgements
We would like to thank everyone that helped in making the completion of this project
possible:
Our project advisor, Dr. Pamela J. Weathers, we are greatly appreciative of the time,
patience, and guidance you took to help us through this project.
Thank you Dr. Melissa Towler, for your help with finding lab supplies, giving culture
donations, and showing us how to properly use lab equipment and do lab procedures.
Thanks to Patrick Arsenault and all those in GH 06 for supplying us with seeds for our
experiments again and again.
Thank you very much Josyln Foley, your patience and dedication saw us through this
project. We couldn’t have done it without you.
Yi Wang, thanks, for helping us with the seed sterilization procedure.
Most of all, we thank our parents for your support and encouragement.
ii

Table of Contents Abstract ................................................................................................................................ i Acknowledgements............................................................................................................ iii Table of Contents............................................................................................................... iii Table of Figures ................................................................................................................. iv Table of Tables .................................................................................................................. iv 1. Introduction..................................................................................................................... 1
1.1 Significance of Artemisinin ...................................................................................... 1 1.2 Chemistry and Source of Artemisinin....................................................................... 1 1.3 Biochemical Pathway................................................................................................ 2 1.4 Factors Affecting Production.................................................................................... 4
1.4.1 Sugars................................................................................................................. 5 1.4.1.1 Sugars as a food source............................................................................... 5 1.4.1.2 Sugars alter artemisinin production ............................................................ 5 1.4.1.3 Sugars as signaling molecules .................................................................... 6 1.4.1.4 Sugars as regulators of plant secondary metabolites .................................. 6
1.4.2 Current signal transduction pathway models..................................................... 7 1.4.2.1 Glucose signal transduction pathways ...................................................... 10
1.4.3 Hexokinase as a sugar sensor........................................................................... 10 1.4.3.1 Localization............................................................................................... 11
2. Objectives .................................................................................................................... 15 3. Methods......................................................................................................................... 15
3.1 Sugar Profile Studies............................................................................................... 15 3.1.1 Seed Sterilization ............................................................................................. 15 3.1.2 Growth Conditions........................................................................................... 17 3.1.3 Growth and Development Analysis ................................................................. 17 3.1.4 Extraction of Artemisinin ................................................................................ 18 3.1.5 TLC for Terpenoid Analysis............................................................................ 18 3.1.6 Data Analysis ................................................................................................... 19
4. Results and Discussion ................................................................................................. 19 4.1 Sugar Effects on Seedling Growth and Terpenoid Profiles .................................... 19
4.1.1 Sugar effects on seedling growth..................................................................... 20 4.1.2 Terpenoid profiles for A. annua seedlings grown in sucrose, glucose, and fructose...................................................................................................................... 25
5. Conclusions................................................................................................................... 28 6. References..................................................................................................................... 30
iii

Table of Figures Figure 1. The chemical structure of artemisinin. .......................................................................2 Figure 2. Terpenoid biosynthetic pathways...............................................................................3Figure 3. Monosaccharide metabolism and role of monosaccharide analogs in plant cells. .....8 Figure 4. Disaccharide metabolism and role of disaccharide analogs in plant cells..................9 Figure 5. Effects of sucrose, glucose, and fructose on total biomass of A. annua. .................21Figure 6. Effects of sucrose, glucose, and fructose on root and shoot biomass of A. annua...22Figure 7. Shoot to root ratio of seedlings grown in glucose, sucrose and fructose. ................23 Figure 8. Effects of sucrose, glucose, and fructose on leaf count............................................24Figure 9. TLC of seedlings extracted after 14 days of growth on sucrose, glucose or fructose....26
Table of Tables Table 1. Summary of subcellular localization of hexokinase isoforms ...................................12 Table 2. Seed sterilization and growth conditions for A. annua and A. thaliana ...............16 Table 3. A description of the samples spotted on the TLC plate for terpenoid analysis.. .......19 Table 4. Rf values calculated for the TLC plate shown in Figure 7 ........................................27
iv

1. Introduction
1.1 Significance of Artemisinin Malaria is a disease that causes over one million deaths each year, putting 40% of
the world population at risk (WHO, 2004). There are four parasites that cause malaria
but the one that causes the most illness and death is Plasmodium falciparum. This is
because some strains have become resistant to many of the affordable current treatments
including, chloroquine, quinine, mefloquine, and primaquine (Balint, 2001).
An antimalarial drug that has been used as a folk remedy since 168 B.C. in China
was first purified and its molecular structure found in 1972. It was named qinghaosu, but
it is now better know as artemisinin, a sesquiterpene from the plant Artemisia annua L.
(Meshnick et al, 1996). Artemisinin and its derivatives have been found to be effective
against all stages of resistant strains of P. falciparum (Balint, 2001).
Although artemisinin has been found to be a useful medicine, its production is
very low in comparison with what is actually needed. The World Health Organization,
WHO, estimated that 130 million treatments would be needed in 2006, requiring 330 tons
of artemisinin (WHO, 2004). This presents a problem because of the very low
production levels of artemisinin in the native plant. One ton of dry A. annua leaves
produce only 6 kg of artemisinin. Considering that the drug also can not be economically
produced by organic synthesis (Abdin et al., 2003) researchers have been trying to
increase artemisinin production in A. annua plants.
1.2 Chemistry and Source of Artemisinin Artemisinin is an endoperoxide sesquinterpene lactone in the terpenoid family of
secondary metabolites (Figure 1). Its molecular formula is C15H22O5. The key part of its
1

structure is its endoperoxide bridge. It has been proposed that the endoperoxide bridge is
cleaved by a heme group to form a free radical that causes selective alkylation of parasite
proteins, leading to parasite death (Pandey et al.1999). Pandey et al. (1999) also
proposed that artemisinin forms a complex with heme that interrupts the parasite’s
hemoglobin catabolism.
Figure 1. The chemical structure of artemisinin.
There have been several attempts to synthetically make artemisinin, however the
results have been inefficient and costly. Although these attempts were impractical at a
large enough scale to be useful, it should be noted that artemisinic acid was a major
intermediate. This is interesting because some strains of A. annua produce eight to ten
times more artemisinic acid than artemisinin (Abdin et al., 2003).
1.3 Biochemical Pathway Artemisinin is a sequiterpenoid synthesized from five units of isopentenyl
diphosphate (IPP); IPP is produced in the cytoplasm, mitochondria, and plastids.
Although it is uncertain if IPP can be transported between all of these cellular
compartments, the pathways for the synthesis of terpenoids include the mevalonate
pathway, in the cytoplasm, and the non-mevalonate pathway in the plastid (Figure 2).
2
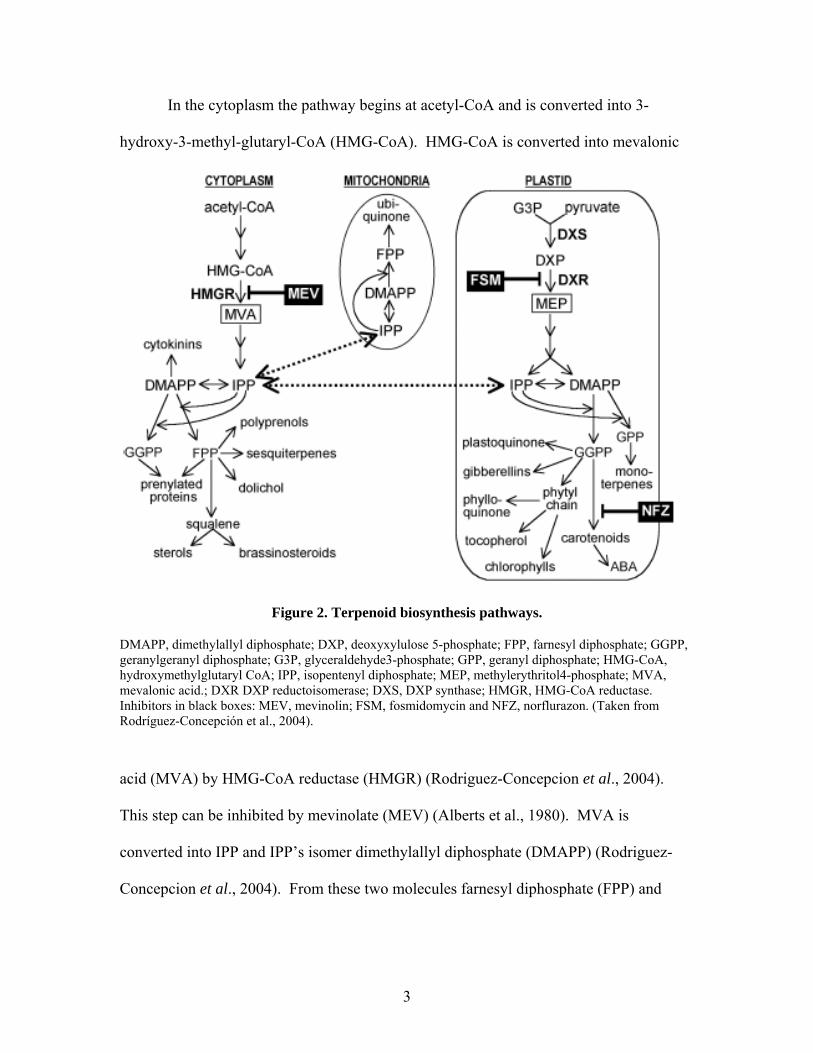
In the cytoplasm the pathway begins at acetyl-CoA and is converted into 3-
hydroxy-3-methyl-glutaryl-CoA (HMG-CoA). HMG-CoA is converted into mevalonic
Figure 2. Terpenoid biosynthesis pathways.
DMAPP, dimethylallyl diphosphate; DXP, deoxyxylulose 5-phosphate; FPP, farnesyl diphosphate; GGPP, geranylgeranyl diphosphate; G3P, glyceraldehyde3-phosphate; GPP, geranyl diphosphate; HMG-CoA, hydroxymethylglutaryl CoA; IPP, isopentenyl diphosphate; MEP, methylerythritol4-phosphate; MVA, mevalonic acid.; DXR DXP reductoisomerase; DXS, DXP synthase; HMGR, HMG-CoA reductase. Inhibitors in black boxes: MEV, mevinolin; FSM, fosmidomycin and NFZ, norflurazon. (Taken from Rodríguez-Concepción et al., 2004).
acid (MVA) by HMG-CoA reductase (HMGR) (Rodriguez-Concepcion et al., 2004).
This step can be inhibited by mevinolate (MEV) (Alberts et al., 1980). MVA is
converted into IPP and IPP’s isomer dimethylallyl diphosphate (DMAPP) (Rodriguez-
Concepcion et al., 2004). From these two molecules farnesyl diphosphate (FPP) and
3
geranylgeranyl diphosphate (GGPP) can be made. Sesquiterpenes and other terpenoids
are made from FPP.
In the plastid 1-deoxy-D-xylulose 5-phosphate (DXP) is made from pyruvate and
glycerol dehydyde 3-phosphate (G3P) using DXP synthase (DXS) (Rodriguez-
Concepcion et al., 2004). DXP is converted into methylerythritol phosphate (MEP) by
DXP reductase (DXR). This step can be inhibited by fosmidomycin (FSM) (Steinbacher
et al., 2003). MEP is converted into IPP and DMAPP which can be converted into GGPP
or geranyl diphosphate (GPP) (Rodriguez-Concepcion et al., 2004). These terpenoid
precursors are made in the plastid. Note that some of these precursors are made both in
the cytosol and the plastid, for example, GGPP (Figure 2). Norflurazon (NFZ) can
inhibit GGPP’s conversion into carotenoids. IPP can also be used in the mitochondria to
eventually be converted into ubiquinone (Rodriguez-Concepcion et al., 2004).
1.4 Factors Affecting Production
Many factors can affect production of artemisinin and many attempts have been
made to improve production yields. These include precursor feeding, where precursors,
such as mevalonic acid, are added to plant media (Woerdenbag et al., 1993). There have
also been attempts to influence the biosynthetic pathway with inhibitors. For example,
the sterol inhibitor miconazol inhibits sterol demethylase, which is the first regulatory
step leading to sterols which in turn coordinately up regulates production of
sesquinterpenes (Abdin et al., 2003). However, there is much about the regulation of
these pathways that is still unknown and being studied.
4

1.4.1 Sugars
1.4.1.1 Sugars as a food source Through photosynthesis plants use light energy, carbon dioxide, and water to
produce sugars. These sugars are stored in the plant to be used as a food source. Cellular
respiration takes the energy rich chemical bonds of a sugar like glucose, and converts it
into energy that can be used by the plant. Sugars also coordinate internal regulators and
environmental cues that have an influence on the growth and development of plants
(Koch, 1996; Sheen et al., 1999; Smeekens, 2000).
1.4.1.2 Sugars alter artemisinin production Recent experiments done by Yi Wang for her MS thesis at Worcester
Polytechnic Institute showed that sugars may act as signaling molecules to regulate the
production of artemisinin in A. annua seedlings. Her experiments further showed that in
A. annua plantlets artemisinin production was also significantly increased when glucose
was fed to plantlets in comparison to sucrose. Fructose on the other hand showed an
inhibitory affect, lowering the artemisinin production in those plantlets (Wang, 2006).
Weathers et al. (2004) studied the effects of glucose, fructose and sucrose on hairy roots
of A. annua. They studied growth and artemisinin production of roots grown in both
combinations of glucose, fructose, and sucrose and these sugars alone. Combinations
including glucose, such as glucose with sucrose, and glucose with fructose and sucrose,
compared to sugar combinations without glucose, such as sucrose and fructose, showed
an increase in growth. The only change seen in artemisinin production was in the
experiment with the fructose and sucrose combination, which greatly inhibited
artemisinin production. When each of the three sugars was used alone glucose reduced
growth, but increased artemisinin production (Weathers et al., 2004).
5

1.4.1.3 Sugars as signaling molecules Recently it has been shown that besides serving as carbon sources, sugars can be
sensed in plants, and can induce signals that affect metabolism and development. Sugar
sensing is the interaction between sugar molecules and sensor molecules, which are
usually proteins (Smeekens, 2000). Genetic analyses have shown that although there are
widespread interactions between sugars and plant hormone signaling, the enzyme
hexokinase (HXK) plays a central role in the sensing of glucose. It has been proposed
that glucose activates both HXK-dependent and HXK-independent pathways (Rolland et
al., 2006). Further, glucose also uses different molecular mechanisms to control
transcription, translation, protein stability, and enzymatic activity (Rolland et al., 2006).
1.4.1.4 Sugars as regulators of plant secondary metabolites There is little information about sugars having an effect on the production of plant
secondary metabolites. In 1998 Larronde et al. grew Vitis vinifera cell cultures for
twelve days in IM2 medium containing elevated concentrations of some major inorganic
nutrients. On the seventh day different concentrations of sucrose were added to the
cultures. Although the added sucrose increased the accumulation of anthocyanins 12-fold
in the V. vinifera cell cultures, accumulation of stilbenes was minimally affected
(Larronde et al., 1998). In a later study by Vitrac et al. the glucose analog, 3-O-
methylglucose, was added to V. vinifera cultures, but yielded no difference in
anthocyanin production when compared to the negative control. Considering that 3-O-
methylglucose is a glucose analog that can be moved into the cells, but is not
phosphorylated by hexokinase, these results suggested that hexokinase may be involved.
In the same study when another glucose analog, mannose, was added instead of sucrose
to V. vinifera cells, the accumulation of anthocyanin went up proportionately to the
6

concentration of added mannose. Although mannose is an analog of glucose, it is
phosphorylated by hexokinase, but cannot be further metabolized (Chen and Jones,
2004). These results suggested that hexokinase has a role in regulating anthocyanin
production in V. vinifera (Vitrac et al., 2000). When the hexokinase inhibitor,
mannoheptulose, was added, it inhibited the effect of sucrose on the anthocyanin
production in the grape cell suspension cultures. These results suggested that hexokinase
seemed to be involved with the sugar signal transduction pathway related to anthocyanin
production (Vitrac et al., 2000).
Artemisinin production was also shown to be stimulated by glucose Weathers et
al., (2004), and Wang (2006) showed that artemisinin production was significantly
decreased when 10% 3-O-methylglucose (3OMG) was added. Wang (2006) also
measured hexokinase activity and found that when 10% 3OMG was added along with
90% glucose, activity was decreased compared to controls using 100% glucose. Together
these results suggested that sugars are not only carbon sources, but may also regulate
artemisinin biosynthesis.
1.4.2 Current signal transduction pathway models There are several sugar signal transduction pathways working within plants.
Sugar signaling molecules can be either monosaccharides or disaccharides and sugar
signals can become more complex when both are present in the plant at the same time.
Glucose is the main signaling monosaccharide, but its signal can be altered when fructose
and other monosaccharides are present (Figure 3). Sucrose is the main signaling
disaccharide, but can also be affected when trehalose, maltose, and other dissacharides
are present (Figure 4) (Wang, 2006).
7

8

9
9

1.4.2.1 Glucose signal transduction pathways Currently in plants there are three glucose signal transduction pathways proposed.
These pathways are based on analyses that have been done on growth and development
as well as gene expression and enzyme activity.
1.4.3 Hexokinase as a sugar sensor Yeast glucose signal transduction has been well studied. Four glucose signaling
pathways have been found in yeast, three of which involve hexokinase (Rolland et al.,
2006). Hexokinase 2 (HXK2) in yeast regulates two different pathways. One of them is
the activation of a pathway leading to inactivation of sucrose nonfermenting1 (Snf1)
(Moreno et al., 2005). Snf1 is similar to a mammalian protein that is responsible for
phosphorylation of Mig1, which, when phosphorylated, dissociates from a repressor
complex (Rolland et al., 2006). HXK2 can also directly interact with Mig1 to recruit co-
repressors (Moreno et al., 2005). There is another regulatory pathway which involves a
duel mechanism. This pathway depends on both extracellular glucose or sucrose sensing
by a G-protein (Lemaire et al., 2004), and uptake of glucose followed by phosphorylation
by a hexokinase or glucokinase (Rolland et al., 2006).
There have been many studies focused on the role that hexokinase may play as a
sugar sensor in plants. Jang and Sheen (1994) showed that in maize, hexokinase is a
sensor in regulation of respiration. They found that 2-deoxyglucose (2-dG), which can be
phosphorylated by hexokinase but not further metabolized, when delivering directly into
cells causes repression of photosynthetic genes. They also found that 6-deoxyglucose
and 3-O-methylglucose (3OMG), which is not efficiently phosphorylated by hexokinase,
can not act as a glucose signal.
10

11
Using transgenic plants Jang et al. (1997) showed that over expression of
hexokinase (AtHXK1) in Arabidopsis causes hypersensitivity to sugars and that its under
expression causes hyposensitivity. They compared the transgenic to wild type plants
grown in the same conditions and observed that glucose acts as an inhibitor of greening
and growth in seedlings. Seedlings over expressing hexokinase were more inhibited by
glucose, while the seedlings under expressing hexokinase grew well, despite glucose. To
show that this was due to glucose sensing, Jang et al. (1997) also grew the plants on 2-
dGlu and there was no difference compared to the glucose-grown seedlings. They also
looked directly at the expression level of several genes and found that hexokinase is
responsible for sugar repressed genes and sugar induced genes.
1.4.3.1 Localization
Most organisms have multiple isoforms of hexokinase (Olsson et al., 2003). For
example, yeast has three hexokinases and mammals have four. In Arabidopsis there are
six hexokinase isoforms (Gonzali, 2002), and rice (Oryza sativa L.) has at least ten (Jung-
Il et al., 2005). This raises the question: Why do organisms need more than one form of
hexokinase? Multiple forms suggest that different hexokinases may have different roles
in cells as primary messengers for signal transduction in order to route carbon into
diverse locations or pathways within a cell. The localization of different hexokinases is
discussed below and summarized in Table 1.
Subcellular locations of the different hexokinases are not yet well known.
Locations of hexokinase are of interest because this could provide clues as to the

12
Table 1. Summery of subcellular localization of hexokinase isoformes.
Hexokinase Form Species Compartment location Reference Chloroplast Stroma
PpHxk1 Physcomitrella patens
Chloroplast stroma and maybe thylakoid; has -RR- motif in transit peptide
Olsson et al. (2003); Summer et al. (2000)
NtHxk2 Nicotiana tabacum Chloroplast stroma Giese et al. (2004) OsHxk4 Oryza sativa Chloroplast; maybe stroma Jung-Il et al. (2005)
Chloroplast membrane PpHxk2 P. patens Chloroplast outer membrane Olsson et al. (2003) SoHxk1 Spinacia oleracea Chloroplast outer membrane Weise et al. (1999) AtHxk1 Arabidopsis
thaliana Maybe chloroplast outer membrane, because of conserved hydrophobic N-terminal sequence
Olsson et al. (2003)
AtHxk2 A. thaliana Maybe chloroplast out membrane, because of conserved hydrophobic N-terminal sequence
Olsson et al. (2003)
Cytoplasm OsHxk7 O. sativa Cytoplasm Jung-Il et al. (2005)
Mitochondrial Membrane PsHxk?1 Pisum sativum Mitochondrial membrane Cosio and Bustamante (1984)
1 no specific hexokinase was found, only hexokinase activity in mitochondrial membranes fractions.

functional role of the hexokinase isoforms within a cell. The precursors of artemisinin
can come from different compartments within the cell. IPP, the major five carbon
precursor of all terpenoids, is derived from acetyl-CoA in the cytosol, and from pyruvate
in the plastid (Croteau et al., 2000). Hexokinases have been found to be localized not
only to the chloroplast outer envelope of spinach leaves (Weise et al., 1999), but also
bound to the membrane of mitochondria in pea leaves (Cosio and Bustamante, 1984). A
recent study has found another novel form of hexokinase (PpHxk1) in the moss,
Physocomitrella patens. This hexokinase is not bound to the chloroplast outer membrane,
but located instead within the chloroplast (Olsson et al., 2003). The transit peptide of this
internal chloroplast hexokinase contains at least one -RR- motif that further suggests it
may be targeted to the thylakoid (Summer et al., 2000). Olsson et al. (2003) found
another type of hexokinase (PpHxk2) localized to the chloroplast outer membrane. After
comparing both hexokinases to those found in a variety of plants, they proposed two
general types of hexokinases: a membrane bound hexokinase with highly conserved
hydrophobic N-terminal sequences thought to be a membrane anchor, and a hexokinase
with a somewhat less conserved N-terminal chloroplast transit peptide acting as a signal
for importation into the chloroplast.
In another recent study a functional analysis of Oryza sativa L. hexokinases also
showed that the two hexokinases, OsHXK4 and OsHXK7 were also located in two
different subcellular compartments (Jung-Il et al., 2005). OsHXK7 was localized to the
cytoplasm and OsHXK4 was localized to the chloroplast. OsHXK4 also was shown to
have a predicted chloroplast transit peptide suggesting that it may be imported to the
chloroplast stroma (Jung-Il et al., 2005). They found that OsHXK4 shares a similar
13

amino acid sequence to NtHxk2, which has been localized to the chloroplast stroma
(Giese et al., 2004), further suggesting that OsHXK4 may also be localized to the
chloroplast stroma.
Olsson et al. (2003) proposed that the PpHxk1 provides a mechanism for
bypassing glucose-6-P translocation during times of limited energy supply or when plants
were in the dark portions of the photo period. In contrast Wiese et al. (1999) proposed
that in spinach the membrane bound hexokinase (SoHxk1) could directly phosphorylate
glucose as it left the chloroplast. Wiese et al. (1999) did not consider SoHxk1 to be a
sugar sensor, however, because it was membrane bound; this conclusion was based on
the yeast hexokinase sugar sensors which have been characterized as not being membrane
bound (Wiese et al., 2000). On the other had the Arabidopsis hexokinases, AtHxk1 and
AtHxk2, both show sugar sensing properties (Jang, et al., 1997), yet both also have a
conserved hydrophobic sequence suggesting that they are also embedded in a membrane.
Olsson et al. (2003), thus, predicted that most plants may have similar membrane-bound
hexokinases and, if similar to AtHxk1 and AtHxk2, they could also act as sugar sensors.
Clearly, identification of which hexokinases are functioning as sugar sensors requires
further analysis. In addition, it may be that specific hexokinases act as sensors for very
specific metabolic processes, but not for others. Considering that growth and primary
metabolites are often not linked to secondary metabolism, it would be reasonable for
plant cells to have different sugar regulators, different hexokinases, “in charge” of these
different metabolic processes.
14

15
2. Objectives As a first step in determining how broadly sugars affect terpenoid metabolism in A.
annua, it is important to measure the diversity of terpenoids in shoots and roots in response to
different sugars, and to compare these responses to the well studied plant model, Arabidopsis
thaliana. This project therefore has two main objectives:
1) To compare the terpenoid TLC profiles of plantlets of A. annua and A. thaliana grown in
glucose, sucrose, and fructose.
2) To survey the literature in order to localize in the cell the different hexokinase enzymes
found in A. thaliana and possibly other plants.
3. Methods
3.1 Sugar Profile Studies
3.1.1 Seed Sterilization Artemisia annua L. seeds (YU strain, 2005 WPI crop) were imbibed in water for 30
minutes before sterilization. They were then surface sterilized in 10% (v/v) bleach for 12
minutes followed by 70% (v/v) ethanol for 5 minutes. The seeds were then rinsed with 10ml
0.1% sterile PPM (Preservative for Plant Tissue Culture Media, Plant Cell Technology, Inc.), 3
times for 5 minutes each time. This same seed sterilization process was done for the A. thaliana
seeds, except sterile diH2O was substituted for the 0.1% PPM. Further changes to the seed
sterilization and growth condition processes for A. thaliana are shown in Table 2.

16
A. annua A. thaliana
1st attempt 1st attempt 2nd attempt1 3rd attempt1 4th attempt 5th attempt1 6th attempt1 7th attempt H2O; 30 min. H2O; 30 min. H2O; 30 min. H2O; 30 min. H2O; 30 min. H2O; 30 min. H2O; 30 min. H2O; 30 min. 10% bleach; 12 min. 10% bleach; 12 min. 10% bleach; 12 min. 10% bleach; 12 min. 10% bleach; 12 min. 10% bleach 12 min. 10% bleach; 12 min. 10% bleach; 5 min.
70% ethanol; 15 min. 70% ethanol; 15 min. 70% ethanol; 15 min. 70% ethanol; 15 min. 70% ethanol; 15 min. 70% ethanol; 15 min. 70% ethanol; 15 min. 70% ethanol; 15 min. 0.1% sterile PPM 3X; 5 min.
0.1% sterile PPM 3X; 5 min.
Sterile H2O 3X; 5 min.
Sterile H2O 3X; 5 min.
Sterile H2O 3X; 5 min.
Sterile H2O 3X; 5 min.
Sterile H2O 3X; 5 min.
Sterile H2O 3X; 5 min.
Dark refrigerator for 3 days
Dark refrigerator for 3 days
Dark refrigerator for 3 days
Dark refrigerator for 3 days
Dark refrigerator for 3 days
Dark refrigerator for 3 days
Dark refrigerator for 3 days
Dark refrigerator for 3 days
Sterile PPM replaced by sterile Gamborg’s B5 medium with 3% sucrose
Sterile H2O replaced by sterile Gamborg’s B5 medium with 3% sucrose
Sterile H2O replaced by sterile Gamborg’s B5 medium with 3% sucrose
Sterile H2O replaced by sterile Gamborg’s B5 medium with 3% sucrose
Sterile H2O replaced by sterile Gamborg’s B5 medium with 3% sucrose
Sterile H2O replaced by sterile Gamborg’s B5 medium with 3% sucrose
Sterile H2O replaced by sterile Gamborg’s B5 medium with 3% sucrose
Sterile H2O replaced by sterile Gamborg’s B5 medium with 3% sucrose
Dark refrigerator for 3 days
Dark refrigerator for 3 days
Dark refrigerator for 3 days
Dark refrigerator for 3 days
Dark refrigerator for 3 days
Dark refrigerator for 3 days
Dark refrigerator for 3 days
Dark refrigerator for 3 days
Continuous cool white fluorescent light at 24oC at 140 rpm for 5 days
Continuous cool white fluorescent light at 24oC at 100 rpm for 5 days
Continuous cool white fluorescent light at 24oC at 140 rpm for 5 days
Continuous cool white fluorescent light at 24oC at 140 rpm for 5 days
Continuous cool white fluorescent light at 24oC at 140 rpm for 5 days
Continuous cool white fluorescent light at 24oC at 140 rpm for 5 days
Continuous cool white fluorescent light at 24oC at 100 rpm for 5 days
Continuous cool white fluorescent light at 24oC at 100 rpm for 5 days
Rinsed 7 times with sugar-free sterile Gamborg’s B5 medium
Rinsed 7 times with sugar-free sterile Gamborg’s B5 medium
Contamination; seeds were discarded before reaching final steps
Dark refrigerator for 1 day
Dark refrigerator for 1 day
Dark refrigerator for 1 day
Contamination; seeds were discarded before reaching final steps
No germination after 5 days on shaker
No germination after 5 days on shaker
No germination after 5 days on shaker
Contaminated after 2 days on shaker
Seeds used in Wang’s experiments Seeds from GH 06 Seeds from GH 06 Seeds purchased from
Lehle Seeds First generation seeds from purchased seeds Seeds from GH 06 Seeds from GH 06 Seeds from GH 06
Successful sterile germination
Successful sterile germination; all seedlings died after 1 week of growth on plates
Unsuccessful; contamination
Unsuccessful; contamination
Unsuccessful; no germination
Unsuccessful; no germination
Unsuccessful; no germination
Unsuccessful; contaminated before seeds could germinate.
Yellow denotes change in procedure from the previous attempt. 1attempted at least twice
Table 2. Seed Sterilization and Growth Conditions for A. annua and A. thaliana

3.1.2 Growth Conditions Sterilized seeds of A. annua were imbibed in 30ml 0.1% sterile PPM in a 125ml
Erlenmeyer flask in the dark for 3 days in the refrigerator. The 0.1% sterile PPM was
then replaced by 30ml sterile Gamborg’s B5 medium (Gamborg et al., 1968) with 3%
(w/v) sucrose at pH 5.7 and seeds were incubated for 3 additional days in the dark in the
refrigerator. Seeds were then transferred to continuous cool-white fluorescent light
(100 μ Ε-2s-1) at 24ºC, and at 140rpm (Lab-line Orbit Shaker, Lab-Line Instruments Inc.,
Melrose Park IL) for 5 days. After 5 days most of the seeds developed to the two-
cotyledon stage. The seedlings were then rinsed 7 times by decanting the medium and
replacing it with about 50ml of sugar-free B5 medium. The seedlings were left in 50ml
of sugar-free B5 medium and placed in the refrigerator for 1 day. Ten seedlings at the
two cotyledon stage that looked to be of equal size and health were selected and then
inoculated into a 100x25 mm Petri dish containing 20ml autoclaved B5 medium with
0.23% (w/v) Phytagel and 3% (w/v) filter sterilized fructose, sucrose, or glucose. All
sugars were filter sterilized using a 0.22μm sterile syringe filter before being added into
the B5 medium. Cultures were kept at 24ºC under continuous cool-white fluorescent
light (100 μ Ε-2s-1) for 14 days. This was essentially the same protocol described by
Wang (2006).
3.1.3 Growth and Development Analysis After the two-week growth period, pictures were taken of the seedlings still in
their plates, and the dead or contaminated seedlings were discarded. The seedlings were
then removed, rinsed with diH2O, and blotted dry with paper towels. The number of true
leaves on each plant was counted and recorded. Using a scalpel each seedling was cut at
17

the base of the hypocotyl to separate the root from the shoot. Each root or shoot was
individually dried at 60ºC for at least 16 hours, and the dry mass of each was measured.
The roots and shoots were left in the oven while each one was weighed so the intake of
moisture while cooling would be limited.
3.1.4 Extraction of Artemisinin The dried shoots that were harvested from the same Petri dish were pooled and
extracted with 4ml toluene in a chilled water sonicator for 30 minutes. The supernatant
was decanted, and the sonication was repeated twice more with 2ml toluene instead of
4ml. The 3 supernatants from this process were pooled and dried under nitrogen at 30ºC.
Samples were stored in the -20ºC freezer until TLC analysis. The same procedure was
used for extracting and analyzing terpenoids in the root portion of the plants harvested
from each sugar condition.
3.1.5 TLC for Terpenoid Analysis Extracted samples were pooled to give one sample of shoots and roots for each
sugar then dried under nitrogen. These samples were then re-suspended in toluene and a
volume of the extract equal to 2.5 mg dry weight plant material of roots or shoots from
each sugar condition was spotted onto a plastic backed silica gel 60 TLC plate along with
20 μg of the artemisinin standard (AN) according to Table 3.
18

Table 3. A description of the samples spotted on the TLC plate for terpenoid analysis.
Lane Sample Total Amount (mg)
Re-suspension Volume (μL)
Spotted Volume (μL)
1 AN Standard 0.05 200.0 80 2 Glucose Shoots 14.66 211.0 36 3 Sucrose Shoots 23.92 287.0 30 4 Fructose Shoots 20.24 259.0 32 5 Glucose Roots 12.36 178.0 36 6 Sucrose Roots 24.03 221.0 23 7 Fructose Roots 19.52 203.0 26 8 AN Standard 0.05 200.0 80
TLC analysis was performed using benzene: methanol (90:10) mobile phase. The
plate was sprayed with an acetic acid: sulfuric acid: p-anisaldehyde (97:2:1) solution, and
heated for approximately 5 minutes at 110oC to visualize artemisinic compounds and
other terpenes (Driggs, 2006). Artemisinin appeared a fuchsia pink. Other terpenoids
were green, brown, and yellow.
3.1.6 Data Analysis All experiments were done at least in triplicate, and the data were statistically
analyzed using the two-tailed t-test function of Microsoft Excel. TLC RF’s were
calculated based on the center of observed spots and relative to the distance the solvent
front traveled from the origin.
4. Results and Discussion
4.1 Sugar Effects on Seedling Growth and Terpenoid Profiles Our initial objectives included comparative growth and terpenoid profiling of
both, A. annua and A. thaliana seedlings after growth in glucose, fructose, or sucrose.
19

Unfortunately we were unable to obtain healthy, sterile, seedlings of A. thaliana for
analysis. Only results from A. annua seedlings are, thus, presented here.
Sugars can be transported in and out of plant cells with little effort, and can be
transformed into other sugars where they can be metabolized through glycolysis and used
as an energy source. To test the effects of glucose, fructose, and sucrose on the growth
of A. annua, seedlings were grown in Petri dishes containing B5 medium with 3% (w/v)
sucrose, glucose, or fructose. The seedlings were grown for 14 days before harvest and
analysis. The glucose and fructose results were compared to sucrose because it is the
sugar that is normally used for growing seedlings. Only true leaves were counted.
4.1.1 Sugar effects on seedling growth
Seedlings of A. annua grown in sucrose had the highest average biomass,
followed by seedlings grown in fructose; seedlings grown in glucose had the least
biomass (Figure 5). These data suggest that artemisinin plantlets grow best in sucrose,
followed by fructose; they grew poorest in glucose. Our sucrose and glucose averages
were similar to Wang’s findings; however, in contrast to Wang’s work we found growth
was inhibited by glucose compared to sucrose. Wang found that the average biomass
was highest for the seedlings grown in sucrose, with about 6.4 mg. Seedlings grown in
glucose had the next highest average of about 6.0 mg, and fructose had the lowest
average biomass of about 5.4 mg (Wang, 2006).
20

Figure 5. Effects of sucrose, glucose, and fructose on total biomass of A. annua. Average weight of pooled seedlings after 14 days of growth in glucose, fructose or sucrose at 30 g/L. Each group had 24 to 22 seedlings; outliers were eliminated from data. Letters above bars indicate statistical significance: x,y, sucrose vs. glucose in roots, p<0.01. A t-test was done using Microsoft Excel comparing glucose to sucrose and fructose to sucrose. The test did not show fructose to be significantly different from sucrose. Error bars represent plus or minus one standard deviation.
The average weight of the seedlings grown in sucrose was the highest of all these
sugars for both roots and shoots (Figure 6). In contrast lowest seedling weight for both
roots and shoots was observed when glucose was the sole carbon source (Figure 6).
These data are similar to the growth responses shown in Figure 5. Wang, on the other
hand, found that in comparison to sucrose the shoot biomass of seedlings grown in
fructose or glucose was not significantly different, but the root biomass of glucose, about
2.3 mg, was significantly lower than the biomass of seedlings grown in sucrose, about 3.1
mg (Wang, 2006). Weathers et al. (2004) found similarly that growth of hairy root
cultures of A. annua was inhibited when grown in glucose compared to sucrose; growth
21

in fructose was not significantly different from sucrose. When roots were grown in
sucrose in combination with glucose or fructose, results varied even more. While sucrose
and glucose stimulated root growth, sucrose and fructose inhibited it (Weathers et al.,
2004). In contrast equivalent molar amounts of all these sugars gave the best growth
overall. Clearly sugars have an intriguing and complex effect on growth.
Figure 6. Effects of sucrose, glucose, and fructose on root and shoot biomass of A. annua. Average weight of pooled shoots and pooled roots after 14 days growth in glucose, fructose or sucrose at 30 g/L. Each group had 24-25 seedlings; outliers were eliminated from data. Each seedling shoot or root was weighed individually. Letters above bars indicate statistical significance: a,b, sucrose vs. glucose in roots; x,y, sucrose vs. glucose in shoots, p<0.01. A t-test was done using Microsoft Excel comparing glucose to sucrose and fructose to sucrose. Error bars represent plus or minus one standard deviation. glucose to sucrose and fructose to sucrose. Error bars represent plus or minus one standard deviation.
22

When shoot to root ratios were calculated for seedlings grown in each sugar,
fructose had the highest shoot to root ratio followed by sucrose, and then glucose (Figure
7). This shows that, compared to glucose or sucrose, seedlings grown in fructose grew
larger shoots. Wang’s results showed that glucose yielded the highest shoot to root ratio
of about 2.1. Sucrose and fructose had equally lower shoot to root ratios of about 1.2
(Wang, 2006). Although our results contradict Wang’s study, they are consistent with the
results of Weathers et al. (2004) which showed that glucose inhibited hairy root growth.
Figure 7. Shoot to root ratio of seedlings grown in glucose, sucrose and fructose. Shoot verse root ratios for seedlings grown for 14 days in 30g/L of sucrose, glucose or fructose. Each group had 24 seedling; outliers were eliminated from data. Letters above indicate statistical significance: x,y, sucrose vs. glucose; a,b, sucrose vs. fructose, p<0.01. A t-test was done using Microsoft Excel comparing glucose to sucrose and fructose to sucrose.
23
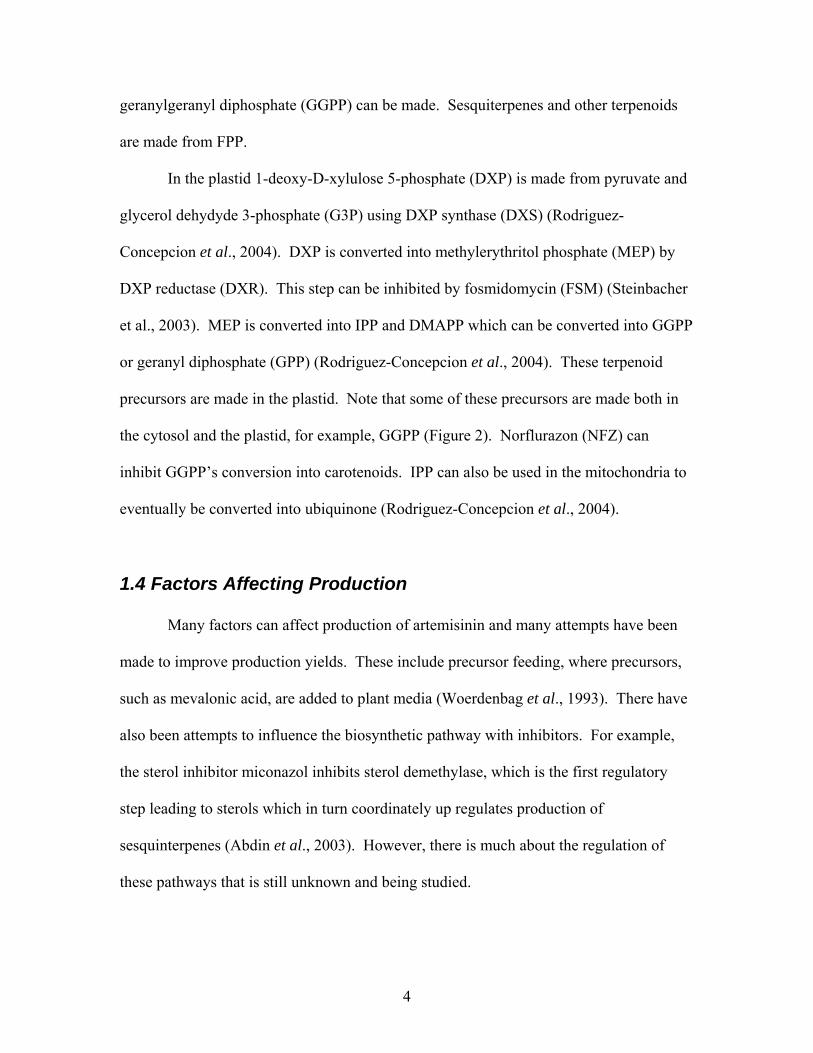
Seedlings of A. annua grown in glucose and fructose have fewer leaves than
seedlings grown in sucrose (Figure 8). These results contradict Wang’s findings, which
showed more leaf production in glucose than in sucrose. Wang reported that in
comparison to sucrose the number of leaves on seedlings grown in glucose was greater,
about 6.5 average leaves, and the number of leaves on seedlings grown in fructose was
lower, about 4.6 leaves (Wang, 2006).
Figure 8. Effects of sucrose, glucose, and fructose on leaf count. Average number of leaves for seedlings grown for 14 days in 30g/L of sucrose, glucose or fructose. Each group had at least 28 plants. Letters above indicate statistical significance: x,y, sucrose vs. glucose; a,b, sucrose vs. fructose, p<0.01. A t-test was done using Microsoft Excel comparing glucose to sucrose and fructose to sucrose.
24

4.1.2 Terpenoid profiles for A. annua seedlings grown in sucrose, glucose, and fructose
The TLC results showed that considerably more terpenes were produced in
A. annua shoots than in roots (Figure 9). Relative Rf values are shown in Table 4. The
diversity of terpenes in roots is different from that in shoots; some terpenes present in one
organ are absent in the other. Although it appeared that more terpenes were produced in
glucose-fed seedlings than in seedlings fed sucrose or fructose, results were not
definitive. Wang (2006) reported that in A. annua seedlings shoots grown in glucose
increased artemisinin production compared to seedlings grown in sucrose or fructose.
This suggested there was a link between glucose and the terpenoid pathways. Weathers
et al. (2004) also saw an increase in artemisinin levels when roots were grown in glucose
alone. They did not, however, see any significant difference in artemisinin production
when glucose was combined with sucrose. Compared to fructose alone, Weathers et al.
(2004) observed an inhibition in artemisinin production when fructose and sucrose were
combined and fed to roots. Because glucose is a more preferred substrate for
phosphorylation by hexokinase compared to fructose (Olsson et al., 2003), these data also
suggested that glucose was acting as a signal that was possibly being sensed by
hexokinase to affect terpenoid metabolism. Wang’s data also suggest that glucose was
acting as a signal that was possibly being sensed by hexokinase to affect terpenoid
metabolism.
25

Figure 9. TLC of seedlings extracted after 14 days grown on sucrose, glucose or fructose.AN, artemisinin marker, indicated by arrow. GS, Glucose shoots; SS, sucrose shoots; FS, fructose shoots; GR, glucose roots; SR, sucrose roots; FR, fructose roots. Each lane was extracted from a pool of at least 28 plants.
26

Table 4. Rf values calculated for the TLC plate shown in Figure 7. Distance traveled (cm)
Solvent 16.7 Rf Color AN 11.1 0.66 Pink/Brown
Shoot Spots 1 2.5 0.15 Green 2 4.1 0.24 Green 3 5.4 0.32 Green 4 6.2 0.37 Brown 5 7.7 0.46 Yellow 6 9.8 0.59 Brown 7 10.5 0.63 Brown 8 11.0 0.66 Yellow 9 12.0 0.72 Green
10 12.6 0.75 Green Root Spots
1 4.1 0.24 Green 2 5.4 0.32 Green 3 9.8 0.59 Brown 4 11.2 0.67 Brown 5 11.6 0.69 Brown 6 12.6 0.75 Yellow
27
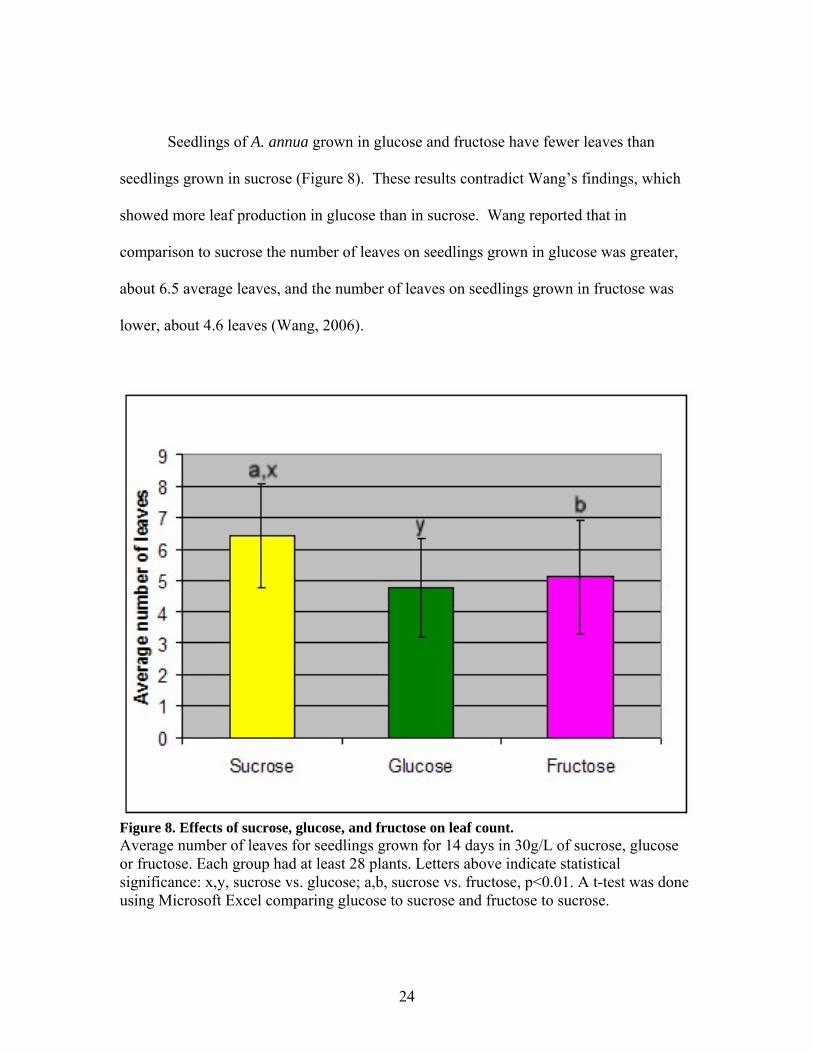
5. Conclusions
At the same carbon level A. annua grew better in sucrose than glucose, and there
was no significant change in growth between sucrose and fructose. Collectively these
data do not match those found by Wang (2006). There was a significant difference in
terpenoids produced in the shoots verses the roots in all three sugars. Jang et al. (1997)
transformed Arabidopsis thaliana with binary vectors with fusions of the cauliflower
mosaic virus 35S RNA promoter and AtHXK1 and AtHXK2 in sense and anti-sense
orientations. They used a constitutive promoter to bypass transcriptional regulation.
Hypersensitivity to glucose was seen in the plants over expressing hexokinase in the form
of stunted growth and lack of greening in seedlings. It may be possible that a
hypersensitivity to hexokinase could cause over production of artemisinin and other
terpenoids in A. annua. If A. thaliana shows a similar terpenoid profile it would suggest
that terpenoids are regulated similarly by glucose in both A. thaliana and A. annua.
However, specific hexokinase enzymes and their corresponding genses would have to be
isolated and located to over express hexokinase in Artemisia. Hexokinase located in the
cytoplasm would be a likely target since the sesquiterpene pathway is located in the
cytoplasm (Rodríguez-Concepción et al., 2004). The compilation of hexokinase
localizations in Table 1 provided information such as the specific hexokinase number,
plant species and location within the cell. This table will aid future research because it
may be used conveniently to design experiments to answer basic questions on hexokinase
location and function in plant terpenoid biochemistry. It would be interesting to learn
more about where hexokinases are located in A. annua and whether any specific
28

hexokinase might be responsible for the signal transduction pathway that leads to the
increased production of artemisinin.
29

6. References Abdin, M. Z., Israr, M., Rehman, R. U., Jain, S. K. (2003). Artemisinin, a novel
antimalarial drug: biochemical and molecular approaches for enhanced production. Planta Med. 69: 289-299.
Alberts, A.W., Chen, J., Kuron, G., Hunt, V., Huff, J., Hoffman, C., Rothrock, J., Lopez, M., Joshua, H., Harris, E., Patchett, A., Monaghan, R., Currie, S., Stapley, E., Albers-Schonberg, G., Hensens, O., Hirshfield, J., Hoogsteen, K., Liesch J., Springer J. (1980). Mevinolin: A highly potent competitive inhibitor of hydroxymethylglutaryl-coenzyme A reductase and a cholesterol- lowering agent. Proc. Natl. Acad. Sci. USA 77: 3957–3961.
Balint, G. (2001). Artemisinin and its derivatives an important new class of antimalarial agents. Pharmacology & Therapeutics. 90: 261-265.
Chen, J., Jones, A. M. (2004). AtRGS1 function in Arabidopsis thaliana. Methods in Enzymology. 389: 338-350.
Cosio, E., Bustamante, E. (1984). Subcellular localization of hexokinase in pea leaves. J. Bio. Chem. 259(12): 7688-7692.
Croteau, R., Kutchan, T., Lewis, N. (2000). Natural products (secondary metabolites). In Buchanan, B., Gruissem, W., Jones, R. (Eds.) Biochemistry & Molecular Biology of Plants. Rockville, Maryland: American Society of Plant Physiologts. Pp. 1250-1317.
Driggs, M. D. (2006). Is a precursor to the anti-malarial drug, artemisinin, glycosylated in planta? Major Qualifying Project. Biology and Biotechnology. Worcester Polytechnic Institute.
Gamborg O.L., Miller R.A., Ojima K. (1968) Nutrient requirements of suspension cultures of soybean root cells. Experimental Cell Research. 50: 151-158.
Gonzali, S., Amedeo, A., Blando, F., Bellis, L. (2002). Arabidopsis and yeast hexokinase overexpressed in transgenic lines are characterized by different catalytic properties. Plant Science. 163: 943-954.
Jang, J., Sheen, J. (1994). Sugar sensing in higher plants. The Plant Cell. 6: 1665-1679.
Jang, J., Leon, P., Zhou, L., Sheen, J. (1997). Hexokinase as a sugar sensor in higher plants. The Plant Cell. 9: 5-19.
30

Jung-Il C., Nayeon R., Seho K., Sang-Kyu L., Junok L., Ki-Hong J., Youn-Hyung L. Seong H. B., Joris W., Gynheung A., Tae-Ryong H., Jong-Seong J. (2005) Structure, expression, and functional analysis of the hexokinase gene family in rice ( Oryza sativa L.) Planta. 224: 598–611.
Koch, K.E. (1996). Carbohydrate modulated gene expression in plants. Annu. Rev. Plant Physiol. Plant Mol. Biol. 47: 509–540.
Larronde, F., Krisa, S., Decendit, A., Chèze, C., Deffieux, G., Mérillon, J. (1998)
Regulation of polyphenol production in Vitis vinifera cell suspension cultures by sugars. Plant Cell Reports. 17: 946–950.
Lemaire, K., Velde, S., Dijck, P., Thevelein, J. (2004) Glucose and sucrose act as agonist
and mannose as antagonist ligands of the G Protein-coupled receptor gpr1 in the yeast Saccharomyces cerevisiae. Molecular Cell. 16: 293–299.
Meshnick, S., Taylor, T., Kamchonwongpaisian, S. (1996). Artemisinin and the antimalarial endoperoxides: from herbal remedy to targeted chemotherapy. Microbio. Rev. 60(2): 301-315.
Morenol, F., Ahuatzi, D., Riera, A., Palomino, C., Herrero, P. (2005) Glucose sensing through the Hxk2-dependent signaling pathway. Biochemical Society Transactions. 33: 265-268.
Olsson, T., Thelander, M., Ronne, H. (2003). A novel type of chloroplast stromal hexokinase is the major glucose-phosphorylation enzyme in the moss Physcomitrella patens. J. Bio. Chem. 278(45): 44439-44447.
Pandey, A., Tekwani, B., Singh, R., Chauhan, V. (1999). Artemisinin, an endoperoxide antimalarial, disrupts the hemoglobin catabolism and heme detoxification system in the malarial parasite. J. Bio. Chem., 274(27): 19383-19388.
Rodríguez-Concepción, M., Forés, O., Martínez-García, J.F., González, V., Phillips,
M.A., Ferrer, A., Boronat, A. (2004). Distinct light-mediated pathways regulate the biosynthesis and exchange of isoprenoid precursors during Arabidopsis seedling development. The Plant Cell. 16: 144-156.
Rolland F., Baena-Gonzalez E., Sheen J. (2006). Sugar sensing and signaling in plants:
conserved and novel mechanisms. Annu. Rev. Plant Biol. 57: 675-709.
Sheen, J., Zhou, L., Jang, J.C. (1999). Sugars as signaling molecules. Curr. Opin. Plant Biol. 2: 410–418.
Smeekens, S. (2000). Sugar-induced signal transduction in plants. Annu. Rev. Plant
Physiol. Plant Mol. Biol. 51: 49–81.
31

Steliopoulos, P., Wüst, M., Adam, K.P., Mosandl, A. (2002). Biosynthesis of the sesquiterpene germacrene D in Solidago canadensis: 13C and 2H labeling studies. Phytochemistry. 60:13–20.
Summer E., Mori H., Settles A., Cline K. (2000) The thylakoid delta pH-dependent
pathway machinery facilitates RR-independent N-tail protein integration. J. Biol. Chem. 275(31): 23483-23490.
Vitrac, X., Larronde, F., Krisa, S., Decendit, A., Deffieux, G., Merillon, J. (2000). Sugar sensing and Ca2+-calmodulin requirement in Vitis vinifera cells producing anthocyanins. Phytochemistry. 53(6): 659-65.
Wang, Y. (2006). Sugar control of artemisinin production. MS Graduate Thesis, Biology
and Biotechnology. Worcester Polytechnic Institute. Weathers, P. J., Cheetham, R. D., Teoh, K. (1994). Artemisinin production by
transformed roots of Artemisia annua. Biotech. Letters. 16(12): 1281–1286. Weathers, P. J., Hemmavanh, D. D., Walcerz, D. B., Cheetham, R. D., Smith, T. C.
(1997). Interactive effects of nitrate and phosphate salts, sucrose, and inoculum culture age on growth and sesquiterpene production in Artemisia annua hairy root cultures. In Vitro Cell. & Devel. Biol. – Plant. 33: 306–312.
Weathers, P. J., DeJesus-Gonzalez L., Kim, Y. J., Souret, F. F., Towler, M. J. (2004).
Alteration of biomass and artemisinin production in Artemisia annua hairy roots by media sterilization method and sugars. Plant Cell Reports. 23: 414–418.
Wiese, A., Groner, F., Sonnewald, U., Deppner, H., Lerchl, J., Hebbeker, U., Flugge, U., Weber, A. (1999). Spinach hexokinase I is located in outer envelope membrane of plastids. FEBS lett., 461: 13-18.
Woerdenbag, H., Luers, J., Uden, W., Pras, N., Malingre, T., Alferman, W. (1993). Production of new antimalarial drug artemisinin in shoot cultures of Artemisia annua L. Plant Cell, Tissue and Organ Culture. 32(2): 247-257.
World Health Organization (WHO). (2004). Malaria Medicines and Supplies Service (MMSS). Retrieved September 21, 2006, from http://www.rollbackmalaria.org.
32

33