project number: dtz 1302 an interactive qualifying project ... · an interactive qualifying project...
TRANSCRIPT

Project Number: DTZ 1302
An Interactive Qualifying Project Report:
Submitted to the Faculty of
WORCESTER POLYTECHNIC INSTITUTE
in partial fulfillment of the requirements for the
Degree of Bachelor of Science
By
Yixi Chen _____________________________
Mercedes Kuzina _____________________________
Zachary Stewart _____________________________
Chris Xia _____________________________
Submitted:
May 6, 2014
Approved by Professor Dalin Tang, Project Advisor
__________________________________________

1
Abstract
With the resources available on the internet, a ten week stock market simulation was conducted to
examine the effects of four different trading methods: swing trading, pair trading, trading the news,
and growth investing. Results from the four trading methods were compared and analyzed. The
experience obtained through this project may give investors the confidence to trade wisely in the
future.

2
Table of Contents
Abstract .......................................................................................................................................... 1
Table of Contents .......................................................................................................................... 2
List of Figures ................................................................................................................................ 4
List of Tables ................................................................................................................................. 7
1 Introduction ........................................................................................................................... 8
1.1 Goals, Scope, General Plan ....................................................................................................... 8
1.2 Stock Market Synopsis .............................................................................................................. 9
2 Types of Investment ............................................................................................................ 11
2.1 Certificate of Deposit ............................................................................................................... 11
2.2 Bond .......................................................................................................................................... 11
2.3 Mutual Fund ............................................................................................................................ 11
2.4 Real Estate ................................................................................................................................ 12
2.5 Precious Metal ......................................................................................................................... 12
2.6 Stock.......................................................................................................................................... 12
3 Swing Trading Simulation ................................................................................................. 14
3.1 Technical Analysis ................................................................................................................... 14 3.1.1 Support and Resistance ......................................................................................................... 14
3.1.2 Volume and Price Relationship ............................................................................................. 16
3.1.3 Simple Moving Averages ...................................................................................................... 17
3.2 Companies ................................................................................................................................ 18
3.3 Simulation Transactions ......................................................................................................... 20 3.3.1 Week 1: 12/02/13-12/06/13 ................................................................................................... 20
3.3.2 Week 2: 12/09/13-12/13/13 ................................................................................................... 22
3.3.3 Week 3: 12/16/13-12/20/13 ................................................................................................... 25
3.3.4 Week 4: 01/20/14-01/24/14 ................................................................................................... 28
3.3.5 Week 5: 01/27/14-01/31/14 ................................................................................................... 31
3.3.6 Week 6: 02/03/14-02/07/14 ................................................................................................... 32
3.3.7 Week 7: 02/10/14-02/14/14 ................................................................................................... 35
3.3.8 Week 8: 02/17/14-02/21/14 ................................................................................................... 37
3.3.9 Week 9: 02/24/14-02/28/14 ................................................................................................... 40
3.3.10 Week 10: 03/03/14-03/07/14 ............................................................................................ 42
3.4 Results and Discussion ............................................................................................................ 43
4 Pair Trading Simulation .................................................................................................... 46
4.1 Introduction ............................................................................................................................. 46
4.2 Mechanism ............................................................................................................................... 46
4.3 Terminology ............................................................................................................................. 47 4.3.1 Correlation............................................................................................................................. 47
4.3.2 Price Ratio ............................................................................................................................. 48
4.4 Pairs of Stocks Selected ........................................................................................................... 48
4.5 Simulation Transactions ......................................................................................................... 52 4.5.1 Week 1: 12/02/13-12/06/13 ................................................................................................... 52
4.5.2 Week 2: 12/09/13-12/13/13 ................................................................................................... 55
4.5.3 Week 3: 12/16/13-12/20/13 ................................................................................................... 58
4.5.4 Week 4: 01/20/14-01/24/14 ................................................................................................... 60

3
4.5.5 Week 5: 01/27/14-01/31/14 ................................................................................................... 62
4.5.6 Week 6: 02/03/14-02/07/14 ................................................................................................... 65
4.5.7 Week 7: 02/10/14-02/14/14 ................................................................................................... 67
4.5.8 Week 8: 02/17/14-02/21/14 ................................................................................................... 70
4.5.9 Week 9: 02/24/14-02/28/14 ................................................................................................... 72
4.5.10 Week 10: 03/03/14-03/07/14 ............................................................................................ 74
4.6 Results and Discussion ............................................................................................................ 76
5 Trading the News Simulation ............................................................................................ 78
5.1 Companies ................................................................................................................................ 79
5.2 Simulation Transactions ......................................................................................................... 80 5.2.1 Week 1: 12/02/13-12/06/13 ................................................................................................... 80
5.2.2 Week 2: 12/09/13-12/13/13 ................................................................................................... 81
5.2.3 Week 3: 12/16/13-12/20/13 ................................................................................................... 82
5.2.4 Week 4: 01/20/14-01/24/14 ................................................................................................... 83
5.2.5 Week 5: 01/27/14-01/31/14 ................................................................................................... 86
5.2.6 Week 6: 02/03/14-02/07/14 ................................................................................................... 88
5.2.7 Week 7: 02/10/14-02/14/14 ................................................................................................... 89
5.2.8 Week 8: 02/17/14-02/21/14 ................................................................................................... 92
5.2.9 Week 9: 02/24/14-02/28/14 ................................................................................................... 95
5.2.10 Week 10: 03/03/14-03/07/14 ............................................................................................ 97
5.3 Results and Discussion ............................................................................................................ 99
6 Growth Investing .............................................................................................................. 102
6.1 Introduction ........................................................................................................................... 102
6.2 Company Analysis ................................................................................................................. 105
6.3 Results and Discussion .......................................................................................................... 115
7 Analysis .............................................................................................................................. 120
7.1 Analysis of strategies ............................................................................................................. 120
7.2 Comparing Swing Trading and Pair Trading..................................................................... 121
7.3 Comparing Trading the News and Growth Investing ........................................................ 122
8 Conclusion ......................................................................................................................... 125
References .................................................................................................................................. 126

4
List of Figures
Figure 3.1 Example of Support ..................................................................................................... 14
Figure 3.2 Example of Resistance ................................................................................................ 15
Figure 3.3 Old Resistance Becomes New Support ....................................................................... 16
Figure 3.4 Volume and Price Trend Reversal ............................................................................... 17
Figure 3.5 Price Crosses Simple Moving Average ....................................................................... 18
Figure 3.6 Simple Moving Average Crossover ............................................................................ 18
Figure 3.7 Waste Management Technical Chart........................................................................... 20
Figure 3.8 Fiserv Technical Chart ................................................................................................ 21
Figure 3.9 FMC Technologies Technical Chart ........................................................................... 21
Figure 3.10 Waste Management Technical Chart......................................................................... 23
Figure 3.11 FMC Technologies Technical Chart ......................................................................... 23
Figure 3.12 AGL Resources Inc. Technical Chart ........................................................................ 24
Figure 3.13 Kroger Co. Technical Chart ...................................................................................... 24
Figure 3.14 Waste Management Technical Chart......................................................................... 25
Figure 3.15 FMC Technologies Technical Chart ......................................................................... 26
Figure 3.16 AGL Resources Inc. Technical Chart ........................................................................ 26
Figure 3.17 Kroger Co. Technical Chart ...................................................................................... 27
Figure 3.18 Waste Management Technical Chart......................................................................... 28
Figure 3.19 FMC Technologies Technical Chart ......................................................................... 29
Figure 3.20 AGL Resources Inc. Technical Chart ........................................................................ 29
Figure 3.21 Kroger Co. Technical Chart ...................................................................................... 30
Figure 3.22 Fiserv Technical Chart .............................................................................................. 30
Figure 3.23 Waste Management Technical Chart......................................................................... 31
Figure 3.24 Fiserv Technical Chart .............................................................................................. 31
Figure 3.25 Waste Management Technical Chart......................................................................... 33
Figure 3.26 Fiserv Technical Chart .............................................................................................. 33
Figure 3.27 Kroger Co. Technical Chart ...................................................................................... 34
Figure 3.28 AGL Resources Inc. Technical Chart ........................................................................ 34
Figure 3.29 Waste Management Technical Chart......................................................................... 35
Figure 3.30 FMC Technologies Technical Chart ......................................................................... 36
Figure 3.31 AGL Resources Inc. Technical Chart ........................................................................ 36
Figure 3.32 Waste Management Technical Chart......................................................................... 38
Figure 3.33 Fiserv Technical Chart .............................................................................................. 38
Figure 3.34 Kroger Co. Technical Chart ...................................................................................... 39
Figure 3.35 AGL Resources Inc. Technical Chart ........................................................................ 39
Figure 3.36 Kroger Co. Technical Chart ...................................................................................... 41
Figure 3.37 AGL Resources Inc. Technical Chart ........................................................................ 41
Figure 3.38 AGL Resources Inc. Technical Chart ........................................................................ 42
Figure 4.1 Mechanism of Pair Trading ......................................................................................... 47
Figure 4.2 Stock Chart of Ford ..................................................................................................... 48
Figure 4.3 Stock Chart of General Motors .................................................................................... 49
Figure 4.4 Stock Chart of AT&T .................................................................................................. 49
Figure 4.5 Stock Chart of Verizon ................................................................................................ 50
Figure 4.6 Stock Chart of Citigroup ............................................................................................. 50

5
Figure 4.7 Stock Chart of Bank of America ................................................................................. 51
Figure 4.8 Stock Chart of Exxon Mobil........................................................................................ 51
Figure 4.9 Stock Chart of Chevron ............................................................................................... 52
Figure 4.10 Relative Strength of F & GM .................................................................................... 52
Figure 4.11 Relative Strength of T & VZ ..................................................................................... 53
Figure 4.12 Relative Strength of C & BAC .................................................................................. 53
Figure 4.13 Relative Strength of XOM & CVX ........................................................................... 54
Figure 4.14 Relative Strength of F & GM .................................................................................... 55
Figure 4.15 Relative Strength of T & VZ ..................................................................................... 55
Figure 4.16 Relative Strength of C & BAC .................................................................................. 56
Figure 4.17 Relative Strength of XOM & CVX ........................................................................... 56
Figure 4.18 Relative Strength of F & GM .................................................................................... 58
Figure 4.19 Relative Strength of T & VZ ..................................................................................... 58
Figure 4.20 Relative Strength of C & BAC .................................................................................. 59
Figure 4.21 Relative Strength of XOM & CVX ........................................................................... 59
Figure 4.22 Relative Strength of F & GM .................................................................................... 60
Figure 4.23 Relative Strength of T & VZ ..................................................................................... 61
Figure 4.24 Relative Strength of C & BAC .................................................................................. 61
Figure 4.25 Relative Strength of XOM & CVX ........................................................................... 61
Figure 4.26 Relative Strength of F & GM .................................................................................... 62
Figure 4.27 Relative Strength of T & VZ ..................................................................................... 63
Figure 4.28 Relative Strength of C & BAC .................................................................................. 63
Figure 4.29 Relative Strength of XOM & CVX ........................................................................... 64
Figure 4.30 Relative Strength of F & GM .................................................................................... 65
Figure 4.31 Relative Strength of T & VZ ..................................................................................... 65
Figure 4.32 Relative Strength of C & BAC .................................................................................. 66
Figure 4.33 Relative Strength of XOM & CVX ........................................................................... 66
Figure 4.34 Relative Strength of F & GM .................................................................................... 67
Figure 4.35 Relative Strength of T & VZ ..................................................................................... 68
Figure 4.36 Relative Strength of C & BAC .................................................................................. 68
Figure 4.37 Relative Strength of XOM & CVX ........................................................................... 69
Figure 4.38 Relative Strength of F & GM .................................................................................... 70
Figure 4.39 Relative Strength of T & VZ ..................................................................................... 70
Figure 4.40 Relative Strength of C & BAC .................................................................................. 71
Figure 4.41 Relative Strength of F & GM .................................................................................... 72
Figure 4.42 Relative Strength of T & VZ ..................................................................................... 72
Figure 4.43 Relative Strength of C & BAC .................................................................................. 73
Figure 4.44 Relative Strength of F & GM .................................................................................... 74
Figure 4.45 Relative Strength of T & VZ ..................................................................................... 74
Figure 4.46 Relative Strength of C & BAC .................................................................................. 75
Figure 5.1 Week 1 GALE Stock Price .......................................................................................... 80
Figure 5.2 Week 2 GALE Stock Price .......................................................................................... 81
Figure 5.3 Week 2 NAVB Stock Price ......................................................................................... 82
Figure 5.4 Week 2 GALE Stock Price .......................................................................................... 83
Figure 5.5 Week 4 GALE Stock Price .......................................................................................... 84
Figure 5.6 Week 4 NAVB Stock Price ......................................................................................... 84

6
Figure 5.7 Week 4 HII Stock Price ............................................................................................... 85
Figure 5.8 Week 4 SWI Stock Price ............................................................................................. 85
Figure 5.9 Week 4 ANIK Stock Price .......................................................................................... 86
Figure 5.10 Week 5 HII Stock Price ............................................................................................. 87
Figure 5.11 Week 5 SWI Stock Price ........................................................................................... 87
Figure 5.12 Week 5 ANIK Stock Price ........................................................................................ 88
Figure 5.13 Week 6 HII Stock Price ............................................................................................. 88
Figure 5.14 Week 6 SWI Stock Price ........................................................................................... 89
Figure 5.15 Week 6 ANIK Stock Price ........................................................................................ 89
Figure 5.16 Week 7 HII Stock Price ............................................................................................. 90
Figure 5.17 Week 7 SWI Stock Price ........................................................................................... 90
Figure 5.18 Week 7 ANIK Stock Price ........................................................................................ 91
Figure 5.19 Week 7 TCRD Stock Price ........................................................................................ 91
Figure 5.20 Week 8 HII Stock Price ............................................................................................. 92
Figure 5.21 Week 8 SWI Stock Price ........................................................................................... 93
Figure 5.22 Week 8 ANIK Stock Price ........................................................................................ 93
Figure 5.23 Week 8 TCRD Stock Price ........................................................................................ 94
Figure 5.24 Week 8 BMY Stock Price ......................................................................................... 94
Figure 5.25 Week 9 HII Stock Price ............................................................................................. 95
Figure 5.26 Week 9 SWI Stock Price ........................................................................................... 95
Figure 5.27 Week 9 ANIK Stock Price ........................................................................................ 96
Figure 5.28 Week 9 TCRD Stock Price ........................................................................................ 96
Figure 5.29 Week 9 BMY Stock Price ......................................................................................... 97
Figure 5.30 Week 10 HII Stock Price ........................................................................................... 98
Figure 5.31 Week 10 SWI Stock Price ......................................................................................... 98
Figure 5.32 Week 10 TRCD Stock Price ...................................................................................... 98
Figure 5.33 Week 10 BMY Stock Price ....................................................................................... 99
Figure 6.1 History IRBT 2005-2013 ........................................................................................... 107
Figure 6.2 History FCEL 1993-2013 .......................................................................................... 108
Figure 6.3 Stock Performance of Various Breweries ................................................................. 108
Figure 6.4 History BREW 2008-2014 ........................................................................................ 111
Figure 6.5 History DCI 1978-2014 ............................................................................................. 112
Figure 6.6 History MKC 1978-2014 ........................................................................................... 113
Figure 6.7 History HYMTF 2003-2014 ...................................................................................... 115
Figure 7.1 Portfolio Values for Four Strategies .......................................................................... 120

7
List of Tables
Table 3.1 Week 1 Transaction Record (Includes $10 commission fee per trade) ........................ 22
Table 3.2 Week 2 Transaction Record (Includes $10 commission fee per trade) ........................ 25
Table 3.3 Week 3 Transaction Record (Includes $10 commission fee per trade) ........................ 28
Table 3.4 Week 5 Transaction Record (Includes $10 commission fee per trade) ........................ 32
Table 3.5 Week 6 Transaction Record (Includes $10 commission fee per trade) ........................ 35
Table 3.6 Week 7 Transaction Record (Includes $10 commission fee per trade) ........................ 37
Table 3.7 Week 8 Transaction Record (Includes $10 commission fee per trade) ........................ 40
Table 3.8 Week 9 Transaction Record (Includes $10 commission fee per trade) ........................ 42
Table 3.9 Week 10 Transaction Record (Includes $10 commission fee per trade) ...................... 43
Table 4.1 Week 1 Transaction Record (Includes $10 commission fee per trade) ........................ 54
Table 4.2 Week 2 Transaction Record (Includes $10 commission fee per trade) ........................ 57
Table 4.3 Week 3 Transaction Record (Includes $10 commission fee per trade) ........................ 60
Table 4.4 Week 5 Transaction Record (Includes $10 commission fee per trade) ........................ 64
Table 4.5 Week 6 Transaction Record (Includes $10 commission fee per trade) ........................ 67
Table 4.6 Week 7 Transaction Record (Includes $10 commission fee per trade) ........................ 69
Table 4.7 Week 8 Transaction Record (Includes $10 commission fee per trade) ........................ 71
Table 4.8 Week 9 Transaction Record (Includes $10 commission fee per trade) ........................ 73
Table 4.9 Week 10 Transaction Record (Includes $10 commission fee per trade) ...................... 75
Table 5.1 Week 1 Transaction Record (Includes $10 commission fee per trade) ........................ 81
Table 5.2 Week 2 Transaction Record (Includes $10 commission fee per trade) ........................ 82
Table 5.3 Week 4 Transaction Record (Includes $10 commission fee per trade) ........................ 86
Table 5.4 Week 7 Transaction Record (Includes $10 commission fee per trade) ........................ 92
Table 5.5 Week 8 Transaction Record (Includes $10 commission fee per trade) ........................ 94
Table 5.6 Week 9 Transaction Record (Includes $10 commission fee per trade) ........................ 97
Table 5.7 Week 10 Transaction Record (Includes $10 commission fee per trade) ...................... 99
Table 6.1 Performance of 10 Successful Growth Stocks 1962-1972 ......................................... 103
Table 6.2 Performance of 10 Nongrowth Stocks 1962-1972 ..................................................... 103
Table 6.3 Key stats and ratios for IRBT ..................................................................................... 106
Table 6.4 Key stats and ratios for FCEL..................................................................................... 108
Table 6.5 Key stats and ratios for BREW ................................................................................... 111
Table 6.6 Key stats and ratios for DCI ....................................................................................... 112
Table 6.7 Key stats and ratios for MKC ..................................................................................... 113
Table 6.8 Key stats and ratios for HYMTF ................................................................................ 114
Table 6.9 Purchase Summary (Includes $10 commission fee per trade) .................................... 115
Table 6.10 Sell Summary (Includes $10 commission fee per trade) .......................................... 115
Table 6.11 Growth and Value Companies .................................................................................. 118

8
1 Introduction
This experiment was conducted using Google Finance, which is an online simulator based
off the real-time stock market. This simulation can be accessed at Google.com. There, the group
will attempt to predict market fluctuations by using analytical skills to analyze and track stock
price variations. The trading strategies investigated include: swing trading, pair trading, trading
the news, and growth investing. Each investor began with $100,000, which was invested
responsibly into the stock market according to their strategy. Before we conduct the simulation,
we must pick several companies to follow and invest in. The simulation will take place over the
duration of ten weeks and each investor will utilize their strategy effectively to maximize their
profits given the current economy.
1.1 Goals, Scope, General Plan
The objective of this report is to acquire the fundamental concepts associated with the stock
market. Through our research, we hope to develop profitable strategies to use in the stock market.
We also hope to gain valuable research techniques to determine which companies and markets will
be the most profitable to invest in. In addition, we want to learn the stock market language, so we
can communicate fluently with other stock investors. To gain these qualities, we will first research
the history of the stock market and different strategic trading methods. Each of us will choose a
strategy and become more familiar with it. At the end of the simulation, we will summarize and
compare the results of the trading strategies conducted by each person. When this plan is
completed, we would have achieved all the goals of understanding the stock market concepts and
language. This would allow us to manage our stocks more wisely in the future.

9
1.2 Stock Market Synopsis
The New York Stock Exchange was developed to fund the War of 1812. The government
began to sell bonds with the promise of profit for investors. In 1815, the market began to grow as
government bonds, bank stocks, and insurance stocks were traded. The Bank of New York was
the first company listed on the NYSE.
In 1923, the historic bull market began causing a surge in stock prices that continued rising
for the next six years. On September 3, 1929 the Dow Jones Industrial Average reached its peak
of 381.17. However, on October 29, 1929, also known as “Black Tuesday”, prices fell sharply and
the stock market “crashes”. The Dow Jones Industrial Average fell more than 11 percent. In July
1932 the Dow hit bottom, down 89 percent from its 1929 peak. It took many years before the stock
market regained value (NYSE EURONEXT, 2013).
Today there are various markets all over the world in which investors can invest. In the
United States, investors can invest in the New York Stock Exchange (NYSE), National
Association of Securities Dealers Automated Quotations (NASDAQ), and American Stock
Exchange (AMEX) in addition to many others.
The success of the stock market in 2013 is not only because of Google, Netflix, and Twitter,
but instead it has been a team effort by every large stock contributing company. Stocks in the
Standard & Poor’s 500 stock index are trading in the highest territory in over 10 years. In addition,
451 stocks out of the 500 in S&P 500 are sporting gains in 2013.
The market outcomes of 2013 are setting large-company’s stocks to be on track for its best
year since 2003, when 458 companies finished in the black. Stocks are posting great gains, which
is both a sign of market and economic strength. The current market success is highly dependent
on new technology and social media, which is going to be difficult for people trying to invest in

10
these types of companies for the long-term. The stock market reaching its all time highs in the last
10 years leads many analysts to question when and how far the market is going to fall [44].

11
2 Types of Investment
There are various types of investment people can allocate their funds. Some types include,
certificate of deposit, bond, mutual fund, real estate, precious metal, and stock. Each type of
investment boasts its own unique advantages and disadvantages. The best type of investment is
based on the amount of funds someone is willingly to invest, amount of risk involved, and the
duration of time available.
2.1 Certificate of Deposit
A certificate of deposit (CD) is a low risk investment with a low return over a short period
of time, usually from one month to two years. CDs are similar to regular savings accounts, but
they demand a fixed time period of deposit and pay a higher interest rate. The interest rates increase
with the duration of deposited time. For comparison, the interest rate is 0.04% for a regular savings
account, 0.15% for a one-month CD and 1.19% for a two-year CD [57].
2.2 Bond
A bond is a relatively long-term investment, usually from a few years up to 30 years. Some
common bonds include government bonds, municipal bonds, and corporate bonds. The risk and
return of bonds are dependent on the issuer. Bonds issued by a government are the most reliable,
but earn the least interest. In contrast, corporate bonds are less warranted, but pay a higher interest
rate, which sometimes outperform stocks.
2.3 Mutual Fund
A mutual fund is an investment in which a fund manager collects funds from a group of
investors and invests in a variety of securities or real estate. Although it is usually less risky than
stocks, some mutual funds are not regulated by a government and thus risky. The risk and return

12
involved depends on different funds. For example, bond funds have lower risk with lower return,
while stock funds have higher risk and return.
2.4 Real Estate
Real estate is a long-term investment and usually requires some expertise. It has high risk
and high return depending on the economy. One way to invest in real estate is to purchase a
property and rent it to tenants. Another way is to purchase an underrated property and sell it when
the value exceeds its appraisal value. An indirect way to invest in real estate is to purchase shares
of real estate investment trusts (REITs), which are similar to mutual funds in that investors would
earn an income without buying any real estate.
2.5 Precious Metal
Popular precious metals include silver and gold. Investing in precious metals is quite
different from other types of investment since they offer protection against inflation, currency
debasement, and financial stress of a country. However, the storage costs, insurance costs, and
lack of short-term gains will not provide a substantial income. Overall, precious metals are viewed
as a form of insurance more than investment.
2.6 Stock
Stock is extremely liquid and of high risk as the market fluctuates frequently and greatly.
The return, however, could be highly rewarding if traded wisely. A stock increases its value when
the company makes a profit and vice versa. There are various strategies to invest in the stock
market such as day trading, swing trading, and trend following.
Day trading is a common trading technique in the stock market to buy and sell a share of
stock within a single trading day to earn profits by small fluctuations in price. It is extremely risky,
but could be also highly profitable. Traders also have to pay a large commission fee, so the price

13
difference has to be sufficient. Therefore, traders must accurately evaluate the trends and carefully
choose the entry and exit point. In addition, traders have to set up a stop loss so that they would
not lose all their money.

14
3 Swing Trading Simulation
Among the variety of trading strategies, swing trading is one of the most common
techniques. It is not as labor intensive as day trading, but not as laid back as long-term trading.
Typically, a swing trader holds a stock for a few days up to a couple of weeks and trades four or
five times a week. Because stocks usually swing between high and low extremes, a swing trader
will ride the wave in one direction and ride the other direction when the price reverses [30]. In a
bear or bull market, swing trading becomes a challenge because stocks will not behave in the same
up and down oscillations as in a stable market [32]. When there is a bear or bull market, the trader
should opt for a long-term trade to gain higher profits. Overall, swing trading can gain some decent
profits when shares are purchased and sold at the right signals.
3.1 Technical Analysis
3.1.1 Support and Resistance
One of the most important analyses in swing trading is pinpointing the support and
resistance in a stock. Support is a specific price point in the chart where the stock price has trouble
breaking through. This is easily recognizable in Figure 3.1, when the stock falls and rebounds at
the low point several times. Thus, it is safe to say there is support at the specified low point.
Figure 3.1 Example of Support

15
On the other hand, resistance is where the price of the stock has trouble breaking past a
certain high point. This is when a stock tries to surpass its highest point, but fails. As shown in
Figure 3.2, the stock hit the same high point several times signaling that this is a strong resistance.
Figure 3.2 Example of Resistance
Since support and resistance are usually the high and low of the oscillation in a stock, swing
traders will keep an eye on these points to figure out when to enter or exit the stock. Obviously,
there is a point when a stock will eventually stop bouncing off the support or resistance level and
break through these points.
When a stock passes through the support or resistance level, swing traders will keep a close
eye on the stock because it is experiencing a break out. This is when the stock makes new highs
upon breaking the resistance level, which starts a new short-term upward trend. The new highs
will become the new resistance and the old resistance will now be the new support [29]. More
often than not, the stock will undergo a small pull back after a break out. A pull back is a minor
drop in the stock, which may drop all the way down to the new support level and bounce up for
the next new high [27]. This is exemplified in Figure 3.3. As a swing trader, this point would be
an ideal time to purchase and go for the ride on an upward movement. The next step the swing
trader needs to do is to keep an eye on the next resistance. It is important to exit if the stock bounces
back on the next resistance and to hold if it breaks through the next resistance. A support breakout
is just the opposite of a resistance breakout, where a support breakout starts a new short-term

16
downtrend. For example, when the stock makes a new low on a downtrend, the new low will
become the new resistance.
Figure 3.3 Old Resistance Becomes New Support
Another important analysis to consider when swing trading is to make sure the quarterly
earnings for the company will not be released anytime soon. The reason is because earnings may
cause the stock to gap up or down. Thus, this will disturb the trend the swing trader is anticipating.
Since there is no way of predicting if the earnings will cause the stock price to gap up or down, it
would not be wise to place a position during the release of earnings.
3.1.2 Volume and Price Relationship
Volume and price relationship is another technical analysis a swing trader uses to improve
his or her chance to gain profits. Volume is the amount of shares being bought and sold in a given
amount of time. An increase in volume with respect to the normal volume can signal an increasing
interest in the stock, which predicts something is going to happen soon [29]. When volume is
coupled with price on a stock chart, swing traders can get a better understanding of what may
happen in the future, such as trend reversals.
A trend reversal may be predicted using a volume-price relationship. After a long upward
or downward trend, a spike in volume may signal an end of trend, which can be seen in Figure 3.4.
On a downward trend, many people want to get out of the trade because they are panicking about

17
the rapid decline [29]. So, people begin to sell making the price decrease. Simultaneously, the
volume is surging because the shareholders are heavily selling. Once all the sellers made their
position, buying pressure begins to take over the market and the price increases, which translates
to a trend reversal. This also holds true for a reversal on an upward trend, but instead of sellers
panicking about a rapid decline, buyers are missing out on an upward trend.
Figure 3.4 Volume and Price Trend Reversal
3.1.3 Simple Moving Averages
Since there are a lot of price fluctuations in a stock chart, it is sometimes difficult to spot
the trend direction. Thus, a solution to smooth out price fluctuation is to add a simple moving
average (SMA) indicator, which can help a trader spot the trend direction [53]. A simple moving
average indicator is the average of the given closing prices. For an example, a 10 SMA is calculated
by summing the last 10 closing prices and dividing by 10. Even though this is a simple indicator,
it is extremely useful for swing traders to spot trend reversals.
Simple moving averages can signal trend reversals when the price crosses over a simple
moving average. Usually, when a price crosses over a faster moving average such as a 10 simple
moving average, it signals a short-term reversal. This can be easily seen in Figure 3.5. On the other
hand, when a price crosses over a slower moving average such as a 50 simple moving average, it
signals a long-term reversal [53].

18
Figure 3.5 Price Crosses Simple Moving Average
When a simple moving average crosses over another moving average, a trend reversal is
signaled [53]. If a faster moving average crosses over a slower moving average, it signals a
downtrend and if a slower moving average crosses over a faster moving average, it signals an
upward trend. Just as in Figure 3.6, the 10 SMA crosses (faster moving average) over the 20 SMA
(slower moving average) signaling a downtrend.
Figure 3.6 Simple Moving Average Crossover
3.2 Companies
Waste Management Inc. (WM)
Waste Management Inc. is a company that provides waste management services to a wide
array of customers such as residential, commercial, and industrial customers in the United States.
Some services it provides are collection, transfer, recycling and resource recovery, and disposal.

19
In addition, WM engages in renewable energy ideas such as waste-to-energy and landfill gas-to-
energy [55].
FMC Technologies Inc. (FTI)
FMC Technologies Inc. was founded in 2000 and provides technological services to the
energy industry. FTI has three segments, which includes Subsea Technologies, Surface
Technologies, and Energy Infrastructure. The Subsea Technologies segment provides subsea
systems for the production of crude oil and natural gas in offshore areas. On the other hand, the
Surface Technologies segment provides surface wellheads, fluid control products, and wireline
services for the oil and gas industry. Lastly, Energy Infrastructure segment provides measurement
systems, loading and transfer systems, and separation systems [19].
Fiserv Inc. (FISV)
Fiserv Inc. was founded in 1984 and it provides financial service technologies to banks,
thrifts, credit unions, retailers, and government agencies. The company has two segments, which
are Payments and Industry Products and Financial Institution Services. To name a few, The
Payment and Industry Products offer electronic bill payment, Internet and mobile banking systems,
account-to-account transfers and person-to-person payments. The Financial Institution Services
segment offers different kinds of processing services such as account and item processing. It also
provides cash management, consulting services, and offers many products and services related to
financial transactions [18].
AGL Resources Inc. (GAS)
AGL Resources is a company that provides energy-holding services by distributing natural
gas to a wide range of costumers, which includes residential, commercial, industrial, and
governmental consumers. This company consists of five segments: Distribution Operations, Retail

20
Operations, Wholesale Services, Midstream Operations, and Cargo Shipping segment. This
company was founded in 1856 and continues to be a strong competitor in the energy business [21].
The Kroger Co. (KR)
Kroger Co. is a large retail company that manufactures and processes food that owns and
operates many retail food and drug stores, jewelry stores, and convenience stores. Furthermore, it
sells a wide variety of goods such as jewelry, home goods, electronics, toys, and automotive parts.
This company owns many franchises such as Kroger, City Market, Dillons, Jay C, Food 4 Less,
and many more. The Kroger Co. was founded in 1883 in Cincinnati, Ohio [34].
3.3 Simulation Transactions
3.3.1 Week 1: 12/02/13-12/06/13
Market Overview
WM:
As shown below (Figure 3.7), there were three days that spiked up in volume, which signals
a potential trend reversal. Later on in week, the price drop passed the 20 SMA to confirm its trend
reversal.
Figure 3.7 Waste Management Technical Chart
FISV:
On the FSIV’s stock chart below (Figure 3.8), the arrow shows a spike in volume last week,
which was a signal for a possible trend reversal. So this week, this investor waited for the move

21
down to confirm a downtrend. But at the end of the week, there was good publicity for FISV and
the price began to increase.
Figure 3.8 Fiserv Technical Chart
FTI:
At the beginning of the week, this investor waited for FTI to bounce back up from touching
the support last week. As depicted in Figure 3.9, there are small candlesticks near the resistance
price without any significant price movement and the 10 SMA and 20 SMA moving closer
together. This investor paid special attention to the technical chart to look for a buy signal. During
the middle of the week, the price began to increase and finally the stock price closed above the 20
SMA to confirm an upward trend.
Figure 3.9 FMC Technologies Technical Chart
Course of Action:
During the first week of the simulation, a few transactions were made. Once WM crossed
the 20 SMA, this investor sold short 200 shares at $44.65 on December 3, 2013. Also, this investor

22
decided to sell short 200 shares of FISV at $109.57 on December 4, 2013. But at the end of the
week, there was good publicity for FISV and the price began to rise. Thus, this investor needed to
buy back to cover at $110.84 with a loss of $274 before the investor had a larger negative net gain.
Since FTI closed above the 20 SMA, this investor bought 300 shares at $50.18 on December 5th,
2013. These transactions were recorded in Table 3.1.
Results:
At the end of the week, this investor had lost $274 from FISV. Even though this investor
lost money from WM, the investor still believes the trend is behaving the way it should be.
Furthermore, FTI still has some potential to gain, so this investor is holding on to it.
Date Symbol Buy/Sell Price Shares Net Cost/
Proceeds
Profit/
Loss
Total
Cash
Total
Profit
12/02/13 100000
12/03/13 WM Sell Short $44.65 200 $8920 108920
12/04/13 FISV Sell Short $109.57 200 $21904 130824
12/05/13 FTI Buy $50.18 300 -$15064 115760
12/06/13 FISV Buy to Cover $110.84 200 -$22178 ($274) 93582 ($274)
Table 3.1 Week 1 Transaction Record (Includes $10 commission fee per trade)
3.3.2 Week 2: 12/09/13-12/13/13
Market Overview
WM:
At the beginning of the week, WM’s price made small incremental moves down. But on
Thursday, WM made a large move down, almost 2% from the opening price that day. The stock
price was approaching a support level of around $43.60, as shown in the Figure 3.10. Therefore,
the stock may rebound up from that price point next week.

23
Figure 3.10 Waste Management Technical Chart
FTI:
As shown in the chart below (Figure 3.11), FTI had a minor pull back and it looks like FTI
is consolidating for a next big move up. The stock price stayed above the 10 SMA, which was a
sign that there was still more buying pressure to push the price higher. For next week, there is still
more room for the price of FTI to move higher.
Figure 3.11 FMC Technologies Technical Chart
GAS:
Last week this investor saw two days with huge volume, which made the investor keep an
eye for a trend reversal. As shown in Figure 3.12, the technical chart of GAS, there appears to be
yet again another a day with large volume. The price seems to be rounding off and there is a
potential upward trend next week.

24
Figure 3.12 AGL Resources Inc. Technical Chart
KR:
Even though this company had already reversed its trend a few weeks ago, this investor
was interested in KR this week because it tested support at around $39.80 as shown in Figure 3.13.
There is a chance for next week to break through support after two attempts of breaking through
the support.
Figure 3.13 Kroger Co. Technical Chart
Course of Action
The first day of the week, this investor decided to buy 500 shares of GAS at $45.18 because
the investor saw several days with large volume, which signals a trend reversal. This investor also
bought to cover 200 shares of WM at $43.76 after making a large move down. The investor wanted
to get out because it was hitting support at $43.65. On Friday, this investor sold short 500 shares
of KR at $39.85 because the investor thought it would break through the support because on a 5

25
min chart, KR was making large moves down. All these transactions were recorded in the table
below (Table 3.2).
Results
At the end of the week, this investor’s portfolio value was $100,438, which is much better
than last week where the portfolio value was $99,832. This investor is still holding on to FTI
because the investor thinks it is still a profitable stock. Furthermore, GAS’s price has not made a
move up this week, but there is no reason to get out of the position yet.
Date Symbol Buy/Sell Price Shares Net Cost/
Proceeds
Profit/
Loss
Total
Cash
Total
Profit
12/09/13 GAS Buy $45.18 500 -$22600 70982
12/12/13 WM Buy to Cover $43.76 200 -$8762 $158 62220 ($116)
12/13/13 KR Sell Short $39.85 500 $19915 82135
Table 3.2 Week 2 Transaction Record (Includes $10 commission fee per trade)
3.3.3 Week 3: 12/16/13-12/20/13
Market Overview
WM:
On December 17, 2013, WM broke through support at around $43.54 and passed through
the 50 SMA as depicted in the technical chart below (Figure 3.14). The next day, WM reversed
and the price rallied back up hard to approximately $44. This may potentially become a short-term
trend reversal. For next week, there may be a few days with an increase in price.
Figure 3.14 Waste Management Technical Chart

26
FTI:
On December 16th, FTI gaped up with a slight increase in volume, but then the price moved
slowly down during the week. As it can be seen in Figure 3.15, FTI opened above the 50 SMA
and at the end of the week the price still stayed above the 50 SMA, which means that there is still
a potential upside. As long as the price is above the 20 SMA, FTI may continue to increase in price
next week.
Figure 3.15 FMC Technologies Technical Chart
GAS:
In the middle of the week, there was a spike up in volume that may signal for a turn around.
On the last day of the week, the price made a large move on the upside passing through the 50
SMA, which is exemplified in Figure 3.16 below. There is a great deal of potential for making
higher moves up over the next few trading days.
Figure 3.16 AGL Resources Inc. Technical Chart

27
KR:
KR attempted to pass through support several times, but it bounced back up immediately.
Basically, the price is moving sideways without any significant price movement. As shown in
Figure 3.17, KR’s price is held up by the support and pushed down by the 10 SMA, which is
forcing the price into a point that may lead to a large move down or up next week.
Figure 3.17 Kroger Co. Technical Chart
Course of Action:
On the first day of the week, this investor decided to book $820 profit from FTI by selling
300 shares at $52.98. Also, this investor closed the position on KR to take a loss of $5 because
next week the price may make a large move up or down and the investor did not want to risk losing
a large sum of money. On Tuesday, this investor sold short 500 shares of WM at $43.53 because
it went below support and it passed the 50 SMA, which signals a continuation of a downward
trend. But at the start of the December 20th, WM came back up hard, so this investor bought to
cover 500 shares of WM at $44.10 to take a loss of $305. On December 18th, this investor sold
short 500 shares of KR at $39.36 because it passed through support by a large amount. This
investor decided to sell 500 shares of GAS at $46.18 to book a profit of $480 because the day
before had a small spike in volume, which may signal for a downtrend. This week’s transactions
were recorded in Table 3.3.

28
Results:
At the end of this trading session, this investor’s portfolio value was $100,884, which is a
large improvement from last week’s portfolio value. This investor is holding on to KR because the
investor thinks there will be some more room for the price to drop. Furthermore, this investor is
keeping GAS because the investor feels there is no reason for a trend reversal yet.
Date Symbol Buy/Sell Price Shares Net Cost/
Proceeds
Profit/
Loss
Total
Cash
Total
Profit
12/16/13 FTI Sell $52.98 300 $15884 $820 98019 $704
12/17/13 KR Buy to Cover $39.8 500 -$19910 $5 78109 $709
12/17/13 WM Sell Short $43.53 500 $21755 99864
12/19/13 GAS Sell $46.18 500 $23080 $480 122944 $1189
12/20/13 WM Buy to Cover $44.1 500 -$22060 ($305) 100884 $884
Table 3.3 Week 3 Transaction Record (Includes $10 commission fee per trade)
Note: No transaction will be conducted from December 23, 2013 to January 17, 2014 due to the
winter break.
3.3.4 Week 4: 01/20/14-01/24/14
Market Overview
WM:
As shown in the chart below (Figure 3.18), WM was hitting support around $42.75 and the
price gaped down below the support near the end of the week. The next support level was around
$41.00.
Figure 3.18 Waste Management Technical Chart

29
FTI:
In Figure 3.19, one can see that the stock price has been moving sideways. There is no
clear indication of what will happen next. But at the end of the week, the price began to decline a
little faster. There may be some potential to short sell FTI next week depending on how the price
and volume behaves.
Figure 3.19 FMC Technologies Technical Chart
GAS:
On Monday, the stock price went up substantially, but later in the week GAS’s price began
to slowly decline as shown in Figure 3.20. There was no indication of what will happen in the
future and no entering signals.
Figure 3.20 AGL Resources Inc. Technical Chart
KR:
After a massive drop in price over the winter break as depicted in Figure 3.21, KR was
approaching the support this week. There were no clear signs of bouncing back or breaking through
the support.

30
Figure 3.21 Kroger Co. Technical Chart
FISV:
Even though this stock has been on a decline, there was no clear entry point. FISV’s price
has been making large moves up and then large moves down as shown in Figure 3.22.
Figure 3.22 Fiserv Technical Chart
Course of Action:
No transactions were made because there were no signals to enter any positions in any of
the 5 stocks. WM had a potential small profit, but the risk for the potential small amount of profit
was higher, therefore this investor did not enter in a transaction for WM.
Results:
No change in this investor’s portfolio value. Since no transaction was conducted, no table
of transactions was presented.

31
3.3.5 Week 5: 01/27/14-01/31/14
Market Overview:
WM:
In the past week, the volume was increasing and it was a little higher than usual as depicted
in the chart below (Figure 3.23). In addition, on Thursday the price began to make its move
upwards. With the volume increasing and the price moving higher, WM may make large price
moves up next week.
Figure 3.23 Waste Management Technical Chart
FISV:
At the start of the week, FISV hit support at around $55.60 and made a move upward.
Furthermore, there has been a larger increase in volume since last week, which may signal for a
trend reversal. Despite FISV major drop in price Friday, one can see in Figure 3.24 that the price
made its way back up support, which shows that there is still more potential for the price to increase
next week.
Figure 3.24 Fiserv Technical Chart

32
Course of Action:
On Monday, this investor bought 500 shares of FISV at $56.09 because FISV have been
increasing in volume. Furthermore, it bounced back up after hitting support, which shows there is
an increase in buying pressure. Near the end of the week, this investor bought 500 shares of WM
at $41.78 because there was a slight increase in volume and the price had made its move upward,
which may confirm a trend reversal. The two transactions this week were recorded in Table 3.4.
Results:
At the end of the week this investor’s portfolio value was $100,844. The investor is holding
on to FISV because even though the price broke through support on Friday, it closed higher than
the support. This shows that there are still people interested in buying FISV. This investor is also
holding on to WM because there are still potential to move higher in price.
Date Symbol Buy/Sell Price Shares Net Cost/
Proceeds
Profit/
Loss
Total
Cash
Total
Profit
01/27/14 FISV Buy $56.09 500 -$28055 72829
01/30/14 WM Buy $41.78 500 -$20900 51929
Table 3.4 Week 5 Transaction Record (Includes $10 commission fee per trade)
3.3.6 Week 6: 02/03/14-02/07/14
Market Overview:
WM:
On Monday, the price dropped 1.73% with a slightly larger volume than usual. The next
day the price began to move up and by the end of the week the price closed above the 20 SMA at
$42.84 as shown in Figure 3.25. There is still more room for WM to increase in price next week.

33
Figure 3.25 Waste Management Technical Chart
FISV:
On Monday, the price of FISV attempted to cross the 10 SMA, but failed. Instead, FISV
made a huge drop down and the price ripped through the support at around $55.60, as shown in
the chart below (Figure 3.26). But during the week, the price moved sideways and stayed below
the support. This may setup for FISV’s price to make larger moves down next week.
Figure 3.26 Fiserv Technical Chart
KR:
KR started the week off making newer lows, but on Thursday it made a huge move up.
Furthermore, the price broke through the 10 SMA showing there may be a potential uptrend. A
further analysis of the chart below (Figure 3.27), there is a resistance at $36.87, which KR hit on
Friday and fell sharply afterwards. Next week, this stock may break through the resistance at
$36.87 for an upward trend or continue its downtrend.
34
Figure 3.27 Kroger Co. Technical Chart
GAS:
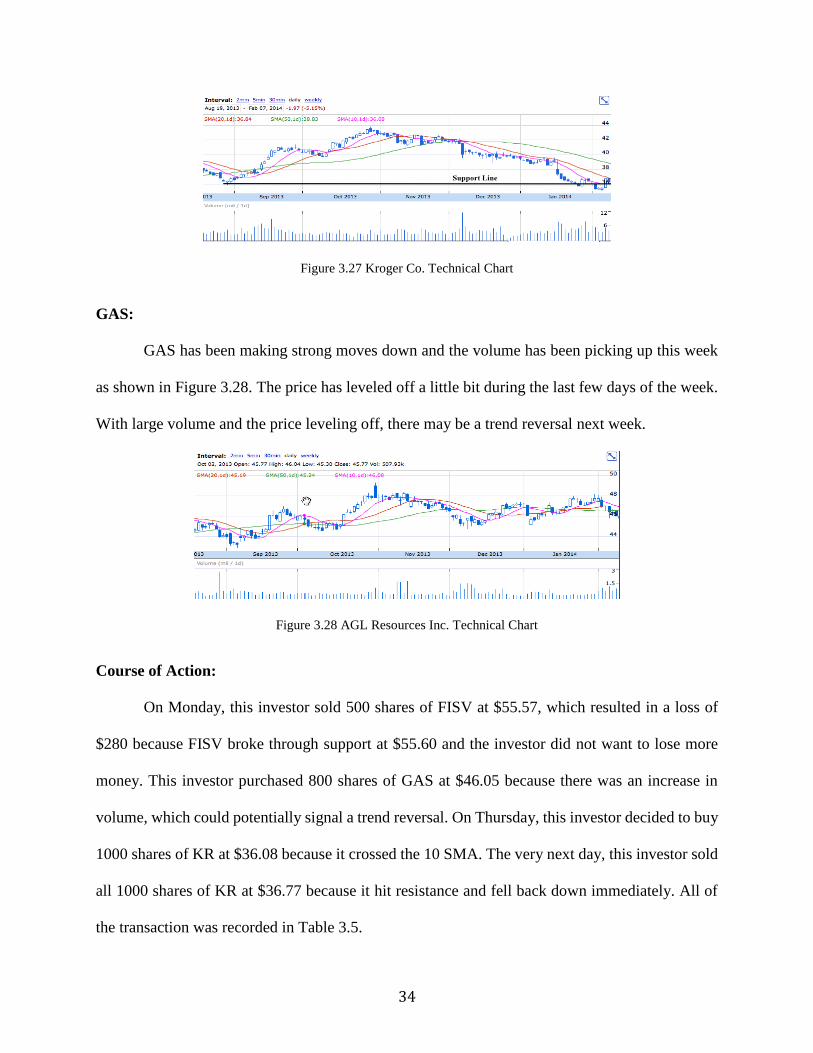
GAS has been making strong moves down and the volume has been picking up this week
as shown in Figure 3.28. The price has leveled off a little bit during the last few days of the week.
With large volume and the price leveling off, there may be a trend reversal next week.
Figure 3.28 AGL Resources Inc. Technical Chart
Course of Action:
On Monday, this investor sold 500 shares of FISV at $55.57, which resulted in a loss of
$280 because FISV broke through support at $55.60 and the investor did not want to lose more
money. This investor purchased 800 shares of GAS at $46.05 because there was an increase in
volume, which could potentially signal a trend reversal. On Thursday, this investor decided to buy
1000 shares of KR at $36.08 because it crossed the 10 SMA. The very next day, this investor sold
all 1000 shares of KR at $36.77 because it hit resistance and fell back down immediately. All of
the transaction was recorded in Table 3.5.

35
Results:
At the end of the week, this investor gained $908 with a total end of the week value of
$101,752. This investor is holding on to GAS because the investor believes there will be a move
upward next week. In addition, this investor is still holding WM because there are no signs of any
reversal yet.
Date Symbol Buy/Sell Price Shares Net Cost/
Proceeds
Profit/
Loss
Total
Cash
Total
Profit
02/03/14 FISV Sell $55.57 500 $27775 ($280) 79704 $604
02/05/14 GAS Buy $46.05 800 -$36850 42854
02/06/14 KR Buy $36.08 1000 -$36090 6764
02/07/14 KR Sell $36.77 1000 $36760 $670 43524 $1274
Table 3.5 Week 6 Transaction Record (Includes $10 commission fee per trade)
3.3.7 Week 7: 02/10/14-02/14/14
Market Overview:
WM:
After a substantial increase in price last week, WM consolidated early this week by forming
an ascending triangle. As shown below (Figure 3.29), the volume decreased while each day WM’s
price made higher lows. The top part of the triangle represents the resistance at around $43.00.
Finally, on Thursday the price broke through the resistance, but without a large spike in volume.
There is a chance WM may begin to decrease in price next week depending on the volume size.
Figure 3.29 Waste Management Technical Chart

36
FTI:
Last week, FTI hit support at around $47.60 and bounced back up in price. On Monday,
the price began to increase and merge back into its own “upward channel” as shown in Figure
3.30. There is more room for the price to increase in the next few weeks as long as the price stays
within this “upward channel”.
Figure 3.30 FMC Technologies Technical Chart
GAS:
The price of GAS dropped during the week, but rallied back up on Thursday and Friday.
After the recent large increase in volume, the price began to move up confirming a trend reversal
as shown in Figure 3.31.
Figure 3.31 AGL Resources Inc. Technical Chart
Course of Action:
Early on this week, this investor bought 800 shares of FTI at $50.14 because the price
bounced back up from support and merged back into its “upward channel”. This investor missed

37
the entry this Monday or else the investor could have gained a larger profit. Also, this investor sold
800 shares of FTI at $51.88 on Thursday because it went above its “upward channel” and then the
price began to drop back into its original channel that same day. Thus, this investor wanted to book
the profit before losing it all. Both transactions was recorded in the table below (Table 3.6).
Results:
At the end of this week the investor’s portfolio value reached $103,811, which is a major
increase in value of over $2,000 from last week. The overall market was increasing which
contributed to this week’s major success. This investor is holding on to WM because the investor
believes there is still more profit that can be captured. But, the investor must be careful because
the breakout could be a false alarm. Therefore, this investor must pay special attention to the
volume of WM to help predict the trend of WM. Also, this investor is holding on to GAS because
the investor feels that there is still more room for GAS to grow in price.
Date Symbol Buy/Sell Price Shares Net Cost/
Proceeds
Profit/
Loss
Total
Cash
Total
Profit
02/11/14 FTI Buy $50.14 800 -$40122 3402
02/13/14 FTI Sell $51.88 800 $41494 $1372 44896 $2646
Table 3.6 Week 7 Transaction Record (Includes $10 commission fee per trade)
3.3.8 Week 8: 02/17/14-02/21/14
Market Overview:
WM:
On Tuesday, WM gapped down breaking the upward trend due to lower than expected
earnings. This can easily be seen in Figure 3.32. As a result, WM’s price headed straight down
over the course of the week testing support at around $40.83.

38
Figure 3.32 Waste Management Technical Chart
FISV:
As shown below in Figure 3.33, FISV broke through its downward channel for a potential
new upward trend. The 10 SMA and 20 SMA, crossed which signals a potential upward trend.
Furthermore, FISV’s price broke through the 50 SMA and each day the price closed above the 50
SMA. With the price looking like it is rounding off, there may be a potential short-term reversal
next week.
Figure 3.33 Fiserv Technical Chart
KR:
KR’s price made large moves upward this week and it passed through the 50 SMA
confirming an upward trend. As shown below (Figure 3.34), there is a resistance at around $39.60,
which KR nearly hit on Thursday. Next week, KR may either bounce off the resistance and make
a short-term downward trend or break through the resistance.

39
Figure 3.34 Kroger Co. Technical Chart
GAS:
GAS has been slowly making moves upward besides one day, which had a large decrease
in price. As it can be seen in the technical chart below (Figure 3.35), there is a resistance at around
$47.00 that is causing trouble for GAS’s price to continue increasing. Next week, there is potential
for GAS to break through the resistance but one must pay special attention to the volume and price
to detect a successful breakout.
Figure 3.35 AGL Resources Inc. Technical Chart
Course of Action:
On Monday, this investor sold all 500 shares in WM because the stock price gapped down
and the investor didn’t want to lose anymore profit. This investor also sold short 1000 shares of
WM on the same day after the investor sold all 500 shares of WM. The price was falling fast and
this investor went on for the ride down till WM hit its support at $40.90. This investor bought to
cover WM the next day after it bounced back up from support to book a $1280 profit. This investor

40
also bought KR because the price broke past the 50 SMA and it has been making large price moves
upward. This investor bought 200 shares of FISV because it broke through the downward channel
for an upward trend. At the end of the week, this investor decided to sell all 200 shares of FISV
because the price was rounding off and the candlesticks were becoming small with large “wicks”
signaling a trend reversal. All the transactions for week 8 was recorded on Table 3.7.
Results:
At the end of the week, the investor’s portfolio value was $105,386. This investor is
holding on to both KR and GAS because the investor feels that there is potential for both the stocks
to break through their resistance. Next week, this investor must pay special attention to the volume
and the price movement of both to ensure a successful breakout or a potential trend reversal.
Date Symbol Buy/Sell Price Shares Net Cost/
Proceeds
Profit/
Loss
Total
Cash
Total
Profit
02/18/14 WM Sell $43.08 500 $21530 $630 66426 $3276
02/18/14 WM Sell Short $42.58 1000 $42570 108996
02/19/14 KR Buy $38.34 500 -$19180 89816
02/19/14 FISV Buy $57.02 200 -$11414 78402
02/19/14 WM Buy to Cover $41.28 1000 -$41290 $1280 37112 $4556
02/21/14 FISV Sell $57.10 200 $11492 $78 48604 $4634
Table 3.7 Week 8 Transaction Record (Includes $10 commission fee per trade)
3.3.9 Week 9: 02/24/14-02/28/14
Market Overview:
KR:
KR’s price opened above its resistance of $39.60 on Monday and each day the stock price
slowly increased in price. This is a sign of consolidation because the volume is decreasing while
the price makes small incremental increases. The price increased significantly on Friday with a
large candlestick and large volume, as shown in Figure 3.36. When this happens after a long

41
upward trend, it signals for a trend reversal. This technical analysis is called exhaustion. Thus, KR
is expected to decrease in price next week.
Figure 3.36 Kroger Co. Technical Chart
GAS:
As shown in the chart below (Figure 3.37), GAS made a minor pull back this week after
last week’s bullish run. On Friday, GAS’s price broke through its resistance at $47.00, but it had
a hard time going higher because there is minor resistance at $47.37. Next week, there may be
more room for GAS price to increase but one must pay attention to the volume and price.
Figure 3.37 AGL Resources Inc. Technical Chart
Course of Action:
On Wednesday, this investor bought 500 additional shares of KR at $38.89 because KR’s
price passed its resistance at around $38.60. Furthermore, the technical chart for KR showed that
the price was consolidating for a next large move up. This investor also sold 1000 shares of KR
on Friday because the technical chart showed an exhaustion candlestick, which means there is a
potential trend reversal. This week’s transactions were recorded on Table 3.8.

42
Results:
At the end of the week, this investor’s portfolio value is $108,191, which is a major increase
from last week. As shown in the table below (Table 3.8), the investor profited $2,775 from the KR
stock, which contributed to a large increase in portfolio value. This investor is also holding on to
GAS because the investor feels that there is still more room for the price to increase especially if
it breaks through its resistance at $47.00.
Date Symbol Buy/Sell Price Shares Net Cost/
Proceeds
Profit/
Loss
Total
Cash
Total
Profit
02/26/14 KR Buy $39.89 500 $19995 28609
02/28/14 KR Sell 41.92 1000 $41910 $2775 70559 $7409
Table 3.8 Week 9 Transaction Record (Includes $10 commission fee per trade)
3.3.10 Week 10: 03/03/14-03/07/14
Market Overview:
GAS:
As shown in the graph below (Figure 3.38), GAS barely broke through the resistance at
$47.00. Instead, the price topped off at around $47.60 with a slight increase in volume and made
its way down near the end of the week. This may signal a short-term trend reversal. For the next
week, this investor would expect GAS to continue decreasing in price.
Figure 3.38 AGL Resources Inc. Technical Chart

43
Course of Action:
At the end of the trading day on Tuesday, this investor decided to sell 500 shares of GAS
at $47.48 because there was a slight increase in volume that may signal for a trend reversal. Also,
the price on Tuesday didn’t close much higher than the opening price, which means it wasn’t a
strong breakout. The final transaction of this simulation was recorded in Table 3.9.
Results:
At the end of the week, this investor’s portfolio value was $108,533 and the investor
profited $1,124 from selling 500 shares of GAS.
Date Symbol Buy/Sell Price Shares Net Cost/
Proceeds
Profit/
Loss
Total
Cash
Total
Profit
03/04/14 GAS Sell $47.48 800 $37974 $1124 108533 $8533
Table 3.9 Week 10 Transaction Record (Includes $10 commission fee per trade)
3.4 Results and Discussion
At the end of the simulation, this investor has profited $8,533, which is an 8.5% gain in ten
weeks. It was difficult for a swing trader to maximize his or her profits by buying and selling on
the high and low extremes, since the stock market was in a bullish run during the simulation.
Instead, it would be more profitable if a trader just invested for a long-term trade.
During the first two weeks of the simulation this investor tended to wait too long to jump
into a trade even when there was a signal to enter. If this investor got into the position right when
the signal was shown in the chart, they could have maximized their profit. For example, in the first
week this investor purchased FTI at $50.18, but in a few days the technical chart of FTI signaled
a trend reversal at around $48.00. Obviously, had this investor place a trade at around $48.00, this
investor could have made $2.00 extra per share, which would be a large increase in profit.
Furthermore, there are times when this investor got out of the position too early. For example in

44
week 6, this investor bought KR at $36.08 and sold it the next day at $36.77 to book a profit of
$670. If this investor read the charts more carefully there was no reason to get out of the position
yet and in the next few weeks they could have sold KR at around $42.00 to make roughly $6.00 a
share rather than 69 cents a share.
Although technical analysis can greatly improve a trader’s odds of gaining profit, it should
not be the only analysis a trader uses in trading stocks. News is an important factor that should
also be considered. In this investor’s simulation, there were several times when the news either cut
into their profits or forced them to make losses. For example, in week 8, WM was forming an
ascending triangle but suddenly WM’s missed its targeted earnings, which completely shattered
this investor’s ascending triangle trend. If WM’s earnings report did not come out, there would
have been a good chance the price would increase even more. As one can see, swing trading with
technical analysis is not always as straightforward and not always one hundred percent correct
even when a trader sees a perfect technical pattern in the charts. Thus, news is extremely important
and it should take priority over technical analysis.
Throughout the simulation this investor relied less and less on the simple moving averages
because the investor noticed that the moving averages are not signals to enter a trade. Every time
the simple moving averages cross, it was a little late to get into a position. Thus, simple moving
averages should only be used to look for trends and not for signals to enter a position. They also
can be used to help a trader confirm a trend reversal when the investor sees a trend reversal signal
from either a price and volume analysis or other technical patterns. Simple moving averages are
useful, but are only useful when combined with other types of analysis.
There were times when technical analysis helped the investor pin-point exactly when to
enter and when to exit allowing them to maximize their profits. For example, in week 6, this

45
investor purchased GAS at the exact time of a trend reversal signal by using a price and volume
analysis and then sold it right when it indicated another trend reversal by using the same analysis.
In the end this investor maximized their profit totaling $1,124 in this trade.
Swing trading with technical analysis can be very profitable if a trader has the time to
constantly keep an eye on the stock charts. There are times when this investor missed a signal to
enter a position because this investor was either in class or occupied with other tasks. If this
investor had the time to constantly watch the stock market, they would be able to control their
portfolio better to maximize any gains. Overall swing trading is a good strategy to capture a
reasonable amount of profits even when the stock market is bullish.

46
4 Pair Trading Simulation
4.1 Introduction
To earn profit with relatively low risk, pair trading is an effective strategy. It is called pair
trading because an investor usually trades two historically highly correlated stocks at the same
time. These two stocks are usually in the same market such as Ford and General Motors, or Coca-
Cola and Pepsi. Pair trading could be either long term or short term.
A pair trader usually waits and keeps watching the stock market until the correlation
between a pair of correlated stocks weakens. Then the pair trader buys an underperforming stock
and short sells the outperforming one simultaneously. When the correlation becomes strong again,
some profits are realised if the value of one stock increases greater than the other [54].
4.2 Mechanism
Refer to Figure 4.1. In Phase I, two stocks are highly correlated at their historical values.
A pair trader would wait until Phase II, when their correlation starts to weaken. As the red stock
moves up greater than the blue stock in this figure, the red stock is called the outperforming one.
In Phase III when their values start to return to their historical values, the pair trader buys the blue
stock and short sells the red stock. In Phase IV, both stocks return to their historical values and the
pair trader gains from the red stock while losing from the blue. When the gain and the loss are
summed, the pair trader makes profit because the gain is greater than the loss [54].

47
Figure 4.1 Mechanism of Pair Trading
4.3 Terminology
4.3.1 Correlation
Correlation is a statistical terminology that describes the relationship between two trends.
It is measured by the correlation coefficient, which ranges between -1 and 1. A correlation
coefficient is 1 if both trends move in exactly the same direction, -1 if exactly opposite, and 0 if
the pair moves randomly.
In pair trading, a high correlation represents that a pair of stocks moves synchronically. In
this case, a pair trader could hedge against risk by buying one stock and short selling its counterpart
by an equal amount of capital. If the pair of stocks moves upward or downward at the same rate,
the pair trader would neither earn nor lose money. However, when the pair does not move
synchronically a pair trader can earn the percent difference.
In reality, it is impossible to find a pair of stocks which has the correlation coefficient equal
to 1. Typically, a correlation of 0.8 or above is considered a high correlation and less than 0.5 is
weak [38].

48
4.3.2 Price Ratio
Price ratio is simply the ratio of the price of stock A to that of stock B. It is also named
relative strength. When the correlation between A and B remains high, the price ratio of this pair
would not fluctuate greatly, and vice versa.
4.4 Pairs of Stocks Selected
Pair 1: Ford Motor Co. & General Motors Company
Correlation Coefficient of a year: 0.976 (high correlation)
Ford Motor Co. (F)
Ford Motor Company is an automobile manufacturing company engaged in the
development, manufacture, distribution, and service of vehicles, parts, and accessories worldwide.
The company operates in two segments, Automotive and Financial Services. The Automotive
segment markets cars, trucks, parts, and accessories. The Financial Services segment offers
automotive financing products to and through automotive dealers. Ford Motor Company was
founded in Dearborn, Michigan in 1903 [17].
Figure 4.2 Stock Chart of Ford
General Motors Company (GM)
General Motors Company designs, manufactures, and markets cars, trucks, and automobile
parts in the United States and internationally to dealers for consumer retail sales as well as to
customers. The company also offers connected safety, security and mobility solutions, and

49
information technology services. General Motors Company was founded in Detroit, Michigan in
1908 [22].
Figure 4.3 Stock Chart of General Motors
Pair 2: AT&T, Inc. & Verizon Communications Inc.
Correlation Coefficient of a year: 0.700 (medium correlation)
AT&T, Inc. (T)
AT&T Inc. is a telecommunication company that provides services to consumers and
businesses worldwide. The company operates in three segments: Wireless, Wireline, and Other.
The Wireless segment offers wireless communication services, wireless products, and accessories.
The Wireline segment provides data services. The Other segment provides application
management, security services, integration services, etc. AT&T Inc. was founded in Dallas, Texas
in 1983 [50].
Figure 4.4 Stock Chart of AT&T
Verizon Communications Inc. (VZ)
Verizon Communications Inc. provides communications, information and entertainment
products and services to consumers, businesses, and governmental agencies worldwide. The
company operates in two segments, Wireless and Wireline. The Wireless segment offers access to

50
wireless voice and data services, messaging services, and multimedia applications. The Wireline
segment offers data services and networking products. Verizon Communications Inc. was founded
in New York, New York in 1983 [55].
Figure 4.5 Stock Chart of Verizon
Pair 3: Citigroup, Inc. & Bank of America Corporation
Correlation Coefficient of a year: 0.927 (high correlation)
Citigroup, Inc. (C)
Citigroup, Inc. provides financial products and services including consumer banking and
credit, corporate and investment banking, securities brokerage, wealth management, and
transaction services worldwide. The company operates in two segments, Citicorp and Citi
Holdings. The Citicorp segment consists of Global Consumer Banking (GCB) business and
Institutional Clients Group (ICG) business. The Citi Holdings segment consists of Brokerage and
Asset Management, Local Consumer Lending, and Special Asset Pool. Citigroup Inc. was founded
in New York, New York in 1812 [13].
Figure 4.6 Stock Chart of Citigroup

51
Bank of America Corporation (BAC)
Bank of America Corporation consists of five segments: Consumer & Business Banking,
Consumer Real Estate Services, Global Banking, Global Markets, and Global Wealth &
Investment Management. The company provides financial products and services for individuals,
market businesses, institutional investors, corporations, and governments worldwide. Bank of
America Corporation was founded in Charlotte, North Carolina in 1874 [8].
Figure 4.7 Stock Chart of Bank of America
Pair 4: Exxon Mobil Corporation & Chevron Corporation
Correlation Coefficient of a year: 0.487 (weak correlation)
Exxon Mobil Corporation (XOM)
Exxon Mobil Corporation engages in exploration, production, transportation and
marketing of crude oil, natural gas, and petroleum products. It has approximately 37,228 gross and
31,264 net operated wells. The company has a strategic cooperation agreement with Rosneft to
jointly participate in exploration and development activities in Russia, the United States, and other
parts of the world. Exxon Mobil Corporation was founded in Irving, Texas in 1870 [60].
Figure 4.8 Stock Chart of Exxon Mobil

52
Chevron Corporation (CVX)
Chevron Corporation is an energy company engaged in petroleum, chemicals, mining,
power generation, and energy operations worldwide. The company operates in two segments,
Upstream and Downstream. The Upstream segment is involved in the exploration, production, and
transportation of crude oil and natural gas. The Downstream segment is engaged in refining and
marketing crude oil and refined products. Chevron Corporation was founded in San Ramon,
California in 1879 [14].
Figure 4.9 Stock Chart of Chevron
4.5 Simulation Transactions
4.5.1 Week 1: 12/02/13-12/06/13
Market Overview
Pair 1: F & GM
According to Figure 4.10, the correlation was low this week. However, the price ratio
started going down and then flat in the last day. Considering that the price ratio has been decreasing
since November 25, this pair might be promising for a day trading.
Figure 4.10 Relative Strength of F & GM

53
Pair 2: T & VZ
According to the relative strength chart (Figure 4.11) below, the price ratio was fluctuating
along the historical value, indicating that this pair is relatively reliable to invest in.
Figure 4.11 Relative Strength of T & VZ
Pair 3: C & BAC
As shown below (Figure 4.12), the correlation was relatively high in the first three days
but dropped abruptly. However, the correlation became high again in the last two days.
Figure 4.12 Relative Strength of C & BAC
Pair 4: XOM & CVX
The price ratio of this pair kept increasing above the historical value over a week, as shown
below (Figure 4.13). Since the correlation continued to weaken, it might be promising to invest in
the next several weeks.

54
Figure 4.13 Relative Strength of XOM & CVX
Course of Action
On December 4, C and BAC were traded and covered quickly due to the significant
fluctuation in their price ratio. F and GM were also traded in pair on December 4 because their
price ratio was thought to go back to previous value. However, the price ratio continued to drop
on December 6, so they had to be covered shortly. C and BAC were traded again on December 5
as the price ratio started to recover.
Results
The portfolio value declined significantly this week. The table of transactions describing
the performance of this week was presented below (Table 4.1).
Date Symbol Buy/Sell Price Shares Net Cost/
Proceeds
Profit/
Loss Total Cash
Total
Profit
Dec 4, 2013 F Buy $16.51 1514 -$25006.14 $974993.86
Dec 4, 2013 GM Sell Short $38.53 649 $24995.97 $999989.83
Dec 4, 2013 C Buy $51.94 481 -$24993.14 $974996.69
Dec 4, 2013 C Sell $52.13 481 $25064.53 $1000061.22
Dec 4, 2013 BAC Sell Short $15.62 1601 $24997.62 $1025058.84
Dec 4, 2013 BAC Buy to Cover $15.61 1601 -$25001.61 $67.4 $1000057.23 $67.4
Dec 5, 2013 C Buy $51.12 489 -$25007.68 $975049.55
Dec 5, 2013 BAC Sell Short $15.41 1623 $25000.43 $1000049.98
Dec 6, 2013 F Sell $16.63 1514 $25167.82 $1025217.8
Dec 6, 2013 GM Buy to Cover $39.95 649 -$25937.55 ($779.9) $999280.25 ($712.5)
Table 4.1 Week 1 Transaction Record (Includes $10 commission fee per trade)

55
4.5.2 Week 2: 12/09/13-12/13/13
Market Overview
Pair 1: F & GM
During the first four days of the week, the price ratio of F and GM moved along the
historical average as showed below (Figure 4.14). Since the correlation was high, it was not the
right time to invest in this pair. However, the price ratio started to go up abruptly in Friday morning
and went down slowly in the afternoon. Considering that the price ratio was continuously
decreasing over a month, it is expected that the price ratio would continue decreasing until it hits
the historical average. Therefore, this pair is very promising.
Figure 4.14 Relative Strength of F & GM
Pair 2: T & VZ
According to Figure 4.15 below, the performance of this pair was ideal for pair trading.
The price ratio fluctuated considerably along the average in a short period, which allowed a pair
trader to make quick money.
Figure 4.15 Relative Strength of T & VZ

56
Pair 3: C & BAC
Based on the relative strength chart below (Figure 4.16), the correlation of this pair was
low in the first four days. However, it was high in the last day and thus assumed that it was a good
time to invest in this pair. Since the price ratio was almost constant over a month, this would be
still promising to invest in next week.
Figure 4.16 Relative Strength of C & BAC
Pair 4: XOM & CVX
As shown below (Figure 4.17), the price ratio continued going down in the first few days.
Although it was expected to hit the historical value on December 11, it went up and never came
across the historical average. It is estimated that the price ratio of XOM and CVX might hit the
maximum and start to decline in a short time, which would be the best time to invest in.
Figure 4.17 Relative Strength of XOM & CVX
Course of Action
In general, it was an easy week to make profit. The pair C and BAC were covered on
December 9 when the price ratio returned to the historical average. Some other transactions of C

57
and BAC were also conducted when the correlation weakened significantly. In addition, the price
ratio of T and VZ was fluctuating frequently and therefore they were traded when the price ratio
was returning to the historical average. In addition, XOM and CVX were traded on December 9,
hoping the price ratio continued to decrease. However, the price ratio went up and their positions
had to be closed to avoid losing more money.
Results
The pair XOM and CVX was going well at first but it failed to return to the historical
average. This might be caused by the weak historical correlation between these two stocks, which
indicates that the prediction could be unreliable and inaccurate. The table of transactions
describing the performance of this week was presented below (Table 4.2).
Date Symbol Buy/Sell Price Shares Net Cost/
Proceeds
Profit/
Loss Total Cash
Total
Profit
Dec 2, 2013 $100000
Dec 9, 2013 XOM Sell Short $95.88 261 $25014.68 $1024294.93
Dec 9, 2013 CVX Buy $123.55 202 -$24967.1 $999327.83
Dec 9, 2013 C Sell $52.18 489 $25506.02 $1024833.85
Dec 9, 2013 BAC Buy to Cover $15.58 1623 -$25296.34 $202.4 $999537.51 ($510.1)
Dec 11, 2013 T Sell Short $33.93 737 $24996.41 $1024533.92
Dec 11, 2013 T Buy to Cover $33.99 737 -$25060.63 $999473.29
Dec 11, 2013 VZ Buy $48.05 520 $-24996 $974477.29
Dec 11, 2013 VZ Sell $48.4 520 $25158 $97.8 $999635.29 ($412.3)
Dec 12, 2013 T Sell Short $34.04 734 $24975.36 $1024610.65
Dec 12, 2013 VZ Buy $48.3 518 -$25029.4 $999581.25
Dec 12, 2013 XOM Buy to Cover $94.83 261 -$24760.63 $974820.62
Dec 12, 2013 CVX Sell $120.63 202 $24357.26 ($355.8) $999177.88 ($768.1)
Dec 12, 2013 C Buy $51.02 490 -$25009.8 $974168.08
Dec 12, 2013 BAC Sell Short $15.32 1632 $24992.24 $999160.32
Dec 13, 2013 T Buy to Cover $33.7 734 -$24745.8 $974414.52
Dec 13, 2013 VZ Sell $48.05 518 $24879.9 $80.1 $999294.42 ($688.0)
Dec 13, 2013 C Sell $51.14 490 $25048.6 $1024343.02
Dec 13, 2013 BAC Buy to Cover $15.23 1632 -$24865.36 $165.7 $999477.66 ($522.3)
Table 4.2 Week 2 Transaction Record (Includes $10 commission fee per trade)

58
4.5.3 Week 3: 12/16/13-12/20/13
Market Overview
Pair 1: F & GM
According to Figure 4.18 below, the price ratio kept going down over a month. However,
it went up a little last week, so it had been expected to go down this week. As expected, the price
ratio went down.
Figure 4.18 Relative Strength of F & GM
Pair 2: T & VZ
Although Figure 4.19 shown below demonstrates that the price ratio was fluctuating
frequently, the correlation was actually very high as the chart is zoomed in. Therefore, the high
profit failed to be achieved despite many transactions conducted in the previous week.
Figure 4.19 Relative Strength of T & VZ
Pair 3: C & BAC
As shown below (Figure 4.20), the correlation was high over a month. It is estimated that
some profit could be achieved from this pair.
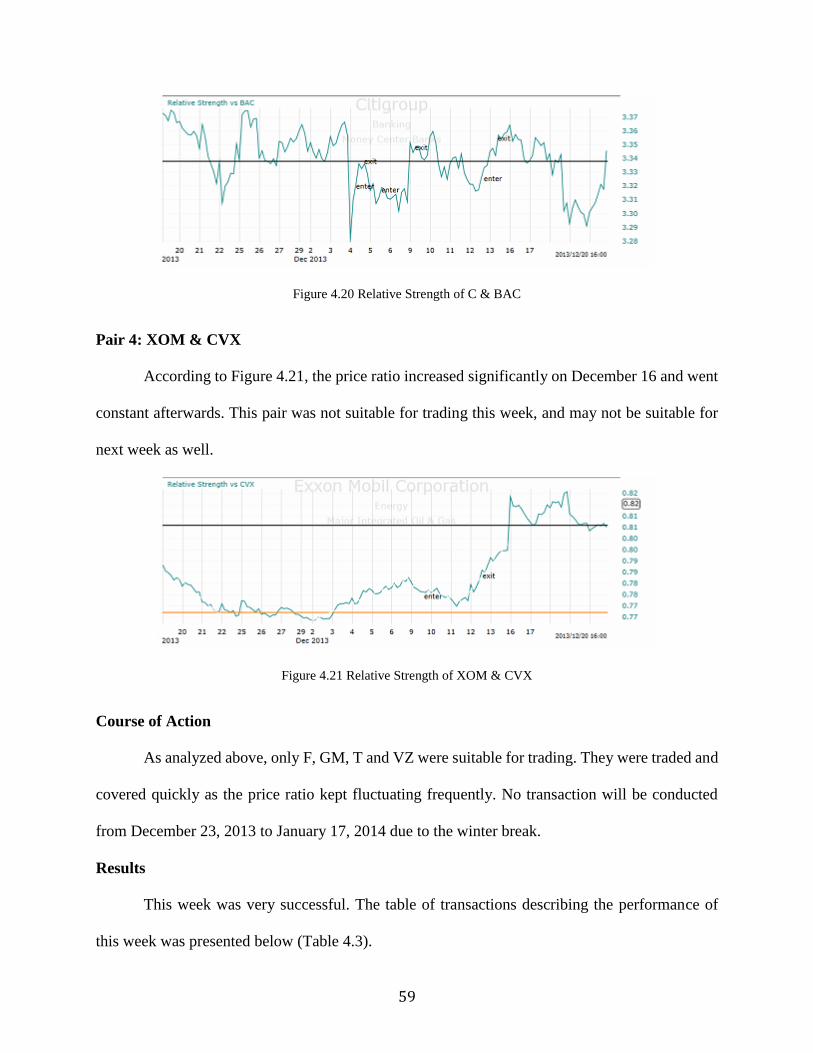
59
Figure 4.20 Relative Strength of C & BAC
Pair 4: XOM & CVX
According to Figure 4.21, the price ratio increased significantly on December 16 and went
constant afterwards. This pair was not suitable for trading this week, and may not be suitable for
next week as well.
Figure 4.21 Relative Strength of XOM & CVX
Course of Action
As analyzed above, only F, GM, T and VZ were suitable for trading. They were traded and
covered quickly as the price ratio kept fluctuating frequently. No transaction will be conducted
from December 23, 2013 to January 17, 2014 due to the winter break.
Results
This week was very successful. The table of transactions describing the performance of
this week was presented below (Table 4.3).
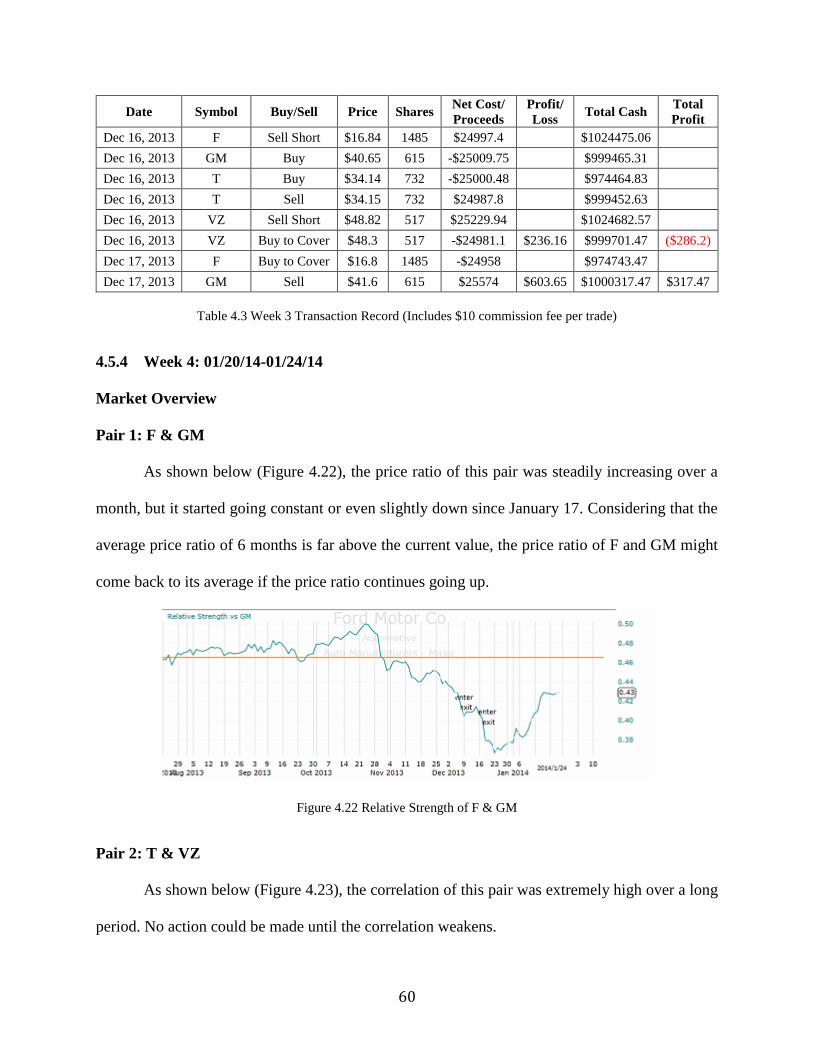
60
Date Symbol Buy/Sell Price Shares Net Cost/
Proceeds
Profit/
Loss Total Cash
Total
Profit
Dec 16, 2013 F Sell Short $16.84 1485 $24997.4 $1024475.06
Dec 16, 2013 GM Buy $40.65 615 -$25009.75 $999465.31
Dec 16, 2013 T Buy $34.14 732 -$25000.48 $974464.83
Dec 16, 2013 T Sell $34.15 732 $24987.8 $999452.63
Dec 16, 2013 VZ Sell Short $48.82 517 $25229.94 $1024682.57
Dec 16, 2013 VZ Buy to Cover $48.3 517 -$24981.1 $236.16 $999701.47 ($286.2)
Dec 17, 2013 F Buy to Cover $16.8 1485 -$24958 $974743.47
Dec 17, 2013 GM Sell $41.6 615 $25574 $603.65 $1000317.47 $317.47
Table 4.3 Week 3 Transaction Record (Includes $10 commission fee per trade)
4.5.4 Week 4: 01/20/14-01/24/14
Market Overview
Pair 1: F & GM
As shown below (Figure 4.22), the price ratio of this pair was steadily increasing over a
month, but it started going constant or even slightly down since January 17. Considering that the
average price ratio of 6 months is far above the current value, the price ratio of F and GM might
come back to its average if the price ratio continues going up.
Figure 4.22 Relative Strength of F & GM
Pair 2: T & VZ
As shown below (Figure 4.23), the correlation of this pair was extremely high over a long
period. No action could be made until the correlation weakens.

61
Figure 4.23 Relative Strength of T & VZ
Pair 3: C & BAC
Figure 4.24 shows that the price ratio of was decreasing since January 2 and then started to
increase on January 24. If the price ratio continues increasing up to the average value, it is
estimated that a considerable amount of profit could be achieved.
Figure 4.24 Relative Strength of C & BAC
Pair 4: XOM & CVX
According to Figure 4.25, the price ratio of XOM and CVX was going up and down over
a month, but the range is not sufficient to make a lot of profit. It is discovered that this pair is
extremely difficult to predict the future trend and thus hard to determine the enter point.
Figure 4.25 Relative Strength of XOM & CVX

62
Course of Action
No action was made this week. Although the pair F and GM was highly promising to invest
in, the price ratio started going constant in the last day. As a result, it was assumed a bad time to
open the position. T, VZ, XOM and CVX were simply not suitable for trading.
Results
No transaction was conducted this week.
4.5.5 Week 5: 01/27/14-01/31/14
Market Overview
Pair 1: F & GM
Figure 4.26 shows that the price ratio of F and GM was going constant since January 16. It
was evaluated that the price ratio would continue increasing and come back to its historical value
when the correlation weakened. However, the price ratio actually started decreasing on January 28
and continued going down until January 31, when the price ratio slightly went up. It is difficult to
predict the trends of the next week.
Figure 4.26 Relative Strength of F & GM
Pair 2: T & VZ
In the beginning of the week, the price ratio continued going up as shown below (Figure
4.27). On January 29, however, the price ratio dropped abruptly. Although it recovered slightly,

63
the price ratio started to be stabilized. According to its historical record, it is estimated that the
price ratio would go up, coming back to its average, but it is hard to say.
Figure 4.27 Relative Strength of T & VZ
Pair 3: C & BAC
According to the relative strength chart shown below (Figure 4.28), the price ratio of this
pair kept going down since January 16. Since the trend is almost linear, the price ratio will probably
continue decreasing next week.
Figure 4.28 Relative Strength of C & BAC
Pair 4: XOM & CVX
Although the correlation was not too low, this pair is still very risky to invest in. As shown
below (Figure 4.29), there were some times when the price ratio changed abruptly by a huge
percentage. It is evaluated that the price ratio might go down next week.

64
Figure 4.29 Relative Strength of XOM & CVX
Course of Action
As the price ratio started going down, F was short sold while GM was bought. Although a
pair trader usually does not open the position when the correlation just starts weakening, I believed
this pair was reliable due to its steadily high correlation. On January 31, however, F and GM were
covered since the price ratio started going up. T and VZ were traded quickly since their price ratio
fluctuated frequently this week. It is worth noting that the potential great loss from the pair T and
VZ happening in the morning of January 29 was avoided.
Results
The table of transactions was presented below (Table 4.4).
Date Symbol Buy/Sell Price Shares Net Cost/
Proceeds
Profit/
Loss Total Cash
Total
Profit
Jan 27, 2014 T Buy $33.5 746 -$25001 $975316.47
Jan 27, 2014 VZ Sell Short $48.04 520 $24970.8 $1000287.27
Jan 28, 2014 T Sell $33.68 746 $25115.28 $1025402.55
Jan 28, 2014 VZ Buy to Cover $47.36 520 -$24637.2 $447.88 $1000765.35 $765.35
Jan 29, 2014 F Sell Short $15.42 1622 $25001.24 $1025766.59
Jan 29, 2014 GM Buy $36.84 679 -$25024.36 $1000742.23
Jan 29, 2014 C Sell Short $48.77 513 $25009.01 $1025751.24
Jan 29, 2014 BAC Buy $16.78 1490 -$25012.2 $1000739.04
Jan 31, 2014 F Buy to Cover $14.96 1622 -$24275.12 $976463.92
Jan 31, 2014 GM Sell $36.08 679 $24488.32 $190.08 $1000952.24 $955.43
Table 4.4 Week 5 Transaction Record (Includes $10 commission fee per trade)

65
4.5.6 Week 6: 02/03/14-02/07/14
Market Overview
Pair 1: F & GM
According to Figure 4.30, the price ratio of this pair was quite stable in the beginning of
the last week. However, it went up abruptly in between the end of Wednesday and the beginning
of Thursday, and fluctuated significantly in the rest of the week. Since the correlation was low, it
might be very risky to make a transaction next week.
Figure 4.30 Relative Strength of F & GM
Pair 2: T & VZ
According to Figure 4.31, the price ratio of T and VZ was going down steadily and then
started to increase slowly according to the relative strength chart. Because T and VZ always have
a very high correlation, it is anticipated that high profit would be made next week.
Figure 4.31 Relative Strength of T & VZ

66
Pair 3: C & BAC
As shown below (Figure 4.32), the price ratio of the pair C and BAC started going up in
the beginning of the week. A high profit is anticipated to be achieved next week.
Figure 4.32 Relative Strength of C & BAC
Pair 4: XOM & CVX
According to Figure 4.33, the correlation was low and thus the price ratio was fluctuating
greatly over a week. This pair is still very risky to invest in.
Figure 4.33 Relative Strength of XOM & CVX
Course of Action
Only a few transactions were conducted this week. BAC and C invested last week were
covered on February 5, and they were traded oppositely on 6 as the price ratio continued increasing.
CVX and XOM were tried to make profit but failed.

67
Results
These five pairs did not have obvious trends as last week. As a result almost no profit was
made this week. The table of transactions describing the performance of this week was presented
below (Table 4.5).
Date Symbol Buy/Sell Price Shares Net Cost/
Proceeds
Profit/
Loss Total Cash
Total
Profit
Feb 3, 2014 XOM Buy $90.46 262 -$23710.52 $977241.72
Feb 3, 2014 CVX Sell Short $111.46 224 $24957.04 $1002198.76
Feb 4, 2014 XOM Sell $89.81 262 $23520.22 $1025718.98
Feb 4, 2014 CVX Buy to Cover $111.34 224 -$24950.16 ($183.4) $1000768.82 $772.01
Feb 5, 2014 C Buy to Cover $46.42 513 -$23823.46 $976945.36
Feb 5, 2014 BAC Sell $16.19 1490 $24113.1 $286.5 $1001058.46 $1058.46
Feb 6, 2014 C Buy $48.08 520 -$25011.6 $976046.86
Feb 6, 2014 BAC Sell Short $16.62 1504 $24986.48 $1001033.34
Table 4.5 Week 6 Transaction Record (Includes $10 commission fee per trade)
4.5.7 Week 7: 02/10/14-02/14/14
Market Overview
Pair 1: F & GM
According to Figure 4.34, the fluctuation of the price ratio between F and GM was quite
large. Although in general the price ratio kept increasing over a week, it was very difficult to tell
the trend at that time. It is estimated that the price ratio will continue increasing next week.
Figure 4.34 Relative Strength of F & GM

68
Pair 2: T & VZ
Based on Figure 4.35 shown below, it is easy to tell that the price ratio of T and VZ was
increasing near the historical value over a week. This was the optimum situation for pair trading.
Since the price ratio has exceeded that highest value over a month, it might go down next week.
Figure 4.35 Relative Strength of T & VZ
Pair 3: C & BAC
This pair also had a beautiful trend for pair trading. According to Figure 4.36, the price
ratio was steadily increasing while correlation was still very high, which indicates that this pair
was extremely safe to invest in. Although it also mean the profit cannot be achieved quickly, low
risk is the point of pair trading. There must be some trade-offs. It is predicted that the price ratio
will continue growing next week.
Figure 4.36 Relative Strength of C & BAC

69
Pair 4: XOM & CVX
This pair was not suitable for pair trading. As shown below (Figure 4.37), there were a
couple of times when the price ratio changed abruptly, which greatly weakened correlation. This
pair will not be discussed in the later weeks unless it has a suitable trend.
Figure 4.37 Relative Strength of XOM & CVX
Course of Action
Only T and VZ were traded because they had perfect trends for pair trading. At the same
time, the pair C and BAC was decided to be held longer since the price ratio was growing steadily.
Although the price ratio of F and GM was increasing, they were not traded considering the high
risk.
Results
The performance of this week was quite successful although only a few transactions were
conducted. Compared to the last week, the portfolio value increased by almost 500 dollars. The
table of transactions describing the performance of this week was presented below (Table 4.6).
Date Symbol Buy/Sell Price Shares Net Cost/
Proceeds
Profit/
Loss Total Cash
Total
Profit
Feb 10, 2014 T Buy $32.28 774 -$24994.72 $976038.62
Feb 10, 2014 VZ Sell Short $46.78 534 $24970.52 $1001009.14
Feb 12, 2014 T Sell $32.96 774 $25501.04 $1026510.18
Feb 12, 2014 VZ Buy to Cover $47.29 534 -$25262.86 $213.98 $1001247.32 $1272.44
Table 4.6 Week 7 Transaction Record (Includes $10 commission fee per trade)
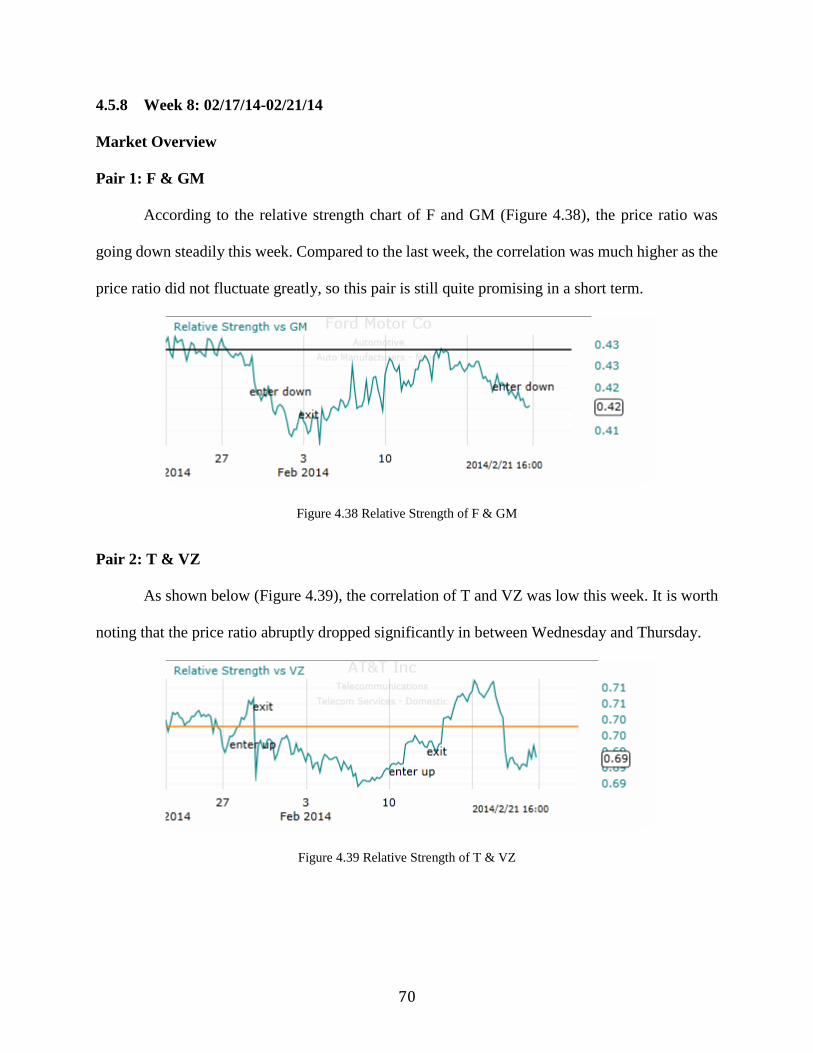
70
4.5.8 Week 8: 02/17/14-02/21/14
Market Overview
Pair 1: F & GM
According to the relative strength chart of F and GM (Figure 4.38), the price ratio was
going down steadily this week. Compared to the last week, the correlation was much higher as the
price ratio did not fluctuate greatly, so this pair is still quite promising in a short term.
Figure 4.38 Relative Strength of F & GM
Pair 2: T & VZ
As shown below (Figure 4.39), the correlation of T and VZ was low this week. It is worth
noting that the price ratio abruptly dropped significantly in between Wednesday and Thursday.
Figure 4.39 Relative Strength of T & VZ

71
Pair 3: C & BAC
Based on Figure 4.40, the price ratio kept increasing last week, but it became constant in
the beginning of this week and then started decreasing. As the correlation still remains high, it is
expected that the pair C and BAC is profitable if they are invested next week.
Figure 4.40 Relative Strength of C & BAC
Course of Action
As described above, the price ratio of C and BAC started going down, so their positions
were closed in the beginning of February 20. In addition, the pair F and GM was traded on February
20 as the trend of reversed and started moving down steadily.
Results
Considering that only one pair was traded and more than 500 dollars of profit was achieved,
it was quite successful this week. The table of transactions describing the performance of this week
was presented below (Table 4.7).
Date Symbol Buy/Sell Price Shares Net Cost/
Proceeds
Profit/
Loss Total Cash Total Profit
Feb 20, 2014 F Sell Short $15.21 1644 $24995.24 $126242.56
Feb 20, 2014 GM Buy $36.04 694 -$25021.8 $101220.8
Feb 20, 2014 C Sell $48.07 520 $24986.4 $126207.2
Feb 20, 2014 BAC Buy to Cover $16.24 1504 -$24435.0 $526.32 $101772.24 $1798.8
Table 4.7 Week 8 Transaction Record (Includes $10 commission fee per trade)
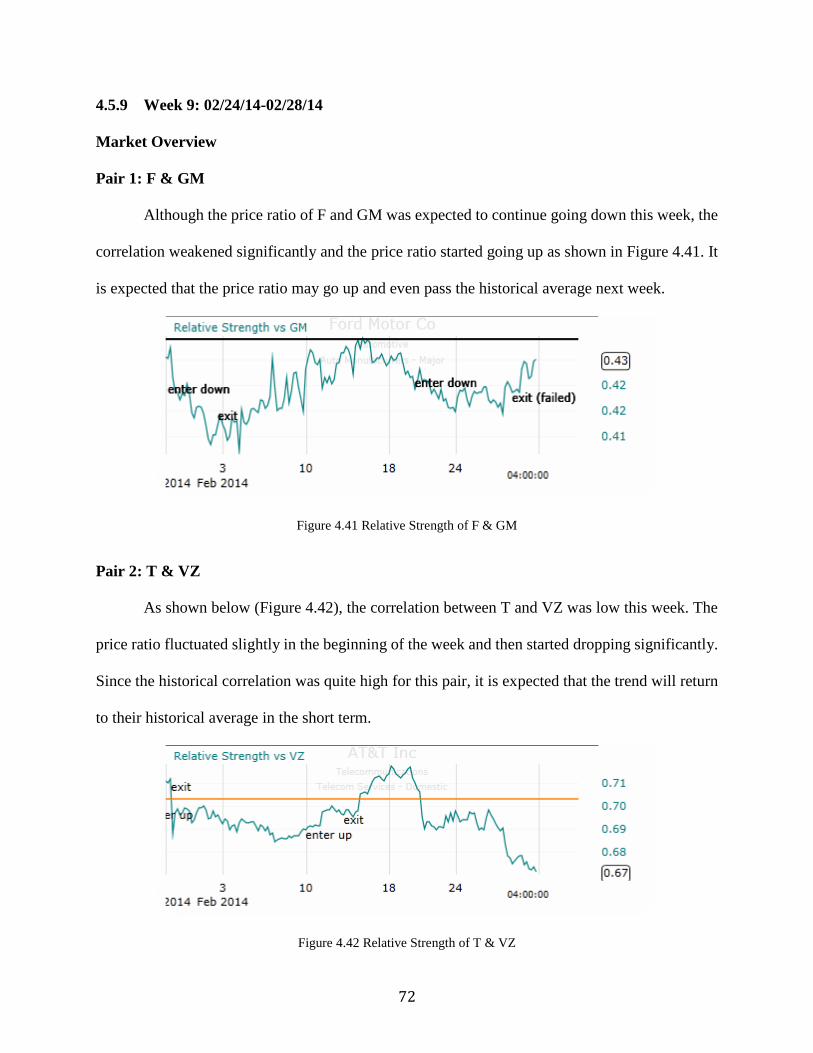
72
4.5.9 Week 9: 02/24/14-02/28/14
Market Overview
Pair 1: F & GM
Although the price ratio of F and GM was expected to continue going down this week, the
correlation weakened significantly and the price ratio started going up as shown in Figure 4.41. It
is expected that the price ratio may go up and even pass the historical average next week.
Figure 4.41 Relative Strength of F & GM
Pair 2: T & VZ
As shown below (Figure 4.42), the correlation between T and VZ was low this week. The
price ratio fluctuated slightly in the beginning of the week and then started dropping significantly.
Since the historical correlation was quite high for this pair, it is expected that the trend will return
to their historical average in the short term.
Figure 4.42 Relative Strength of T & VZ
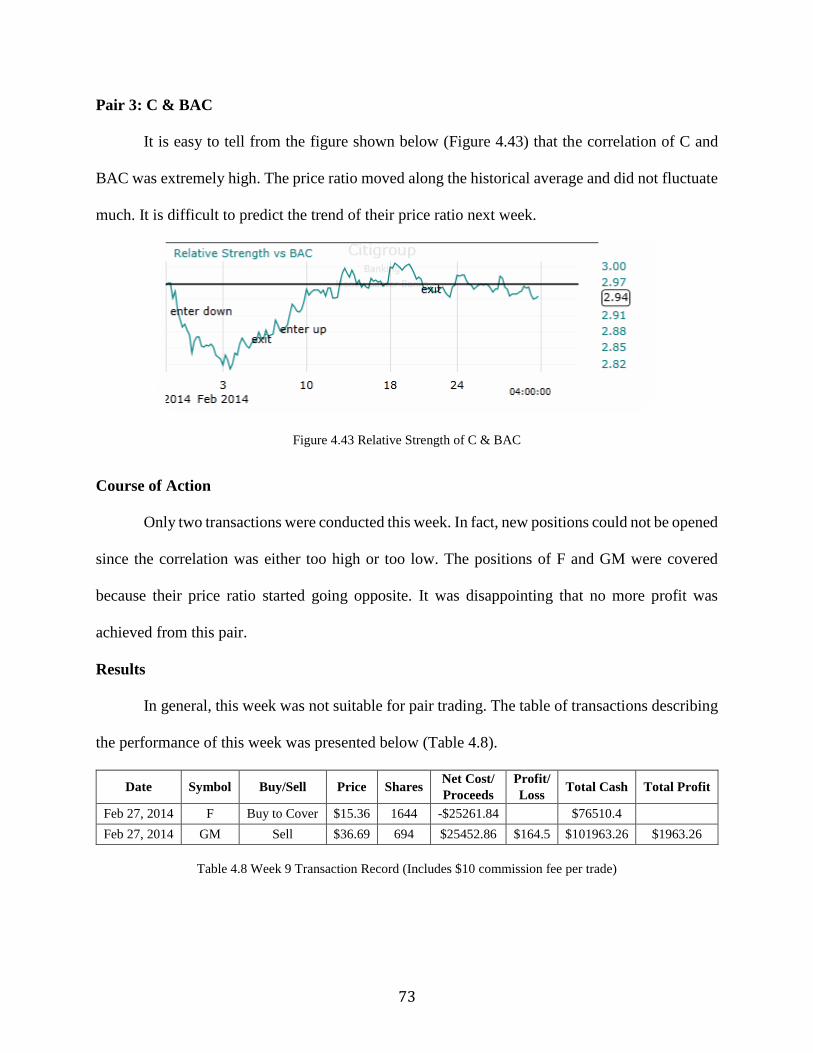
73
Pair 3: C & BAC
It is easy to tell from the figure shown below (Figure 4.43) that the correlation of C and
BAC was extremely high. The price ratio moved along the historical average and did not fluctuate
much. It is difficult to predict the trend of their price ratio next week.
Figure 4.43 Relative Strength of C & BAC
Course of Action
Only two transactions were conducted this week. In fact, new positions could not be opened
since the correlation was either too high or too low. The positions of F and GM were covered
because their price ratio started going opposite. It was disappointing that no more profit was
achieved from this pair.
Results
In general, this week was not suitable for pair trading. The table of transactions describing
the performance of this week was presented below (Table 4.8).
Date Symbol Buy/Sell Price Shares Net Cost/
Proceeds
Profit/
Loss Total Cash Total Profit
Feb 27, 2014 F Buy to Cover $15.36 1644 -$25261.84 $76510.4
Feb 27, 2014 GM Sell $36.69 694 $25452.86 $164.5 $101963.26 $1963.26
Table 4.8 Week 9 Transaction Record (Includes $10 commission fee per trade)

74
4.5.10 Week 10: 03/03/14-03/07/14
Market Overview
Pair 1: F & GM
According to Figure 4.44, the price ratio decreased significantly, increased abruptly, and
then started to decrease slowly. As a result, the correlation between F and GM was never high.
However, the price ratio has been fluctuating up and down along the one-month average value
over a month, so it is expected that the price ratio will go up and may pass the average soon.
Figure 4.44 Relative Strength of F & GM
Pair 2: T & VZ
As shown below (Figure 4.45), the price ratio was going down significantly. This week,
however, the trend of the price ratio reversed and started to go up steadily. In the last day of this
week, the price ratio almost hit the historical value.
Figure 4.45 Relative Strength of T & VZ
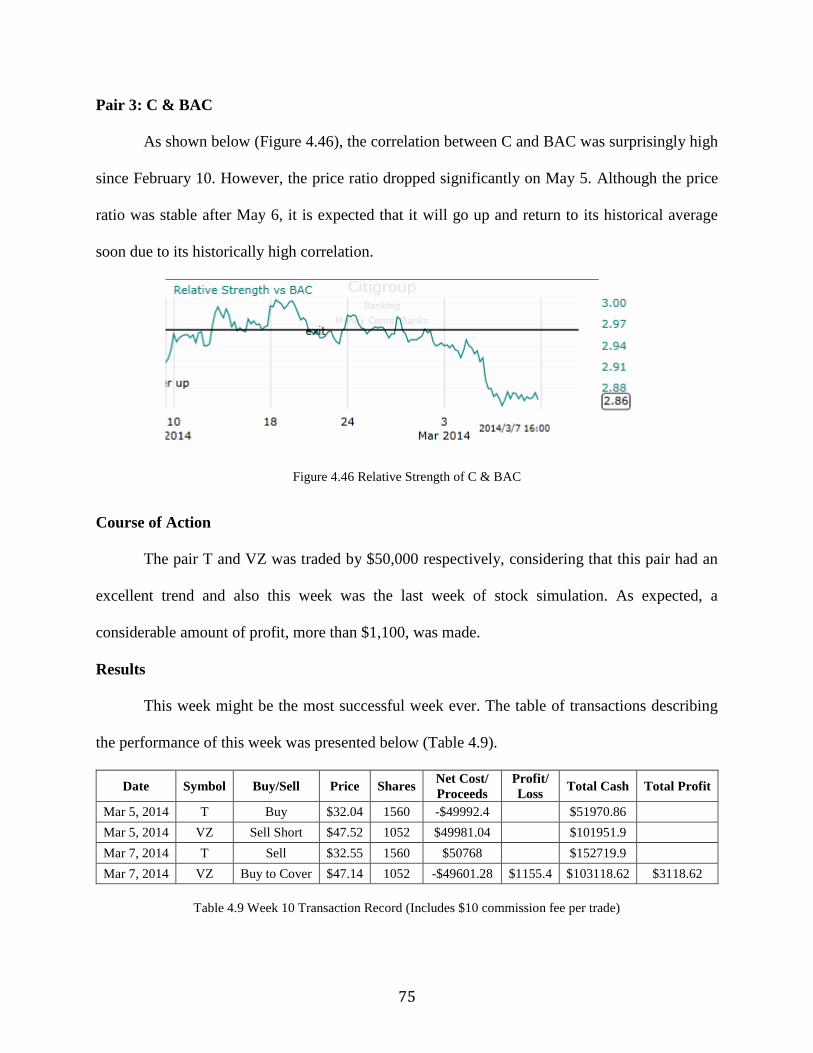
75
Pair 3: C & BAC
As shown below (Figure 4.46), the correlation between C and BAC was surprisingly high
since February 10. However, the price ratio dropped significantly on May 5. Although the price
ratio was stable after May 6, it is expected that it will go up and return to its historical average
soon due to its historically high correlation.
Figure 4.46 Relative Strength of C & BAC
Course of Action
The pair T and VZ was traded by $50,000 respectively, considering that this pair had an
excellent trend and also this week was the last week of stock simulation. As expected, a
considerable amount of profit, more than $1,100, was made.
Results
This week might be the most successful week ever. The table of transactions describing
the performance of this week was presented below (Table 4.9).
Date Symbol Buy/Sell Price Shares Net Cost/
Proceeds
Profit/
Loss Total Cash Total Profit
Mar 5, 2014 T Buy $32.04 1560 -$49992.4 $51970.86
Mar 5, 2014 VZ Sell Short $47.52 1052 $49981.04 $101951.9
Mar 7, 2014 T Sell $32.55 1560 $50768 $152719.9
Mar 7, 2014 VZ Buy to Cover $47.14 1052 -$49601.28 $1155.4 $103118.62 $3118.62
Table 4.9 Week 10 Transaction Record (Includes $10 commission fee per trade)

76
4.6 Results and Discussion
After a ten-week simulation of pair trading, $3118.62 of profit was achieved, which
represented 3.12% gain. Although $3000 was not a significant achievement, it proved that pair
trading is a strategy with relatively low return and low risk, in spite of several losses.
During the first couple of weeks, transactions were conducted frequently, but manipulated
poorly. There were many times when the relative performance of two stocks in a pair was
misevaluated and thus the outperformer was short sold incorrectly while the underperformer was
bought. As a result, a considerable amount of money was lost because they were traded oppositely.
For example, F was considered that it was the underperformer compared to GM on December 4,
2013, so F was bought while GM was short sold, predicting that the price ratio of F and GM would
increase soon. However, the price ratio continued to decrease significantly, causing a huge loss
and their positions had to be closed 2 days later. A similar case happened to the pair XOM and
CVX several times as well. Additionally, many unprofitable transactions were also conducted as
a result of my diffidence in a pair of stocks. Obviously, transactions making profit less than $100
were not worth being conducted so frequently. These two types of poor manipulation could be
contributed to the fact that I was not familiar enough with the pair trading strategy.
However, the performance became a lot better and the total portfolio value started to be
positive since the third week. Some remarking transactions were conducted, making a profit
greater than $200, or even more than $500, from a single pair in a short term, usually within a
week. Since two or three pairs were held in a week, more than $500 of profit was frequently
achieved. Considering the situation that only four pairs were studied in this ten-week simulation
and not all of these pairs were suitable for trading all the time, it could be defined as a success if
more than $500 of profit could be achieved in a week.

77
In the last week, more than $1000 of profit was achieved from a single pair T and VZ.
Admittedly, I do not deny that I was lucky, but the achievement could be also attributed to my
better understanding and better manipulation of the strategy. It was really exciting that the pair
trading started to work. Unfortunately, the simulation was already completed.
Prior to the start of the simulation, I selected two historically highly correlated, one
medially correlated, and one weakly correlated pairs, in order to determine the relationship among
the correlation, return, and risk. Eventually, it was discovered that high return was seldom achieved
from the highly correlated pair such as the pair C and BAC, but not never. For example, the
correlation of pair F and GM weakened significantly in the third week, and $603.65 of profit was
achieved within a week. If the transactions of F and GM had been conducted properly, it was
possible to profit $779.90 instead of losing it. In conclusion, historically highly correlated pairs
are infrequently but highly profitable, and thus worth paying close attention to them.
Medially correlated pairs are also quite profitable but differently from the highly correlated
pairs. As it could be observed from the transaction record of the pair T and VZ, relatively steady
profits were achieved frequently, usually about $300. It is concluded that medium profit could be
achieved frequently from historically medially correlated pairs.
Weakly correlated pairs, however, are very risky. As it was stated in the weekly analysis
in previous sections, it was never able to make profit from the pair XOM and CVX due to the
extremely high fluctuations in their price ratio. It may be assumed that high profit could be
achieved if a pair trader pays close attention to a weakly correlated pair, but it is difficult to
determine the entry point and exit point. Considering that pair trading is aimed to reduce the risk,
it is nonsense to do so. Therefore, historically weakly correlated pairs should be avoided for pair
trading.

78
5 Trading the News Simulation
Trading the news can be a difficult strategy when investing in the stock market, but if this
strategy is done right it can be very profitable. Trading the news involves an investor using stock
market information and business press releases to decide where they are going to invest. It is
usually more successful with longer term investing because as news story can take several weeks
to unfold and that could keep driving the price of the stock up or down. Economic information is
the biggest catalyst to the success of trading. Since information can be published about a product
at any time there are plenty of opportunities to find good information concerning the stocks and
the opportunity to invest in many different areas. This makes it very easy to diversify accounts.
The downside to trading the news is that it is time consuming. News changes constantly and it is
important to stay informed to make sure you are investing in the right stock and or figure out if it
is time to sell your stock [5].
Trading the news is a very intensive strategy for an investor. No stock or company can be
randomly chosen without research. Analyzing the news is crucial for trading the news. This
investor will be looking at news conglomerates to discern which stocks are doing well and which
ones are not.
When choosing stock information, Yahoo and Google have comprehensive articles on
stock market trading. Those websites are able to compile information that investment only
websites couldn’t cover. These website have links to articles of news information that has been
released about that company recently, along with their past stock market performance and where
that company stands in comparison to other companies in the same market. Although a company’s
current performance is important, investors must research on how the company has been
performing before this in order to make sure it is a sound investment.

79
Investment websites will be very important to the success of this investor. Investment
websites usually will analyze the news to determine if it is a strong buy or not. If the investor sees
information from an investment website about investing in that particular company then further
research will be conducted.
5.1 Companies
Galena Biopharma Inc. (GALE): Galena Biopharma, is a pharmaceutical company that
specializes in cancer and oncology treatments to help fight advanced types of cancer. The scientists
at Galena Biopharma are currently developing a vaccine called NeuVax, which is currently in
phase three trials for breast cancer and it could be released onto the market in the near future. Many
investors are interested in Galena because the NeuVax vaccine attacks residual cancer cells and
increases the odds that breast cancer will not reoccur [25] [20].
Navidea Biopharmaceuticals Inc. (NAVB): Navidea Biopharmaceuticals, is a pharmaceutical
company that makes medical and radiopharmaceutical devices. This company is creating lymph
detection in head and neck cancer. Navidea was granted fast track designation by the FDA, which
will speed along the review process for this drug. Due to this drug’s high importance, their stock
has been skyrocketing the past couple of days [59].
Huntington Ingalls (HII): This company designs and manufactures ships for the military. Its
profits are skyrocketing and performing much better than expected. It does all of its work
exclusively with the US Navy and Department of Defense. Huntington Ingalls is on the top tier of
defense contractors and hopefully their stock market performance will continue to increase [30].
SolarWinds (SWI): SolarWinds creates enterprise information technology which includes
individual software to software that would be used by IT professionals. SolarWind is not as

80
expansive as compared to its competitors, Hewlett Packard and IBM but it is a stock to look out
for [40] [41].
Anika Therapeutics (ANIK): This company makes therapeutic products to protect and heal
tissues. Their stock has begun to increase in 2014. It is listed as a “strong buy” and it is a considered
a conservative purchase [49] [1].
THL Credit (TCRD): THL credit, is a company that manages investments and invests in
mezzanine debt which is, debt that is private subordinated debt. The stock performed well last
quarter and investors predict it to be a good purchase [4].
Bristol-Myers Squibb (BMY): A biopharmaceutical company, Bristol-Myers Squibb, creates and
distributes biopharmaceuticals on a global scale. Their best selling products are Abilify and Plavix,
which earn billions of dollars [10] [12].
5.2 Simulation Transactions
5.2.1 Week 1: 12/02/13-12/06/13
Market Overview:
Galena Biopharma Inc.: Galena is receiving a lot of good publicity recently because their breast
cancer therapy, Neuvax, which is an innovative product the company created. This resulted in
many investors becoming eager to purchase Galena’s stock. The stock was purchased a few days
after the news was released and the stock stayed relatively stagnant throughout the week, which
resulted in a loss of merely fifty dollars. Seen in Figure 5.1, there is potential for the stock will
continue to trend upward [25].
Figure 5.1 Week 1 GALE Stock Price

81
Course of Action:
During the first week of trading the news, this investor thought it was important to start
small and get a feel for how to invest and which information and articles to trust. Articles about
Galena Biopharma were being posted on numerous websites and after further research this investor
felt as though this was a good company to invest in. The pharmaceutical industry is a growing
market and creating a drug that can help keep cancer patients in would be valuable. The articles
might have been found too late because this investor purchased the stock after its dramatic increase
Monday morning, but the stock still seems to be gaining momentum. In Figure 5.1, it can be seen
that the stock was relatively inexpensive, so it is worth it to hold onto this stock and see if the price
continues to increase.
Date Symbol buy/
Sell Price Shares
Net Cost/
Proceeds
Profit/
Loss
Total
Cash
Total
Profit
12/02/13 $100,000
12/02/13 GALE Buy $4.44 5,000 $22,200.00 $87,800.00
Table 5.1 Week 1 Transaction Record (Includes $10 commission fee per trade)
5.2.2 Week 2: 12/09/13-12/13/13
Market Overview:
Galena Biopharma Inc.: In Figure 5.2 it is evident that the stock has been falling steadily this
week, but it appears to have potential to increase in value in the near future. If the stock is sold at
this point, the investor loses any opportunity to make a profit.
Figure 5.2 Week 2 GALE Stock Price

82
Navidea Biopharmaceuticals Inc.: Navidea has been increasing in small increments throughout
the course of the week which is exemplified in Figure 5.3. Over the course of week 2, this investor
was able to gain over one hundred dollars and hopes to continue earning a profit in the future.
Navidea’s newest vaccine, Lymphoseek, is on the fast track designation, which is the reason the
stock price has been rising [59].
Figure 5.3 Week 2 NAVB Stock Price
Course of Action: Adding Navidea stock to this investor’s portfolio has helped expand the
portfolio and helped lessen the blow when Galena was not performing as anticipated, which can
be seen in Table 5.2.
Date Symbol buy/
Sell Price Shares
Net Cost/
Proceeds
Profit/
Loss
Total
Cash
Total
Profit
12/10/13 NAVB Buy $2.02 5,000 $10,100.00 $67,700.00
Table 5.2 Week 2 Transaction Record (Includes $10 commission fee per trade)
5.2.3 Week 3: 12/16/13-12/20/13
Market Overview:
Galena Biopharma Inc.: There were no press about Galena that past week however, their stock
fell rather steadily which is apparent in Figure 5.4. This investor did not sell the stock because it
was imperative to keep in case NeuVax had a new breakthrough in the following weeks.

83
Figure 5.4 Week 2 GALE Stock Price
Navidea Biopharmaceuticals Inc.: Lymphoseek was performing well in their trials, especially
with their fast track designation granted to them by the FDA. This investor is optimistic that not
selling the stock will only give the stock more time to accumulate profit [59].
Course of Action: This investor kept Navidea in order to see their portfolio grow despite the fact
that Galena was in a steady decline.
Note: No transaction will be conducted from December 23, 2013 to January 17, 2014 due to the
winter break.
5.2.4 Week 4: 01/20/14-01/24/14
Market Overview:
Galena Biopharma Inc.: Over the past several weeks, Galena’s prices were soaring upward and
this investor felt that it was critical to keep them. As one can see on Figure 5.5, the stock value had
a dramatic increase compared to the previous weeks. On January 7th Galena Biopharma released
that it had enrolled its first patient in GALE-301, in order to treat a patient with ovarian cancer.
GALE-301 is a Float Binding Protein, which is a vaccine developed by Galena. GALE-301
exemplified the company’s innovative cancer immunotherapy research and vaccinations. Six days
later, Galena Biopharma acquired Mills Pharmaceuticals, which caused Galena to expand rapidly
and obtain a new vaccine, GALE-401, because it was acquired in the merger. With all this, it was
important to hold onto the stocks because the price was destined to increase over the following

84
weeks. This investor sold their shares of Galena at the start of the week. Observing Figure 5.5, the
stock value decreased over the week, which made it beneficial to sell the stock at the beginning of
the week [23] [24].
Figure 5.5 Week 4 GALE Stock Price
Navidea Biopharmaceuticals Inc.: Navidea had not had any innovations in the past couple of
weeks and the stock did not seem to be moving in any direction, so it was sold at the start of the
week. In Figure 5.6, it is clear that the stock declined in value throughout the week and this signaled
selling the stock was a smart decision.
Figure 5.6 Week 4 NAVB Stock Price
Huntington Ingalls: Many news articles claimed that Huntington Ingalls was a safe company to
invest in. After making such a large profit in Galena, this investor focused more on companies that
would produce small, but steady growth over the course of the following weeks. The reason why
the firm might be doing so well in the stock market could be because they have had a strong
earnings estimate revision over the past month. The industry HII is involved in a stable and

85
growing market, which makes this company a solid choice. As one can see in Figure 5.6 the stock
remained relatively steady throughout the week, which will only help this investor’s portfolio [61].
Figure 5.7 Week 4 HII Stock Price
SolarWinds: SolarWinds is another company that appears, to be growing steadily and is a sound
investment. Figure 5.7 shows how the company has been steadily growing, despite the fact that
the stock price slightly dropped this Friday. Several investment articles stated that SolarWinds was
a smart purchase such as Tech research firm, Gartner, who said, “global IT spending will grow
3.1% this year.” This leaves room for SolarWinds to grow, since they are recognized by create
quality products rather inexpensively [41].
Figure 5.8 Week 4 SWI Stock Price
Anika Therapeutics: Anika has been expanding and was named one of the best stocks to purchase
this year, so it appeared seemed to be a safe buy. Their stock has been increasing for the first time
in quite some time. The company is in a growing market of biological and biomedical advances
and their company creates a variety of different products. Even though the stock seemed to be in

86
a decline throughout the week, which is exemplified in Figure 5.9, this investor is still confident
that this stock will turn a profit [1].
Figure 5.9 Week 4 ANIK Stock Price
Course of Action: Selling the stock in Galena gave this investor a large profit for their portfolio,
which provides a cushion in case a bad investment is made. The three newly purchased stocks
increased this investor’s portfolio by $12,450. The stocks that were purchased or sold can be seen
in Table 5.3 below.
Date Symbol buy/
Sell Price Shares
Net Cost/
Proceeds
Profit/
Loss
Total
Cash
Total
Profit
01/20/14 GALE Sell $7.00 5,000 $22,200.00 $12,800 $102,700.00 $12,800
01/20/14 NAVB Sell $1.95 5,000 $10,100.00 ($350) $112,450.00 $12,450
01/22/14 HII Buy $93.45 100 $9,651.00 $102,799.00
01/22/14 SWI Buy $39.84 100 $4,030.00 $98,769.00
01/22/14 ANIK Buy $34.46 100 $3,207.00 $95,562.00
Table 5.3 Week 4 Transaction Record (Includes $10 commission fee per trade)
5.2.5 Week 5: 01/27/14-01/31/14
Market Overview:
Huntington Ingalls: This week, there was not much in the news about Huntington Ingalls.
However, it was evident that this is a good sector of the market to invest in. Investor Place puts
defense companies in the buy market right now, making it a safe investment. This can be seen by
its steady growth throughout the week, despite Friday, in Figure 5.10 [4].
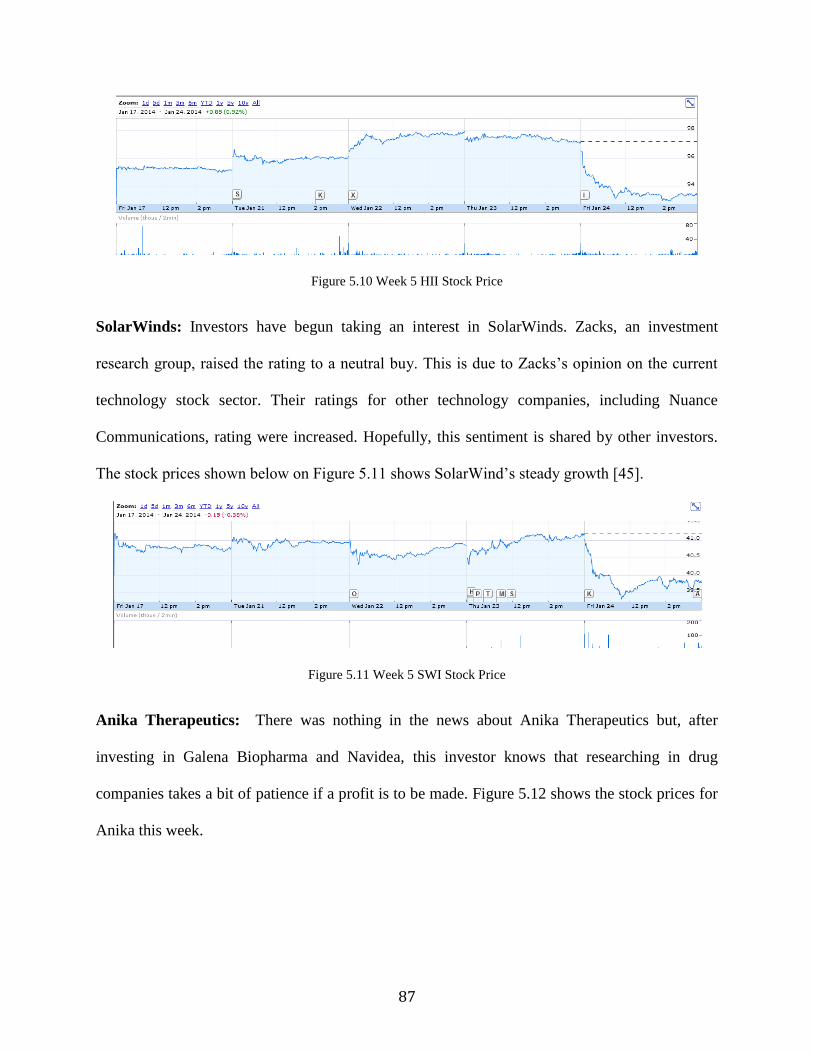
87
Figure 5.10 Week 5 HII Stock Price
SolarWinds: Investors have begun taking an interest in SolarWinds. Zacks, an investment
research group, raised the rating to a neutral buy. This is due to Zacks’s opinion on the current
technology stock sector. Their ratings for other technology companies, including Nuance
Communications, rating were increased. Hopefully, this sentiment is shared by other investors.
The stock prices shown below on Figure 5.11 shows SolarWind’s steady growth [45].
Figure 5.11 Week 5 SWI Stock Price
Anika Therapeutics: There was nothing in the news about Anika Therapeutics but, after
investing in Galena Biopharma and Navidea, this investor knows that researching in drug
companies takes a bit of patience if a profit is to be made. Figure 5.12 shows the stock prices for
Anika this week.

88
Figure 5.12 Week 5 ANIK Stock Price
Course of Action: No transaction was conducted this week.
5.2.6 Week 6: 02/03/14-02/07/14
Market Overview:
Huntington Ingalls: No news articles about Huntington Ingalls were released this week but, the
stock was going fairly steady throughout the week, so I kept the investment with Huntington
Ingalls. The steadiness of the stock prices can be seen in Figure 5.13.
Figure 5.13 Week 6 HII Stock Price
Solarwinds: Solarwinds reported that they made a substantial profit in the fourth quarter, which
helped their stock, increase this week. The company released this information and will hold a press
conference later this month to give more details about the profit. The release of this information
has strengthened SolarWinds as an investment. This publicity has seemed to increase stock prices,
which can be seen on Figure 5.14 [46].

89
Figure 5.14 Week 6 SWI Stock Price
Anika Therapeutics: Anika has been thought very highly of by many investment firms. Their
company made a profit, which is why the stock value is increasing, thus making it a sound
investment. The stock price has increased over the past week, which can be seen in Figure 5.15
[9].
Figure 5.15 Week 6 ANIK Stock Price
Course of Action: No transaction was conducted this week.
5.2.7 Week 7: 02/10/14-02/14/14
Market Overview:
Huntington Ingalls: According to Bloomberg News, Huntington Ingalls Industry should have
taken a hard hit since Wednesday. They lost a contract with the U.S. Coast Guard ship program to
build a ship for the government. General Dynamics, Huntington Ingalls number one competitor,
got the contract. This should have resulted in the stock value plummeting. As shown in Figure 5.16
below, for the past two days the stock began to rise, which made this investor more comfortable
purchasing more stock [26].

90
Figure 5.16 Week 7 HII Stock Price
Solarwinds: As shown below in Figure 5.17, Solarwind’s stock has been increasing dramatically
the past week. There has been a lot of discussion over the profits that Solarwind made last quarter.
They are releasing their profit statement in several weeks and several executives have been
exercising their stock options now and purchasing stock in the company, which seems to assure
investors that when the company releases their quarter four reports that the price of their stock will
continue to increase [3].
Figure 5.17 Week 7 SWI Stock Price
Anika Therapeutics: Anika is also planning on releasing their end of the year results and its fourth
quarter performance. The release will take place February 26th and they will hold a press

91
conference on the 27th. This excited investors as their stock rose throughout the week which, is
evident from Figure 5.18 [7].
Figure 5.18 Week 7 ANIK Stock Price
THL Credit: Investment websites have said only positive things about THL credit and strongly
urge their consumers to buy it. On the 14th, the company began trading ex-dividend and they
announced they would be doing so a few days prior. That seemed to peak investor’s interest and
the stock began to rise, which is shown in Figure 5.19 [51] [4].
Figure 5.19 Week 7 TCRD Stock Price
Course of Action: Due to the stability of the Huntington Ingalls Industries, SolarWinds Inc., and
Anika Therapeutics Inc. stock over the past weeks and positive news publicity about these
companies this investor decided to invest more money into each one. Also, THL Credit was

92
purchased which seemed to be doing well according to the news. This can all be seen on Table 5.4
below.
Date Symbol buy/
Sell Price Shares
Net Cost/
Proceeds
Profit/
Loss
Total
Cash
Total
Profit
02/12/14 HII Buy $91.00 100 $9,100.00 $86,462.00
02/12/14 SWI Buy $42.70 900 $38,430.00 $48,032.00
02/12/14 ANIK Buy $30.25 400 $12,100.00 $35,932.00
02/12/14 TCRD Buy $15.70 1,000 $15,430.00 $20,502.00
Table 5.4 Week 7 Transaction Record (Includes $10 commission fee per trade)
5.2.8 Week 8: 02/17/14-02/21/14
Market Overview:
Huntington Ingalls: The important news that effected Huntington Ingalls’s stock had more to do
with their competitors. Airbus Group, was under investigation for a year for helicopters that were
not up to standard for the United Kingdom Civil Aviation Authority. This made investors move
their money into competitor’s stock, which helped Huntington Ingalls increase the value of their
stock. This is apparent in Figure 5.20. [61].
Figure 5.20 Week 8 HII Stock Price
Solarwinds: At the start of this week, Solarwinds has proven to be headed in a positive direction.
In an article by Seeking Alpha, Solarwinds has begun to show that they are moving in the right
direction because their company is creating more technology than ever before this year. It is an
expanding company and the increase in their stock value reflects that, which is shown in Figure
5.21 [48].

93
Figure 5.21 Week 8 SWI Stock Price
Anika Therapeutics: Anika is still preparing its fourth quarter report, which will debut next
Wednesday and appears to have enticed more investor’s to invest their money in hopes that this
stock will continue to grow after they release of their quarter four report. This investor felt as
though it was important to hold on to this stock in hopes that the value would rapidly increase after
their earnings report on Wednesday. The stock value had been increasing throughout the week,
which can be seen in Figure 5.22 [7].
Figure 5.22 Week 8 ANIK Stock Price
THL Credit: Investment experts seem to have a positive outlook on THL Credit and their stock’s
ability to produce good results. They claim this is due to THL Credit’s yields are starting to become
more stable. They also commented on their vast growth capital, which could increase returns.
Although there wasn’t anything else in the news about THL this investor felt that that article,
coupled with the stock’s performance this week, warranted that the stock should be kept for the
remainder of the week. The stock value fluctuated throughout the week, which is shown in Figure
5.23 [52].

94
Figure 5.23 Week 8 TCRD Stock Price
Bristol-Myers Squibb: Several analyses of Bristol-Myers Squibb have stated how this company
is a company that an investor should invest their money in. The company’s stock prices have risen
over the past few days. TheStreet, an investment website, encouraged their follows to buy this
stock. The release of their fourth quarter earnings helped boost their rating in investor’s eyes. CEO,
Lamberto Andreotti, sold a good portion of his stock last week, which exemplified how much the
price of the stock has increased. Bristol-Myers Squibb has been outperforming S&P 500 and the
period of growth. Bristol-Myers Squibb has been performing well showing that their stock will
perform well over the next weeks. Their stock market performance over this week can be viewed
in Figure 5.24 [15] [11].
Figure 5.24 Week 8 BMY Stock Price
Course of Action: This investor allowed the previously purchased stocks to grow because they
were all increasing in value throughout the week and was able to buy another stock to strengthen
their portfolio. The list of transactions can be seen below on Table 5.5.
Date Symbol buy/
Sell Price Shares
Net Cost/
Proceeds
Profit/
Loss
Total
Cash
Total
Profit
02/17/14 BMY Buy $53.80 300 $16,140.00 $4,342.00
Table 5.5 Week 8 Transaction Record (Includes $10 commission fee per trade)
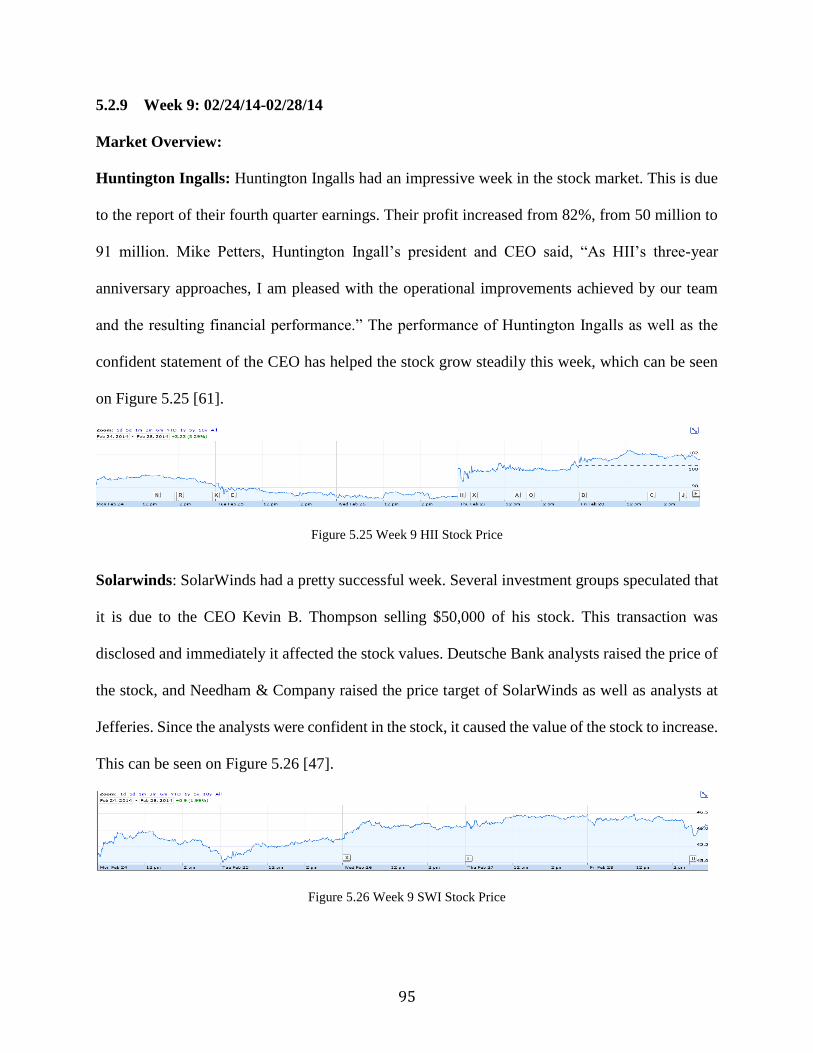
95
5.2.9 Week 9: 02/24/14-02/28/14
Market Overview:
Huntington Ingalls: Huntington Ingalls had an impressive week in the stock market. This is due
to the report of their fourth quarter earnings. Their profit increased from 82%, from 50 million to
91 million. Mike Petters, Huntington Ingall’s president and CEO said, “As HII’s three-year
anniversary approaches, I am pleased with the operational improvements achieved by our team
and the resulting financial performance.” The performance of Huntington Ingalls as well as the
confident statement of the CEO has helped the stock grow steadily this week, which can be seen
on Figure 5.25 [61].
Figure 5.25 Week 9 HII Stock Price
Solarwinds: SolarWinds had a pretty successful week. Several investment groups speculated that
it is due to the CEO Kevin B. Thompson selling $50,000 of his stock. This transaction was
disclosed and immediately it affected the stock values. Deutsche Bank analysts raised the price of
the stock, and Needham & Company raised the price target of SolarWinds as well as analysts at
Jefferies. Since the analysts were confident in the stock, it caused the value of the stock to increase.
This can be seen on Figure 5.26 [47].
Figure 5.26 Week 9 SWI Stock Price

96
Anika Therapeutics: The value of Anika Therapeutic’s stock skyrocketed this week. The increase
in stock value was due to the FDA giving marketing approval to the drug Monovisc which, is for
osteoarthritis of the knee. This drug will be marketed by a subsidiary of Johnson and Johnson.
Sean Williams of Motley Fool, an investment advice contributor, stated that many investors might
have “overshot what Anika is really capable of,” After reading that advice along with this
investor’s experience in investing in pharmaceutical companies it was best to sell the stock mid-
week. As one can see in Figure 5.27 this seemed to be the smart decision [15].
Figure 5.27 Week 9 ANIK Stock Price
THL Credit: With the release of THL Credit’s fourth quarter earnings next week, this investor
felt it was important to keep the stock to continue monitoring its performance. Investors have been
posting articles of anticipation for their quarterly release. BDC Buzz from Seeking Alpha, an
investment group ranked THL Credit third on their rankings.Their stock has had a small increase
this week, which can be seen on Figure 5.28 [47].
Figure 5.28 Week 9 TCRD Stock Price
Bristol-Myers Squibb: This week Bristol-Myers Squibb received some very exciting news. Their
drug, Myalept is used to help people who are born with little to no fat tissue was approved to as
the first drug to treat the condition. Their stock fell a small portion which, can be seen in Figure
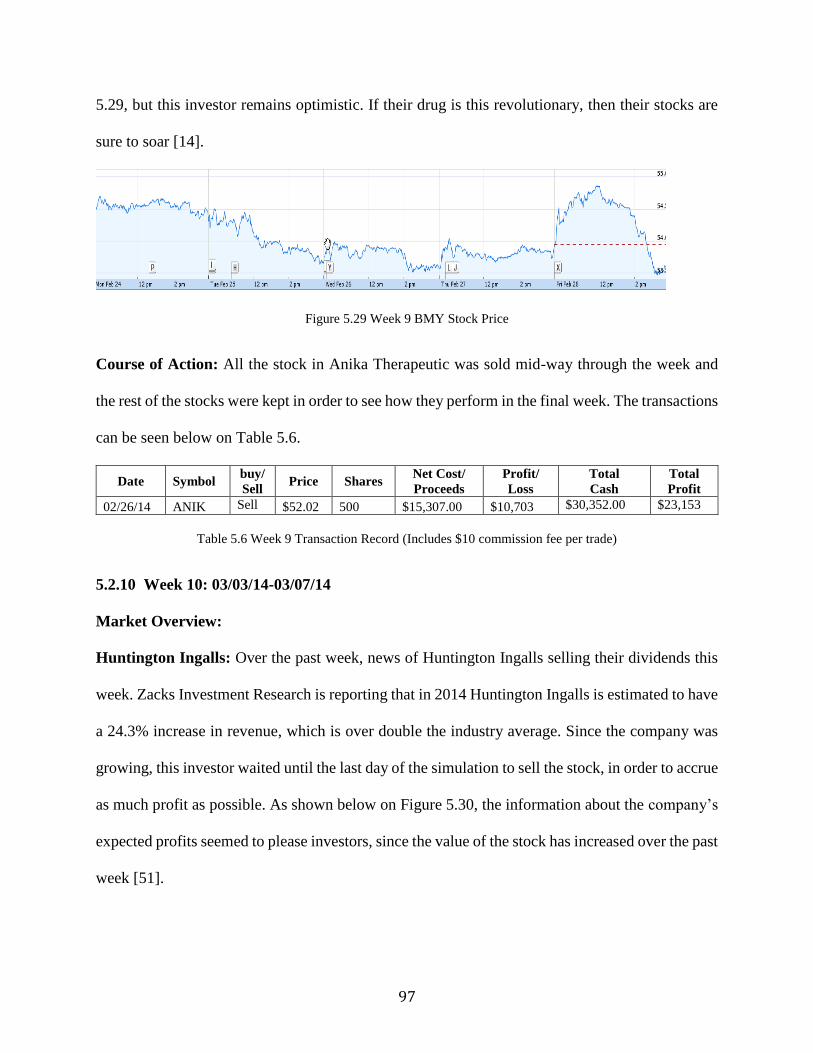
97
5.29, but this investor remains optimistic. If their drug is this revolutionary, then their stocks are
sure to soar [14].
Figure 5.29 Week 9 BMY Stock Price
Course of Action: All the stock in Anika Therapeutic was sold mid-way through the week and
the rest of the stocks were kept in order to see how they perform in the final week. The transactions
can be seen below on Table 5.6.
Date Symbol buy/
Sell Price Shares
Net Cost/
Proceeds
Profit/
Loss
Total
Cash
Total
Profit
02/26/14 ANIK Sell $52.02 500 $15,307.00 $10,703 $30,352.00 $23,153
Table 5.6 Week 9 Transaction Record (Includes $10 commission fee per trade)
5.2.10 Week 10: 03/03/14-03/07/14
Market Overview:
Huntington Ingalls: Over the past week, news of Huntington Ingalls selling their dividends this
week. Zacks Investment Research is reporting that in 2014 Huntington Ingalls is estimated to have
a 24.3% increase in revenue, which is over double the industry average. Since the company was
growing, this investor waited until the last day of the simulation to sell the stock, in order to accrue
as much profit as possible. As shown below on Figure 5.30, the information about the company’s
expected profits seemed to please investors, since the value of the stock has increased over the past
week [51].

98
Figure 5.30 Week 10 HII Stock Price
Solarwinds: On the 5th of March, Solarwinds improved its Network Performance Monitor. As a
creator of affordable IT management software, this seemed to be an incredible advancement.
Solarwinds is one of the few companies that offer this level of improvement at a low cost. This
investor decided to sell the stock the following day, in order to ensure the profit was maximized.
As one can see on Figure 5.31 below, March 6th was the day the most profit could be made [43].
Figure 5.31 Week 10 SWI Stock Price
THL Credit: THL Credit had not been earning much money during the course of the simulation.
This investor made the decision that the stock should be sold at the beginning of the week in order
to earn a small profit. As shown below in Figure 5.32 this was a smart decision because the stock
plummeted in the second half of the week.
Figure 5.32 Week 10 TRCD Stock Price

99
Bristol-Myers Squibb: There was not much in the news about Bristol-Myers Squibb this week.
However, this investor noticed the price of the stock increasing until mid-week. Then, the stocks
were sold in case the stock value was to decrease. One can see, the upward trend for the week on
Figure 5.33 below.
Figure 5.33 Week 10 BMY Stock Price
Course of Action: All four stocks were sold at various times in the week in order to great profit.
TCRD was sold at the beginning of the week. BMY was sold in the middle of the week. SWI and
HII were sold at the end of the week. The profits made over this week can be seen below on Table
5.7.
Date Symbol buy/
Sell Price Shares
Net Cost/
Proceeds
Profit/
Loss
Total
Cash
Total
Profit
03/03/14 TCRD Sell $15.88 1,000 $15,880.00 $450 $46,253.00 $450
03/05/14 BMY Sell $56.96 300 $17,088.00 $948 $63,340.00 $1,398
03/06/14 SWI Sell $52.60 1,000 $52,600.00 $10,140 $115,940.00 $11,538
03/07/14 HII Sell $105.87 200 $21,174.00 $2,423 $137,114.00 $13,961
Table 5.7 Week 10 Transaction Record (Includes $10 commission fee per trade)
5.3 Results and Discussion
When the ten week simulation came to a close, this investor was able to make $37,114 in
profit. Galena Biopharma was the most successful stock in this portfolio earning $12,800.
Solarwinds and Anika Therapeutics also made a substantial profit earning $10,140 and $10,703
respectively. All of these three stocks are technology based stocks, two of which were
biopharmaceutical companies. That being said, Navidea Biopharmaceuticals, a technology based

100
company, was the only stock that was purchased that lost money. The investor had several other
types of stock such as defense contracting with Huntington Ingalls and a banking stock with THL
Credit. The values of those two stocks did not fluctuate much during the simulation, but they did
not accrue much money. In this investor’s opinion, the technology stocks that appear in the news
are risky investments, but are worth the reward.
Even though this investor used the trading the news strategy, several modifications to the
strategy were made to improve it. As the project progressed, it became evident that stocks needed
to be held on to if there was to be a greater return off the initial investment. Galena Biopharma had
been losing money for several weeks, however the stock was not sold because with the vaccine
being released, this investor knew that a profit could be made. This is the reason for many weeks
there was little trading because most of the news was to observe the stocks and make sure they
were not losing any money.
Also, past experience was used with Anika Therapeutics. It is a very similar company to
Galena Biopharma. When the stock was first purchased it was not earning much of a profit, which
was similar to Galena. As a result, this investor keep Anika in hopes that that past experience
coupled with some positive stories in the news about Anika would make a large return off the
investment.
Although the 37.1% return on investment seemed to be a good return off the initial
investment this investor feels as though there were several things that could have been done in
order to maximize profits. Trading the news was a beneficial strategy, but there were things that
could have been utilized in order to make the strategy more efficient. News alerts, on websites
such as Google News, were not used. If they were used, this investor would not have to keep
checking the news periodically and would have been on top of every stock, thus knowing the

101
perfect time to trade. Several times, the stock price would change because something had happened
in the news and this investor would not catch it until it was too late.
Another idea that was discussed between the investors in the project group was the use of
twitter for this investment strategy. Twitter, if used properly, could have provided the most up to
the date information if the investor followed the right companies. Over the first couple weeks this
method was attempted, but no important information was collected so it was quickly discarded. If
companies were selected that reported a lot of news on social media it might have been
incorporated in the strategy because it would have been more beneficial.
Some modifications may not have been applied, but overall a great deal of information was
found out about the stock market. The most important factor to this strategies’ success over the
ten week simulation was that it was flexible when the investor could trade their stock. It didn’t call
for the stocks to be sold every so often, allowing for them to grow. At the same time, the stocks
could be sold if they were not earning a profit, like Navidea Biopharmaceuticals, which decreased
in value by three hundred and fifty dollars. Being able to couple knowledge and intuition into the
strategy was critical to its success.
102
6 Growth Investing
6.1 Introduction
Growth investing is defined as increasing one’s wealth through long- or short-term capital
appreciation. Stocks are purchased at a premium price, held for several years as earnings grow and
as a result make a large return on the initial investment. The growth strategy is used by investors
who seek out stocks that they deem have serious potential growth in the future. A good company
to invest in has expected earnings that grow at an above-average rate compared to its industry and
market.
Many investors are fond of growth investing because hindsight is required to determine
those successful growth stocks. IBM, Xerox, and Google are already successful growth stocks.
Their stock prices have appreciated and they command high stock prices today because the market
expects these stocks to continue to grow in the future.
The risk involved in growth investing is determining what stocks are growth stocks and
what ones are not. There are several factors to consider when evaluating investment growth.
Growth investors research a company’s return of equity (ROE), earning per share (EPS), and
projected earnings before investing in a company for a long duration of time.
Return of Equity (ROE), is a mathematical equation expressing how efficiently a
corporation can make a profit. A company ROE is the ratio between the company’s net income
divided by the total equity of shareholders. The ROE symbolizes the company’s ability to generate
profit given the shareholders equity. The ROE is particularly important when comparing
companies within the same industry.
Earning per share, EPS, or P/E ratio is a mathematical expression that is the net income
divided by the number of outstanding shares. The EPS is the most popular method used to gauge
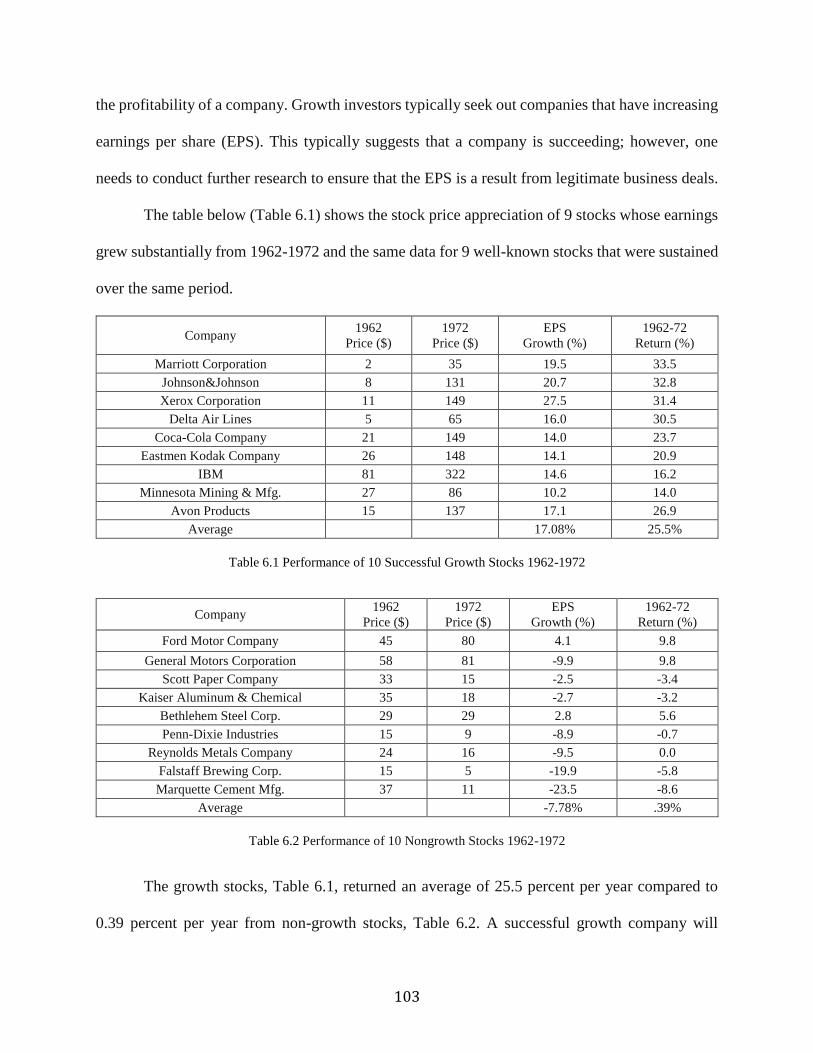
103
the profitability of a company. Growth investors typically seek out companies that have increasing
earnings per share (EPS). This typically suggests that a company is succeeding; however, one
needs to conduct further research to ensure that the EPS is a result from legitimate business deals.
The table below (Table 6.1) shows the stock price appreciation of 9 stocks whose earnings
grew substantially from 1962-1972 and the same data for 9 well-known stocks that were sustained
over the same period.
Company 1962
Price ($)
1972
Price ($)
EPS
Growth (%)
1962-72
Return (%)
Marriott Corporation 2 35 19.5 33.5
Johnson&Johnson 8 131 20.7 32.8
Xerox Corporation 11 149 27.5 31.4
Delta Air Lines 5 65 16.0 30.5
Coca-Cola Company 21 149 14.0 23.7
Eastmen Kodak Company 26 148 14.1 20.9
IBM 81 322 14.6 16.2
Minnesota Mining & Mfg. 27 86 10.2 14.0
Avon Products 15 137 17.1 26.9
Average 17.08% 25.5%
Table 6.1 Performance of 10 Successful Growth Stocks 1962-1972
Company 1962
Price ($)
1972
Price ($)
EPS
Growth (%)
1962-72
Return (%)
Ford Motor Company 45 80 4.1 9.8
General Motors Corporation 58 81 -9.9 9.8
Scott Paper Company 33 15 -2.5 -3.4
Kaiser Aluminum & Chemical 35 18 -2.7 -3.2
Bethlehem Steel Corp. 29 29 2.8 5.6
Penn-Dixie Industries 15 9 -8.9 -0.7
Reynolds Metals Company 24 16 -9.5 0.0
Falstaff Brewing Corp. 15 5 -19.9 -5.8
Marquette Cement Mfg. 37 11 -23.5 -8.6
Average -7.78% .39%
Table 6.2 Performance of 10 Nongrowth Stocks 1962-1972
The growth stocks, Table 6.1, returned an average of 25.5 percent per year compared to
0.39 percent per year from non-growth stocks, Table 6.2. A successful growth company will
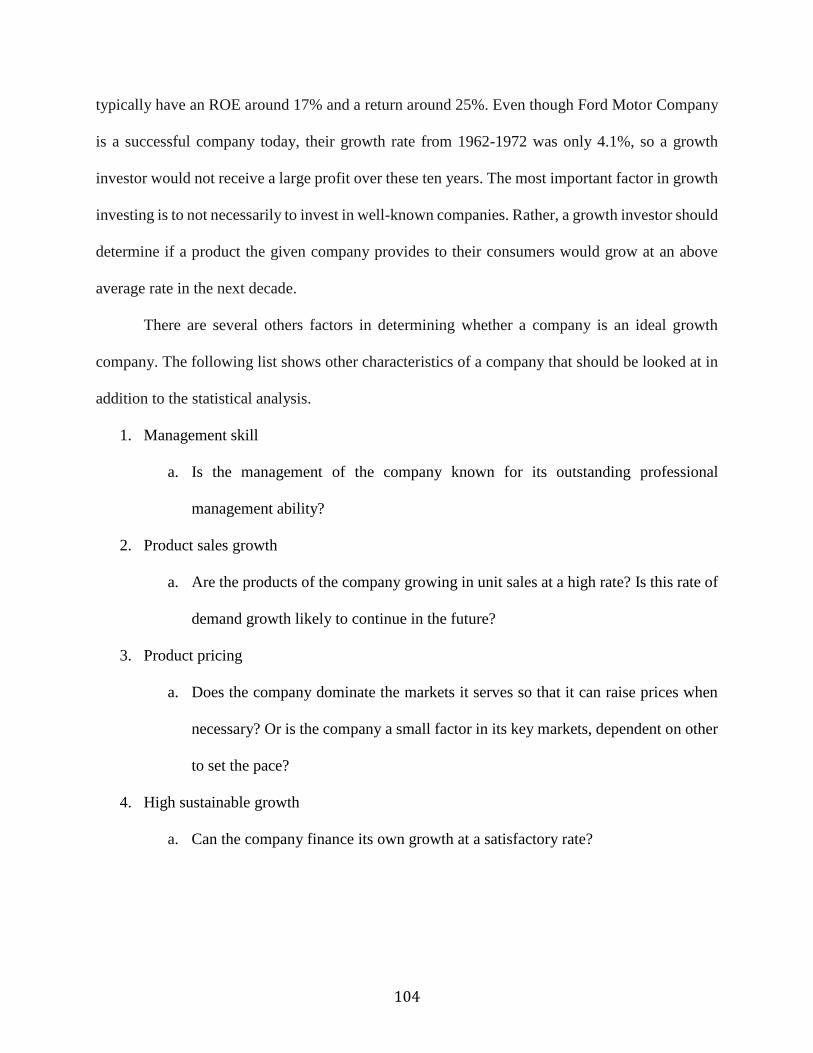
104
typically have an ROE around 17% and a return around 25%. Even though Ford Motor Company
is a successful company today, their growth rate from 1962-1972 was only 4.1%, so a growth
investor would not receive a large profit over these ten years. The most important factor in growth
investing is to not necessarily to invest in well-known companies. Rather, a growth investor should
determine if a product the given company provides to their consumers would grow at an above
average rate in the next decade.
There are several others factors in determining whether a company is an ideal growth
company. The following list shows other characteristics of a company that should be looked at in
addition to the statistical analysis.
1. Management skill
a. Is the management of the company known for its outstanding professional
management ability?
2. Product sales growth
a. Are the products of the company growing in unit sales at a high rate? Is this rate of
demand growth likely to continue in the future?
3. Product pricing
a. Does the company dominate the markets it serves so that it can raise prices when
necessary? Or is the company a small factor in its key markets, dependent on other
to set the pace?
4. High sustainable growth
a. Can the company finance its own growth at a satisfactory rate?

105
In determining which companies could potentially be ideal growth companies this investor
looked at the companies EPS and ROE from 2011-2013. In addition, this investor looked at the
stock history since this company went public. When looking at this graph this investor wants to
see if the company is reaching new and higher peaks as the company continues to be traded on the
market. Research on the company must be conducted to develop hindsight on the company’s
success in the future. Some factors that might lead an investor to believe this company has a high
rate of growth in the future are branching out into different global markets and acquiring
companies in the near future. Overall, if this investor found any information that lead them to
believe this company was going to have an above average growth in the future this investor would
invest in this company.
6.2 Company Analysis
This investor has invested a total of $99,396.11 in a total of six different companies whom
this investor deemed to be high earning growth stocks. Throughout the duration of this experiment,
this investor needed to monitor their portfolio value. This investor did the necessary research to
determine that all these companies have important characteristics that make them excellent
companies for a high gross return in the future. Throughout this simulation, this investor needed
to ensure that throughout this experiment all business practices were ethical. If this investor finds
at any time that a company they invested in is taking part in unethical business practices this
investor will immediately sell their shares. However, before investing in these companies this
investor did a significant amount of research to ensure that unethical business practices were
unlikely.
At any point if a company’s stock value dramatically decreases and all business practices
are ethical this investor will continue to hold their shares in this company.

106
iRobot Corporation (IRBT)
iRobot Corporation designs and builds practical robots. iRobot was founded in 1990 by
roboticists from Massachusetts Institute of Technology.
One of the many robots iRobot designs and manufactures are home robots that
revolutionize the way people clean. More than 10 million home robots have been sold worldwide.
The most popular product is the iRobot Roomba, which is a vacuum cleaning robot. iRobot also
designs and builds combat-proven defense and security robots to support troops and public safety
professionals. More than 5,000 have been distributed worldwide.
In 2012, iRobot generated $436 million in revenue and employed more than 500 people.
Corporate headquarters are located in Bedford, Massachusetts, but offices are also located in
California, United Kingdom, and Hong Kong.
iRobot Corporation (IRBT) provides a unique product to the market, thus the ROE was not
taken into series consideration. According to Table 6.3, the EPS for IRBT dropped severely in
2012, but in 2013 the EPS was restored. After viewing Figure 6.1, the general trend for IRBT
since this company went public, has been a positive increase. Given all these factors this investor
decided to purchase 780 shares totaling $25,032.40.
Stat/ Ratio 2013 2012 2011
Earnings Per Share (EPS) 0.28 0.02 0.27
Return on average equity (ROE) 9.06% 6.63% 19.30%
Table 6.3 Key stats and ratios for IRBT

107
Figure 6.1 History IRBT 2005-2013
FuelCell Energy Inc (FCEL)
FuelCell Energy Inc is a leading global fuel cell company that designs, manufactures, sells,
installs, operates, and services stationary fuel cells. This company uses a wide range of fuels to
produce electricity electrochemically without combustion, thus the process is silent and produces
little pollution. Their fuel cells are used to power electric utilities, commercial and industrial
companies, universities, municipalities, and government entities. FuelCell Energy world
headquarters are located in Danbury, Connecticut. In June 2011, the company acquired German
subsidiary FuelCell Energy Solutions,GmbH to service customers in Europe. In addition,
customers in Asia may inquire through partner company POSCO Energy. On October 31, 2013
FCEL revealed that its total revenue increased 56%.
Currently, FuelCell Energy Inc is researching hydrogen generation and carbon capture in
addition to solid oxide fuel cells and hydrogen compression and storage. This investor decided to
invest in FuelCell Energy Inc because even though, this company has a negative ROE and EPS,
as exemplified in Table 6.4. In addition, the stock trend appears to be at a plateau, Figure 6.2, but
the research this company is currently conducting shows promise of success in the future. Overall,
this is a risky investment with the possibility of a large profit margin in the future. This investor
purchased 20,000 shares of FCEL totaling 27,410.00.
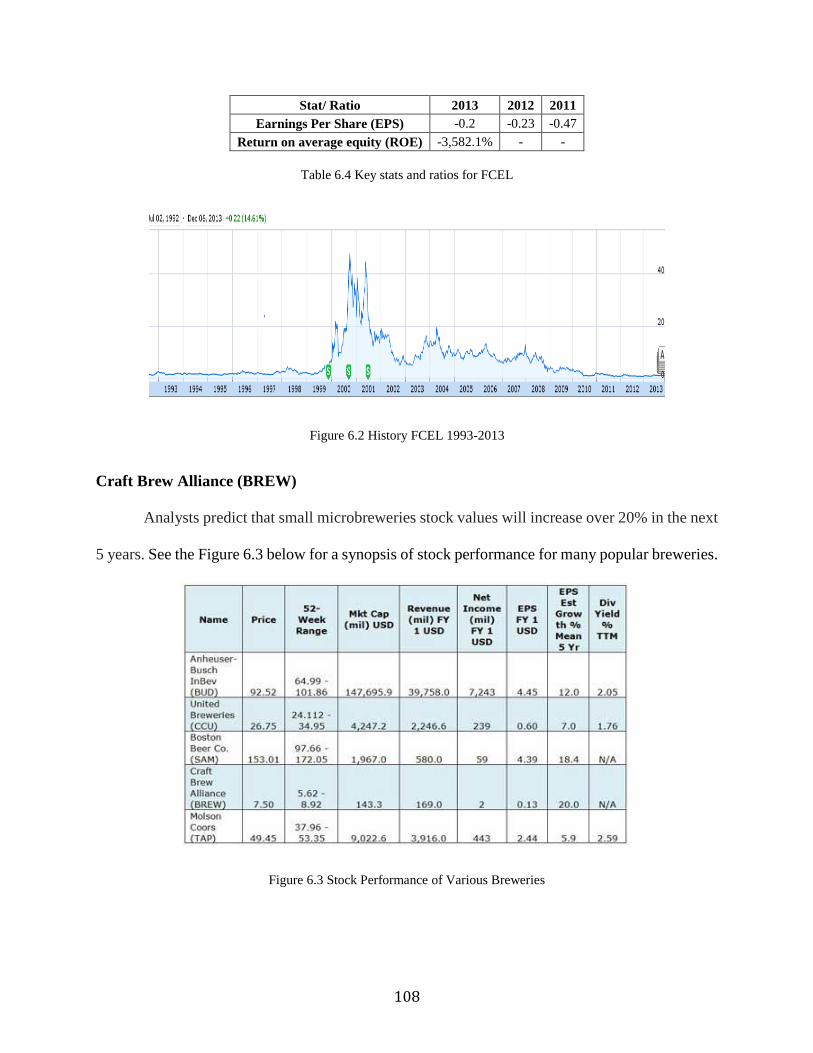
108
Stat/ Ratio 2013 2012 2011
Earnings Per Share (EPS) -0.2 -0.23 -0.47
Return on average equity (ROE) -3,582.1% - -
Table 6.4 Key stats and ratios for FCEL
Figure 6.2 History FCEL 1993-2013
Craft Brew Alliance (BREW)
Analysts predict that small microbreweries stock values will increase over 20% in the next
5 years. See the Figure 6.3 below for a synopsis of stock performance for many popular breweries.
Figure 6.3 Stock Performance of Various Breweries

109
The company currently dominating the market is Anheuser-Busch InBev (BUD). Based in
St.Louis, Anheuser-Busch is the leading American brewer, holding 47.6 percent share of U.S beer
sales to retailers. The company brews eight of the worlds 12 top selling beers. Their most popular
being Budweiser and Bud Light. Currently, Anheuser-Busch operates 12 breweries across the
United States. Anheuser-Busch is a wholly-owned subsidiary of Anheuser-Busch InBev, a leading
global brewer [5]. Of all the Breweries listed BUD is the safest investment because BUD has the
highest gross and net profit margins, which would provide a buffer during difficult economic
times. BUD would not be the best growth company to invest in because Anheuser-Busch has
already established itself as the lead global commercial brewer. So, an investor looking to make a
large return on their investment would not want to invest in BUD.
Boston Beer Company, SAM, is America’s leading brewer of craft beers. Producing over
30 distinctive award-winning styles of craft beer. Well known, for Sam Adams, Twisted Tea, and
Angry Orchard. The brewery has won more awards in international beer tasting competitions in
the last five years than any other craft beer brewery in the world [42]. During the 2009 recession,
SAM plunged 62% while BUD retreated a mere 36%. When the market came back however SAM
climbed 711% (Martin, Rudy 5 Beer Stocks brewing up gains in a down draft). SAM is currently
trading at the highest market value compared to other breweries, so an investor looking to make a
large return would most make a significant profit. In addition, during an economic recession the
value of SAM plunges as exemplified in 2009. So, investing in Boston Brew Company is a risky
investment with the probability of very little return.
The Craft Brew Alliance, BREW, is a partnership among three craft beer brands including
Wildmer Brothers Brewing, Redhook, and Kona Brewing. Each brand executes different
strategies, but shares the same capability, knowledge, and passion (Craftbrewalliance.com).

110
Widmer Brother Brewing was founded in 1984 in Portland Oregon and is most noted for
their unique and unconventional twist on traditional styles. For example, their MarionBerry
Hibiscus Gose is a traditional cloudy German style wheat beer that contains Oregon-grown
marionberries as well as dried hibiscus flowers [58].
Redhook began in Seattle in 1981. Redhook is one of the countries first craft breweries.
Some of Redhook’s common brews include Redhook ESB, Long Hammer IPA, Pilsner, Copper
Hook, and several seasonal offerings. Redhook distributes its products through the Craft Brew
Alliance Inc and has a distribution agreement with Anheuser-Busch InBev, which owns 32% of
the stock in Craft Brew Alliance. Redhook is currently distributed in 48 states [39].
Kona Brewing was founded in 1994 in Hawaii. Their objective is to produce local island
brews with spirit, passion, and quality. Kona brews 13 different styles of beer. The most popular
brews being Big Wave Golden Ale, Fire Rock Pale Ale, and Longboard Island Lager. Their beers
are distributed in 36 states and 9 countries abroad [35].
This investor choose to invest in the Craft Beer Alliance because this company is a
partnership of three different microbreweries located all over the country that each offer a unique
product and a strong emphasis on quality. These three brands joining forces allows them to satisfy
more consumers and offer a broader range of distinct craft beers than any other brewery. In
addition, since Anheuser-Busch Inbev owns a major portion of this alliance and is responsible for
its distribution, which exemplifies that their product can be successfully distributed throughout the
country. Investing in BREW is somewhat of a risky investment since it is small, relatively new
company that has not been on the market during an economic regression. According to Table 6.5
the EPS for BREW has been decreasing since 2011, but analysts predict over the next five years
the EPS for BREW will grow over 20%. The dramatic increase in the ROE from 2012-2013

111
exemplifies that BREW has a high probability of growth in the future. In addition, after viewing
Figure 6.4, since 2008 BREW has been steadily increasing and in 2013 BREW began to grow
rapidly. Given all of these factors this investor purchased 500 shares totaling $8,025.00.
Stat/ Ratio 2013 2012 2011
Earnings Per Share (EPS) 0.06 0.13 0.51
Return on average equity (ROE) 6.95% 2.38% -
Table 6.5 Key stats and ratios for BREW
Figure 6.4 History BREW 2008-2014
Donaldson Company, Inc (DCI)
Donaldson Company, Inc is a Minneapolis-based company, which manufactures air filters
for trucks, industrial equipment, mining equipment, and gas turbines. Donaldson is one of the
largest and most successful filtration manufacturers in the world. A few big-name clients include
Caterpillar and Deere.
According to Table 6.6, Donaldson Company has had a slight decrease in ROE and EPS
from 2012-2013, but this investor still decided to invest in the Donaldson Company, Inc.
According to Figure 6.5, the stock value for DCI has been steadily increasing since this company
went public. Currently, Donaldson Company, Inc is building an additional manufacturing plant in

112
Mexico, which will support the strong demand for filters in Latin America. In addition, there are
a number of gas turbine projects in the Middle East, China, and the United States. This
international expansion will continue to drive sales outside the United States. Currently, 60% of
all sales are from outside the United States.
Over the past five years Donaldson’s earnings have increased by 12%. Analysts predict
that stocks will continue to rise by 13% per year over the next three to five years due to the demand
of new and replacement filters [43]. This investor purchased 170 shares totaling 6,957.90.
Stat/ Ratio 2013 2012 2011
Earnings Per Share (EPS) 1.64 1.73 -
Return on average equity (ROE) 21.97% 24.80% -
Table 6.6 Key stats and ratios for DCI
Figure 6.5 History DCI 1978-2014
McCormick & Company, Incorporated (MKC)
McCormick & Company, Incorporated is a fortune 1000 company that manufactures
spices, herbs, and food flavorings for retail, commercial, and industrial markets. Today the
company has approximately 8,000 employees and contains many brands located in the United
States, Europe, and Canada.
Most people have at least some McCormick & Company products in their spice cabinet,
which might signify that McCormick & Company is not a high growth company offering a large
profit margin. However, according to Table 6.7 below the ROE has increased significantly over
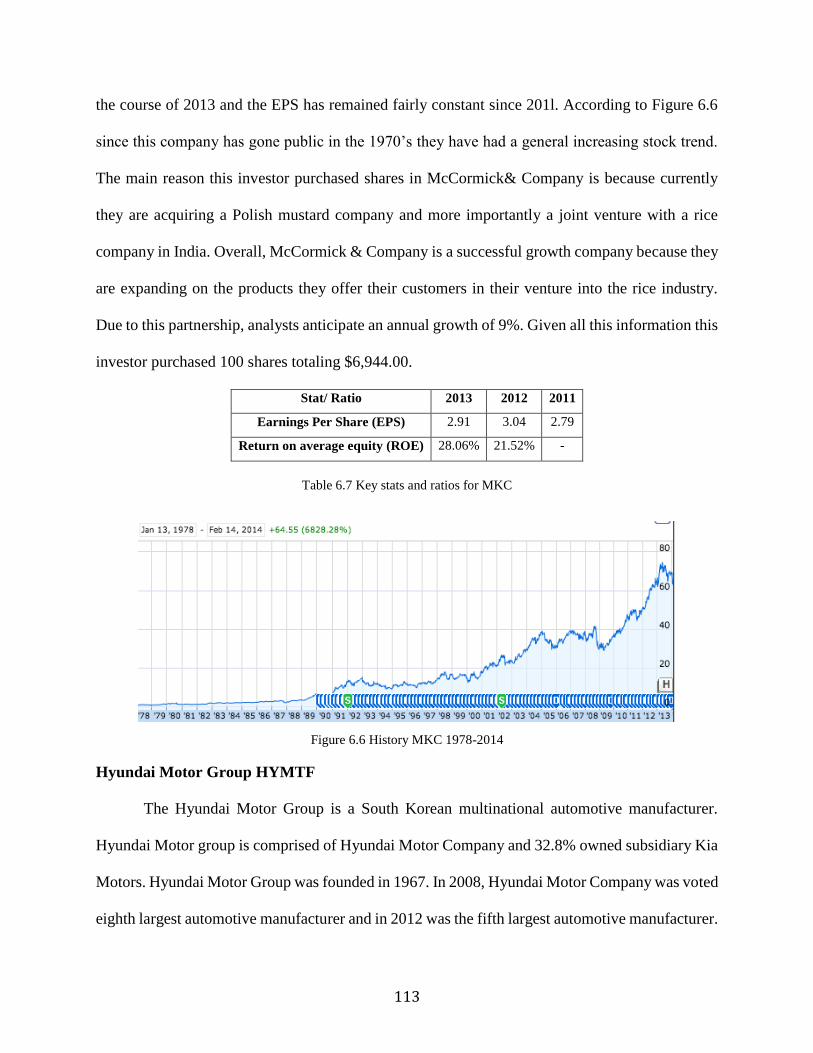
113
the course of 2013 and the EPS has remained fairly constant since 201l. According to Figure 6.6
since this company has gone public in the 1970’s they have had a general increasing stock trend.
The main reason this investor purchased shares in McCormick& Company is because currently
they are acquiring a Polish mustard company and more importantly a joint venture with a rice
company in India. Overall, McCormick & Company is a successful growth company because they
are expanding on the products they offer their customers in their venture into the rice industry.
Due to this partnership, analysts anticipate an annual growth of 9%. Given all this information this
investor purchased 100 shares totaling $6,944.00.
Stat/ Ratio 2013 2012 2011
Earnings Per Share (EPS) 2.91 3.04 2.79
Return on average equity (ROE) 28.06% 21.52% -
Table 6.7 Key stats and ratios for MKC
Figure 6.6 History MKC 1978-2014
Hyundai Motor Group HYMTF
The Hyundai Motor Group is a South Korean multinational automotive manufacturer.
Hyundai Motor group is comprised of Hyundai Motor Company and 32.8% owned subsidiary Kia
Motors. Hyundai Motor Group was founded in 1967. In 2008, Hyundai Motor Company was voted
eighth largest automotive manufacturer and in 2012 was the fifth largest automotive manufacturer.

114
In 2012, the Company sold over 4.4 million vehicles and combined with Kia Motors sales equaled
7.12 million. Hyundai Motor Company employs approximately 100,000 people and their vehicles
are sold in 193 countries in 6,000 dealerships.
Over the past few years, Hyundai has had an operating profit margin of approximately
10%, which is significantly higher than it global competitors, which include Ford, General Motors,
Toyota, and Honda. Hyundai is also trading at a lower value than its competitors, which makes
this a great investment for those looking to invest in the long-term [30].
As Table 6.8 points out, ROE and EPS information for 2012 and 2011 were unavailable,
but for 2013 the high ROE suggests a good return for investors at 17.35%. Also, according to
Figure 6.7, the stock trend has been increasing since 2003. Ultimately, this investor chose to invest
in Hyundai because in the spring of 2015, Hyundai will begin selling its hydrogen fuel-cell electric
Tucson crossover available only to citizens of California. In the state of California there will be
nine hydrogen-refueling stations. Hyundai estimates each Tucson will be able to get 300 miles per
hydrogen gas tank. Customers can lease one of these vehicles for 36-months for a price of $2,999
down and $499 a month, which includes unlimited hydrogen tanks [2]. Overall, Hyundai motor
company has built up a positive image in the automotive industry with the reliability of their cars
and in the future this company will continue to grow as they venture into alternative ways to fuel
their vehicles, which will be offered to their customers at a fair price. Given this information this
investor purchased 481 shares totaling $25,026.81.
Stat/ Ratio 2013 2012 2011
Earnings Per Share (EPS) 0.31 - -
Return on average equity (ROE) 17.35% - -
Table 6.8 Key stats and ratios for HYMTF

115
Figure 6.7 History HYMTF 2003-2014
6.3 Results and Discussion
On March 7th, this investor sold all of their stocks, since the stock market simulation had
ended. This investor made of profit of $57,238.29, which is a 57.59% gain since their initial
investment.
Date Symbol Buy/
Sell Price Shares
Net Cost/
Proceeds
Profit/
Loss
Total
Cash
Total
Profit
12/02/13 100,000
12/02/14 IRBT Buy 32.08 780 $25,032.40 74,967.60
12/02/13 FCEL Buy 1.37 20,000 $27,410.00 47,557.60
12/9/13 BREW Buy 16.03 500 $8,025.00 39,532.60
01/27/14 HYMTF Buy 52.01 481 $25,026.81 14,505.79
01/27/14 DCI Buy 40.87 170 $6,957.90 7,547.89
01/27/14 MKC Buy 69.34 100 $6,944.00 603.89
Table 6.9 Purchase Summary (Includes $10 commission fee per trade)
Date Symbol Buy/
Sell Price Shares
Net Cost/
Proceeds
Profit/
Loss
Total
Cash
Total
Profit
03/07/14 IRBT Sell 43.35 780 $33,813.00 8,780.6 34,416.89 8,780.6
03/07/14 FCEL Sell 3.53 20,000 $70,600.00 43,190.0 105,016.60 51,970.6
03/07/14 BREW Sell 15.97 500 $7,975.00 (50.00) 112,991.60 51,920.6
03/07/14 HYMTF Sell 62.80 481 $30,206.80 5,180.0 143,198.40 57,100.6
03/07/14 DCI Sell 43.18 170 $7,340.60 382.7 150,539.00 57,483.3
03/07/14 MKC Sell 66.99 100 $6,699.00 (245.00) 151,238.00 57,238.29
Table 6.10 Sell Summary (Includes $10 commission fee per trade)

116
The most successful stock this investor chose to invest in was FCEL. During the last week
of the simulation, FCEL’s stock value increased by 18.06% and since this investor invested a
majority of their portfolio in FCEL, they were able to make a 157.7% return off their initial
investment. FuelCell Energy Inc sells fuel cells that demand a high price, typically in the millions
of dollars. So, when FuelCell Energy Inc sells their product they acquire a long-term customer,
thus their stock value will jump drastically and will be sustained over a long period of time. This
is the reason for the jump that occurred during the last week of the simulation.
The only stocks that this investor lost a small amount of money on were BREW and MKC
however, if this simulation were to continue, this investor believes they would see a large return
on FCEL and MKC. Overall, the key to successful growth investing is not just looking at statistical
data; rather, an investor needs to do research on the company to determine if they are going to be
doing something profitable in the future. The most important factor is to ensure that a company
has ethical business practices because that is how many growth investors lose a majority of their
profile.
Growth investing is a high risk and high return form of investing. To make the largest
profit, a growth investor should not invest in stocks that are widely publicized. For example, at
the start of this simulation Tesla was widely publicized among many stock market analysts.
However, this investor chose to invest in Hyundai instead. Hyundai has a great reputation and is
debuting a fuelcell-powered car in 2015. This investor was able to buy Hyundai Motor Companies
stock cheap and then wait for the large spike. Whereas, the cost for Tesla was already commanding
a high market value, over $200.00 a share, so there was little room for growth in this 10-week
simulation. In addition, this investor used their knowledge of Chemical Engineering to determine
that investing in an all-electric car is not as environmentally friendly as people think. Since

117
electricity must be generated, which produces a fair amount of pollution. In a fuel cell powered
car pure hydrogen is extracted from natural gas and there is little to no pollution while the car
operates. Based off their knowledge and research, this investor predicted that once Hyundai and
other motor companies introduce their fuel cell powered cars onto the market the value of Tesla
will plummet.
There are two major strategies to utilize when investing in the stock market over a long-
duration of time. The two approaches are the “growth-oriented” and “value-oriented”. A growth-
oriented investor seeks out companies, which have earning that are going to rapidly increase each
year. Investors who are value-oriented are less focused on the rapid growth of a company, but
instead on the stock value that appears to be a bargain. Both of these strategies have been proven
to be effective in investing in the stock market. Growth investors can make a tremendous return
by determining companies that are going to experience exponential growth. Similarly, a value
investor can identify a company that either has just started being traded publically or has had a
minor setback, thus purchasing shares at a discounted price.
The major risk with a growth-oriented approach is that investors can find themselves
paying top dollar for companies that could end up not growing at the rate anticipated, which can
result in a major loss in the initial investment. Similarly, the major-risk with value investing in that
a stock might seem like a bargain, but the stock could potentially continue to decrease and could
be permanent. Fortunately, during the course of this simulation, this investor did not run into this
problem.
This investor began the simulation using strictly a growth-oriented approach, however over
the course of this simulation this investor ended up using a strategy that blends both growth and
value investing. This strategy is called growth-at-a-reasonable-price (GARP). This method offers

118
security with the risks associated with growth and value investing. As seen in table 6.10, this
investor invested in both growth companies that came with a high stock value and value
companies, which appeared to be good deals.
Growth Stocks Value Stocks
DCI FCEL
MKC BREW
HYMTF IRBT
Table 6.11 Growth and Value Companies
An example, of how this investor used the GARP strategy was when this investor wanted
to purchase stocks in Hyundai during Week 1. However, in December the value of HYMTF was
$60.00. This investor determined that is price was too expensive, so they would wait until the price
went down. Eventually, at the end of January the Hyundai stock value hit a low at $52.01. At this
price this investor felt this stock was a bargain and had the promise of strong growth in the future.
The major benefit of investing in the long-term is that it is much easier to predict what will
cause a company’s stock to go up or down. In looking at the history of companies being traded on
the stock market, in the long run the stock market value increases as companies continue to
establish themselves as well as national and global economies continue to grow.
The challenge in growth investing is determining which companies will offer large returns
in the future. Ultimately, this investor looked for companies that had a combination of high quality
standards with promise of economic growth. The most important factors to consider when
evaluating a company are if a company has a high degree of pricing power. As a long-term
investor, you want to invest in companies that are the price setters not matchers. Secondly, a
company that requires a high degree of repeat revenues also shows promise of being a growth
company. In this case this investor invested in Donaldson Company, Inc, which the market leaders
in air filters and also requires repeat customers as air filters need replacing.
119
Patience is a prerequisite for any long-term investor. In this beginning of this simulation
this investor invested $25,032.40 in iRobot IRBT. All the necessary research was conducted and
this company was considered to offer a large return in the future. However, at the beginning of this
simulation, this investor lost $680.80 and over the subsequent weeks made an insignificant profit.
However, during week ten IRBT made a profit of 9,740.00 or 38.91% overall return. Throughout
this simulation this investor continually questioned whether iRobot was a good company to invest
in, but this investor remained confident in their research.
Overall, the most important aspect of long-term investing is the ability to be patient.
Sometimes an investor can purchase a stock at the wrong time for example after the stock is
purchased the value plummets. However, a growth investor needs to remember that a stock might
go down after it is purchased, but given time and a significant amount of research it will ultimately
increase thus creating a large profit. In the long run, a company’s stock price will increase if the
earning of the company increase.
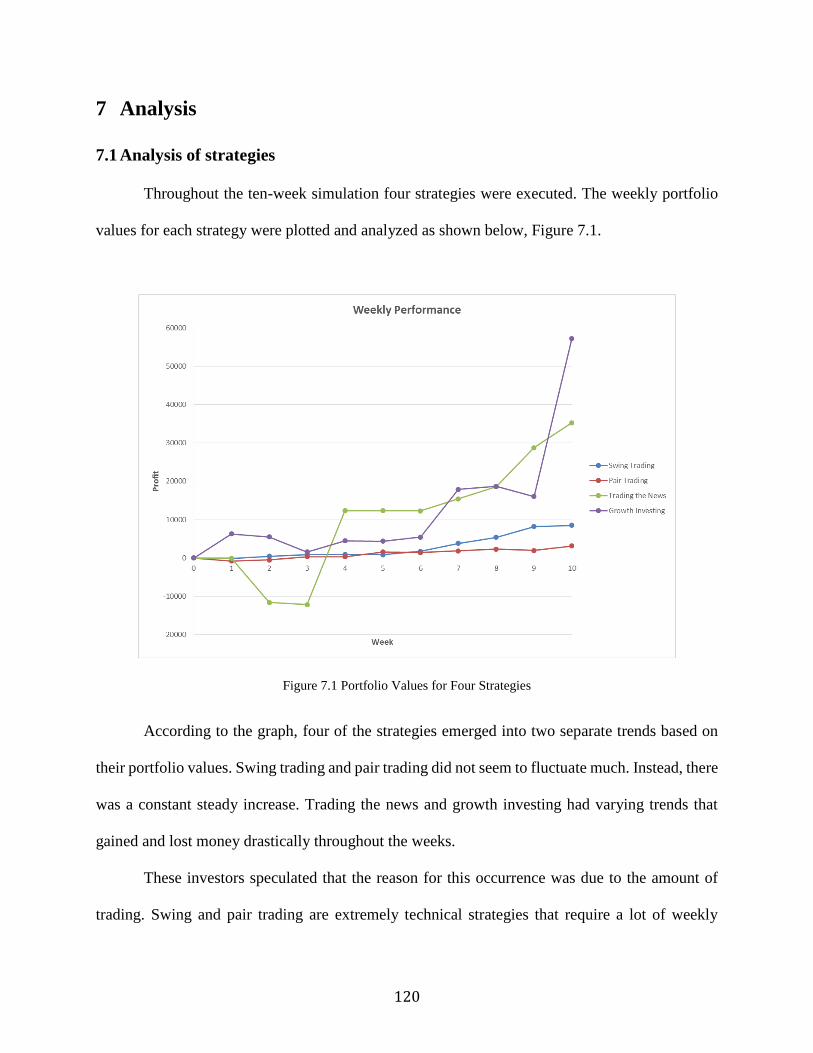
120
7 Analysis
7.1 Analysis of strategies
Throughout the ten-week simulation four strategies were executed. The weekly portfolio
values for each strategy were plotted and analyzed as shown below, Figure 7.1.
Figure 7.1 Portfolio Values for Four Strategies
According to the graph, four of the strategies emerged into two separate trends based on
their portfolio values. Swing trading and pair trading did not seem to fluctuate much. Instead, there
was a constant steady increase. Trading the news and growth investing had varying trends that
gained and lost money drastically throughout the weeks.
These investors speculated that the reason for this occurrence was due to the amount of
trading. Swing and pair trading are extremely technical strategies that require a lot of weekly

121
transactions. However, trading the news and growth investing are not trading intensive strategies.
The amount of trading can result in a strategy being a short-term strategy or a long-term strategy.
Short-term strategies demand rigorous trading and long-term strategies do not. This concept of
these two different trends was explored further in order to advance the understanding of the stock
market and the four strategies.
7.2 Comparing Swing Trading and Pair Trading
Swing trading and pair trading share many common features. The most obvious one is that
they are short-term investments based on technical analysis. Due to the nature of these strategies,
swing traders and pair traders would buy and hold on to a stock from several days to two or three
weeks. Therefore, both of these strategies require traders to continually watch their stocks and
frequently conduct transactions, which provides traders more control over their stocks. Because
the performance of these two strategies depends solely on the statistics and technical analysis,
swing traders and pair traders could achieve steady profit despite the status of the economy.
Another common feature of swing trading and pair trading is that both of these strategies
do not require extensive research before making a trade. Technical analysis is typically
independent of financial performance, so swing traders and pair traders are able to trade any stock
without fully knowing about the company’s economic status as long as an appropriate trend or
signals appear. As a result, they could make quick money if they execute their trades properly.
However, even though there are similarities, swing trading and pair trading are quite
different. One of the main differences is that a swing trader would look at several technical tools
such as volume, simple moving averages, and candlestick charts whereas a pair trader uses only
price ratio charts. Because the two strategies require different technical tools, the trading of each
strategy is different.

122
Since pair trading and swing trading have different trading approaches, the risk for each
strategy is different. As demonstrated in the chapter four, the pair trader simultaneously traded two
historically highly correlated stocks. Manipulating a pair of stocks by this approach, the pair trader
could hedge against the risk by summing up the profit from one stock and the loss by the other.
Therefore, pair traders usually do not expect considerable decline in their portfolio. On the other
end of the spectrum, swing traders buy low and sell high at the entry and exit signals depicted by
technical analysis. Unlike pair traders, swing traders will only pay attention to the entry and exit
signals. Thus, this allows the swing trader to focus on the important price points in the stock
market. Since, these entry and exit signals are not foolproof and there is no way of hedging against
risk, it makes swing trading riskier than pair trading.
As with all investing, there are different returns associated with different risks. Since pair
trading is less risky than swing trading, the return for pair trading is less than the return of swing
trading.
7.3 Comparing Trading the News and Growth Investing
Trading the news and growth trading are similar strategies because they both require
extensive research on the socio-economic status of each company to determine if it is a solid
investment. News articles were utilized for both strategies to determine companies that will yield
a large return off of the initial investment. Due to the reliance on news articles, growth and trading
the news investors hold onto their stock over a relatively long duration of time.
Both strategies are great for students just out of college or people in the workforce who do
not have time to devout to buying and trading stocks daily. These methods are very simple and do
not require technical mathematical equations to try and predict how a stock will perform. Rather,
these strategies require simple reliable research and infrequent monitoring.

123
The major difference between these two strategies is the duration of time. A growth
investor seeks out stock that will earn them a large profit in the next ten to fifteen years whereas
an investor trading the news looks for any rapid increase in stock value. Another difference is a
growth investor looks for specific qualities in a company to help determine if in the future this
company will be categorized as a growth company. Some characteristics of a growth company
include: outstanding professional management ability, high product sales growth, market
dominance, and products serving long-term customers. An investor trading the news will invest in
a company when the companies’ accomplishments begin to trend on the Internet. Then, once the
company begins to lose popularity the investor will sell their stock. Certain news articles make
this decision easier for the investor. If a lot of good press comes out about a company, then the
investor is more inclined to purchase said stock. If the company is doing something that makes the
news in a negative way, the investor quickly sells.
Growth investing is a very useful strategy for recent college graduates beginning to save
for retirement and it is also a good strategy for people who don’t want a labor-intensive portfolio.
All growth investing requires is a little research and lot of patience and hopefully an investor can
make a large return. Trading the news requires a little more attention to the stock market than
growth investing. This also means it can be used more in the short term. If an investor wants to see
a return on investment relatively quickly then trading the news might be a good idea. That way the
investor can watch a news story unfold about a company and invest in that company accordingly.
Growth investing and trading the news are much riskier investments compared to swing
trading and pair trading. These strategies do not have complex methods to ensure that the portfolio
will not lose value and it was not mathematically based. Instead of relying on formulas, these
strategies are very dependent upon the economy at the time. When the economy fluctuates, the

124
value of the portfolio could drastically change. During the simulation, the economy was relatively
stable. This is what helped these two investors make a larger profit. The portfolios could have been
much less successful if the economy was bullish. The two strategies’ reliance on the economy
makes the strategies riskier. However, in this simulation growth investing and trading the news
were able to make a significantly larger return off of their initial profit. This experiment supports
the notion that an investor can make a larger return off of a riskier investment.

125
8 Conclusion
At the conclusion of this simulation, a few interesting details became apparent to the
investors. First, the investors realized that each strategy seemed to be coherent with the personality
of that investor. Two of the investors in the group preferred technical analysis, so they gravitated
towards swing trading and pair trading, since these strategies are highly dependent on statistics.
The other two investors’ were more interested in the “big-picture”, which made them more inclined
to choose a research based approach, such as trading the news and growth investing. When it
comes to investing in the stock market there are many options an investor can utilize. The best
method for one to invest in the stock market is a method that the investor feels they will be able to
use effectively.
One of the other factors that the investors determined to help an investor pick a strategy
was the amount of time that one was willing to commit to their portfolio. If an investor has a lot
of time to commit to investing, a more labor-intensive strategy, such as swing investing, can be
utilized. The amount of money needed to invest is another aspect when deciding upon a strategy.
An investor who has more money and is willing to wait a long duration of time to make a profit
might choose growth investing, since it is a long-term strategy. In addition, interest in the economy
can influence choosing a specific strategy. Since the economy affects the stock price, investing in
riskier stocks should be dependent on the state of the economy. These factors are important to
consider because the best strategy to choose when investing is one that suits the investor.

126
References
1. 17 Triple A Stocks to Buy. (n.d.). InvestorPlace RSS. Retrieved April 6, 2014, from
http://investorplace.com/2014/01/17-triple-a-stocks-to-buy-acet-ael-anik-br-dl-evac-
feng-fss-hii-prx-qcor-qihu-sfun-snts-stz-ubnt-yy-3/
2. 2015 Hyundai Tucson Fuel Cell | Hydrogen-Powered Vehicle | Hyundai. (n.d.). 2015 Hyundai
Tucson Fuel Cell | Hydrogen-Powered Vehicle | Hyundai. Retrieved April 11, 2014,
from https://www.hyundaiusa.com/tucsonfuelcell/
3. 3 Capital Markets Stocks to Buy Now. (n.d.). InvestorPlace RSS. Retrieved April 6, 2014,
from http://investorplace.com/2014/02/3-capital-markets-stocks-to-buy-now-lm-tcrd-
arcc/#.UwEuek2x670
4. 5 Best Sectors to Watch This Week. (n.d.). InvestorPlace RSS. Retrieved April 6, 2014, from
http://investorplace.com/2014/01/5-best-sectors-to-watch-this-week-vips-away-ostk-
gent-lgnd-insy-mga-vc-dw-hii-atk-ba-sb-dac-nm/#.Uu6nhE2x670
5. Analyzing Chart Patterns: Triangles. (n.d.). Investopedia. Retrieved April 6, 2014, from
http://www.investopedia.com/university/charts/charts5.asp
6. Anheuser-Busch.com | Homepage. (n.d.). AnheuserBuschcom Home Comments. Retrieved
April 6, 2014, from http://www.anheuser-busch.com/
7. Anika Therapeutics Announces Date of Fourth-Quarter and Year-End 2013 Financial
Results Conference Call. (n.d.). MarketWatch. Retrieved April 6, 2014, from
http://www.marketwatch.com/story/anika-therapeutics-announces-date-of-fourth-
quarter-and-year-end-2013-financial-results-conference-call-2014-02-12
8. BAC Profile. (n.d.). Yahoo Finance. Retrieved April 6, 2014, from
http://finance.yahoo.com/q/pr?s=BAC+Profile

127
9. Biotech Top Gainers – Cambrex Corporation (NYSE:CBM), Anika Therapeutics, Inc.
(NASDAQ:ANIK), BIND Therapeutics Inc (NASDAQ:BIND), Oncomed
Pharmaceuticals Inc (NASDAQ:OMED) | Gaining Green. (n.d.). Gaining Green
Biotech Top Gainers Cambrex Corporation NYSECBM Anika Therapeutics Inc
NASDAQANIK BIND Therapeutics Inc NASDAQBIND Oncomed Pharmaceuticals Inc
NASDAQOMED Comments. Retrieved April 6, 2014, from
http://www.gaininggreen.com/biotech-top-gainers-cambrex-corporation-nysecbm-anika-
therapeutics-inc-nasdaqanik-bind-therapeutics-inc-nasdaqbind-oncomed-
pharmaceuticals-inc-nasdaqomed/127402/
10. Bristol-Myers Squibb Co: NYSE:BMY quotes & news - Google Finance. (n.d.). Bristol-
Myers Squibb Co: NYSE:BMY quotes & news - Google Finance. Retrieved April 6,
2014, from https://www.google.com/finance?q=NYSE%3ABMY&ei=B-
sIU_LjGKiw6gG2GQ
11. Bristol-Myers Squibb Given Buy Rating at TheStreet (BMY). (n.d.). WKRB News RSS.
Retrieved April 6, 2014, from http://www.wkrb13.com/markets/263090/bristol-myers-
squibb-given-buy-rating-at-thestreet-bmy/
12. Bristol-Myers Squibb:Â Our Company. (n.d.). Bristol-Myers Squibb:Â Our Company.
Retrieved April 6, 2014, from http://www.bms.com/ourcompany/Pages/home.aspx
13. C Profile. (n.d.). Yahoo Finance. Retrieved April 6, 2014, from
http://finance.yahoo.com/q/pr?s=C+Profile
14. CVX Profile. (n.d.). Yahoo Finance. Retrieved April 6, 2014, from
http://finance.yahoo.com/q/pr?s=CVX+Profile

128
15. Can Bristol-Myers Squibb Beat the S&P in 2014?. (n.d.). Can Bristol-Myers Squibb Beat the
S&P in 2014?. Retrieved April 6, 2014, from
http://www.fool.com/investing/general/2014/02/21/can-bristol-myers-squibb-beat-the-
sp-in-2014.aspx
16. Craft Brew Alliance. (n.d.). Craft Brew Alliance. Retrieved April 6, 2014, from
http://craftbrew.com/
17. F Profile. (n.d.). Yahoo Finance. Retrieved April 6, 2014, from
http://finance.yahoo.com/q/pr?s=F+Profile
18. FISV Profile. (n.d.). Yahoo Finance. Retrieved April 6, 2014, from
http://finance.yahoo.com/q/pr?s=FISV+Profile
19. FTI Profile. (n.d.). Yahoo Finance. Retrieved April 6, 2014, from
http://finance.yahoo.com/q/pr?s=FTI+Profile
20. GALE Profile | Galena Biopharma, Inc. Stock - Yahoo! Finance. (n.d.). GALE Profile |
Galena Biopharma, Inc. Stock - Yahoo! Finance. Retrieved April 6, 2014, from
http://finance.yahoo.com/q/pr?s=GALE
21. GAS Profile. (n.d.). Yahoo Finance. Retrieved April 6, 2014, from
http://finance.yahoo.com/q/pr?s=GAS+Profile
22. GM Profile. (n.d.). Yahoo Finance. Retrieved April 6, 2014, from
http://finance.yahoo.com/q/pr?s=GM+Profile
23. Galena Biopharma Enrolls First Patient in GALE-301 (Folate Binding Protein (FBP)) Cancer
Immunotherapy Phase 2 Clinical Trial in Ovarian Cancer. (2014, January 7).
(NASDAQ:GALE). Retrieved April 6, 2014, from
http://investors.galenabiopharma.com/releasedetail.cfm?ReleaseID=817420

129
24. Galena Press Release. (n.d.). Galena Biopharma. Retrieved April 6, 2014, from
http://investors.galenabiopharma.com/releasedetail.cfm?releaseid=818783
25. Galena: A Pipeline Rich For Investors. (n.d.). Galena Biopharma Inc (GALE):. Retrieved
April 6, 2014, from http://seekingalpha.com/article/1870351-galena-a-pipeline-rich-for-
investors?source=google_news
26. General Dynamics Gets Shot at $12 Billion U.S. Ship Program. (n.d.). Bloomberg Business
Week. Retrieved April 6, 2014, from http://www.businessweek.com/news/2014-02-
12/general-dynamics-gets-shot-at-12-billion-u-dot-s-dot-ship-program
27. Home - Fuel Cell Energy. (n.d.). Home - Fuel Cell Energy. Retrieved April 6, 2014, from
http://www.fuelcellenergy.com/
28. How to Identify Support and Resistance Levels on a Stock Chart. (n.d.). How to Identify
Support and Resistance Levels on a Stock Chart. Retrieved April 6, 2014, from
http://www.swing-trade-stocks.com/support-and-resistance.html
29. How to Interpret Volume on a Stock Chart. (n.d.). Stock Chart Volume. Retrieved April 6,
2014, from http://www.swing-trade-stocks.com/stock-chart-volume.html
30. Hyundai Motor Company. (2014, December 4). Wikipedia. Retrieved April 13, 2014, from
http://en.wikipedia.org/wiki/Hyundai_Motor_Company
31. Huntington Ingalls Industries Inc: NYSE:HII quotes & news - Google Finance. (n.d.).
Huntington Ingalls Industries Inc: NYSE:HII quotes & news - Google Finance.
Retrieved April 6, 2014, from
https://www.google.com/finance?q=HII&ei=skTlUviEG6GK6gHj5QE
32. Introduction To Swing Trading. (n.d.). Investopedia. Retrieved April 6, 2014, from
http://www.investopedia.com/articles/trading/02/101602.asp

130
33. KO Profile. (n.d.). Yahoo Finance. Retrieved April 6, 2014, from
http://finance.yahoo.com/q/pr?s=KO+Profile
34. KR Profile. (n.d.). Yahoo Finance. Retrieved April 6, 2014, from
http://finance.yahoo.com/q/pr?s=KR+Profile
35. Kona Brewing Company | Just another place with sand between its toes. (n.d.). Kona
Brewing Company | Just another place with sand between its toes. Retrieved April 6,
2014, from http://konabrewingco.com/
36. Official iRobot site - Roomba robot vacuum cleaner and robots for the home - iRobot. (n.d.).
Official iRobot site - Roomba robot vacuum cleaner and robots for the home - iRobot.
Retrieved April 6, 2014, from http://www.irobot.com/global/en/home.aspx
37. PEP Profile. (n.d.). Yahoo Finance. Retrieved April 6, 2014, from
http://finance.yahoo.com/q/pr?s=PEP+Profile
38. Pairs Trading: Correlation. (n.d.). Investopedia. Retrieved April 6, 2014, from
http://www.investopedia.com/university/guide-pairs-trading/pairs-trading-
correlation.asp
39. Redhook Brewery. (n.d.). Redhook. Retrieved April 6, 2014, from http://redhook.com/
40. SWI Company Profile. (n.d.). Reuters. Retrieved April 6, 2014, from
http://www.reuters.com/finance/stocks/companyProfile?rpc=66&symbol=SWI
41. SWI: SolarWinds a Virtual Winner for Investors. (n.d.). InvestorPlace RSS. Retrieved April
6, 2014, from http://investorplace.com/2014/01/solarwinds-swi-goog-stocks-to-buy/
42. Samuel Adams® - For The Love of Beer. (n.d.). Samuel Adams® - For The Love of Beer.
Retrieved April 6, 2014, from http://www.samueladams.com/
131
43. Schonberger, J. (2012, May 31). 5 Stocks From the New Class of Rising Blue Chips.
Kiplinger. Retrieved April 6, 2014, from http://m.kiplinger.com/article/investing/T052-
C008-S001-5-stocks-from-the-new-class-of-rising-blue-chips.html
44. Shell, A. (2013, October 28). This 2013 stock market rally is a team effort. USA Today.
Retrieved April 6, 2014, from
http://www.usatoday.com/story/money/markets/2013/10/28/stock-rally-broadest-since-
2003/3287109
45. SolarWinds Stock Rating Upgraded by Zacks (SWI). (n.d.). WKRB News RSS. Retrieved
April 6, 2014, from http://www.wkrb13.com/markets/255026/solarwinds-stock-rating-
upgraded-by-zacks-swi/
46. SolarWinds boosts revenue, profits flat in Q4. (n.d.). Widgets RSS. Retrieved April 6, 2014,
from http://www.bizjournals.com/austin/blog/techflash/2014/02/solarwinds-boosts-
revenue-profits-flat-in-q4.html
47. SolarWinds insider flips stock options. (n.d.). Widgets RSS. Retrieved April 6, 2014, from
http://www.bizjournals.com/austin/blog/techflash/2014/02/solarwinds-insider-flips-
stock-options.html
48. SolarWinds: Moving In The Right Direction As Revenue Growth Accelerates. (n.d.).
SolarWinds Inc (SWI) news:. Retrieved April 6, 2014, from
http://seekingalpha.com/article/2026261-solarwinds-moving-in-the-right-direction-as-
revenue-growth-accelerates
49. Stock Report: "Anika Therapeutics, Inc." (ANIK) Report Updated: Mar 31, 2014 | Print This
Page. (n.d.). ANIK. Retrieved April 6, 2014, from
http://navelliergrowth.investorplace.com/portfolio-grader/stock-report.html?t=ANIK

132
50. T Profile. (n.d.). Yahoo Finance. Retrieved April 6, 2014, from
http://finance.yahoo.com/q/pr?s=T+Profile
51. THL Credit Senior Loan Fund (TSLF) Ex-Dividend Date Scheduled for February 14, 2014.
(n.d.). NASDAQ.com. Retrieved April 6, 2014, from http://www.nasdaq.com/article/thl-
credit-senior-loan-fund-tslf-exdividend-date-scheduled-for-february-14-2014-cm326271
52. THL Credit: Falling Yields And Growing Dividends?. (n.d.). THL Credit, Inc. (TCRD)
news:. Retrieved April 6, 2014, from http://seekingalpha.com/article/2026051-thl-credit-
falling-yields-and-growing-dividends
53. Technical Analysis: Moving Averages. (n.d.). Investopedia. Retrieved April 6, 2014, from
http://www.investopedia.com/university/technical/techanalysis9.asp
54. The Secret To Finding Profit In Pairs Trading. (n.d.). Investopedia. Retrieved April 6, 2014,
from http://www.investopedia.com/articles/trading/04/090804.asp
55. VZ Profile. (n.d.). Yahoo Finance. Retrieved April 6, 2014, from
http://finance.yahoo.com/q/pr?s=VZ+Profile
56. WM Profile. (n.d.). Yahoo Finance. Retrieved April 6, 2014, from
http://finance.yahoo.com/q/pr?s=WM+Profile
57. Welcome to Bankrate. (n.d.). Mortgage Rates Credit Cards Refinance Home CD Rates by
Bankrate.com. Retrieved April 6, 2014, from http://www.bankrate.com
58. Widmer Brothers Brewing. (n.d.). Widmer Brothers Brewing. Retrieved April 6, 2014, from
http://widmerbrothers.com/
59. Williams, S. (n.d.). Why Navidea Biopharmaceuticals Inc. Shares Soared. DailyFinance.com.
Retrieved April 6, 2014, from http://www.dailyfinance.com/2013/12/10/why-navidea-
biopharmaceuticals-inc-shares-soared/

133
60. XOM Profile. (n.d.). Yahoo Finance. Retrieved April 6, 2014, from
http://finance.yahoo.com/q/pr?s=XOM+Profile
61. Zacks Investment Research. (n.d.). U.K. CAA Demands Upgrades on Faulty Copters.
Retrieved April 6, 2014, from http://www.zacks.com/stock/news/123984/uk-caa-
demands-upgrades-on-faulty-copters