project no. 20-7/305 copy no. analysis of new highway
TRANSCRIPT

Project No. 20-7/305 Copy No. __
ANALYSIS OF NEW HIGHWAY LIGHTING
TECHNOLOGIES
FINAL REPORT
Prepared for National Cooperative Highway Research Program
Transportation Research Board of
The National Academies
TRANSPORTATION RESEARCH BOARD OF THE NATIONAL ACADEMIES
PRIVILEGED DOCUMENT
This report, not released for publication, is furnished only for review to members of or participants in the work of the CRP. This report is to be regarded as fully privileged, and
dissemination of the information included herein must be approved by the CRP.
John D. Bullough, Leora C. Radetsky Lighting Research Center, Rensselaer Polytechnic Institute
Troy, NY
August 2013

ii
ACKNOWLEDGMENT OF SPONSORSHIP
This work was sponsored by the American Association of State Highway and Transportation Officials, in cooperation with the Federal Highway Administration, and was conducted in the National Cooperative Highway Research Program, which is administered by the Transportation Research Board of the National Academies.
DISCLAIMER
This is an uncorrected draft as submitted by the research agency. The opinions and conclusions expressed or implied in the report are those of the research agency. They are not necessarily those of the Transportation Research Board, the National Academies, or the program sponsors.

iii
ANALYSIS OF NEW HIGHWAY LIGHTING
TECHNOLOGIES
FINAL REPORT
Prepared for National Cooperative Highway Research Program
Transportation Research Board of
The National Academies
TRANSPORTATION RESEARCH BOARD OF THE NATIONAL ACADEMIES
PRIVILEGED DOCUMENT
This report, not released for publication, is furnished only for review to members of or participants in the work of the CRP. This report is to be regarded as fully privileged, and
dissemination of the information included herein must be approved by the CRP.
John D. Bullough, Leora C. Radetsky Lighting Research Center, Rensselaer Polytechnic Institute
Troy, NY
August 2013

iv
CONTENTS
ACKNOWLEDGMENTS .............................................................................................................v
ABSTRACT .................................................................................................................................. vi CHAPTER 1 Background ............................................................................................................1 CHAPTER 2 Research Approach ...............................................................................................2 CHAPTER 3 Findings and Applications ....................................................................................3 Research Review and Synthesis 3 Comparison Among New and Conventional Lighting Technologies 16 Visual Performance Analyses 46 CHAPTER 4 Conclusions, Recommendations and Suggested Research ..............................53 Conclusions 53 Recommendations 53 Suggested Research 55 REFERENCES .............................................................................................................................56

v
ACKNOWLEDGMENTS The authors acknowledge sponsorship of this research from the National Cooperative Highway Research Program (NCHRP) of the Transportation Research Board. B. Ray Derr served as the Project Manager. Helpful input was provided by members of the NCHRP Project 20-7/305 panel, and by Erin Ryan of the Lighting Research Center, Rensselaer Polytechnic Institute.
vi
ABSTRACT
This report documents and presents the results from a study of roadway lighting technologies including the use of light emitting diode (LED) sources and other light source types. A review of published research and case studies of new lighting technologies, as well as a comparison of roadway luminaire photometric performance, suggests that LED technologies, while still rapidly developing, are viable for specifying energy efficient and visually effective roadway lighting systems. New metrics such as luminaire system application efficacy can allow engineers to make informed decisions about the roadway lighting system configurations (including luminaire selection, spacing and mounting height) that will lead to the most economical system performance. Research also suggests that a number of other metrics such as mesopic photometry, brightness perception, and spectral sensitivity for discomfort glare could assist the designer in selecting among new lighting technologies, most of which have greater short-wavelength spectral output than conventional lighting mainly using high pressure sodium lamps. Evaluations of visual performance and visibility coverage areas from roadway lighting may also be of use in identifying appropriate adaptive control strategies for roadway lighting.

1
CHAPTER 1 BACKGROUND
The objective of this research is to evaluate the potential and proper application of light emitting diode (LED) lighting technology and if applicable, other new roadway lighting technologies, to determine if and what additional research is required to properly establish guidance for these technologies. In the event the research establishes that sufficient acceptable research has already been performed to provide guidance on the use of LED lighting or other alternate lighting technology, the research shall provide design guidance.
At present, the primary light source used for roadway lighting in North America is the
high pressure sodium (HPS) lamp. This source has relatively long operating life, high lumen maintenance (i.e., the ability to maintain its initial light output throughout the course of its operating life), low cost, and relatively mediocre color characteristics (i.e., poor color rendering and “yellow” color appearance) relative to other, “white” light sources such as metal halide (MH), fluorescent induction, electrodeless high-intensity discharge (HID), and LED sources.
The present report for National Cooperative Highway Research Program (NCHRP)
Project 20-7/Task 305, "Analysis of New Highway Lighting Technologies," documents the research undertaken by the project team to provide current information about the use of new lighting technologies for roadway illumination, and to provide comparisons among these technologies. Preliminary recommendations for new metrics by which lighting systems can be evaluated are also provided.

2
CHAPTER 2 RESEARCH APPROACH
The project activities, documented in the present report, consisted of the following tasks:
• A review of technological characteristics, research and evaluation investigations, and economic analyses of new roadway lighting technologies in comparison to conventional lighting systems and approaches.
• Technical comparisons of different light source technologies in terms of photometric performance, using existing and new metrics.
• Descriptions and definitions of new roadway lighting metrics suggested to make meaningful comparisons among new lighting technologies.
The results of these activities are primarily contained within the subsequent chapters,
with recommendation for application to practice and suggestions for future research.

3
CHAPTER 3 FINDINGS AND APPLICATIONS
This chapter summarizes the primary research activities undertaken for NCHRP Project 20-7/Task 305. A review and synthesis of existing and previously published information and data were used to inform the technology comparisons among conventional and new lighting technologies and to identify gaps in research and knowledge. RESEARCH REVIEW AND SYNTHESIS
In this section, reports and published accounts of technical studies (laboratory and field studies), economic cost comparisons, and full-scale lighting demonstrations are reviewed and summarized. The findings from this review have subsequently been synthesized into the comparative matrix in the following section of the present report. Comparative Matrix of Light Source Performance Characteristics
Table 1 compares several light sources in terms of their photometric, energy and other performance characteristics. This matrix also includes application notes based on the findings reviewed in the review of research and technical information included in this chapter.
TABLE 1 Light Source Performance Characteristics and Application Notes
Light
Source
Typical
Wattage
(W)
Luminous
Efficacy
(lm/W)
Correlated
Color
Temp. (K)
Color
Rendering
Index
Operating
Life (hr)
Lumen
Maint.
(%)
Application Notes
High pressure sodium
35-400 80-120 2100 22 24,000-30,000
90% • Baseline source for roadway lighting
Ceramic metal halide
70-400 60-110 2800-4200 65-90 10,000-20,000
70%-80%
• Recent developments have improved life
• Similar performance and distribution as HPS
• Potential advantage for mesopic vision
Induction fluorescent
55-200 60-90 2700-6500 70-90 60,000 80%-90%
• Similar efficacy to HPS systems
• Lower uniformity often requires shorter pole spacing
• Luminaire size may be large to provide distribution
• Potential advantage for mesopic vision

4
TABLE 1 Light Source Performance Characteristics and Application Notes (Continued) Light
Source
Typical
Wattage
(W)
Luminous
Efficacy
(lm/W)
Correlated
Color
Temp. (K)
Color
Rendering
Index
Operating
Life (hr)
Lumen
Maint.
(%)
Application Notes
Light emitting diode
55-300 70-120 3000-8000 30-90 30,000-100,000
85% • Increasing efficacy beginning to exceed HPS
• Systems often have higher uniformity than HPS and MH systems
• Rapidly decreasing cost of equipment
• Potential advantage for mesopic vision
Electrodeless high-intensity discharge*
100-1000 W
50-94 4000-6000 70-95 30,000-50,000
70%-90%
• Potential advantage for mesopic vision
*Also referred to as light emitting plasma. Laboratory Research Studies
Laboratory studies conducted since the late 1990s have confirmed three effects of the spectral distribution (color) of a light source: visual performance to peripheral or large-field objects at nighttime levels is correlated with the “mesopic” luminance of the objects in the field of view rather than the “photopic” luminance recorded by conventional light meters; the brightness of outdoor scenes illuminated by different light sources is predicted by spectral sensitivity with increased short-wavelength (“blue”) content (but not necessarily rod-stimulating content, suggesting that mesopic vision and scene brightness are controlled by different visual mechanisms); and that sensations of discomfort glare are also more sensitive to short-wavelength content of a light source, possibly indicating that discomfort glare is related to “excess brightness.” Bullough JD, Radetsky LC, Rea MS. 2011. Testing a model of scene brightness with and without objects of different colours. Lighting Research and Technology 43(2): 173-184. • Brightness responses for scale-model outdoor scenes were well predicted by a model
developed by Rea et al. (2011) regardless of whether there were colored objects such as vehicles present in the scenes, suggesting that color rendering has little to do with overall brightness perception
• Results confirmed that “white” light sources resulted in increased brightness perception relative to “yellower” sources such as high pressure sodium (HPS)
5
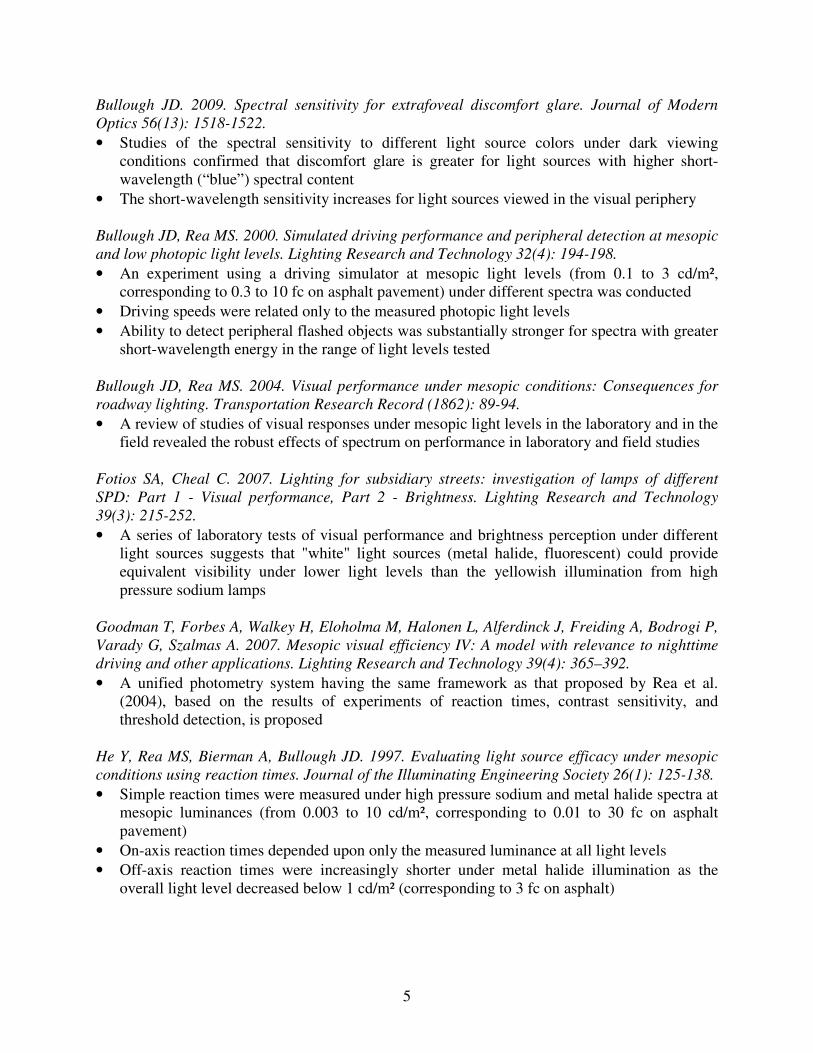
Bullough JD. 2009. Spectral sensitivity for extrafoveal discomfort glare. Journal of Modern Optics 56(13): 1518-1522. • Studies of the spectral sensitivity to different light source colors under dark viewing
conditions confirmed that discomfort glare is greater for light sources with higher short-wavelength (“blue”) spectral content
• The short-wavelength sensitivity increases for light sources viewed in the visual periphery Bullough JD, Rea MS. 2000. Simulated driving performance and peripheral detection at mesopic and low photopic light levels. Lighting Research and Technology 32(4): 194-198. • An experiment using a driving simulator at mesopic light levels (from 0.1 to 3 cd/m²,
corresponding to 0.3 to 10 fc on asphalt pavement) under different spectra was conducted • Driving speeds were related only to the measured photopic light levels • Ability to detect peripheral flashed objects was substantially stronger for spectra with greater
short-wavelength energy in the range of light levels tested Bullough JD, Rea MS. 2004. Visual performance under mesopic conditions: Consequences for roadway lighting. Transportation Research Record (1862): 89-94. • A review of studies of visual responses under mesopic light levels in the laboratory and in the
field revealed the robust effects of spectrum on performance in laboratory and field studies Fotios SA, Cheal C. 2007. Lighting for subsidiary streets: investigation of lamps of different SPD: Part 1 - Visual performance, Part 2 - Brightness. Lighting Research and Technology 39(3): 215-252. • A series of laboratory tests of visual performance and brightness perception under different
light sources suggests that "white" light sources (metal halide, fluorescent) could provide equivalent visibility under lower light levels than the yellowish illumination from high pressure sodium lamps
Goodman T, Forbes A, Walkey H, Eloholma M, Halonen L, Alferdinck J, Freiding A, Bodrogi P, Varady G, Szalmas A. 2007. Mesopic visual efficiency IV: A model with relevance to nighttime driving and other applications. Lighting Research and Technology 39(4): 365–392. • A unified photometry system having the same framework as that proposed by Rea et al.
(2004), based on the results of experiments of reaction times, contrast sensitivity, and threshold detection, is proposed
He Y, Rea MS, Bierman A, Bullough JD. 1997. Evaluating light source efficacy under mesopic conditions using reaction times. Journal of the Illuminating Engineering Society 26(1): 125-138. • Simple reaction times were measured under high pressure sodium and metal halide spectra at
mesopic luminances (from 0.003 to 10 cd/m², corresponding to 0.01 to 30 fc on asphalt pavement)
• On-axis reaction times depended upon only the measured luminance at all light levels • Off-axis reaction times were increasingly shorter under metal halide illumination as the
overall light level decreased below 1 cd/m² (corresponding to 3 fc on asphalt)

6
Rea MS, Bullough JD. 2007. Making the move to a unified system of photometry. Lighting Research and Technology 39(4): 393-408. • A comparison of a unified photometry system developed by Rea et al. (2004) and a similar
system developed by Goodman et al. (2007) revealed that they produced nearly identical predictions of visual effectiveness under most conditions
Rea MS, Bullough JD, Freyssinier-Nova JP, Bierman A. 2004. A proposed unified system of photometry. Lighting Research and Technology 36(2): 85-111. • A system to quantify the relative visual effectiveness of different light spectra at mesopic
light levels (luminances from 0.01 to 0.6 cd/m², corresponding to illuminances of 0.03 to 2 fc on asphalt) is presented, along with look-up tables that can be used by practitioners
Rea MS, Radetsky LC, Bullough JD. 2011. Toward a model of outdoor lighting scene brightness. Lighting Research and Technology 43(1): 7-30. • For the illuminance range from 0.2 to 2 fc, brightness judgments for a scale-model scene
were higher for a metal halide light source than for a high pressure sodium light source • The responses were well predicted by a spectral sensitivity model that estimated increased
sensitivity to "blue" light near 450 nm Sivak M, Schoettle B, Minoda T, Flannagan MJ. 2005. Short-wavelength content of LED headlamps and discomfort glare. Leukos 2(2): 145-154. • Discomfort glare ratings to light sources (tungsten-halogen, MH, and various LEDs) were
found to be correlated with correlated color temperature (CCT) • Light sources with higher short-wavelength-cone stimulating content were reported as
producing more discomfort glare Field Research Studies
Several outdoor experiments have been conducted under various roadway light source technologies. In general these are consistent with the notion that “white” light sources can provide superior visual performance over HPS for the same light level, and that color identification is also improved under “white” light sources. Akashi Y, Rea MS, Bullough JD. 2007. Driver decision making in response to peripheral moving targets under mesopic light levels. Lighting Research and Technology 39(1): 53-67. • A roadway lighting field experiment was conducted to test drivers' ability to detect and
respond to moving targets while driving, under different lighting conditions providing equivalent mesopic vision
• Once equated for mesopic vision, driver response times to roadside moving objects were essentially equivalent
• Driver response times under metal halide were shorter than under high pressure sodium even when photopic light levels were equated

7
Rea MS, Bullough JD, Akashi Y. 2009. Several views of metal halide and high pressure sodium lighting for outdoor applications. Lighting Research and Technology 41(4): 297-320. • In a series of roadway lighting field experiments, it was found that "white" light sources such
as metal halide resulted in increased perceptions of brightness compared to the "yellower" illumination from high pressure sodium
• Brighter outdoor spaces were also judged as feeling safer • Color identification, but not facial recognition, was improved under metal halide relative to
high pressure sodium Rea M, Bierman A, McGowan T, Dickey F, Havard J. 1997. A field test comparing the effectiveness of metal halide and high pressure sodium illuminants under mesopic conditions. Proceedings of Visual Scales: Photometric and Colorimetric Aspects. Vienna: Commission Internationale de l'Éclairage. • An outdoor field experiment of visual acuity and off-axis target detection was conducted
under high pressure sodium and metal halide illumination • No differences in visual acuity were found once the measured (photopic) light level was
equal • Reaction times to off-axis targets were shorter under metal halide than under high pressure
sodium illumination LED System and Product Evaluations
Several reports have published reports of tests conducted on actual LED and other light source roadway lighting systems. In general, these reports confirm that LED technology has achieved viability as a roadway light source, and that the technology is evolving rapidly, as is pricing. Induction systems typically do not allow spacing as far as those achieved with HPS. Ceramic MH systems have similar efficacies and resulting costs as HPS. Pacific Northwest National Laboratory. 2009. CALiPER Summary Report: Round 7 of Product Testing. Washington, DC: Department of Energy. • Five LED (37-95 W) and two induction (67-71 W) street lighting systems were compared to
a 100-W HPS system (using 117 W including ballast power) • Light output was approximately proportional to the wattage regardless of the light source • System luminous efficacy (in lm/W) for the HPS system was 56 lm/W, ranged from 19-71
lm/W for the LED systems and ranged from 46-59 lm/W for the induction systems Pacific Northwest National Laboratory. 2010. CALiPER Summary Report: Round 7 of Product Testing. Washington, DC: Department of Energy. • Five LED (38-79 W) street lighting systems were compared to a 100-W HPS system (using
117 W including ballast power) • Light output was approximately proportional to the wattage regardless of the light source • System luminous efficacy (in lm/W) for the HPS system was 56 lm/W, and ranged from 26-
90 lm/W for the LED systems
8
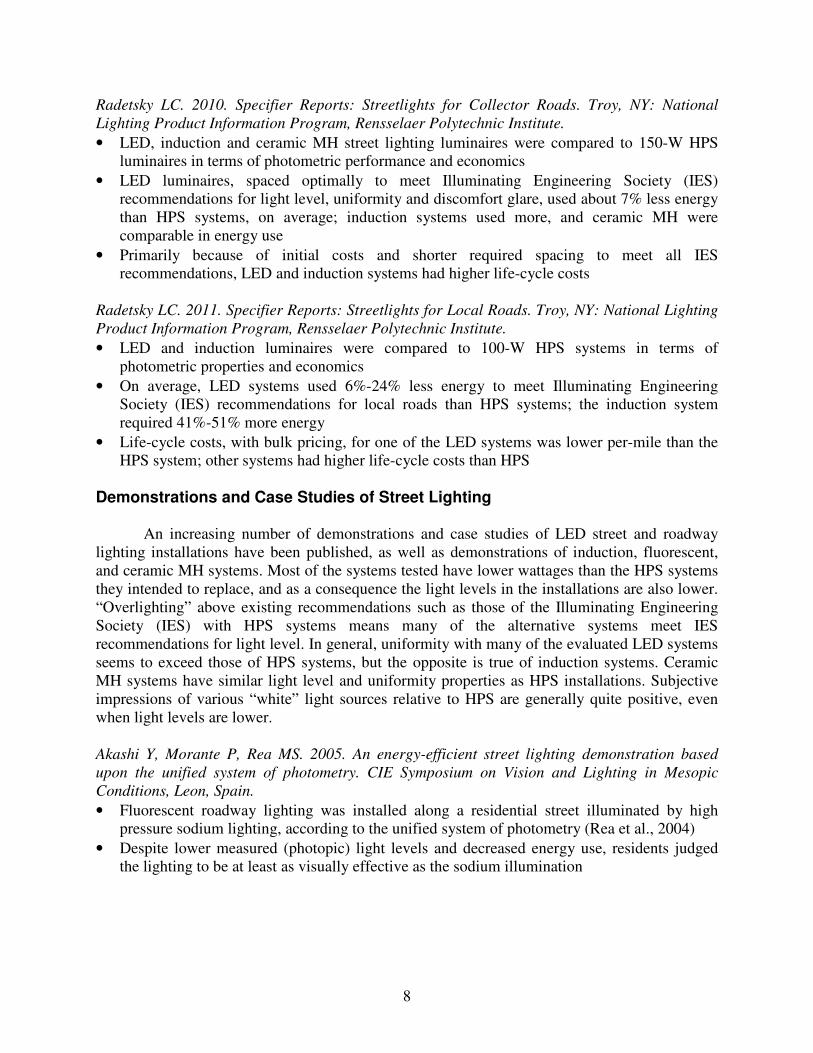
Radetsky LC. 2010. Specifier Reports: Streetlights for Collector Roads. Troy, NY: National Lighting Product Information Program, Rensselaer Polytechnic Institute. • LED, induction and ceramic MH street lighting luminaires were compared to 150-W HPS
luminaires in terms of photometric performance and economics • LED luminaires, spaced optimally to meet Illuminating Engineering Society (IES)
recommendations for light level, uniformity and discomfort glare, used about 7% less energy than HPS systems, on average; induction systems used more, and ceramic MH were comparable in energy use
• Primarily because of initial costs and shorter required spacing to meet all IES recommendations, LED and induction systems had higher life-cycle costs
Radetsky LC. 2011. Specifier Reports: Streetlights for Local Roads. Troy, NY: National Lighting Product Information Program, Rensselaer Polytechnic Institute. • LED and induction luminaires were compared to 100-W HPS systems in terms of
photometric properties and economics • On average, LED systems used 6%-24% less energy to meet Illuminating Engineering
Society (IES) recommendations for local roads than HPS systems; the induction system required 41%-51% more energy
• Life-cycle costs, with bulk pricing, for one of the LED systems was lower per-mile than the HPS system; other systems had higher life-cycle costs than HPS
Demonstrations and Case Studies of Street Lighting
An increasing number of demonstrations and case studies of LED street and roadway lighting installations have been published, as well as demonstrations of induction, fluorescent, and ceramic MH systems. Most of the systems tested have lower wattages than the HPS systems they intended to replace, and as a consequence the light levels in the installations are also lower. “Overlighting” above existing recommendations such as those of the Illuminating Engineering Society (IES) with HPS systems means many of the alternative systems meet IES recommendations for light level. In general, uniformity with many of the evaluated LED systems seems to exceed those of HPS systems, but the opposite is true of induction systems. Ceramic MH systems have similar light level and uniformity properties as HPS installations. Subjective impressions of various “white” light sources relative to HPS are generally quite positive, even when light levels are lower. Akashi Y, Morante P, Rea MS. 2005. An energy-efficient street lighting demonstration based upon the unified system of photometry. CIE Symposium on Vision and Lighting in Mesopic Conditions, Leon, Spain. • Fluorescent roadway lighting was installed along a residential street illuminated by high
pressure sodium lighting, according to the unified system of photometry (Rea et al., 2004) • Despite lower measured (photopic) light levels and decreased energy use, residents judged
the lighting to be at least as visually effective as the sodium illumination

9
Beckwith D, Zhang X, Smalley E, Chan L, Yand M. 2011. LED streetlight application assessment project: Pilot study in Seattle, Washington. Transportation Research Record (2250): 65-75. • Several roadway sections were outfitted with different candidate LED luminaire systems
(power from 39-142 W) designed to replace 100-W HPS street lighting systems (approximately 130 W total power including ballast)
• The systems with lower wattages than the HPS system produced lower light levels, but except for the LED systems with the very lowest wattages, could achieve the recommended light levels from the Illuminating Engineering Society (IES)
• Most systems did not meet IES requirements for disability glare Belcher MC, Kettering Klein A, Gadberry B. 1999. User survey of subjective preference for street-lighting sources. Journal of Architectural Engineering 5(3): 92-97. • A survey of residents whose streets were illuminated by high pressure sodium or by metal
halide illumination revealed that they had subjective preferences for the metal halide illumination
Brons JA. 2009. Field Test DELTA: Post-Top Photovoltaic Pathway Luminaire. Troy, NY: Lighting Research Center, Rensselaer Polytechnic Institute. • Along the main street of a small village downtown, twelve 40 W light emitting diode
luminaires replaced eight 150 W high pressure sodium luminaires • Residents judged the light emitting diode installation as having more visual effectiveness and
brighter appearance than the sodium installation Brons JA. 2010. Field Test DELTA Snapshots: LED Street Lighting. Troy, NY: Lighting Research Center, Rensselaer Polytechnic Institute. • An installation of 79 W light emitting diode luminaires was judged to be as good or better
than conventional (high pressure sodium) street lighting by 84% of observers asked to judge the lighting
Carter DK, Quick S, Danes S, Gatti E, Branick K, Limauro C, Popowich C, Orfield S, Role MR. 2011. LED Street Light Research Project. Pittsburgh, PA: Carnegie Mellon University. • Photometric measurements along a roadway in Pittsburgh outfitted with LED streetlights
were made, in addition to lighting from HPS lighting systems • In general, LED photometric measurements were lower than under HPS, although many
locations under HPS lighting did not meet city requirements for street lighting City of Los Angeles Bureau of Street Lighting. 2009. LED Equipment Evaluation: Pilot Project – Phase I. Los Angeles, CA: City of Los Angeles Bureau of Street Lighting. • 100 W HPS lighting systems were compared with LED systems ranging in wattage from 46-
88 W • For pole spacing longer than 160 ft, LED systems produced comparable or lower light levels
along the roadway • For pole spacing 160 ft or shorter, LED systems produced lower light levels than HPS • Subjective ratings of visibility and preference favored the LED systems

10
City of Sunnyvale and De Anza College. 2009. LED Street Lighting: Sunnyvale, CA. Sunnyvale, CA: City of Sunnyvale. • 250 W HPS lighting systems were compared with several LED systems ranging in power
from 101-119 W • Measured light levels were substantially lower under the LED systems than under the HPS
systems, but two-thirds of the LED systems met Illuminating Engineering Society (IES) requirements for roadway lighting
• Subjective ratings of visibility and glare were somewhat favorable for the LED systems Cook T, Shackleford J, Johnson M, Pang T. 2008. LED Street Lighting, Phase III Continuation: Oakland, CA. San Francisco, CA: Pacific Gas and Electric Company. • A 100-W HPS system (121 W total power including ballast) was compared to LED systems
(58-78 W) • Light levels were lower under the LED systems, and uniformity was increased under the
LED systems, relative to HPS Cook T, Shackelford J, Pang T. 2008. LED Street Lighting: San Francisco, CA. San Francisco, CA: Pacific Gas and Electric. • Installations of several types of light emitting diode street lights were assessed for user
acceptance, photometric performance, economic cost and mesopic vision • The authors conclude that LED street lights can provide equivalent overall performance to
high pressure sodium street lighting at lower energy use levels Cook T, Sommer A, Pang T. 2008. LED Street Lighting: Oakland, CA. San Francisco, CA: Pacific Gas and Electric. • A 100-W HPS system (121 W total power including the ballast) was compared to a 78-W
LED system • Under the LED system, light levels were lower and illumination was more uniform than HPS Dangeti M. 2010. Comparative Data Evaluation of Mercury Vapor/High Pressure Sodium and Induction Street Lighting. Las Vegas, NV: Clark County Department of Public Works. • 100-250 W HPS lighting systems and 175 W mercury vapor (MV) lighting systems were
replaced with 85 W induction lamp street lighting systems • Light levels under the induction system were comparable to 100 W HPS and 175 W MV
systems • Perceptions of safety and visibility were improved under the induction lighting relative to the
other systems

11
Gibbons RB, Edwards CJ, Clanton N, Mutmansky M. 2010. Alternative lighting evaluations in municipality of Anchorage. Transportation Research Board 89th Annual Meeting, January 10-14, 2010, Washington, DC. • 250-400 W HPS roadway lighting systems were compared to LED systems (146-234 W) and
a 165 W induction system • The LED and induction systems resulted in generally lower light levels • Measured detection distances for small colored roadside targets were shorter under the LED
and induction systems than the 400 W HPS system, but longer than under 250-W HPS • Subjective preference ratings favored the LED and induction systems Henderson RL. 2009. LED Street Lighting Test Project Report. Raleigh, NC: Progress Energy Carolinas. • HPS luminaires with 200-250 W lamps were replaced with 167-W LED luminaires, for a
total energy reduction of approximately 40% • Overall light levels were about 40% lower, but uniformity of illuminance was increased • Subjective judgments indicated that overall visibility was improved Johnson Controls. 2010. Stevens Point LED Street Light Project Final Report. Madison, WI: Wisconsin Energy Conservation Corporation. • 250 W HPS lighting systems (306 W including ballast power) were replaced by LED systems
ranging in wattage from 92-209 W • In general the illuminances were substantially lower for the LED systems than for the HPS
system • Scotopic measurements were used, which showed comparable levels between HPS and LED
systems (but are not applicable to electric lighting systems) Kinzey BR, Myer MA. 2009. Demonstration Assessment of LED Street Lighting: Lija Loop, Portland, Oregon. Richland, WA: Pacific Northwest Laboratory. • A 100-W HPS (120 W total including ballast power) system was compared with a 53-W
LED system • The average light level was substantially lower under the LED system, but the LED system
had somewhat higher uniformity relative to HPS Kinzey BR, Myer MA. 2009. Demonstration Assessment of LED Roadway Lighting: I-35W Bridge, Minneapolis, Minnesota. Richland, WA: Pacific Northwest Laboratory. • A 250 W HPS system (modeled, using 291 W including ballast power) was compared to the
new LED system on the I-35 bridge in Minneapolis containing 244-289 W LED luminaires • The light level was lower under the LED system than calculated for the HPS system, but
uniformity was higher unless the HPS system was tilted by 15o

12
Morante P. 2008. Mesopic Street Lighting Demonstration and Evaluation: Final Report [report to Groton Utilities]. Troy, NY: Lighting Research Center, Rensselaer Polytechnic Institute. • Fluorescent induction lamps and metal halide lamps were used to replace high pressure
sodium lighting along roadways in Groton, CT based on the unified system of photometry (Rea et al., 2004)
• Subjective responses of residents living along the streets confirmed that perceptions of brightness and visual effectiveness were as good or better under reduced (photopic) light levels and energy use, with the induction and metal halide sources
Morante P, Akashi Y, Rea M, Brons J, Bullough JD. 2007. Demonstration and Evaluation of Fluorescent Outdoor Lighting in the City of Austin, Texas [report to Austin Energy]. Troy, NY: Lighting Research Center, Rensselaer Polytechnic Institute. • A fluorescent lighting system installed along a roadway according to the unified system of
photometry from Rea et al. (2004) was judged by real-world observers to be as bright and visually effective as a corresponding high pressure sodium lighting system
Mutmansky M, Givler T, Clanton N, Edwards C, Lee A. 2009. Street Lighting Survey for Commercial Areas in the Municipality of Anchorage. Boulder, CO: Clanton and Associates. • Roadway lighting systems normally using 250-400 W HPS systems (with total power of 257-
460 W including the ballast) were compared with 160-165 W induction systems and 146-234 W LED systems
• Average light levels for the induction and LED systems were lower than for the HPS systems • Target detection distances for the induction and LED systems were substantially lower than
for the 400-W HPS system Mutmansky M, Givler T, Garcia J, Clanton N, Gibbons R, Edwards C, DeJean D, Cartier T, Hudson C. 2010. Advanced Street Lighting Technologies Assessment Project: City of San Diego. San Diego, CA: San Diego Gas and Electric. • Several roadway sections were retrofitted with induction and LED sources; 150-250 W HPS
(with total wattages of 180-288 W including ballast power) systems were replaced with 150-165 W induction lamp systems and 94-198 W LED systems
• In general, average measured illuminances were lower for the LED- and induction-lighted sections than under the HPS-lighted sections
• Uniformity under the induction lamp systems was lower than under HPS; LED uniformity could be higher or lower depending upon the installation
• Measured detection distances and subjective ratings were not substantially different among the various systems
Mutmansky M, Givler T, Garcia J, Clanton N, Gibbons R, Edwards C. 2010. Advanced Street Lighting Technologies Assessment Project: City of San Jose. San Jose, CA: City of San Jose. • Roadway lighting systems normally using low pressure sodium (LPS) 135 W systems (with
total power of 172 W including the ballast) were compared with 150-W HPS (using 169 W total) systems, 100 W (112 W total) induction systems, and 96-144 W LED systems
• All systems except one LED system produced a lower average illuminance, and all except a different LED system produced lower uniformity
• Subjective ratings favored the sources producing “white” light
13
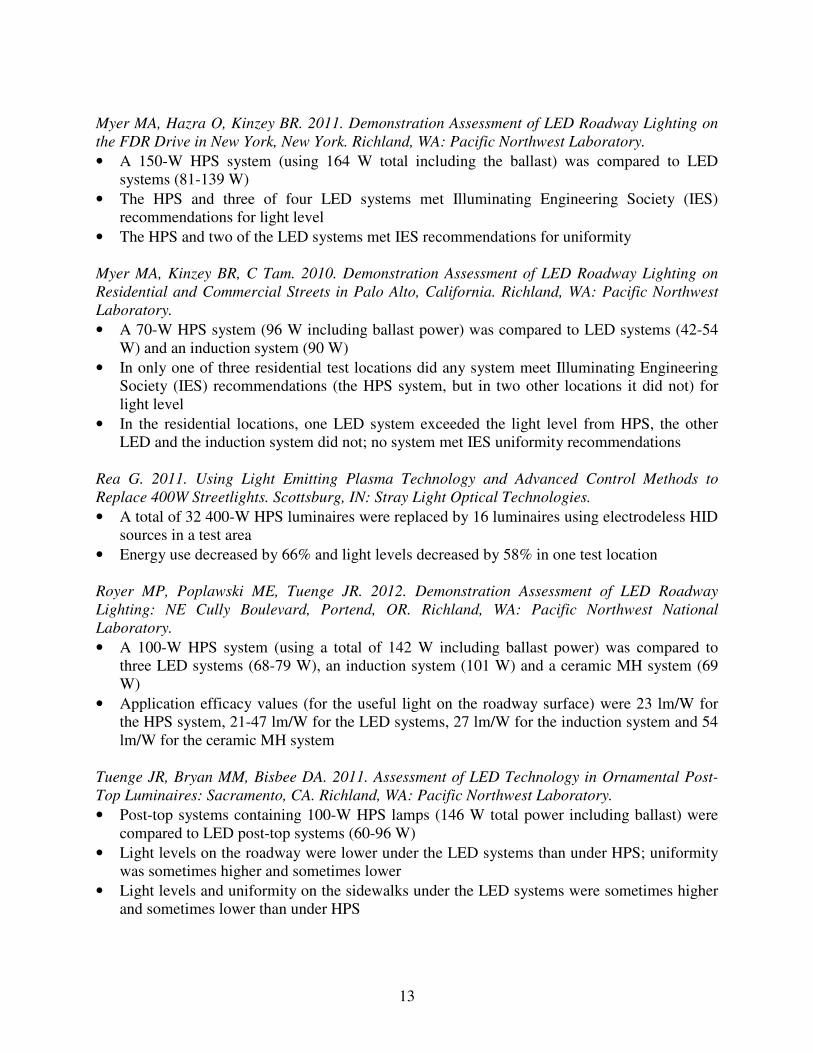
Myer MA, Hazra O, Kinzey BR. 2011. Demonstration Assessment of LED Roadway Lighting on the FDR Drive in New York, New York. Richland, WA: Pacific Northwest Laboratory. • A 150-W HPS system (using 164 W total including the ballast) was compared to LED
systems (81-139 W) • The HPS and three of four LED systems met Illuminating Engineering Society (IES)
recommendations for light level • The HPS and two of the LED systems met IES recommendations for uniformity Myer MA, Kinzey BR, C Tam. 2010. Demonstration Assessment of LED Roadway Lighting on Residential and Commercial Streets in Palo Alto, California. Richland, WA: Pacific Northwest Laboratory. • A 70-W HPS system (96 W including ballast power) was compared to LED systems (42-54
W) and an induction system (90 W) • In only one of three residential test locations did any system meet Illuminating Engineering
Society (IES) recommendations (the HPS system, but in two other locations it did not) for light level
• In the residential locations, one LED system exceeded the light level from HPS, the other LED and the induction system did not; no system met IES uniformity recommendations
Rea G. 2011. Using Light Emitting Plasma Technology and Advanced Control Methods to Replace 400W Streetlights. Scottsburg, IN: Stray Light Optical Technologies. • A total of 32 400-W HPS luminaires were replaced by 16 luminaires using electrodeless HID
sources in a test area • Energy use decreased by 66% and light levels decreased by 58% in one test location Royer MP, Poplawski ME, Tuenge JR. 2012. Demonstration Assessment of LED Roadway Lighting: NE Cully Boulevard, Portend, OR. Richland, WA: Pacific Northwest National Laboratory. • A 100-W HPS system (using a total of 142 W including ballast power) was compared to
three LED systems (68-79 W), an induction system (101 W) and a ceramic MH system (69 W)
• Application efficacy values (for the useful light on the roadway surface) were 23 lm/W for the HPS system, 21-47 lm/W for the LED systems, 27 lm/W for the induction system and 54 lm/W for the ceramic MH system
Tuenge JR, Bryan MM, Bisbee DA. 2011. Assessment of LED Technology in Ornamental Post-Top Luminaires: Sacramento, CA. Richland, WA: Pacific Northwest Laboratory. • Post-top systems containing 100-W HPS lamps (146 W total power including ballast) were
compared to LED post-top systems (60-96 W) • Light levels on the roadway were lower under the LED systems than under HPS; uniformity
was sometimes higher and sometimes lower • Light levels and uniformity on the sidewalks under the LED systems were sometimes higher
and sometimes lower than under HPS

14
Economic and Environmental Considerations
A growing number of reports have evaluated the economic impacts of alternative roadway lighting systems that might possibly use lower light levels or otherwise result in reduced energy use. Initial costs of LED and other alternative systems are an important driver of life-cycle costs; these initial costs continue to decrease rapidly, however. Bullough, J. D. 2012. Guide for Optimizing the Effectiveness and Efficiency of Roadway Lighting, C-10-14 [report to the New York State Energy Research and Development Authority and the New York State Department of Transportation]. Albany, NY: New York State Department of Transportation. • An overview of the differences among HPS, MH, LED and fluorescent induction light
sources for roadway lighting is provided. • Lighting considerations for parkways, residential streets and rural intersections are discussed. • Recommendations for equipment selection to maintain visibility and potentially to reduce
overall energy use are provided. Preliminary analyses suggest energy savings of 7%-50% can be achievable with the use of new lighting technologies over HPS lighting systems, depending upon the application.
Bullough JD, Rea MS. 2008. Innovative, Energy-Efficient Lighting for New York State Roadways: Opportunities for Incorporating Mesopic Visibility Considerations Into Roadway Lighting Practice [report to the New York State Energy Research and Development Authority and the New York State Department of Transportation]. Troy, NY: Lighting Research Center, Rensselaer Polytechnic Institute. • Economic analyses of roadway scenarios consisting of suburban, residential and rural
roadways and intersections, and of mid-block crossings, comparing high pressure sodium, metal halide, induction lamps, and light emitting diode sources were developed based on unified photometry
• For locations in rural and residential areas with lower light levels, alternatives to high pressure sodium could result in lower life cycle costs, despite higher initial costs
• Light emitting diode systems (in 2008) were substantially more expensive in terms of initial cost than other systems
Dale AT, Bilec MM, Marriott J, Hartley D, Jurgens C, Zatcoff E. 2011. Preliminary comparative life-cycle impacts of streetlight technology. Journal of Infrastructure Systems 17(4): 193-199. • In terms of life-cycle environmental impacts, LED street lighting systems were estimated to
have similar impacts to induction street lighting systems • Both LED and induction systems were estimated to have smaller life-cycle impacts than HPS
and MH systems Kostica M, Djokicb L, Pojatara D, Strbac-Hadzibegovica N. 2009. Technical and economic analysis of road lighting solutions based on mesopic vision. Building and Environment 44(1): 66-75. • The authors conducted analyses of the economic cost to install road lighting systems based
on mesopic vision and concluded that installations using metal halide lamps providing equal visibility as those using high pressure sodium lamps can have lower overall costs

15
Ylinen A-M, Tahkamo L, Puolakka M, Halonen L. 2011. Road lighting quality, energy efficiency, and mesopic design: LED street lighting case study. Leukos 8(1): 9-24. • The authors conclude that when incorporating mesopic visual efficacy of light sources into
roadway lighting design, such as when considering light emitting diodes for street lighting, the resulting system can use less energy than a system based on conventional photometry
Consensus Standards, Industry Recommendations and Guidelines
The Illuminating Engineering Society (IES) recently incorporated the system of unified photometry developed by the Commission Internationale de l’Eclairage (CIE), in turn based largely on the system described by ASSIST (Rea and Freyssinier 2009) as the basis for its recommendations for lighting of low-speed roadways (with driving speeds not exceeding 25 mph). Commission Internationale de l'Eclairage Technical Committee 1-58. 2010. Recommended System for Mesopic Photometry Based on Visual Performance, CIE 191:2010. Vienna, Austria: Commission Internationale de l'Eclairage. • A system of photometry based on visual performance at mesopic light levels is proposed,
which is an intermediate system adapted from those of Rea et al. (2004) and Goodman et al. (2007)
Illuminating Engineering Society of North America Committee on Effects of Lamp Spectral Distribution. 2012. Spectral Effects of Lighting on Visual Performance at Mesopic Lighting Levels, IESNA TM-12-12. New York, NY: Illuminating Engineering Society of North America. • Methods for incorporating the system of mesopic photometry developed by the Commission
Internationale de l’Eclairage (CIE) into nighttime lighting practices are described Rea MS, Freyssinier JP. 2009. ASSIST Recommends: Visual Efficacy [report to Alliance for Solid State Illumination Systems and Technologies]. Troy, NY: Lighting Research Center, Rensselaer Polytechnic Institute. • A method for comparing the ability of different light sources to support visual performance at
nighttime light levels is provided based on the unified system of photometry developed by Rea et al. (2004)
Summary Taken together, the findings from the review of published literature indicate that new lighting technologies such as LED light sources are rapidly becoming viable alternatives to HPS systems for roadway lighting. In order to provide techniques for comparing technologies on an apples-to-apples basis, the project team next analyzed a number of lighting systems using a common set of performance metrics.
16
COMPARISON AMONG NEW AND CONVENTIONAL LIGHTING TECHNOLOGIES Comparison Approach In order to facilitate comparisons between new and conventional lighting technologies, the project team took several steps:
• Develop representative roadway lighting scenarios for analysis: o Freeway o Collector road
• Identify representative examples of conventional lighting technologies for baseline analysis
• Identify representative examples of new lighting technologies for comparative analysis, including:
o Metal halide o Light emitting diode o Electrodeless high-intensity discharge
• Identify relevant performance metrics for comparison, including: o Luminaire power, lumens and efficacy o Classifications o Distribution o Pole spacing o Application efficacy o Discomfort glare
• Conduct analyses and present results in a consistent format
The performance analyses were carried out using conventional photometric data for each luminaire, and although colorimetric data are presented (as available) for some of the luminaires evaluated, these quantities could not be incorporated into the comparisons in this section of the report because of insufficient available data. The subsequent section of this chapter includes a discussion for how they might be incorporated into design metrics for roadway lighting. Roadway Scenarios Freeways
The roads in the freeway scenarios had three traveling lanes in each driving direction, each 12 ft (4 m) wide, with a 20 ft (6 m) wide median [consisting of two 10 ft (3 m) wide medians] based on guidance from the American Association of State Highway and Transportation Officials (AASHTO, 2004), and 10 ft (3 m) shoulders adjacent to the outer lanes. Pavement was assumed to be asphalt, type R3 (IES, 2000). Collector Roads
For the collector road scenario (a road servicing traffic between local and major roadways), the road was a four lane road measuring 48 ft (15 m) across, based on guidance from

17
AASHTO (2004). It is assumed for the purpose of developing the lighting design that there is no ambient illumination in the environment. Pavement was assumed to be asphalt, type R3 (IES, 2000). Lighting Analysis Details Light Source and Luminaire Types
HPS systems are the predominant types used for roadway lighting in the United States (Mara et al., 2005). The project team used information from a recent survey of street lighting practitioners conducted by the National Lighting Product Information Program (NLPIP; Radetsky, 2010) as a starting point to determine luminaire models that were commonly reported as being specified. The project team also reviewed advertisements for roadway lighting products in lighting trade magazines to obtain information about recent product offerings. Several commonly used luminaire models were selected for analysis and comparison. For the freeway scenarios, three HPS luminaire models containing 250 W HPS lamps were selected among the most commonly used models.
For the alternative lighting technologies, a luminaire with a MH lamp (pulse start) and one with a ceramic metal halide (CMH) lamp were selected to represent alternatives within the high-intensity discharge (HID) lamp technology family for the freeway scenarios. In these scenarios, six LED luminaires were selected to represent solid-state lighting alternatives, and a single electrodeless HID luminaire was also evaluated for the freeway scenarios.
For the collector road scenarios, three HPS luminaires, a MH and a CMH luminaire, and six LED luminaires were compared.
In order to ensure that the products being compared were viable choices for roadway lighting, only luminaires that provided a minimum longitudinal spacing of 200 ft (61 m) or longer were selected. This corresponds to the median luminaire spacing identified by NLPIP (Radetsky, 2010) for staggered layouts on collector roads, and also corresponds to transportation agency practices where the pole spacing for continuous lighting is specified. Lighting Geometry
For the freeway scenarios, a staggered pole layout (with alternating poles on either side of the road) as this tends to represent the lowest energy use while meeting RP-8 criteria (Radetsky, 2010, 2011). A luminaire height of 40 ft (12 m) with an overhang over the outer lane edge of 6 ft (2 m) was assumed.
For the collector road scenarios, a staggered pole layout was used. A luminaire height of 27 ft (8 m) was used, with a luminaire overhang (the distance between the edge of the roadway and the luminaire, in plan view) of 6 ft (2 m).

18
Lighting Criteria
Currently, the IES (2000) has three methods for specifying the performance of roadway lighting, based on illuminance, luminance and small target visibility (STV). The AASHTO (2005a) roadway lighting guide is largely based on the IES (2000) standard, but does not include STV as a design criterion. In order to develop the lighting installations used to evaluate the conventional and new lighting technologies outlines in this interim report, both the illuminance and luminance criteria were used as the basis for determining the maximum luminaire spacing needed to achieve each set of criteria, and the method resulting in the longest distance between luminaires was used subsequently in all further analyses involving those luminaires.
For freeways, the IES (2000) criteria for Freeway Type B (excluding those with especially high visual complexity) roads were used. For the collector road scenarios, a medium pedestrian conflict level was assumed. Table 2 shows the illuminance criteria specified by IES (2000) for these two roadway types. Table 3 shows the corresponding luminance criteria. It is important to note that each set of criteria (illuminance or luminance) include limits on the overall average light level, the uniformity of illumination, and limits on disability glare characterized by the veiling luminance ratio (IES, 2000).
TABLE 2 Illuminance Criteria for Continuous Roadway Lighting of Freeways (Type B) and Collector Roads (With Medium Pedestrian Conflict)
TABLE 3 Luminance Criteria for Continuous Roadway Lighting of Freeways (Type B) and Collector Roads (With Medium Pedestrian Conflict)

19
Performance Metrics Luminaire Power, Lumens and Efficacy
The data sheets in Figures 1 through 12 (for freeways) and in Figures 13 through 23 (for collector roads) show, in a consistent and comparable format, the power used by each luminaire (in W) and the lumens produced by the luminaire (in lm), with the quotient of these quantities being defined as the luminaire efficacy (in lm/W). For the HPS luminaires, the luminaire efficacies ranged from 59 to 66 lm/W for the freeway scenarios and from 56 to 62 lm/W for the collector roadway scenarios. In comparison, the LED luminaire efficacy values ranged from 66 to 87 lm/W for the freeway scenarios and from 62 to 96 lm/W for the collector roadway scenarios. The pulse start MH luminaire was 58 lm/W for the freeway and 43 lm/W for the collector roadway. The CMH luminaire was 85 lm/W for the freeway and 86 lm/W for the collector roadway. The electrodeless HID luminaire was 71 lm/W for the freeway. Cutoff and Uplight Classifications
Although the cutoff classifications (IES, 2000) have been formally deprecated by the Illuminating Engineering Society, these classifications are still commonly used by specifiers and transportation agencies to describe luminaires used for roadway lighting, and they are included in the present analyses. Two of the three HPS luminaires for each scenario type (freeway and collector road) were classified as full cutoff (IES, 2000) with uplight ratings [U in the BUG system (IES, 2007)] of zero. One HPS luminaire for each scenario type was classified as cutoff. The cutoff HPS luminaire for the freeway scenario had an uplight rating of 1, and the other could not be classified with respect to its BUG rating because of insufficient data in the photometric file published by the manufacturer. Most manufacturers presently publish photometric data for all angles around the luminaire, but in prior years it was common for many manufacturers to only publish data for angles below horizontal as these angles were the only ones relevant to the illumination on the roadway. Presently, interest in uplight and light pollution concerns (Brons et al., 2008) have made it common for data at all angles to be published.
The MH luminaire for the freeway was a full cutoff and for the collector road was a semi-cutoff. The CMH luminaires for both scenario types were full cutoff. The cutoff classification for the electrodeless HID luminaire in the freeway scenario could not be determined. Since the cutoff classification is based on the luminous intensity from a luminaire (in candelas) as a function of the luminous flux produced by the lamp(s) in the luminaire (in lumens) it was not possible to determine the cutoff classification of the LED luminaires, but all LED luminaires has uplight (U) ratings of zero. It was not possible to determine the cutoff classification nor the uplight ratings of the electrodeless HID luminaire because of insufficient photometric data above the horizontal. Distribution Types
With two exception, all of the luminaires of each type (HPS, MH, CMH, LED or electrodeless HID) were either Type II or Type III in terms of their lateral distribution type (this corresponds to the throw of the luminaires across the roadway), and had a vertical distribution

20
type of Medium (this corresponds to the throw of the luminaires along the roadway). One LED luminaire evaluated for the collector road scenarios had a Type IV lateral distribution and a Short vertical distribution, and one Type III LED luminaire also had a Short vertical distribution. Pole Spacing
For the freeway scenarios, the maximum pole spacing (between luminaires on the same side of the road) for the HPS luminaires to meet either the illuminance or luminance criteria ranged from 215 to 255 ft (66 to 78 m). The MH luminaire had a maximum pole spacing of 250 ft (76 m) and the CMH luminaire had a pole spacing of 235 ft (72 m). The LED luminaires’ maximum spacing ranged from 205 to 300 ft (62 to 91 m) and the electrodeless HID luminaire’s maximum spacing was 225 ft (69 m).
For the collector roadway scenarios, the maximum pole spacing for the HPS luminaires to meet either the illuminance or luminance criteria ranged from 225 to 270 ft (69 to 82 m). The MH luminaire had a maximum pole spacing of 210 ft (64 m) and the CMH luminaire had a pole spacing of 255 ft (78 m). The LED luminaires’ maximum spacing ranged from 200 to 255 ft (61 to 78 m).
In general, the pole spacing achievable for both roadway scenario types was comparable between the HPS and alternative source technologies such as MH, CMH, LED and electrodeless HID sources. For the freeway scenarios, the median HPS luminaire pole spacing was 225 ft (69 m) and the median LED luminaire pole spacing was 223 ft (68 m). For the collector road scenarios the median HPS luminaire pole spacing was 270 ft (82 m) and the median LED luminaire pole spacing was 220 ft (67 m). Input Power
Comparing only HPS and LED luminaires, for the freeway scenarios the median HPS luminaire power was 292 W (250 W lamps plus ballast power) and the median LED luminaire power was 200 W. For the collector road scenarios the median HPS luminaire power was 190 W (150 W lamps plus ballast power) and the median LED luminaire power was 130 W. Luminaire System Application Efficacy
The luminaire efficacy is one measure of the energy efficiency of a luminaire but only considers light emitted by the luminaire, not the specific location (whether useful or not) to which is it emitted. In order to better estimate “useful light” a measure based on the application efficacy of the luminaire for illuminating the roadway surface according to RP-8 (IES, 2000) criteria was developed (Radetsky, 2010; Freyssinier and Radetsky, 2011), called the luminaire system application efficacy (LSAE).
Once the maximum spacing needed to meet the relevant IES (2000) criteria for the roadway type (freeway or collector roads) was determined, horizontal illuminances along a 2 by 2 ft (0.6 by 0.6 m) grid on the roadway surface were calculated using a photometrically accurate lighting calculation software program (AGi32, Lighting Analysts). Points lower than the RP-8

21
(IES, 2000) minimum illuminance were not included. Starting with the lowest illuminance values equal to or greater than the minimum value, the average illuminance of the resulting cells was determined until the calculated average illuminance met the RP-8 criterion for the average illuminance for the roadway type under investigation. The illuminance values contributing to the target illuminance but not exceeding it were counted as “conforming cells” toward the LSAE value. The lumens reaching each cell around each conforming grid point were estimated by multiplying the illuminance (in fc) by the area of a cell in a 2 by 2 ft (0.6 by 0.6 m) grid, or 4 ft2 (1.2 m2). Since two streetlights contribute to the lumens per streetlight cycle in a staggered pole layout, the LSAE value was divided by two. It has been shown (Radetsky, 2010) that LSAE values are highly correlated with power demand of roadway lighting installations per mile.
For the freeway scenarios, the median LSAE value was 20 lm/W for the HPS luminaires, 18 lm/W for the MH luminaire, 28 lm/W for the CMH luminaire, 29 lm/W for the LED luminaires, and 19 lm/W for the electrodeless HID luminaire. For the collector road scenarios, the median LSAE value was 31 lm/W for the HPS luminaires, 15 lm/W for the MH luminaire, 35 lm/W for the CMH luminaire, and 36 lm/W for the LED luminaires.
The LSAE methodology could be applied with different mounting heights to assist in identifying the optimal application efficacy for a given luminaire per its mounting height. Shown in Figures 1 through 23 are LSAE values for each luminaire for mounting heights of 30 to 55 ft (9 to 17 m) for freeways and 15 to 45 ft (5 to 14 m) for collector roads. Some luminaires have optimal mounting height differing from 40 ft (12 m) for freeways and from 27 ft (8 m) for collector roads. Discomfort Glare
Although the criteria stipulated by IES (2000) for roadway lighting take disability glare into account (through the maximum veiling luminance, see Tables 2 and 3), they do not directly consider discomfort glare. Using a methodology for comparing outdoor luminaires as mounted (Brons et al., 2008; Bullough et al., 2008), the discomfort glare rating elicited by a luminaire was estimated. The methodology uses the ratio of the illuminance from a luminaire directly reaching a driver’s eyes to the illuminance reaching the eyes from the surfaces surrounding the luminaire. The rating scale used (De Boer, 1967) falls along a 9-point figure of merit scale where higher values correspond to more favorable conditions: 1 unbearable 2 3 disturbing 4 5 just permissible 6 7 satisfactory 8 9 just noticeable glare

22
For the freeway scenarios and for urban conditions the HPS luminaires had a median discomfort rating of 3.55. The MH luminaire had a rating of 3.87 and the CMH luminaire a rating of 3.53. The median LED luminaire rating was 4.38 and the electrodeless HID luminaire had a rating of 6.18. For the collector roads the HPS luminaires had a median discomfort rating of 3.58. The MH luminaire had a rating of 3.79 and the CMH luminaire a rating of 3.11. The median LED luminaire rating was 4.63. Because spectral data were unavailable for many of the luminaires evaluated in the present study, it was not possible to provide quantitative estimates of the relative difference in discomfort glare that might be elicited by a white light source such as LEDs, in comparison to HPS lamps. It has been estimated, however, that a white LED with a correlated color temperature of 5000 K could produce 16% more discomfort glare than a HPS source producing the same illuminance at the eye (Bullough, 2009; Radetsky, 2010). Summary
The data in Figures 1 through 23, summarized in the previous sections of this chapter, demonstrate that new lighting technologies for roadway lighting have advanced considerably from several years ago (Radetsky et al., 2010) when HPS and LED and other technologies had similar efficiencies as measured through metrics like efficacy and LSAE. The systems evaluated for the present report demonstrated that efficiency and system costs (based on pole spacing) could be reduced substantially with some LED systems (on the order of about 15%, depending upon the specific systems), for example, if initial luminaire costs are comparable.

23
FIGURE 1 Data for freeway luminaire CMH-A.

24
FIGURE 2 Data for freeway luminaire HPS-A.

25
FIGURE 3 Data for freeway luminaire HPS-B.

26
FIGURE 4 Data for freeway luminaire HPS-C.

27
FIGURE 5 Data for freeway luminaire LED-A.

28
FIGURE 6 Data for freeway luminaire LED-B.

29
FIGURE 7 Data for freeway luminaire LED-C.

30
FIGURE 8 Data for freeway luminaire LED-D.

31
FIGURE 9 Data for freeway luminaire LED-E.

32
FIGURE 10 Data for freeway luminaire LED-F.
33
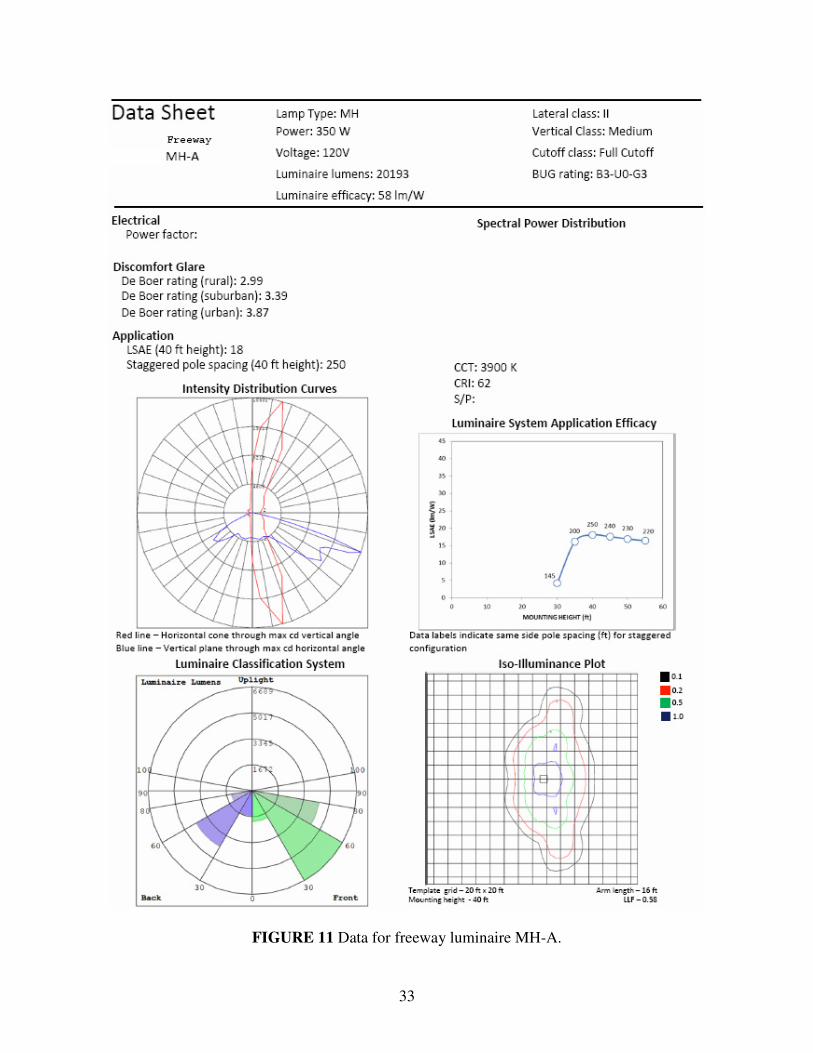
FIGURE 11 Data for freeway luminaire MH-A.

34
FIGURE 12 Data for freeway luminaire Electrodeless HID-A.

35
FIGURE 13 Data for collector luminaire CMH-A.

36
FIGURE 14 Data for collector luminaire HPS-A.

37
FIGURE 15 Data for collector luminaire HPS-B.

38
FIGURE 16 Data for collector luminaire HPS-C.

39
FIGURE 17 Data for collector luminaire LED-A.

40
FIGURE 18 Data for collector luminaire LED-B.

41
FIGURE 19 Data for collector luminaire LED-C.

42
FIGURE 20 Data for collector luminaire LED-D.

43
FIGURE 21 Data for collector luminaire LED-E.
44
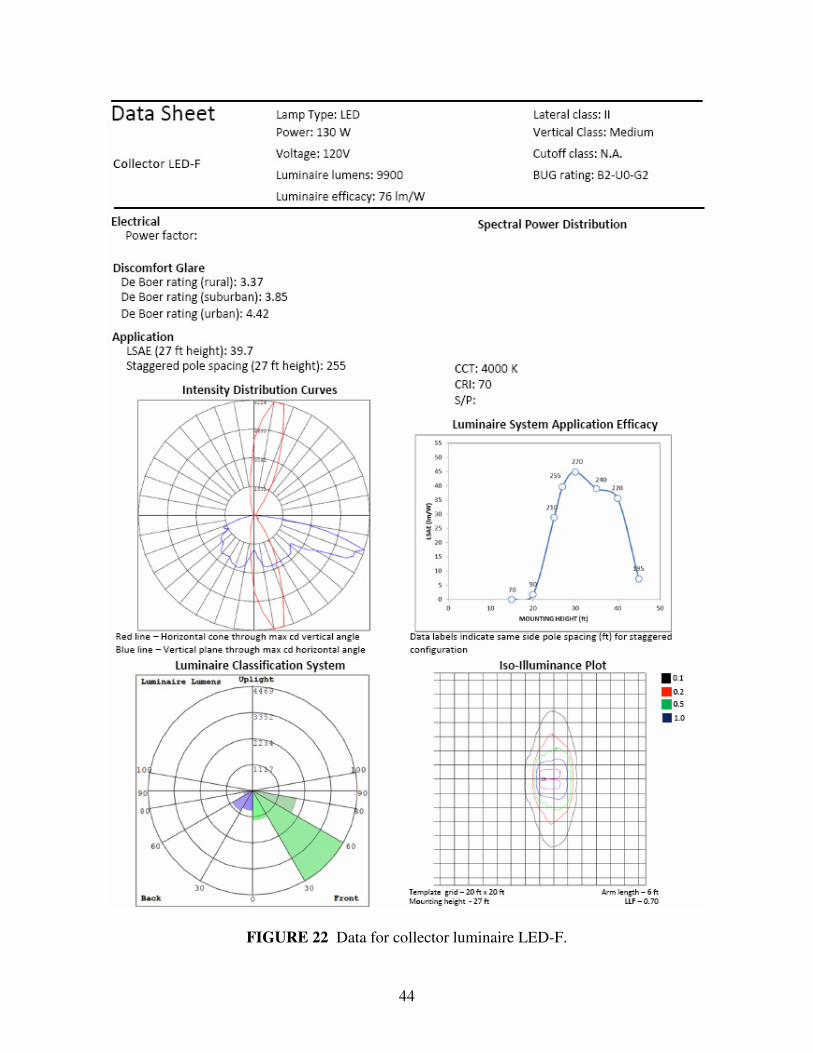
FIGURE 22 Data for collector luminaire LED-F.

45
FIGURE 23 Data for collector luminaire MH-A.

46
VISUAL PERFORMANCE ANALYSES
A recent study (Bullough et al., 2013) identified the influence of roadway intersection lighting on nighttime crash safety as well as on visual performance of targets as drivers approach the intersection conflict point. There were strong correlations between night-to-day crash ratio reductions associated with roadway intersection lighting and visual performance improvements associated with roadway lighting for several intersection types including signalized and unsignalized intersections in rural and urban/suburban locations. The visual performance analysis method used by Bullough et al. (2013) used the relative visual performance (RVP) model (Rea and Ouellette, 1991) which has been validated under a variety of nighttime driving conditions (Bullough and Skinner, 2009; Bullough and Skinner, 2012; Bullough et al., 2012a).
The analysis method was similar to that described by Rea et al. (2010) in their assessment
of visibility improvements from roadway lighting. The scenarios used were for collector roads, since these contain intersections. The ability of drivers approaching an intersection and of drivers at an intersection to see visual information around the intersection conflict point and at locations of approaching vehicles were estimated. The presence of low beam headlights was included in the analyses, since these light sources would normally be present as sources of illumination as well as potential sources of disability glare (Fry, 1954).
Three luminaires were selected for analysis based on their photometric distributions: two
HPS luminaires (collector luminaires HPS-A [Figure 14] and HPS-B [Figure 15]) and one LED luminaire (collector luminaire LED-E [Figure 21]). Inspection of the luminous intensity distributions in these figures shows that the distribution of collector luminaire HPS-B in particular is very directional, with relatively little downward luminous flux directly below the luminaire and a relatively high angular intensity which would be directed along the roadway, which should maximize the luminance contrast of objects along the roadway, and in turn, should result in higher RVP values (Rea and Ouellette, 1991).
A pole mounting height of 27 ft was used in the analyses for all of the luminaires. The
collector road was assumed to be a four lane road. Pole spacing for each of the three luminaires was defined as the maximum spacing that would allow meeting all of the IES (2000) RP-8 criteria for light level, uniformity and veiling luminance (information found in Figures 14, 15 and 21). The targets used in the analysis were light gray (50% reflectance, 20 cm x 20 cm) square targets having the same characteristics as the target defined by IES (2000) for small target visibility analyses. Twenty locations along the collector road, spaced 15 ft apart, were defined as the possible locations of vehicles approaching the intersection. For the visual performance analyses, the RVP value for the target given its luminance contrast, background luminance and angular size was calculated for drivers aged 30, 45 and 60 years.
Scenarios included no roadway lighting, and each of the three luminaire types. RVP
values were converted into scores (3: RVP>0.9, 2: 0.9>RVP>0.8, 1: 0.8>RVP>0.7, 0: RVP<0.7) as previously defined by Rea et al. (2010). Target distance locations were divided into two groups: the near locations would be most relevant along low speed roadways (defined here as those with speeds < 40 mph) and the farther locations for higher speed roadways (defined here as those with speeds > 40 mph). A speed of 40 mph as a cutoff value was used because this speed

47
has also been used by several organizations and transportation agencies in the United States to segregate low and high-speed roads (AASHTO, 2005b; FHWA, 2005a, 2005b, 2007; Kentucky Transportation Cabinet, 2006; Florida DOT, 2007; Maryland SHA, 2007; Minnesota DOT, 2007; Utah DOT, 2007).
In the visual performance analyses, high and low speed scenarios are considered separately. In addition to light from fixed roadway lighting and from vehicle headlights, an ambient illuminance (added to all target and background values) of 0.2 lux (for suburban locations) or 2 lux (for urban locations) was used in the analyses (Li et al., 2006).
Table 4 shows the RVP values (color coded to RVP scores: 3: white, 2: yellow, 1:
orange, 0: red) for each driver age and for the suburban locations. Table 5 shows the corresponding RVP values for the urban locations. These two figures exhibit similar trends:
• Visual performance values tend to be lower for older drivers (e.g., 60 years old) than
for younger drivers (e.g., 30 years old) • Visual performance is improved with the presence of roadway intersection lighting
relative to the condition with no fixed roadway lighting, for all three systems evaluated
• Visual performance for the roadway locations farthest from the roadway intersection's conflict point (denoted as C3, locations 0 through 9 in Tables 4 and 5) tended to result in lower visual performance than for the locations closest to the conflict point (C3, locations 10 through 19 in Tables 4 and 5)
Table 6 summarizes the overall results of the visual performance analyses in Tables 4 and
5, averaging the differences in RVP scores for each set of roadway locations and for each of the three driver ages used in the analyses. These quantities, called ∆RVP values (Bullough et al., 2013) are estimates of the overall increment in visual performance associated with roadway lighting, relative to the case with no fixed roadway lighting present (only vehicle headlights and a small amount of ambient light from adjacent locations in either suburban or urban areas).

48
TABLE 4 RVP Values for No Roadway Lighting and Three Luminaires for 30- and 45-Year-Old Drivers in Suburban Locations
Su
bu
rba
n 0
.2 l
x a
mb
ien
t li
gh
t
Lig
hti
ng
co
nd
itio
n
C3
loca
tio
nC
1->
C3
C2
->C
3C
3->
C1
C3
->C
2L
igh
tin
g
co
nd
itio
n
C3
loca
tio
nC
1->
C3
C2
->C
3C
3->
C1
C3
->C
2L
igh
tin
g
co
nd
itio
n
C3
loca
tio
nC
1->
C3
C2
->C
3C
3->
C1
C3
->C
2L
igh
tin
g
co
nd
itio
n
C3
loca
tio
nC
1->
C3
C2
->C
3C
3->
C1
C3
->C
2
No
0#
NU
M!
#N
UM
!0
.50
0.4
6H
PS
-A0
0.7
50
.81
0.8
20
.82
HP
S-B
00
.79
0.8
50
.82
0.8
2LE
D-E
0-0
.75
0.8
10
.78
0.7
6
No
1#
NU
M!
#N
UM
!0
.54
0.5
1H
PS
-A1
0.7
20
.82
0.8
20
.82
HP
S-B
10
.84
0.8
60
.83
0.8
3LE
D-E
10
.78
0.8
50
.79
0.7
7
No
2#
NU
M!
#N
UM
!0
.59
0.5
5H
PS
-A2
#N
UM
!0
.83
0.8
30
.83
HP
S-B
20
.81
0.8
40
.84
0.8
4LE
D-E
20
.82
0.8
60
.80
0.7
9
No
3#
NU
M!
#N
UM
!0
.62
0.5
9H
PS
-A3
0.7
70
.83
0.8
40
.84
HP
S-B
30
.48
0.8
10
.85
0.8
5LE
D-E
30
.77
0.8
60
.82
0.8
0
No
4#
NU
M!
#N
UM
!0
.66
0.6
3H
PS
-A4
0.7
90
.84
0.8
50
.85
HP
S-B
4#
NU
M!
0.8
30
.86
0.8
6LE
D-E
4-2
.60
0.8
50
.83
0.8
2
No
5#
NU
M!
#N
UM
!0
.69
0.6
6H
PS
-A5
0.7
70
.86
0.8
60
.86
HP
S-B
50
.37
0.8
40
.87
0.8
6LE
D-E
50
.73
0.8
40
.84
0.8
3
No
6#
NU
M!
#N
UM
!0
.72
0.7
0H
PS
-A6
0.2
50
.87
0.8
70
.87
HP
S-B
60
.79
0.8
50
.88
0.8
7LE
D-E
60
.80
0.8
40
.85
0.8
4
No
7#
NU
M!
#N
UM
!0
.74
0.7
2H
PS
-A7
0.6
70
.87
0.8
70
.88
HP
S-B
70
.84
0.8
50
.88
0.8
8LE
D-E
70
.83
0.8
50
.86
0.8
5
No
8#
NU
M!
#N
UM
!0
.77
0.7
5H
PS
-A8
0.8
30
.87
0.8
80
.88
HP
S-B
80
.86
0.8
70
.89
0.8
9LE
D-E
80
.86
0.8
70
.87
0.8
6
No
9#
NU
M!
#N
UM
!0
.79
0.7
7H
PS
-A9
0.8
70
.88
0.8
90
.89
HP
S-B
90
.89
0.8
80
.90
0.8
9LE
D-E
90
.87
0.8
80
.88
0.8
7
No
10
#N
UM
!#
NU
M!
0.8
10
.79
HP
S-A
10
0.8
70
.87
0.9
00
.90
HP
S-B
10
0.9
10
.91
0.9
00
.90
LED
-E1
00
.90
0.8
70
.89
0.8
8
No
11
#N
UM
!#
NU
M!
0.8
30
.81
HP
S-A
11
0.9
10
.90
0.9
00
.90
HP
S-B
11
0.8
90
.87
0.9
10
.90
LED
-E1
10
.91
0.8
90
.89
0.8
9
No
12
#N
UM
!#
NU
M!
0.8
50
.83
HP
S-A
12
0.9
10
.91
0.9
10
.91
HP
S-B
12
0.8
40
.89
0.9
10
.91
LED
-E1
20
.90
0.7
70
.90
0.8
9
No
13
#N
UM
!#
NU
M!
0.8
70
.84
HP
S-A
13
0.7
50
.76
0.9
20
.91
HP
S-B
13
0.9
00
.91
0.9
20
.91
LED
-E1
30
.54
0.8
80
.91
0.9
0
No
14
#N
UM
!#
NU
M!
0.8
80
.86
HP
S-A
14
0.9
00
.91
0.9
20
.92
HP
S-B
14
0.9
10
.91
0.9
20
.92
LED
-E1
40
.89
0.9
10
.92
0.9
1
No
15
#N
UM
!#
NU
M!
0.9
00
.87
HP
S-A
15
0.9
20
.92
0.9
30
.92
HP
S-B
15
0.9
10
.92
0.9
30
.92
LED
-E1
50
.91
0.9
20
.92
0.9
1
No
16
#N
UM
!#
NU
M!
0.9
10
.87
HP
S-A
16
0.9
20
.92
0.9
30
.92
HP
S-B
16
0.9
10
.92
0.9
30
.93
LED
-E1
60
.92
0.9
20
.93
0.9
1
No
17
#N
UM
!#
NU
M!
0.9
20
.88
HP
S-A
17
0.9
20
.93
0.9
30
.93
HP
S-B
17
0.9
30
.93
0.9
40
.93
LED
-E1
70
.92
0.9
30
.93
0.9
2
No
18
0.8
90
.88
0.9
20
.88
HP
S-A
18
0.9
20
.93
0.9
30
.93
HP
S-B
18
0.9
20
.94
0.9
40
.93
LED
-E1
80
.91
0.9
40
.93
0.9
2
No
19
0.9
30
.92
0.9
10
.88
HP
S-A
19
0.9
20
.93
0.9
30
.93
HP
S-B
19
0.9
30
.94
0.9
30
.93
LED
-E1
90
.93
0.9
40
.93
0.9
2
Lig
hti
ng
co
nd
itio
n
C3
loca
tio
nC
1->
C3
C2
->C
3C
3->
C1
C3
->C
2L
igh
tin
g
co
nd
itio
n
C3
loca
tio
nC
1->
C3
C2
->C
3C
3->
C1
C3
->C
2L
igh
tin
g
co
nd
itio
n
C3
loca
tio
nC
1->
C3
C2
->C
3C
3->
C1
C3
->C
2L
igh
tin
g
co
nd
itio
n
C3
loca
tio
nC
1->
C3
C2
->C
3C
3->
C1
C3
->C
2
No
0#
NU
M!
#N
UM
!0
.05
-0.1
6H
PS
-A0
0.6
80
.76
0.7
90
.78
HP
S-B
00
.74
0.8
20
.78
0.7
8LE
D-E
0-3
.06
0.7
70
.71
0.6
9
No
1#
NU
M!
#N
UM
!0
.19
0.0
3H
PS
-A1
0.6
30
.78
0.7
80
.78
HP
S-B
10
.82
0.8
40
.80
0.7
9LE
D-E
10
.73
0.8
20
.73
0.7
1
No
2#
NU
M!
#N
UM
!0
.29
0.1
7H
PS
-A2
#N
UM
!0
.79
0.7
90
.80
HP
S-B
20
.77
0.8
00
.81
0.8
1LE
D-E
20
.78
0.8
30
.75
0.7
3
No
3#
NU
M!
#N
UM
!0
.38
0.2
9H
PS
-A3
0.7
10
.79
0.8
10
.81
HP
S-B
30
.26
0.7
70
.82
0.8
2LE
D-E
30
.72
0.8
40
.77
0.7
5
No
4#
NU
M!
#N
UM
!0
.46
0.3
8H
PS
-A4
0.7
40
.81
0.8
20
.82
HP
S-B
4#
NU
M!
0.7
90
.83
0.8
3LE
D-E
4-5
9.7
30
.83
0.7
90
.77
No
5#
NU
M!
#N
UM
!0
.53
0.4
6H
PS
-A5
0.7
00
.83
0.8
30
.83
HP
S-B
50
.08
0.8
10
.84
0.8
4LE
D-E
50
.66
0.8
10
.80
0.7
9
No
6#
NU
M!
#N
UM
!0
.58
0.5
2H
PS
-A6
-0.1
20
.84
0.8
40
.84
HP
S-B
60
.74
0.8
10
.85
0.8
5LE
D-E
60
.75
0.8
00
.82
0.8
0
No
7#
NU
M!
#N
UM
!0
.63
0.5
8H
PS
-A7
0.5
70
.85
0.8
50
.85
HP
S-B
70
.81
0.8
20
.86
0.8
6LE
D-E
70
.79
0.8
20
.83
0.8
2
No
8#
NU
M!
#N
UM
!0
.67
0.6
3H
PS
-A8
0.7
90
.85
0.8
60
.86
HP
S-B
80
.84
0.8
40
.87
0.8
7LE
D-E
80
.83
0.8
50
.84
0.8
3
No
9#
NU
M!
#N
UM
!0
.71
0.6
7H
PS
-A9
0.8
40
.85
0.8
70
.87
HP
S-B
90
.87
0.8
60
.88
0.8
8LE
D-E
90
.85
0.8
60
.86
0.8
4
No
10
#N
UM
!#
NU
M!
0.7
50
.71
HP
S-A
10
0.8
50
.85
0.8
80
.88
HP
S-B
10
0.9
00
.90
0.8
90
.88
LED
-E1
00
.89
0.8
60
.87
0.8
5
No
11
#N
UM
!#
NU
M!
0.7
80
.74
HP
S-A
11
0.9
00
.89
0.8
90
.89
HP
S-B
11
0.8
80
.85
0.9
00
.89
LED
-E1
10
.91
0.8
80
.88
0.8
6
No
12
#N
UM
!#
NU
M!
0.8
10
.77
HP
S-A
12
0.9
10
.90
0.9
00
.89
HP
S-B
12
0.8
10
.87
0.9
00
.90
LED
-E1
20
.89
0.7
30
.89
0.8
7
No
13
#N
UM
!#
NU
M!
0.8
30
.79
HP
S-A
13
0.6
90
.71
0.9
10
.90
HP
S-B
13
0.8
90
.89
0.9
10
.90
LED
-E1
30
.39
0.8
60
.90
0.8
8
No
14
#N
UM
!#
NU
M!
0.8
60
.81
HP
S-A
14
0.8
90
.90
0.9
10
.91
HP
S-B
14
0.8
90
.90
0.9
20
.91
LED
-E1
40
.87
0.8
90
.91
0.8
9
No
15
#N
UM
!#
NU
M!
0.8
80
.83
HP
S-A
15
0.9
10
.91
0.9
20
.91
HP
S-B
15
0.8
90
.91
0.9
20
.91
LED
-E1
50
.90
0.9
10
.91
0.9
0
No
16
#N
UM
!#
NU
M!
0.9
00
.84
HP
S-A
16
0.9
10
.92
0.9
30
.92
HP
S-B
16
0.9
00
.91
0.9
30
.92
LED
-E1
60
.91
0.9
10
.92
0.9
0
No
17
#N
UM
!#
NU
M!
0.9
10
.85
HP
S-A
17
0.9
10
.92
0.9
30
.92
HP
S-B
17
0.9
20
.92
0.9
30
.92
LED
-E1
70
.92
0.9
30
.93
0.9
1
No
18
0.8
50
.84
0.9
10
.85
HP
S-A
18
0.9
10
.92
0.9
30
.92
HP
S-B
18
0.9
20
.93
0.9
30
.92
LED
-E1
80
.90
0.9
30
.93
0.9
1
No
19
0.9
20
.91
0.9
00
.85
HP
S-A
19
0.9
10
.93
0.9
30
.92
HP
S-B
19
0.9
30
.94
0.9
30
.92
LED
-E1
90
.93
0.9
40
.92
0.9
1
30
yr
old
dri
ve
r
45
yr
old
dri
ve
r

49
TABLE 4 RVP Values for No Roadway Lighting and Three Luminaires for 60-Year-Old Drivers in Suburban Locations (Continued)
Lig
hti
ng
co
nd
itio
n
C3
loca
tio
nC
1->
C3
C2
->C
3C
3->
C1
C3
->C
2L
igh
tin
g
co
nd
itio
n
C3
loca
tio
nC
1->
C3
C2
->C
3C
3->
C1
C3
->C
2L
igh
tin
g
co
nd
itio
n
C3
loca
tio
nC
1->
C3
C2
->C
3C
3->
C1
C3
->C
2L
igh
tin
g
co
nd
itio
n
C3
loca
tio
nC
1->
C3
C2
->C
3C
3->
C1
C3
->C
2
No
0#
NU
M!
#N
UM
!#
NU
M!
#N
UM
!H
PS
-A0
0.4
70
.63
0.6
90
.68
HP
S-B
00
.62
0.7
40
.68
0.6
8LE
D-E
0#
NU
M!
0.6
40
.52
0.4
6
No
1#
NU
M!
#N
UM
!#
NU
M!
#N
UM
!H
PS
-A1
0.3
70
.67
0.6
70
.67
HP
S-B
10
.75
0.7
80
.71
0.7
0LE
D-E
10
.59
0.7
40
.57
0.5
1
No
2#
NU
M!
#N
UM
!#
NU
M!
#N
UM
!H
PS
-A2
#N
UM
!0
.69
0.6
90
.70
HP
S-B
20
.66
0.7
20
.73
0.7
2LE
D-E
20
.69
0.7
70
.61
0.5
5
No
3#
NU
M!
#N
UM
!#
NU
M!
#N
UM
!H
PS
-A3
0.5
40
.69
0.7
20
.72
HP
S-B
3-0
.81
0.6
40
.75
0.7
4LE
D-E
30
.58
0.7
80
.64
0.5
9
No
4#
NU
M!
#N
UM
!#
NU
M!
#N
UM
!H
PS
-A4
0.5
90
.72
0.7
40
.74
HP
S-B
4#
NU
M!
0.6
70
.77
0.7
6LE
D-E
4#
NU
M!
0.7
60
.67
0.6
3
No
5#
NU
M!
#N
UM
!#
NU
M!
#N
UM
!H
PS
-A5
0.5
30
.75
0.7
60
.76
HP
S-B
5-1
.83
0.7
00
.79
0.7
8LE
D-E
50
.42
0.7
10
.70
0.6
6
No
6#
NU
M!
#N
UM
!#
NU
M!
#N
UM
!H
PS
-A6
-2.7
00
.77
0.7
80
.78
HP
S-B
60
.59
0.7
20
.80
0.7
9LE
D-E
60
.61
0.7
00
.73
0.6
9
No
7#
NU
M!
#N
UM
!#
NU
M!
#N
UM
!H
PS
-A7
0.2
30
.79
0.8
00
.80
HP
S-B
70
.71
0.7
40
.82
0.8
1LE
D-E
70
.68
0.7
30
.75
0.7
2
No
8#
NU
M!
#N
UM
!#
NU
M!
#N
UM
!H
PS
-A8
0.6
90
.78
0.8
20
.81
HP
S-B
80
.77
0.7
80
.83
0.8
2LE
D-E
80
.76
0.7
80
.78
0.7
5
No
9#
NU
M!
#N
UM
!#
NU
M!
#N
UM
!H
PS
-A9
0.7
80
.80
0.8
30
.83
HP
S-B
90
.83
0.8
20
.84
0.8
4LE
D-E
90
.80
0.8
20
.80
0.7
7
No
10
#N
UM
!#
NU
M!
#N
UM
!#
NU
M!
HP
S-A
10
0.7
90
.80
0.8
40
.84
HP
S-B
10
0.8
80
.87
0.8
60
.85
LED
-E1
00
.87
0.8
20
.82
0.7
9
No
11
#N
UM
!#
NU
M!
#N
UM
!#
NU
M!
HP
S-A
11
0.8
70
.86
0.8
60
.85
HP
S-B
11
0.8
50
.81
0.8
70
.86
LED
-E1
10
.89
0.8
50
.83
0.8
1
No
12
#N
UM
!#
NU
M!
-1.0
7#
NU
M!
HP
S-A
12
0.8
90
.87
0.8
70
.86
HP
S-B
12
0.7
30
.82
0.8
80
.87
LED
-E1
20
.86
0.6
10
.85
0.8
3
No
13
#N
UM
!#
NU
M!
0.5
5#
NU
M!
HP
S-A
13
0.5
30
.57
0.8
80
.87
HP
S-B
13
0.8
50
.86
0.8
90
.88
LED
-E1
3-0
.19
0.8
20
.86
0.8
4
No
14
#N
UM
!#
NU
M!
0.7
3#
NU
M!
HP
S-A
14
0.8
60
.88
0.8
90
.88
HP
S-B
14
0.8
60
.87
0.9
00
.89
LED
-E1
40
.82
0.8
60
.88
0.8
5
No
15
#N
UM
!#
NU
M!
0.8
1#
NU
M!
HP
S-A
15
0.8
80
.89
0.9
00
.89
HP
S-B
15
0.8
60
.88
0.9
10
.90
LED
-E1
50
.87
0.8
80
.89
0.8
6
No
16
#N
UM
!#
NU
M!
0.8
5#
NU
M!
HP
S-A
16
0.8
90
.90
0.9
10
.90
HP
S-B
16
0.8
70
.88
0.9
20
.90
LED
-E1
60
.89
0.8
90
.90
0.8
7
No
17
#N
UM
!#
NU
M!
0.8
8#
NU
M!
HP
S-A
17
0.8
90
.91
0.9
20
.90
HP
S-B
17
0.9
00
.91
0.9
20
.90
LED
-E1
70
.90
0.9
10
.91
0.8
8
No
18
#N
UM
!#
NU
M!
0.8
8#
NU
M!
HP
S-A
18
0.8
90
.91
0.9
20
.90
HP
S-B
18
0.9
00
.92
0.9
20
.91
LED
-E1
80
.88
0.9
20
.91
0.8
8
No
19
0.9
00
.89
0.8
5#
NU
M!
HP
S-A
19
0.8
90
.91
0.9
10
.90
HP
S-B
19
0.9
20
.93
0.9
20
.91
LED
-E1
90
.92
0.9
30
.91
0.8
8
60
yr
old
dri
ve
r

50
TABLE 5 RVP Values for No Roadway Lighting and Three Luminaires for 30- and 45-Year-Old Drivers in Urban Locations
Urb
an
2.0
lx
am
bie
nt
lig
ht
Lig
hti
ng
co
nd
itio
n
C3
loca
tio
nC
1->
C3
C2
->C
3C
3->
C1
C3
->C
2L
igh
tin
g
co
nd
itio
n
C3
loca
tio
nC
1->
C3
C2
->C
3C
3->
C1
C3
->C
2L
igh
tin
g
co
nd
itio
n
C3
loca
tio
nC
1->
C3
C2
->C
3C
3->
C1
C3
->C
2L
igh
tin
g
co
nd
itio
n
C3
loca
tio
nC
1->
C3
C2
->C
3C
3->
C1
C3
->C
2
No
00
.53
0.5
50
.72
0.7
1H
PS
-A0
0.7
90
.83
0.8
30
.83
HP
S-B
0-0
.04
0.8
50
.83
0.8
3LE
D-E
00
.74
0.8
30
.80
0.8
0
No
10
.57
0.5
90
.74
0.7
3H
PS
-A1
0.7
90
.84
0.8
30
.84
HP
S-B
1#
NU
M!
0.8
70
.84
0.8
4LE
D-E
10
.35
0.8
50
.82
0.8
1
No
20
.61
0.6
20
.76
0.7
5H
PS
-A2
0.7
70
.84
0.8
40
.85
HP
S-B
20
.44
0.8
50
.85
0.8
5LE
D-E
2-0
.33
0.8
60
.83
0.8
2
No
30
.64
0.6
60
.77
0.7
7H
PS
-A3
0.7
00
.85
0.8
50
.85
HP
S-B
30
.75
0.8
40
.86
0.8
6LE
D-E
30
.58
0.8
70
.84
0.8
3
No
40
.67
0.6
80
.79
0.7
8H
PS
-A4
0.7
20
.86
0.8
60
.86
HP
S-B
40
.78
0.8
50
.87
0.8
7LE
D-E
40
.77
0.8
70
.85
0.8
4
No
50
.70
0.7
10
.80
0.8
0H
PS
-A5
0.7
60
.87
0.8
70
.87
HP
S-B
50
.81
0.8
60
.87
0.8
7LE
D-E
50
.83
0.8
60
.86
0.8
5
No
60
.73
0.7
40
.82
0.8
1H
PS
-A6
0.8
10
.88
0.8
80
.88
HP
S-B
60
.84
0.8
60
.88
0.8
8LE
D-E
60
.85
0.8
60
.86
0.8
6
No
70
.75
0.7
60
.83
0.8
3H
PS
-A7
0.8
40
.88
0.8
80
.88
HP
S-B
70
.86
0.8
70
.89
0.8
9LE
D-E
70
.86
0.8
70
.87
0.8
7
No
80
.77
0.7
80
.84
0.8
4H
PS
-A8
0.8
70
.88
0.8
90
.89
HP
S-B
80
.88
0.8
80
.89
0.8
9LE
D-E
80
.88
0.8
80
.88
0.8
8
No
90
.79
0.8
00
.86
0.8
5H
PS
-A9
0.8
80
.89
0.9
00
.90
HP
S-B
9#
NU
M!
-0.0
90
.90
0.9
0LE
D-E
90
.89
0.8
90
.89
0.8
8
No
10
0.8
10
.81
0.8
70
.86
HP
S-A
10
0.8
90
.89
0.9
00
.90
HP
S-B
10
0.7
50
.69
0.9
10
.90
LED
-E1
00
.68
-2.8
90
.90
0.8
9
No
11
0.8
30
.83
0.8
80
.87
HP
S-A
11
0.2
4#
NU
M!
0.9
10
.91
HP
S-B
11
0.3
50
.73
0.9
10
.91
LED
-E1
10
.81
#N
UM
!0
.90
0.9
0
No
12
0.8
50
.84
0.8
90
.88
HP
S-A
12
0.6
3#
NU
M!
0.9
10
.91
HP
S-B
12
0.9
00
.90
0.9
20
.91
LED
-E1
20
.47
0.8
50
.91
0.9
0
No
13
0.8
60
.86
0.9
00
.89
HP
S-A
13
0.8
80
.90
0.9
20
.92
HP
S-B
13
0.9
10
.91
0.9
20
.92
LED
-E1
30
.90
0.9
10
.91
0.9
1
No
14
0.8
70
.87
0.9
10
.90
HP
S-A
14
0.9
20
.92
0.9
20
.92
HP
S-B
14
0.9
20
.92
0.9
30
.92
LED
-E1
40
.91
0.9
10
.92
0.9
1
No
15
0.8
90
.88
0.9
20
.90
HP
S-A
15
0.9
20
.92
0.9
30
.92
HP
S-B
15
0.9
20
.92
0.9
30
.93
LED
-E1
50
.92
0.9
20
.93
0.9
2
No
16
0.9
00
.89
0.9
20
.91
HP
S-A
16
0.9
30
.93
0.9
30
.93
HP
S-B
16
0.9
20
.92
0.9
30
.93
LED
-E1
60
.93
0.9
30
.93
0.9
2
No
17
0.9
10
.90
0.9
30
.91
HP
S-A
17
0.9
30
.93
0.9
40
.93
HP
S-B
17
0.9
30
.93
0.9
40
.93
LED
-E1
70
.93
0.9
30
.93
0.9
2
No
18
0.9
20
.91
0.9
30
.91
HP
S-A
18
0.9
30
.93
0.9
40
.93
HP
S-B
18
0.9
30
.94
0.9
40
.93
LED
-E1
80
.93
0.9
40
.93
0.9
2
No
19
0.9
30
.93
0.9
30
.91
HP
S-A
19
0.9
30
.93
0.9
30
.93
HP
S-B
19
0.9
30
.94
0.9
40
.93
LED
-E1
90
.94
0.9
40
.93
0.9
2
Lig
hti
ng
co
nd
itio
n
C3
loca
tio
nC
1->
C3
C2
->C
3C
3->
C1
C3
->C
2L
igh
tin
g
co
nd
itio
n
C3
loca
tio
nC
1->
C3
C2
->C
3C
3->
C1
C3
->C
2L
igh
tin
g
co
nd
itio
n
C3
loca
tio
nC
1->
C3
C2
->C
3C
3->
C1
C3
->C
2L
igh
tin
g
co
nd
itio
n
C3
loca
tio
nC
1->
C3
C2
->C
3C
3->
C1
C3
->C
2
No
00
.23
0.2
70
.61
0.6
1H
PS
-A0
0.7
40
.79
0.8
00
.80
HP
S-B
0-0
.65
0.8
30
.80
0.8
0LE
D-E
00
.67
0.7
90
.76
0.7
4
No
10
.32
0.3
50
.65
0.6
4H
PS
-A1
0.7
40
.80
0.8
00
.80
HP
S-B
1#
NU
M!
0.8
50
.81
0.8
1LE
D-E
10
.10
0.8
30
.77
0.7
6
No
20
.40
0.4
20
.67
0.6
7H
PS
-A2
0.7
10
.81
0.8
10
.82
HP
S-B
20
.24
0.8
20
.82
0.8
2LE
D-E
2-1
.30
0.8
40
.79
0.7
8
No
30
.46
0.4
90
.70
0.6
9H
PS
-A3
0.6
20
.82
0.8
20
.83
HP
S-B
30
.69
0.8
00
.83
0.8
3LE
D-E
30
.46
0.8
50
.80
0.7
9
No
40
.52
0.5
40
.73
0.7
2H
PS
-A4
0.6
50
.83
0.8
30
.84
HP
S-B
40
.73
0.8
20
.84
0.8
4LE
D-E
40
.72
0.8
40
.81
0.8
1
No
50
.57
0.5
90
.75
0.7
4H
PS
-A5
0.7
00
.84
0.8
50
.85
HP
S-B
50
.77
0.8
30
.85
0.8
5LE
D-E
50
.79
0.8
30
.83
0.8
2
No
60
.62
0.6
30
.77
0.7
6H
PS
-A6
0.7
60
.85
0.8
60
.86
HP
S-B
60
.81
0.8
40
.86
0.8
6LE
D-E
60
.81
0.8
30
.84
0.8
3
No
70
.66
0.6
60
.79
0.7
8H
PS
-A7
0.8
10
.86
0.8
60
.87
HP
S-B
70
.84
0.8
50
.87
0.8
7LE
D-E
70
.83
0.8
40
.85
0.8
4
No
80
.69
0.7
00
.81
0.8
0H
PS
-A8
0.8
40
.86
0.8
70
.87
HP
S-B
80
.86
0.8
60
.88
0.8
8LE
D-E
80
.86
0.8
60
.86
0.8
5
No
90
.72
0.7
30
.82
0.8
1H
PS
-A9
0.8
70
.87
0.8
80
.88
HP
S-B
9#
NU
M!
-0.7
00
.89
0.8
8LE
D-E
90
.87
0.8
80
.87
0.8
6
No
10
0.7
50
.75
0.8
40
.83
HP
S-A
10
0.8
80
.88
0.8
90
.89
HP
S-B
10
0.7
00
.63
0.8
90
.89
LED
-E1
00
.61
-73
.52
0.8
80
.87
No
11
0.7
80
.78
0.8
50
.84
HP
S-A
11
-0.0
6#
NU
M!
0.9
00
.90
HP
S-B
11
0.1
20
.67
0.9
00
.90
LED
-E1
10
.78
#N
UM
!0
.89
0.8
8
No
12
0.8
00
.80
0.8
70
.86
HP
S-A
12
0.5
4#
NU
M!
0.9
00
.90
HP
S-B
12
0.8
80
.89
0.9
10
.90
LED
-E1
20
.31
0.8
20
.90
0.8
9
No
13
0.8
20
.82
0.8
80
.87
HP
S-A
13
0.8
60
.88
0.9
10
.91
HP
S-B
13
0.9
00
.90
0.9
10
.91
LED
-E1
30
.88
0.8
90
.90
0.9
0
No
14
0.8
40
.83
0.8
90
.88
HP
S-A
14
0.9
10
.91
0.9
20
.91
HP
S-B
14
0.9
10
.91
0.9
20
.91
LED
-E1
40
.90
0.9
00
.91
0.9
0
No
15
0.8
60
.85
0.9
00
.89
HP
S-A
15
0.9
10
.92
0.9
20
.92
HP
S-B
15
0.9
10
.91
0.9
20
.92
LED
-E1
50
.91
0.9
10
.92
0.9
1
No
16
0.8
80
.86
0.9
10
.89
HP
S-A
16
0.9
20
.92
0.9
30
.92
HP
S-B
16
0.9
20
.92
0.9
30
.92
LED
-E1
60
.92
0.9
20
.92
0.9
1
No
17
0.8
90
.88
0.9
20
.90
HP
S-A
17
0.9
20
.93
0.9
30
.92
HP
S-B
17
0.9
30
.93
0.9
30
.92
LED
-E1
70
.93
0.9
30
.93
0.9
2
No
18
0.9
10
.90
0.9
20
.90
HP
S-A
18
0.9
20
.93
0.9
30
.92
HP
S-B
18
0.9
30
.93
0.9
30
.93
LED
-E1
80
.92
0.9
30
.93
0.9
2
No
19
0.9
20
.92
0.9
20
.90
HP
S-A
19
0.9
20
.93
0.9
30
.92
HP
S-B
19
0.9
30
.94
0.9
30
.92
LED
-E1
90
.93
0.9
40
.93
0.9
2
30
yr
old
dri
ve
r
45
yr
old
dri
ve
r

51
TABLE 5 RVP Values for No Roadway Lighting and Three Luminaires for 60-Year-Old Drivers in Urban Locations (Continued)
Lig
hti
ng
co
nd
itio
n
C3
loca
tio
nC
1->
C3
C2
->C
3C
3->
C1
C3
->C
2L
igh
tin
g
co
nd
itio
n
C3
loca
tio
nC
1->
C3
C2
->C
3C
3->
C1
C3
->C
2L
igh
tin
g
co
nd
itio
n
C3
loca
tio
nC
1->
C3
C2
->C
3C
3->
C1
C3
->C
2L
igh
tin
g
co
nd
itio
n
C3
loca
tio
nC
1->
C3
C2
->C
3C
3->
C1
C3
->C
2
No
0#
NU
M!
#N
UM
!0
.15
0.1
0H
PS
-A0
0.6
00
.68
0.7
20
.72
HP
S-B
0-7
.38
0.7
60
.71
0.7
1LE
D-E
00
.47
0.6
90
.62
0.5
9
No
1#
NU
M!
#N
UM
!0
.26
0.2
2H
PS
-A1
0.6
10
.71
0.7
10
.72
HP
S-B
1#
NU
M!
0.7
90
.74
0.7
3LE
D-E
1-1
.00
0.7
60
.65
0.6
3
No
2#
NU
M!
#N
UM
!0
.35
0.3
2H
PS
-A2
0.5
40
.73
0.7
30
.74
HP
S-B
2-0
.55
0.7
50
.75
0.7
5LE
D-E
2#
NU
M!
0.7
80
.68
0.6
6
No
3#
NU
M!
#N
UM
!0
.43
0.4
0H
PS
-A3
0.3
70
.74
0.7
50
.76
HP
S-B
30
.49
0.7
10
.77
0.7
7LE
D-E
30
.06
0.7
90
.71
0.6
9
No
4#
NU
M!
#N
UM
!0
.50
0.4
7H
PS
-A4
0.4
30
.76
0.7
70
.77
HP
S-B
40
.58
0.7
30
.79
0.7
8LE
D-E
40
.59
0.7
80
.73
0.7
1
No
5#
NU
M!
#N
UM
!0
.55
0.5
3H
PS
-A5
0.5
40
.78
0.7
90
.79
HP
S-B
50
.65
0.7
50
.80
0.8
0LE
D-E
50
.70
0.7
60
.75
0.7
3
No
6#
NU
M!
#N
UM
!0
.60
0.5
8H
PS
-A6
0.6
50
.80
0.8
00
.80
HP
S-B
60
.72
0.7
70
.82
0.8
1LE
D-E
60
.73
0.7
60
.77
0.7
6
No
7-4
.77
-3.0
50
.65
0.6
3H
PS
-A7
0.7
30
.81
0.8
20
.82
HP
S-B
70
.77
0.7
90
.83
0.8
3LE
D-E
70
.76
0.7
80
.79
0.7
8
No
8-1
.05
-0.8
20
.69
0.6
7H
PS
-A8
0.7
80
.81
0.8
30
.83
HP
S-B
80
.81
0.8
20
.84
0.8
4LE
D-E
80
.80
0.8
20
.81
0.7
9
No
9-0
.21
-0.1
40
.72
0.7
0H
PS
-A9
0.8
20
.83
0.8
50
.84
HP
S-B
9#
NU
M!
-6.0
10
.86
0.8
5LE
D-E
90
.84
0.8
50
.82
0.8
1
No
10
0.1
70
.18
0.7
50
.73
HP
S-A
10
0.8
40
.84
0.8
60
.86
HP
S-B
10
0.5
80
.45
0.8
70
.86
LED
-E1
00
.43
#N
UM
!0
.84
0.8
3
No
11
0.3
80
.37
0.7
80
.76
HP
S-A
11
-1.3
5#
NU
M!
0.8
70
.87
HP
S-B
11
-0.7
70
.52
0.8
80
.87
LED
-E1
10
.71
#N
UM
!0
.85
0.8
4
No
12
0.5
20
.50
0.8
10
.78
HP
S-A
12
0.2
8#
NU
M!
0.8
80
.88
HP
S-B
12
0.8
50
.86
0.8
90
.88
LED
-E1
2-0
.23
0.7
60
.87
0.8
5
No
13
0.6
10
.59
0.8
30
.80
HP
S-A
13
0.8
20
.85
0.8
90
.88
HP
S-B
13
0.8
70
.88
0.9
00
.89
LED
-E1
30
.85
0.8
70
.88
0.8
6
No
14
0.6
80
.65
0.8
50
.82
HP
S-A
14
0.8
80
.89
0.9
00
.89
HP
S-B
14
0.8
80
.88
0.9
00
.90
LED
-E1
40
.87
0.8
80
.89
0.8
7
No
15
0.7
40
.70
0.8
70
.84
HP
S-A
15
0.9
00
.90
0.9
10
.90
HP
S-B
15
0.8
90
.89
0.9
10
.90
LED
-E1
50
.89
0.8
90
.90
0.8
8
No
16
0.7
80
.74
0.8
90
.85
HP
S-A
16
0.9
00
.90
0.9
20
.90
HP
S-B
16
0.8
90
.90
0.9
20
.91
LED
-E1
60
.90
0.9
00
.91
0.8
9
No
17
0.8
30
.81
0.9
00
.86
HP
S-A
17
0.9
10
.91
0.9
20
.91
HP
S-B
17
0.9
10
.91
0.9
20
.91
LED
-E1
70
.91
0.9
20
.92
0.8
9
No
18
0.8
70
.86
0.9
00
.86
HP
S-A
18
0.9
10
.91
0.9
20
.91
HP
S-B
18
0.9
10
.92
0.9
20
.91
LED
-E1
80
.91
0.9
20
.92
0.9
0
No
19
0.9
10
.90
0.8
90
.86
HP
S-A
19
0.9
10
.92
0.9
20
.91
HP
S-B
19
0.9
20
.93
0.9
20
.91
LED
-E1
90
.92
0.9
30
.91
0.9
0
60
yr
old
dri
ve
r

52
TABLE 6 ∆RVP Values Associated with Each Luminaire Type for Suburban and Urban Roadway Intersections
Ambient Area
Roadway Location
∆RVP Value
Luminaire HPS-A Luminaire HPS-B Luminaire LED-E
Suburban Area Near (low speeds) +1.56 +1.65 +1.42 Far (high speeds) +1.18 +1.39 +1.13
Urban Area Near (low speeds) +0.50 +0.57 +0.40 Far (high speeds) +1.07 +0.98 +0.89
The data in Table 6 generally support the notion that the luminaire with the lowest directly downward light distribution (collector luminaire HPS-B) tended to have the largest visual performance increases under most of the scenario types evaluated. Bullough et al. (2013) estimated that each one-point increase in RVP score (∆RVP values) associated with roadway intersection lighting corresponded to a reduction in the night-to-day crash ratio of 7.2%. The average visual performance increase for low speed roads in suburban locations is +1.54 RVP score units, corresponding to an 11% reduction in the night-to-day crash ratio. The average visual performance increase for high speed roads in suburban locations is +1.23 RVP score units, corresponding to a 9% reduction in the night-to-day crash ratio. For urban locations, RVP score increases are somewhat lower because ambient light is available to provide some level of visual performance even when no roadway lighting is present. The average visual performance increase for low speed roads in urban locations is +0.49 RVP score units, corresponding to a 3.5% reduction in the night-to-day crash ratio. The average visual performance increase for high speed roads in urban locations is +0.98 RVP score units, corresponding to a 7% reduction in the night-to-day crash ratio. The average apparent benefit of the luminaire with the lowest relative downward flux distribution (HPS-B) is 0.07 to 0.19 RVP units over the other two luminaires evaluated. This would correspond to a net safety benefit (in terms of a reduction in the night-to-day crash ratio) of 0.5% to 1.3%, a modest but not inconsequential difference when considering the economic costs associated with nighttime crashes (Bullough and Rea, 2011).
53
CHAPTER 4 CONCLUSIONS, RECOMMENDATIONS AND FUTURE RESEARCH CONCLUSIONS Based on the information reviewed for this project and the performance analyses that were conducted to compare roadway lighting systems using different light source technologies, it appears that for LED technologies in particular, efficiency and photometric performance have evolved in recent years to the point that LED roadway lighting is presently a feasible choice and can often lead to reductions in energy use of around 15% or greater, or life-cycle cost reductions in the long term, depending upon the initial cost of LED luminaires. However, specific luminaires using LED sources can have a wide range of performance, and should be judged on an individual luminaire basis. RECOMMENDATIONS The results of the analyses presented in the previous chapter also lead to several recommendations of metrics for comparing the performance of luminaires for roadway lighting that use different light source technologies, which could be included in recommendations promulgated by AASHTO, IES or state transportation agencies. In addition, gaps in the available data suggest additional metrics that might be useful in evaluating the performance of roadway lighting systems with respect to their impacts on pedestrians. Luminaire System Application Efficacy The use of the luminaire system application efficacy (LSAE) metric (Freyssinier and Radetsky, 2011) to evaluate the relative ability of lighting systems to direct light onto the roadway surface in an efficient manner could be a useful metric in comparing and evaluating the influence of not only luminaire type but also luminaire mounting height on performance. As the data in Figures 1 through 23 indicate, each of the luminaires that were evaluated had somewhat different optimal mounting heights to maximize LSAE. When considering among choices for new highway lighting installations, using LSAE can allow the user to compare among lighting systems with different mounting heights. Discomfort Glare Existing roadway lighting specifications (IES, 2000) specify upper limits for disability glare in terms of the maximum allowable veiling luminance. The veiling luminance represents the effect of scattered light in the eye from a bright light source (i.e., a streetlight) in the field of view, which reduces contrast of objects in and along the roadway. Disability glare is a distinct mechanism from discomfort glare, which is the annoying or painful sensation that can accompany a bright light in the field of view (Rea, 2000). Discomfort glare can influence driving behavior, such as by increasing throttle variability when driving (Bullough and Van Derlofske, 2005) or increasing the frequency of head movements (Bullough et al., 2008).

54
The analyses of roadway luminaires in Figures 1 through 23 provide an estimate of discomfort glare ratings (on the De Boer [1967]) scale when looking toward each of the luminaires. These analyses do not, however, take into account the spectral distribution of the light sources used in each of the luminaires that were evaluated; instead the discomfort glare rating predictions are based on conventional (photopic) photometry. Discomfort glare is impacted by the spectrum of the light source, so that the “bluer” light from LED or other “white” light sources relative to HPS will be judged as producing more discomfort even if the illuminance at an observer’s eyes is the same. Bullough (2009) describes a preliminary model for spectral sensitivity of discomfort glare under nighttime viewing conditions, wavelengths shorter than around 480 nm (“blue” light) is given higher weighting. Figure 24 shows the relative discomfort glare from HPS, MH, LED (7500 K correlated color temperature [CCT]) and a fluorescent induction lamp (4100 K CCT).
FIGURE 24 Relative discomfort glare (at equal luminous intensity) of several light sources.
Mesopic Photometry The Commission International de l’Eclairage (CIE, 2010) has published an internationally-recognized system of photometry that combines the photopic and scotopic luminous efficiency functions at luminances between 0.01 and 5 cd/m2. Presently the IES (2000) recommendations for roadway lighting do not incorporate mesopic photometry into the recommend light level values. Application committees of the IES are exploring if and how to do so. Brightness Perception Driver visibility is an important consideration for roadway lighting, but not necessarily the only one. The visual needs of pedestrians can also be important in certain locations. The sense of security provided by roadway lighting has been shown to be strongly correlated with the impressions of brightness of the field of view under the illumination source (Rea et al., 2009). Importantly, brightness perception also has a dependence upon the spectral distribution of the light source (Rea et al., 2011). In a similar manner as for discomfort glare perception, brightness perception of lighted roadway scenes has greater short-wavelength (“blue” light) spectral sensitivity than predicted by conventional (photopic) photometric quantities. Provision of

55
brightness in pedestrian-used environments might be leveraged by light sources such as LEDs, MH lamps or induction lamps, which tend to have substantially greater short-wavelength output than HPS lamps. Increased brightness should be carefully weighed against the potential for increased discomfort glare, however. Visual Performance
The visual performance analyses performed in the previous chapter of this report were based on the methodology developed by Rea et al. (2010). Unlike the visibility-based method of roadway lighting specification described by IES (2000) using small target visibility (STV), the method described here includes the effects of vehicle headlamps both as illuminants and as potential disability glare sources in the roadway environment. The method also seems to be a useful way to discriminate among individual luminaire types for specific roadway locations. FUTURE RESEARCH In all of the performance analyses conducted in the present study, the criteria specified by IES (2000) RP-8 in terms of light level, uniformity and veiling luminance were met. It is not entirely clear, however, how critical each of these criteria may be in terms of safety-related performance. Bullough et al. (2013) compared visibility coverage areas determined using a method like the one used in the previous chapter, to statistical models of nighttime crashes for various roadway location types and found positive correlations between visibility improvements and nighttime crash reductions.
The resulting transfer function between visibility and nighttime crash safety, of course, must be validated further for a wide array of roadway types and locations, but it is consistent with the chain of logic that suggests one of the primary safety benefits of roadway lighting is the increase in figure/ground visual information that in turn provides drivers with increased time to respond to hazardous situations. Bullough and Rea (2011) used the transfer function to assess adaptive roadway lighting control strategies to determine if the safety benefits of roadway lighting could be optimized by allocating lighting to time periods with greater traffic volumes. Nighttime traffic volume is not uniform throughout the night (Figure 25). Providing higher light levels during busier times of the night, where they would improve visual performance relative to less buy times, could result in equivalent energy use and operating costs as a constant intermediate light level throughout the night, but could increase nighttime safety in terms of the economic value of more crashes avoided at night (Bullough and Rea, 2011). Case studies and safety data to evaluate such lighting approaches are needed.
Finally, all of the research undertaken in the present study has treated roadway lighting as it is commonly practiced – namely, as fixed, pole-mounted luminaires typically mounted 20 to 40 ft above the road. Recent investigations of low-level illumination systems for locations like pedestrian crosswalks (Zhang, 2009) and roundabouts (Bullough et al., 2012b) might provide additional opportunities to save energy and improve visual guidance and information from roadway illumination.

56
REFERENCES Akashi Y, Morante P, Rea MS. 2005. An energy-efficient street lighting demonstration based upon the unified system of photometry. CIE Symposium on Vision and Lighting in Mesopic Conditions, Leon, Spain.
Akashi Y, Rea MS, Bullough JD. 2007. Driver decision making in response to peripheral moving targets under mesopic light levels. Lighting Research and Technology 39(1): 53-67.
American Association of State Highway and Transportation Officials. 2004. A Policy on Geometric Design of Highways and Streets. Washington, DC: American Association of State Highway and Transportation Officials.
American Association of State Highway and Transportation Officials. 2005a. Roadway Lighting Design Guide. Washington, DC: American Association of State Highway and Transportation Officials.
American Association of State Highway and Transportation Officials. 2005b. Rural Emergency Medical Services, NCHRP 17-18(3). Washington, DC: American Association of State Highway and Transportation Officials.
Beckwith D, Zhang X, Smalley E, Chan L, Yand M. 2011. LED streetlight application assessment project: Pilot study in Seattle, Washington. Transportation Research Record (2250): 65-75.
Belcher MC, Kettering Klein A, Gadberry B. 1999. User survey of subjective preference for street-lighting sources. Journal of Architectural Engineering 5(3): 92-97.
Brons JA, Bullough JD, Rea MS. 2008. Outdoor site-lighting performance: A comprehensive and quantitative framework for assessing light pollution. Lighting Research and Technology 40(3): 201-224.
Brons JA. 2009. Field Test DELTA: Post-Top Photovoltaic Pathway Luminaire. Troy, NY: Lighting Research Center, Rensselaer Polytechnic Institute.
Brons JA. 2010. Field Test DELTA Snapshots: LED Street Lighting. Troy, NY: Lighting Research Center, Rensselaer Polytechnic Institute.
Bullough JD, Brons JA, Qi R, Rea MS. 2008. Predicting discomfort glare from outdoor lighting installations. Lighting Research and Technology 40(3): 225-242.
Bullough JD, Donnell ET, Rea MS. 2013. To illuminate or not to illuminate: Roadway lighting as it affects traffic safety at intersections. Accident Analysis and Prevention 53(1): 65-77.
Bullough JD, Radetsky LC, Rea MS. 2011. Testing a model of scene brightness with and without objects of different colours. Lighting Research and Technology 43(2): 173-184.

57
Bullough JD, Rea MS, Zhang X. 2012a. Evaluation of visual performance from pedestrian crosswalk lighting. Transportation Research Board 91st Annual Meeting, Washington, DC, January 22-26. Washington, DC: Transportation Research Board.
Bullough JD, Rea MS, Snyder JD, Skinner NP, Capo RI, Rizzo P, Besenecker U. 2012b. Demonstration of Roundabout Lighting Based on the Ecoluminance Approach, C-08-03/18233. Albany, NY: New York State Department of Transportation.
Bullough JD, Rea MS. 2000. Simulated driving performance and peripheral detection at mesopic and low photopic light levels. Lighting Research and Technology 32(4): 194-198.
Bullough JD, Rea MS. 2004. Visual performance under mesopic conditions: Consequences for roadway lighting. Transportation Research Record (1862): 89-94.
Bullough JD, Rea MS. 2008. Innovative, Energy-Efficient Lighting for New York State Roadways: Opportunities for Incorporating Mesopic Visibility Considerations Into Roadway Lighting Practice [report to the New York State Energy Research and Development Authority and the New York State Department of Transportation]. Troy, NY: Lighting Research Center, Rensselaer Polytechnic Institute.
Bullough JD, Rea MS. 2011. Intelligent control of roadway lighting to optimize safety benefits per overall costs. 14th Institute of Electrical and Electronics Engineers Conference on Intelligent Transportation Systems (pp. 968-972), Washington, DC, October 5-7. New York, NY: Institute of Electrical and Electronics Engineers.
Bullough JD, Skinner NP, Pysar RP, Radetsky LC, Smith AM, Rea MS. 2008. Nighttime Glare and Driving Performance: Research Findings, DOT HS 811 043. Washington, DC: National Highway Traffic Safety Administration.
Bullough JD, Skinner NP. 2009. Predicting stopping distances under different types of headlamp illumination. 8th International Symposium on Automotive Lighting (pp. 733-740), Darmstadt, Germany, September 29-30. Munchen, Germany: Herbert Utz Verlag.
Bullough JD, Skinner NP. 2012. Vehicle lighting and modern roundabouts: Implications for pedestrian safety. Society of Automotive Engineers International Journal of Passenger Cars - Mechanical Systems 5(1): 195-198.
Bullough JD, Van Derlofske J. 2005. Methods for assessing the impact of oncoming glare on driving behavior. Society of Automotive Engineers 2005 World Congress, Detroit, MI, April 11-14. In Lighting Technology and Human Factors (pp. 21-26), SP-1932. Warrendale, PA: Society of Automotive Engineers.
Bullough JD. 2009. Spectral sensitivity for extrafoveal discomfort glare. Journal of Modern Optics 56(13): 1518-1522.

58
Bullough JD. 2012. Guide for Optimizing the Effectiveness and Efficiency of Roadway Lighting, C-10-14 [report to the New York State Energy Research and Development Authority and the New York State Department of Transportation]. Albany, NY: New York State Department of Transportation.
Carter DK, Quick S, Danes S, Gatti E, Branick K, Limauro C, Popowich C, Orfield S, Role MR. 2011. LED Street Light Research Project. Pittsburgh, PA: Carnegie Mellon University.
City of Los Angeles Bureau of Street Lighting. 2009. LED Equipment Evaluation: Pilot Project –Phase I. Los Angeles, CA: City of Los Angeles Bureau of Street Lighting.
City of Sunnyvale and De Anza College. 2009. LED Street Lighting: Sunnyvale, CA. Sunnyvale, CA: City of Sunnyvale.
Commission Internationale de l'Eclairage. 2010. Recommended System for Mesopic Photometry Based on Visual Performance, CIE 191:2010. Vienna, Austria: Commission Internationale de l'Eclairage.
Cook T, Shackelford J, Pang T. 2008. LED Street Lighting: San Francisco, CA. San Francisco, CA: Pacific Gas and Electric.
Cook T, Shackleford J, Johnson M, Pang T. 2008. LED Street Lighting, Phase III Continuation: Oakland, CA. San Francisco, CA: Pacific Gas and Electric Company.
Cook T, Sommer A, Pang T. 2008. LED Street Lighting: Oakland, CA. San Francisco, CA: Pacific Gas and Electric.
Dale AT, Bilec MM, Marriott J, Hartley D, Jurgens C, Zatcoff E. 2011. Preliminary comparative life-cycle impacts of streetlight technology. Journal of Infrastructure Systems 17(4): 193-199.
Dangeti M. 2010. Comparative Data Evaluation of Mercury Vapor/High Pressure Sodium and Induction Street Lighting. Las Vegas, NV: Clark County Department of Public Works.
De Boer J. 1967. Public Lighting. Eindhoven, Netherlands: Philips Technical Library.
Federal Highway Administration. 2005a. Barrier Guide for Low Volume and Low Speed Roads, FHWA-CFL/TD-05-009. Washington, DC: Federal Highway Administration.
Federal Highway Administration. 2005b. University Course on Bicycle and Pedestrian Transportation, FHWA-HRT-05-085. Washington, DC: Federal Highway Administration.
Federal Highway Administration. 2007. Railroad-Highway Grade Crossing Handbook, Second Edition, FHWA-SA-07-010. Washington, DC: Federal Highway Administration.
Florida Department of Transportation. 2007. Median Handbook. Tallahassee, FL: Florida Department of Transportation.

59
Fotios SA, Cheal C. 2007. Lighting for subsidiary streets: investigation of lamps of different SPD: Part 1 - Visual performance, Part 2 - Brightness. Lighting Research and Technology 39(3): 215-252.
Freyssinier JP, Radetsky LC. 2011. ASSIST Recommends: Recommendations for Evaluating Street and Roadway Luminaires. Troy, NY: Rensselaer Polytechnic Institute.
Fry GA. 1954. Evaluating disability effects of approaching automobile headlights. Highway Research Bulletin (89): 38-42.
Gibbons RB, Edwards CJ, Clanton N, Mutmansky M. 2010. Alternative lighting evaluations in municipality of Anchorage. Transportation Research Board 89th Annual Meeting, January 10-14, 2010, Washington, DC.
Goodman T, Forbes A, Walkey H, Eloholma M, Halonen L, Alferdinck J, Freiding A, Bodrogi P, Varady G, Szalmas A. 2007. Mesopic visual efficiency IV: A model with relevance to nighttime driving and other applications. Lighting Research and Technology 39(4): 365–392.
He Y, Rea MS, Bierman A, Bullough JD. 1997. Evaluating light source efficacy under mesopic conditions using reaction times. Journal of the Illuminating Engineering Society 26(1): 125-138.
Henderson RL. 2009. LED Street Lighting Test Project Report. Raleigh, NC: Progress Energy Carolinas.
Illuminating Engineering Society. 2000. American National Standard Practice for Roadway Lighting, RP-8-00. New York, NY: Illuminating Engineering Society.
Illuminating Engineering Society. 2012. Spectral Effects of Lighting on Visual Performance at Mesopic Lighting Levels, TM-12-12. New York, NY: Illuminating Engineering Society.
Johnson Controls. 2010. Stevens Point LED Street Light Project Final Report. Madison, WI: Wisconsin Energy Conservation Corporation.
Kentucky Transportation Cabinet. 2006. Intersections: General Design Considerations and Objectives, HD-901. Frankfort, KY: Kentucky Transportation Cabinet.
Kinzey BR, Myer MA. 2009. Demonstration Assessment of LED Roadway Lighting: I-35W Bridge, Minneapolis, Minnesota. Richland, WA: Pacific Northwest Laboratory.
Kinzey BR, Myer MA. 2009. Demonstration Assessment of LED Street Lighting: Lija Loop, Portland, Oregon. Richland, WA: Pacific Northwest Laboratory.
Kostica M, Djokicb L, Pojatara D, Strbac-Hadzibegovica N. 2009. Technical and economic analysis of road lighting solutions based on mesopic vision. Building and Environment 44(1): 66-75.
60
Maryland State Highway Administration. 2007. Highway Policies and Procedures Manual, D-92-02TS. Annapolis, MD: Maryland State Highway Administration.
Minnesota Department of Transportation. 2007. Bridge Railings, 5-392.204. St. Paul, MN: Minnesota Department of Transportation.
Morante P, Akashi Y, Rea M, Brons J, Bullough JD. 2007. Demonstration and Evaluation of Fluorescent Outdoor Lighting in the City of Austin, Texas [report to Austin Energy]. Troy, NY: Lighting Research Center, Rensselaer Polytechnic Institute.
Morante P. 2008. Mesopic Street Lighting Demonstration and Evaluation: Final Report [report to Groton Utilities]. Troy, NY: Lighting Research Center, Rensselaer Polytechnic Institute.
Mutmansky M, Givler T, Clanton N, Edwards C, Lee A. 2009. Street Lighting Survey for Commercial Areas in the Municipality of Anchorage. Boulder, CO: Clanton and Associates.
Mutmansky M, Givler T, Garcia J, Clanton N, Gibbons R, Edwards C, DeJean D, Cartier T, Hudson C. 2010. Advanced Street Lighting Technologies Assessment Project: City of San Diego. San Diego, CA: San Diego Gas and Electric.
Mutmansky M, Givler T, Garcia J, Clanton N, Gibbons R, Edwards C. 2010. Advanced Street Lighting Technologies Assessment Project: City of San Jose. San Jose, CA: City of San Jose.
Myer MA, Hazra O, Kinzey BR. 2011. Demonstration Assessment of LED Roadway Lighting on the FDR Drive in New York, New York. Richland, WA: Pacific Northwest Laboratory.
Myer MA, Kinzey BR, C Tam. 2010. Demonstration Assessment of LED Roadway Lighting on Residential and Commercial Streets in Palo Alto, California. Richland, WA: Pacific Northwest Laboratory.
Pacific Northwest National Laboratory. 2009. CALiPER Summary Report: Round 7 of Product Testing. Washington, DC: Department of Energy.
Pacific Northwest National Laboratory. 2010. CALiPER Summary Report: Round 7 of Product Testing. Washington, DC: Department of Energy.
Radetsky LC. 2010. Specifier Reports: Streetlights for Collector Roads. Troy, NY: National Lighting Product Information Program, Rensselaer Polytechnic Institute.
Radetsky LC. 2011. Specifier Reports: Streetlights for Local Roads. Troy, NY: National Lighting Product Information Program, Rensselaer Polytechnic Institute.
Rea G. 2011. Using Light Emitting Plasma Technology and Advanced Control Methods to Replace 400W Streetlights. Scottsburg, IN: Stray Light Optical Technologies.

61
Rea M, Bierman A, McGowan T, Dickey F, Havard J. 1997. A field test comparing the effectiveness of metal halide and high pressure sodium illuminants under mesopic conditions. Proceedings of Visual Scales: Photometric and Colorimetric Aspects. Vienna: Commission Internationale de l'Éclairage.
Rea MS, Bullough JD, Akashi Y. 2009. Several views of metal halide and high pressure sodium lighting for outdoor applications. Lighting Research and Technology 41(4): 297-320.
Rea MS, Bullough JD, Freyssinier-Nova JP, Bierman A. 2004. A proposed unified system of photometry. Lighting Research and Technology 36(2): 85-111.
Rea MS, Bullough JD, Zhou Y. 2010. A method for assessing the visibility benefits of roadway lighting. Lighting Research and Technology 42(2): 215-241.
Rea MS, Bullough JD. 2007. Making the move to a unified system of photometry. Lighting Research and Technology 39(4): 393-408.
Rea MS, Freyssinier JP. 2009. ASSIST Recommends: Visual Efficacy [report to Alliance for Solid State Illumination Systems and Technologies]. Troy, NY: Lighting Research Center, Rensselaer Polytechnic Institute.
Rea MS, Ouellette MJ. 1991. Relative visual performance: A basis for application. Lighting Research and Technology 23(3): 135-144.
Rea MS, Radetsky LC, Bullough JD. 2011. Toward a model of outdoor lighting scene brightness. Lighting Research and Technology 43(1): 7-30.
Royer MP, Poplawski ME, Tuenge JR. 2012. Demonstration Assessment of LED Roadway Lighting: NE Cully Boulevard, Portend, OR. Richland, WA: Pacific Northwest National Laboratory.
Sivak M, Schoettle B, Minoda T, Flannagan MJ. 2005. Short-wavelength content of LED headlamps and discomfort glare. Leukos 2(2): 145-154.
Tuenge JR, Bryan MM, Bisbee DA. 2011. Assessment of LED Technology in Ornamental Post-Top Luminaires: Sacramento, CA. Richland, WA: Pacific Northwest Laboratory.
Utah Department of Transportation. 2007. Standard Specifications for Road and Bridge Construction. Salt Lake City, UT: Utah Department of Transportation.
Ylinen A-M, Tahkamo L, Puolakka M, Halonen L. 2011. Road lighting quality, energy efficiency, and mesopic design: LED street lighting case study. Leukos 8(1): 9-24.
Zhang X. 2009. Evaluation of Approaches to Crosswalk Lighting Design [M.S. thesis]. Troy, NY: Rensselaer Polytechnic Institute.