project name: financing review september 2016
TRANSCRIPT

FINANCIAL ANALYSIS
1 | Page
Project Name: Financing Review September 2016

FINANCIAL ANALYSIS
2 | Page
CONTENTS
EXECUTIVE SUMMARY ...................................................................................................... 6
INTRODUCTION & BACKGROUND ................................................................................... 12
1 Introduction & Background ........................................................................................... 12
1.1 Purpose of Document / Scope .............................................................................. 12 1.2 Scope – Overall City Impacts, not Just JPACF ..................................................... 12 1.3 Out of Scope ......................................................................................................... 12 1.4 Disclaimer ............................................................................................................. 13
2 Key Reference Points & Research ............................................................................... 14
2.1 Local Government Act 1995 .................................................................................. 14 2.2 City of Joondalup Positioning Statement on Sustainable Borrowings .................... 14 2.3 Guiding Principles – 20 Year Strategic Financial Plan ........................................... 14 2.4 Strategic Community Plan ..................................................................................... 15 2.5 ACELG (Australian Centre of Excellence for Local Government) .......................... 15 2.6 West Australian Treasury Corporation (WATC) ..................................................... 16 2.7 Terminology .......................................................................................................... 16
OPTION EVALUATION ....................................................................................................... 18
3 Baseline & Key Assumptions ....................................................................................... 18
3.1 Adopted 20 Year Strategic Financial Plan (June 2016) ......................................... 18 3.2 Restated SFP based on Reduced Tamala Park Land Sales ................................. 18 3.3 Projected New Borrowings .................................................................................... 18 3.4 Interest Rate Forecasts ......................................................................................... 18 3.5 Earnings on Cash ................................................................................................. 19 3.6 Existing Borrowings Assumed to Continue on Same Terms .................................. 19 3.7 Edgewater Quarry Borrowings – assumptions same in all options ........................ 19 3.8 Parameters for Evaluation ..................................................................................... 20
4 List Of Options ............................................................................................................. 21
4.1 List of Options ....................................................................................................... 21 4.2 Approach for Evaluation ........................................................................................ 21
5 Repayment terms (5, 10, 15 or 20 years) ..................................................................... 22
5.1 Current Practice – Mixed Terms ............................................................................ 22 5.2 Key Features ........................................................................................................ 22 5.3 Repayment Options Evaluated.............................................................................. 22 5.4 Interest Assumptions ............................................................................................ 23 5.5 Borrowings Estimates ........................................................................................... 23
FINANCIAL ANALYSIS
3 | Page
5.6 Loan Repayments ................................................................................................. 24 5.7 Principal Owing ..................................................................................................... 25 5.8 Net Cash at Year 20 ............................................................................................. 25 5.9 Interest Paid.......................................................................................................... 26 5.10 Operating Surplus Ratio ........................................................................................ 27 5.11 Debt Service Coverage Ratio ................................................................................ 27 5.12 WATC Indicative Additional Borrowing Capacity Model ........................................ 28 5.13 Key Ratios ............................................................................................................ 29 5.14 Summary .............................................................................................................. 29
6 Fixed vs Variable vs Flexible Arrangement .................................................................. 31
6.1 Current Practice .................................................................................................... 31 6.2 Arrangement Options Evaluated ........................................................................... 31 6.3 Option 3 Key Features .......................................................................................... 32 6.4 Interest Assumptions for the 3 Options ................................................................. 33 6.5 Interest Rates assumed for JPACF ....................................................................... 33 6.6 Attachments .......................................................................................................... 34 6.7 Borrowings Estimates ........................................................................................... 34 6.8 Loan Repayments ................................................................................................. 35 6.9 Principal outstanding ............................................................................................. 35 6.10 Net Cash at Year 20 ............................................................................................. 36 6.11 Interest Paid.......................................................................................................... 37 6.12 Operating Surplus Ratio ........................................................................................ 38 6.13 Debt Service Coverage Ratio ................................................................................ 38 6.14 WATC Criteria ....................................................................................................... 39 6.15 Key Ratios ............................................................................................................ 40 6.16 Option Summary ................................................................................................... 41 6.17 Ranking Summary ................................................................................................ 41
7 Fixed Interest Agreements – Other Issues ................................................................... 42
7.1 Lack of Flexibility .................................................................................................. 42 7.2 Existing Borrowings .............................................................................................. 42 7.3 ACELG ................................................................................................................. 43 7.4 Intergenerational Inequality ................................................................................... 44
8 Non Financial Evaluation ............................................................................................. 45
8.1 RAG ...................................................................................................................... 45
SENSITIVITY ANALYSIS .................................................................................................... 46
9 Economic Climate ........................................................................................................ 46
9.1 Global & National .................................................................................................. 46 9.2 West Australia ....................................................................................................... 46

FINANCIAL ANALYSIS
4 | Page
9.3 OECD (22nd September 2016) .............................................................................. 47
10 Sensitivity Analysis (1) – Changes in Interest Rates .................................................... 48
10.1 Overview ............................................................................................................... 48 10.2 Scenario Analysis – 8 Interest Rate Scenarios ...................................................... 48 10.3 Interest Expense on Borrowings – Sensitivity Analysis ......................................... 49 10.4 Borrowings – Sensitivity Analysis .......................................................................... 50 10.5 Net Cash – Sensitivity Results .............................................................................. 50 10.6 Debt Service Coverage Ratio ................................................................................ 51 10.7 Total Ratios........................................................................................................... 51 10.8 Summary Sensitivity Analysis ............................................................................... 52 10.9 Likelihood of Interest Rate Changes ..................................................................... 52
11 Sensitivity Analysis (2) – General Rates ...................................................................... 53
11.1 Current Assumptions ............................................................................................ 53 11.2 Lower Rates Increases ......................................................................................... 53 11.3 Longer to Repay Principal ..................................................................................... 53 11.4 Impact on 3 Options .............................................................................................. 54
12 Sensitivity Analysis (3) – Higher Interest Rates 2020 ................................................... 55
12.1 Increase in 2020 ................................................................................................... 55 12.2 Summary of Options ............................................................................................. 55 12.3 Summary Impacts ................................................................................................. 56
13 Financing By Other Local Govt .................................................................................... 57
13.1 WATC Consultation .............................................................................................. 57 13.2 Financing by other Local Government................................................................... 57
14 Other Options & Issues ................................................................................................ 58
14.1 Flexible with Balloon Payments............................................................................. 58 14.2 Reserves Freed Up ............................................................................................... 58 14.3 Day to Day Surpluses Could Reduce Costs of Borrowing ..................................... 59 14.4 Existing Borrowings Refinanced and/or use existing Reserves to pay off .............. 60 14.5 Market Options instead of WATC .......................................................................... 60 14.6 Lock in Low Fixed Interest Rates Now .................................................................. 60 14.7 Financing Increased Renewal Expenditure / Asset Renewal Reserve................... 60
SUMMARY – RECOMMENDATION & NEXT STEPS ......................................................... 62
15 Recommendation ......................................................................................................... 62
15.1 Repayment Terms – Maximum 15 years ............................................................... 62 15.2 Recommendation - Flexible Arrangements with Flexible Repayment .................... 62 15.3 Additional Monitoring Processes for Flexible Repayment Arrangements ............... 62

FINANCIAL ANALYSIS
5 | Page
16 Next Steps ................................................................................................................... 64
16.1 Independent Review of this Report Required ........................................................ 64 16.2 JPACF Business Case (October 2016) ................................................................. 64 16.3 When Could New Arrangements be Implemented by? .......................................... 64 16.4 Master Borrowing Agreement with WATC ............................................................. 64
Appendix 1 – Interest Rate assumptions ............................................................................. 65
Appendix 2 – Existing Borrowings ....................................................................................... 66
Attachments Attachment 1 – SFP Model as adopted June 2016 Attachment 2 – Option 1 SFP Model Attachment 3 – Option 2 SFP Model Attachment 4 – Option 3 SFP Model Attachment 5 – Option 3 vs. Option 1

FINANCIAL ANALYSIS
6 | Page
EXECUTIVE SUMMARY
Purpose of Report & Scope This report is prepared in support of the Business Case (Sept 2016) for the Joondalup Performing Arts and Culture Facility (JPACF). This report will include a detailed evaluation of financing options for the City and an evaluation of options. Although the main driver for this review is the JPACF project, it is more practical and meaningful to evaluate the impacts of different financing options on the overall City finances. For example one of the key hurdles to consider for borrowings is the Debt Service Coverage Ratio which can only be evaluated on at an overall City basis and not for an individual project. The City currently (as at July 2016) has circa $15m outstanding on borrowings set up during the past few years. The analysis assumes that the repayment arrangements of these existing borrowings will continue as they are and those cash flows are included equally in all options. The Strategic Financial Plan (SFP) as adopted in June 2016 has been used in the starting point in the analysis. The City has recently received a reduced forecast for Tamala Park proceeds, and this has been used to update the SFP. Therefore the baseline used for all options is a restated SFP with reduced Tamala Park proceeds. Repayment Terms – no one size is best The analysis in this report does not make a recommendation that there should be a standard term applied to all borrowings (5, 10, 15 or 20 years). The report finds that the current process of considering the term relative to the size of the borrowings is the most appropriate. The analysis is conclusive in respect of a 20 year repayment term; this is inefficient because of the high interest payments. Despite the intergenerational inequality that may appear to arise with shorter repayments, it is normally always better to repay borrowings as quickly as possible (depending on cash flow). The analysis is also conclusive regarding 5 year or 10 year terms, they are useful in most cases but may not be universally applied to all borrowings because the high loan repayments would cause the Debt Service Coverage Ratio to fail. The table below summarises the evaluation of the different repayment terms against 5 key metrics and then calculates an overall average, the lower the score the higher the ranking. Option 1a (mixed terms) has the lowest overall average score and therefore the best overall ranking. There is no ‘one case that fits all’’ for borrowings for Local Government and some options are better than others in one criteria but not so in other factors.
Option 1a5/10/15 years
Option 1b5 Years
Option 1c10 Years
Option 1d15 Years
Option 1e20 Years
1 Borrowings 2 5 4 2 1
2 Interest Payments Total 3 1 2 4 5
3 Net Cash 3 1 2 4 5
4 Debt Service Coverage Ratio 1 5 4 1 1
5 Ratios 3 5 4 2 16 Average of above 2.4 3.4 3.2 2.6 2.6
Rankings based on above

FINANCIAL ANALYSIS
7 | Page
Evaluation of Arrangement Types Three different arrangement types have been evaluated: 1. Option 1 - Fixed Interest 2. Option 2 - Variable Interest 3. Option 3 – Flexible Repayment There are different features that could apply to these three types, and in particular option 3, Flexible. Option 3 has assumed that: • Principal should be repaid as quickly as possible, whilst still retaining a balanced budget. • Surplus municipal funds should repay the loan before topping up the Strategic Asset
Management Reserve. This is based on the principle that the interest rate on borrowings is higher than the interest rate that could be earned from cash.
• Repayment is prioritised ahead of allocation to unidentified Capital Renewals. • Surplus cash is used to reduce the need for new borrowings before repayment of
principal • Interest rate would be variable. The graph below shows the principal outstanding for each option. This indicates that at Year 20 (2034/35) Options 1 and 2 still have principal outstanding on loans but Option 3 though has repaid all principal by 2024/25. At 2024/25 there is still $53m principal for Option 1 and 2. The large difference of $53m between Option 3 and Options 1 & 2 is mostly caused by having $18m less transferred into the Strategic Asset Management Reserve and $29m less set aside for unidentified capital renewals. From 2024/25 onwards Option 3 makes up for these issues as it is in a stronger position than Option 1 and 2 with no borrowings and therefore by 2034/34 Option 3 has more cash in reserves. The ability to reduce the principal to zero by 2024/25 is also underpinned by the other assumptions in the SFP, most notably the increase in General Rates between 4% and 5% for the next few years. If the City does not increase General Rates by 4% to 5% in the next few years then the principal could not be repaid by 2024/25. However the General Rates increases are the same in all three options so the differences in the options would be the same.
$53
$0
$10
$20
$30
$40
$50
$60
$70
$80
$ms
Principal Outstanding
Option 1 - Fixed Interest
Option 2 - Variable Interest
Option 3 - Flexible

FINANCIAL ANALYSIS
8 | Page
Meanwhile the graph below shows that Option 3 would have a much lower cost of interest than Option 1 or Option 2, this is because Option 3 repays more quickly. Option 3 would result in $10m interest expense on borrowings, compared to $29m for Option 1 or $37m for Option 2.
Option Summary The table below summarises the 3 options against several key metrics. This shows that Option 3 is better than Option 1 and 2 in most criteria.
Other Features of Fixed Interest and Other Options One of the major disadvantages with fixed interest arrangements is the lack of flexibility. It could be advantageous for the City to reduce borrowings if more funds were available than expected (e.g. Tamala Park proceeds) but with a Fixed Interest arrangement this is not normally possible without resetting the loan at a cost. Furthermore if the variable interest rates eventually become lower than the fixed rates then the City could pay higher interest
$0.0
$0.5
$1.0
$1.5
$2.0
$2.5
$3.0
$3.5
$4.0
$4.5
$ms
Interest Expense on Borrowings
Option 1 - Fixed Interest
Option 2 - Variable Interest
Option 3 - Flexible
Option 1 Option 2 Option 3Fixed
InterestVariable Interest Flexible Best
Borrowings & CashNew Borrowings Year 3 to Year 20 $m $91 $91 $52 Option3
Year that Borrowings paid off What year paid off ? 2037-38 2037-38 2024-25 Option3
Repayments Total (P+I) 20 Year Total ($m) ($116) ($124) ($62) Option3
Interest Expense on Borrowings Total 20 Year Costs $m ($29) ($37) ($10) Option3
Capital Renewal 20 Year Total $m ($742) ($742) ($712) Option1
Net Cash less Borrowings $m at 2034-35 $231 $219 $288 Option3
Key Ratios Total out of 100 85 85 82 Option3
Treasury Borrowings Criteria No of Years Failed 0 1 2 Option1
Option Summary

FINANCIAL ANALYSIS
9 | Page
costs than it could have otherwise done. This is illustrated in the chart below which compares the interest rate applicable in existing loans versus the variable rate.
RAG Evaluation The table below compares each of the 3 options in simplified RAG format, where Green is the better option and red the worst option. The scoring does not necessarily mean that Red is bad for that option, but just not as good as the other options
0.00%
1.00%
2.00%
3.00%
4.00%
5.00%
6.00%
7.00%
Interest Rate on Existing Borrowings vs Variable Rate
Sorrento Beach
Aquatic Facilities
West Coast Drive
RLCIP
Multi Storey
Variable Rate
RBA Rate
These loans taken out in 2010-11 and 2011-12 are now paying a much higher rate of interest compared to the variable rate
Loans taken out as recently as last year are now likely to pay a higher rate of interest than could otherwise have been payable under a Variable loan
Issue Option 1 Option 2 Option 3
Issue DescriptionFixed Interest Fixed Term
Variable Interest Fixed
Term
Interest Only
1 TRANSPARANCY How easy is it to identify the exact repayments for each project ?
2 MANAGEMENTEnsure that payments are made accurately in accordance with contract and on time.
3 RISK / CERTAINTYCould the City be subject to unforeseen exernal economic impacts that result in signficant impacts to long term plans.
4LOST OPPORTUNITY
Does the option limit the ability to have lower repayment costs?
5 SPECULATING Is the method used a form of speculating that the City will beat the Market
6 FLEXIBILITY Ability to react to changing circumstances

FINANCIAL ANALYSIS
10 | Page
Flexible Repayment Approach – Other Considerations Option 3 could be structured in different ways, for example • Balloon payments. Fixed balloon payments, but these are normally tied to specific
events rather than a general approach to repay as quickly as possible • Reserves freed up. Review the use of other reserves and consider whether they could be
used to repay borrowings, as long as the reserve was repaid at a future point in time. • Day to Day surpluses could reduce costs of borrowing. Similar to an offset facility, use
surplus day to day cash to reduce borrowing expense (albeit temporarily) rather than earn interest from the surplus.
• Market options instead of WATC. It is highly unlikely that this would be viable due to the unique nature of Local Government finances and the benefits that WATC provide.
WATC have been informally consulted about some of the options in this paper. Whilst most Local Government tends to use Fixed Interest Fixed Term arrangements, WATC did suggest that alternative flexible arrangements could be put in place. For example to accommodate the JPACF loan of circa $50m, rather than just put it on a 15 year repayment term it could be split up into different bundles with different repayment terms which allows the flexibility to repay the principal earlier if possible. If the surplus doesn’t materialise (e.g. Tamala Park reduce their distributions yet again), the loan could just be refinanced using up-to-date market rates. Financing for Other Local Government There are few examples of Local Government in WA doing anything different other than the standard fixed term fixed interest arrangements. The City of Cockburn recently completed the construction of a new sports facility and borrowings were used for a 10 year fixed interest fixed term with WATC. The City of Gosnells uses a short-term (3 years) overdraft arrangement to help with the construction of projects. Meanwhile the City of Wanneroo has taken on a $60m loan at interest-only which will have to be repaid at an agreed point in time; this loan was linked to Developer contributions and quite unique to the growth in Wanneroo. Recommendation It is recommended that the City sets up future borrowings on a Flexible basis with flexible repayment terms. This recommendation is made taking account of all the information in this report, specifically that: • Key metrics have been evaluated (interest payments, net cash, ratios). Option 3
(Flexible) comes out on top in most areas, only failing slightly with the Asset Sustainability Ratio.
• Borrowings could be repaid by 2024-25 (Option 3) rather than 2033-34 (Option 1 and as per the Adopted SFP)
• Sensitivity analysis has been rigorous and also indicates that Option 3 is preferable and presents less overall risk than fixed interest.
• Fixed Rates provide less flexibility

FINANCIAL ANALYSIS
11 | Page
Next Steps The City should be cautious though with changing the approach and the following next steps are recommended: • Independent Review - findings to be validated and further consideration of risk. • JPACF Business Case (October 2016) – no change to the assumptions within the JPACF
model, continue to assume a traditional 15 year Fixed Interest Fixed Term loan. However the JPACF Business Case can mention that a detailed financing review is underway.
• WATC Master Borrowing Agreement – would have to be reviewed at some stage as only currently allows for Fixed Interest arrangements.

FINANCIAL ANALYSIS
12 | Page
INTRODUCTION & BACKGROUND
1 INTRODUCTION & BACKGROUND
1.1 Purpose of Document / Scope This report is prepared in support of the Business Case (Sept 2016) for the Joondalup Performing Arts and Culture Facility (JPACF). This report will include a detailed evaluation of financing options for the City and an evaluation of options. The contents include: • Research • Option Evaluation • Risks, Opportunities & Sensitivity Analysis • Summary & Next Steps
1.2 Scope – Overall City Impacts, not Just JPACF Although the main driver for this review is the JPACF project, it is more practical and meaningful to evaluate the impacts of different financing options on the overall City finances. For example one of the key hurdles to consider for borrowings is the Debt Service Coverage Ratio which can only be evaluated on at an overall City basis and not for an individual project. The vast majority of projected new borrowings in the 20 year Strategic Financial Plan relate to the JPACF anyway. This report will make a recommendation of the assumptions to be applied in the JPACF business case.
1.3 Out of Scope The following are out of scope: • Project Justification for JPACF – included in business case; • Operational model, income and expenses for the JPACF. This report will only deal with
the financing of the JPACF. The JPACF operating model is loss-making and it is therefore not viable to attempt any link between the operating values and the costs of financing.
• Scheduling of the Capital Expenditure. The options evaluated will simply use the scheduling that is assumed within the Adopted 20 Year SFP
• Depreciation factors and rates • Capital replacement • Asset Renewal Reserve All of the above factors are considered in the separate financial paper for the JPACF (“Financial and Options Evaluation”).

FINANCIAL ANALYSIS
13 | Page
1.4 Disclaimer This report does not contend that the financial projections will come to pass exactly as shown, but are merely a guide to help evaluate options. The projections are best estimates at this point in time, but there is a level of risk and uncertainty in all of the projections. The actual costs and income will vary, due to the following: • Capital costs of projects and scheduling • Interest Rates for borrowings • Interest Earnings for cash • All other inputs within the SFP which impact on the City’s ability to borrow and repay for
example General Rates • Economic Factors. Whilst this report makes recommendations regarding changes to the financing of borrowings, there are a number of actions which are recommended for review of this review and also other actions for the City to monitor the situation closely going forwards. The risks and sensitivity should be considered as much as the financial projections.

FINANCIAL ANALYSIS
14 | Page
2 KEY REFERENCE POINTS & RESEARCH
2.1 Local Government Act 1995 The relevant provisions within the Act allow for borrowings and stipulate: • Local government in Western Australia may borrow money or obtain credit to enable it to
perform the functions and exercise the powers conferred to it under the Local Government Act 1995 (WA)
• where a Council proposes to borrow money, and this has not been accounted for in the budget for that financial year, the Council must first obtain an absolute majority in order to exercise the power to borrow, and then give one month's public notice of the proposal
• Local government may only provide security in limited forms, as set out in s 6.21 of the Local Government Act 1995.
2.2 City of Joondalup Positioning Statement on Sustainable Borrowings The City has adopted a Positioning Statement on Sustainable Borrowings as follows: “The City supports borrowing as an appropriate form of financing capital expenditure in the achievement of objectives contained within the Strategic Community Plan 2012-2022 and the 20 Year Strategic Financial Plan. Sustainable borrowing parameters should be determined as follows: 1. Long term borrowing requirements will be identified as part of the 20 Year Strategic Financial Plan and specific borrowings will be approved as part of the annual budget process. 2. Borrowings should only be considered where the impacts are within the range of the key ratio targets contained within the 20 Year Strategic Financial Plan – Guiding Principles, in particular, the Debt Service Coverage Ratio.” The positioning statement has replaced the Borrowing Strategy that was adopted by Council in 2010, this has now been revoked. The position above is now a lot more flexible than the previous Borrowings Strategy and therefore allows consideration of different options that are considered in this report.
2.3 Guiding Principles – 20 Year Strategic Financial Plan The Positioning Statement refers to the Guiding Principles within the 20 Year SFP. The Guiding Principles first of all refer to 7 key principles which are worth bearing in mind when considering the different financing options: • Sustainability • Transparency • Prudence • Consistency • Performance and Accountability • Flexibility and Long-Term Approach • Service Levels and Asset Management The Guiding Principles also have a specific section regarding Funding/Treasury as follows:

FINANCIAL ANALYSIS
15 | Page
“The City is an asset intensive business, and as such loan funding could be expected to be used to fund Capital Expenditure. The Borrowings should be consistent with the City’s Strategic Positioning Statement on Sustainable Borrowings. The primary measure of evaluation is the Debt Service Coverage Ratio which is not to exceed five consecutive years with an annual debt service cover ratio of between three and five, with all other periods exceeding a ratio of five. Revenue from the Tamala Park land sale should be applied in accordance with the City’s adopted Strategic Position Statement. The Strategic Asset Management Reserve is able to be applied to fund projects based on an internal payback mechanism. Municipal funds should pay back to the Strategic Asset Management Reserve principal and interest over a 10 year period. The payback mechanism should only be used where affordable for the municipal fund such that the overall objective of achieving a net nil closing balance each year is achieved.”
2.4 Strategic Community Plan This report supports the City of Joondalup Strategic Community Plan as follows: • Financial Sustainability – manage liabilities and assets through a planned long-term
approach • Optimise funding options for new projects that take advantage of favourable economic
conditions
2.5 ACELG (Australian Centre of Excellence for Local Government) The ACELG have commissioned various reports during the past few years to assist the industry with considering best practice. In 2014 a report was issued called “Debt is Not a Dirty Word”, which considered current practices for financing, other options for borrowings and changes that the industry should consider. The ACELG report indicated that the industry (in general) was stuck in its ways regarding borrowing options and financing. The industry generally fears debt and a well run Local Government is often recognised as one that has minimal or no debt – however this can be short-sighted and is not necessarily a good indicator of a well run Local Government. Debt is underutilised within the industry and when it is used it is often the wrong type of debt that is used due to a lack of understanding of the risk, costs and options available. One of the other key observations is regarding ‘Tied Reserves”, which for most Local Governments are regarded as sound healthy financial management. However from an overall Treasury Management perspective the use of “Tied Reserves” is often sub-optimal and lacks the foresight to minimise overall financing costs. In essence the use of “Tied Reserves” is akin to shoebox accounting. The ACELG has many useful observations and will be referred to throughout this report. However the ACELG report also makes the key observation that there is not one size that fits all, every Local Government must consider carefully the available options and evaluate those which are right for them. Therefore the recommendations in this report are not necessarily made just because they may have been repeated in the ACELG report.

FINANCIAL ANALYSIS
16 | Page
2.6 West Australian Treasury Corporation (WATC) WATC are the body used by Local Government in WA to assist with borrowings. WATC have been referred/consulted in several ways regarding the JPACF project and this review: • 2015 – The City began to have informal discussions regarding the City’s SFP and more
importantly the assumption that it would be in a position to secure large borrowings for the JPACF.
• 2016 – WATC were again provided with a copy of the City’s draft SFP and asked to provide comment. They reviewed the plans based on their standard assessment criteria and confirmed that if all assumptions remained the same then the City would qualify for the proposed borrowings. This was an informal exercise.
• Local Govt. Circulars – during the past year WATC have issued 4 circulars to provide background information regarding borrowings and different types of arrangements that could be used. These circulars have been referred to in this report.
• Additional Borrowing Capacity Model – WATC issued a financial model to all Local Government which helps evaluates borrowing criteria and plan for future borrowings. The City has used this model to enhance the SFP model; this will be explained in more detailed later on.
• Informal discussions September 2016 regarding alternative arrangements reviewed in this report (variable rates, interest only).
Whilst discussions have taken place with WATC during the past 2 years regarding the JPACF borrowings, it must be emphasised that these are INFORMAL, and at no point has there been any formal confirmation that the City would definitely obtain the borrowings. Indeed since those discussions some of the key assumptions in the SFP have worsened (Tamala Park Proceeds are now lower) or at risk of being lower (General Rates increases may be lower than the SFP increases of 4% to 5%) It is therefore vital that the City continues to have open regular dialogue with WATC, and indeed when the City commits to the JPACF it will need to formally secure the borrowings before it can invest further. Some of the key observations from WATC in their circulars are: • An LGA with a no-debt policy may regard itself as financially conservative or not wanting
to burden constituents with debt. However, such a policy may not be consistent to achieving an appropriate balance in intergenerational equity or in providing services to the community expected.
• LGAs that only borrow where they expect an independent source of revenue to service the loan are subjecting themselves, and ultimately their ratepayers, to a higher degree of financial risk. This arises as the alternative income streams expected to support such loans are generally subject to a degree of uncertainty in comparison to an LGA’s core sources of income (i.e. rates and regular grants).
• A quote for a Fixed Rate loan is expected to be higher than for a Variable rate loan of an equivalent term.
2.7 Terminology The table below summarises some of the key terms referred to throughout the report (tbc)
Item Definition
1 Loans or Borrowings
o The amount of money financed by a 3rd party o The term Loan and Borrowings are used interchangeably to
describe the original amount that is borrowed. 2 Principal o The amount of the original loan outstanding at any point in

FINANCIAL ANALYSIS
17 | Page
time. o At the time of creating the loan the principal will equal the loan
amount. However the principal will be repaid over time and eventually be zero.
3 Interest Expense
o The additional expense that is payable regularly (normally quarterly) on top of any repayment of principal
o Interest expense is calculated as a % of the outstanding principal.
o Sometimes referred to as the “Costs of Borrowing”
4 Repayment o The total cash flow paid at a given point in time. o Repayment comprises of both the Principal being repaid and
the Interest Expense
5 Earnings on Cash
o This term is used in this report to denote that earnings that are earned by the City at financial institutions with cash that has been banked.
o This term is referred to because each of the options will affect cash flow differently and therefore the earnings on cash will be affected by the amount differently
6 Interest Rate
o % figure that is relevant for either Interest Expense or Earnings on Cash
o Interest Rate applicable for borrowings can either be fixed or variable.
o The term interest rate can be interchangeable applied to interest expense (on borrowings) or relating to the income received through cash banked
7 Financing & Funding
o The term Financing and Funding are often used interchangeably but in this report and commonly in public finance the terms have different meanings. Funding refers to the raising of revenue (e.g. general rates, fees/charges), whereas Financing describes how a payment for an outlay is accommodated.
o Financing could be through an entity utilising its financial assets (e.g. cash reserves) or by an arrangement to use another entity’s funds (e.g. raising a borrowing).
o While financing and funding are different functions they are interrelated i.e. the repayment of a finance arrangement has to be funded by revenue.
6 Net Cash is Not Unencumbered Cash
o Net Cash is a key metric used in the evaluation of the options. o This is calculated as the difference between Total Cash
Reserves and principal owing. o Care has to be taken in the interpretation of this metric though,
because Net Cash cannot be assumed to be total cash available to the City for projects or the like. Within the Reserves figure there will be tied reserves whose purpose are legally/contractually tied and cannot be available for projects.
o Therefore Net Cash is not the same as Unencumbered Cash, which is term meaning cash available. It would overcomplicate this report to split out Net Cash and Unencumbered Cash and in any case it would not serve any purpose in evaluating the difference between options.

FINANCIAL ANALYSIS
18 | Page
OPTION EVALUATION
3 BASELINE & KEY ASSUMPTIONS
3.1 Adopted 20 Year Strategic Financial Plan (June 2016) As mentioned earlier it is necessary to consider financial options for the overall City, not just for one project in isolation. The starting point of the analysis is the 20 Year SFP that was adopted by Council in June 2016. This is shown in Attachment 1.
3.2 Restated SFP based on Reduced Tamala Park Land Sales The Adopted SFP included estimated land proceeds from Tamala Park based on 2015 projections from TPRC (Tamala Park Regional Council). Since the SFP was adopted the City has received updated projections from TPRC. The expected distribution during the next few years (when JPACF is planned for construction) is reduced by $7m and the overall distribution forecast (up to 2028/29) is also $7m lower. The shortfall in the next few years means fewer reserves available to contribute to the JPACF which result in higher borrowings which have to be repaid from municipal funds. It is therefore deemed prudent to restate the SFP for the purposes of this report using the reduced Tamala Park Land Sales.
3.3 Projected New Borrowings The SFP (restated) now estimates approx $93m of new borrowings based on the current assumptions (Fixed Interest). This comprises of the following projects: • $55m JPACF • $4.5m Hockey • $12m Edgewater Quarry (self-financed with land proceeds to repay borrowings) • $17m Second Multi Storey Car Park (self-financed using surpluses from parking
operations) • $4.5m Admin Building Refurbishment Of the total $93m borrowings, approx $29m can be regarded as self-financed to some extent (Edgewater Quarry and Multi Storey Car Park). Of the remaining $64m, the vast majority ($55m) is for the JPACF. Therefore whilst the analysis in this report relates to the overall City finances the major driver regarding borrowings is the JPACF.
3.4 Interest Rate Forecasts The analysis in this report uses various interest rate forecasts as shown in Appendix 1. These are based on information provided recently by WATC, although they have only provided estimated rates up to the 2025/26 the forecasts thereafter are by the City. WATC have provided estimated rates for Fixed Interest loans. This evaluation also includes options for Variable Interest Rates and an assumption has been made that the Variable Interest Rates would be 0.5% less every year than the Fixed Interest Rates. This is a reasonable assumption because in the long run it is normal for Fixed Rates to be higher than Variable Rates as Fixed Rates include a premium above the prevailing market rate.

FINANCIAL ANALYSIS
19 | Page
Appendix 1 also shows the cost of the Govt Guarantee of 0.7% which would apply to all options, albeit the impact would be different as it is calculated on the principal owing which would be different for each option.
3.5 Earnings on Cash Appendix 1 also indicates the assumption for interest earned on cash reserves by the City. The assumption is that the City would earn 1% less than the costs of borrowing; this is a generally recognised prudent assumption and has been the standard assumption within the Adopted SFP for a number of years. These assumptions are important because the 20 Year SFP recalculates the earnings from cash based on the various cash flows, and therefore any option which has a bigger drain on cash flow will result in fewer earnings for the City.
3.6 Existing Borrowings Assumed to Continue on Same Terms The City currently (as at July 2016) has circa $15m outstanding on borrowings set up during the past few years. Appendix 2 provides a summary of the borrowings, the principal repayments and the end date. The City is paying almost $3m per year in principal and interest, most of which will reduce by 2020/21, just as the JPACF borrowings come on line. Whilst the reduced burden of the existing borrowings will help in some respects with the new borrowings for the JPACF this is already factored into the SFP. The analysis assumes that the repayment arrangements of these existing borrowings will continue as they are and are included equally in each of the models. Therefore there is no consideration of refinancing existing borrowings. The graphs which compare the cashflows of each option will EXCLUDE existing borrowings and only show the impacts for new borrowings.
3.7 Edgewater Quarry Borrowings – assumptions same in all options The Edgewater Quarry borrowings are set up within the SFP as follows: • Borrowings of $12.2m split mostly between 2 years 2020/21 and 2021/22 • Interest only loan for a short-time • Sales proceeds of $12.2m received in 2023/24 and 2024/25 are used to repay the
principal • Interest Rate of 5% assumed for the years when principal is outstanding • Interest expense on borrowings costs $2.5m All options have used the same assumptions for Edgewater Quarry because it is a unique self-funded loan.

FINANCIAL ANALYSIS
20 | Page
3.8 Parameters for Evaluation The various options are modelled on a like for like basis. The key parameters for the model are: • SFP model is used to calculate all the impacts for each individual option, so a full 20 year
impact up to 2034/35 is assessed. Whilst there are some options (e.g. 20 year repayment terms) which still have many years to run to repay borrowings beyond 2034/35, this has been taken account of in the key metrics – for example the Net Cash at 2034/35 takes account of borrowings outstanding.
• All whole of life cash flow impacts are considered in the SFP model, including the earnings on cash reserves. The earnings on cash reserves are affected by the different cashflows of different arrangements.
• Reserves – the use of reserves for all options is the same as the Adopted 20 Year SFP except the Strategic Asset Management Reserve. The assumptions for Reserves are: - Tamala Park proceeds are only used for the JPACF - JPACF reserve only used for JPACF - Parking Surpluses go to the Parking Reserve which is then used to repay borrowings
for Parking Facilities - Strategic Asset Management Reserve used for a variety of projects and where it is
used the municipal fund has to pay back to the reserve over a 10 year period or until such time as the Municipal Fund can afford to do so. The Flexible option will be explained later in the report treats this principal differently.
The key metrics used to summarise the impacts comprise of the impacts on cash flow, operating results, debt ratios and overall ratios.
FINANCIAL ANALYSIS
21 | Page
4 LIST OF OPTIONS
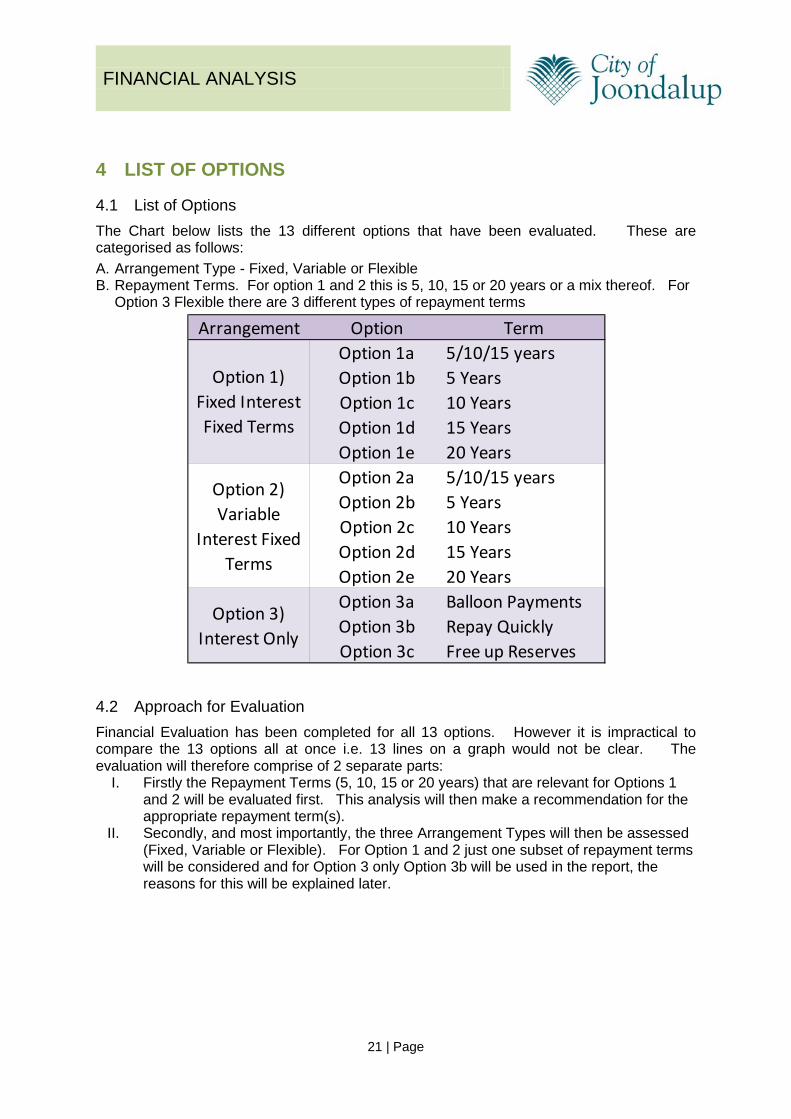
4.1 List of Options The Chart below lists the 13 different options that have been evaluated. These are categorised as follows: A. Arrangement Type - Fixed, Variable or Flexible B. Repayment Terms. For option 1 and 2 this is 5, 10, 15 or 20 years or a mix thereof. For
Option 3 Flexible there are 3 different types of repayment terms
4.2 Approach for Evaluation Financial Evaluation has been completed for all 13 options. However it is impractical to compare the 13 options all at once i.e. 13 lines on a graph would not be clear. The evaluation will therefore comprise of 2 separate parts:
I. Firstly the Repayment Terms (5, 10, 15 or 20 years) that are relevant for Options 1 and 2 will be evaluated first. This analysis will then make a recommendation for the appropriate repayment term(s).
II. Secondly, and most importantly, the three Arrangement Types will then be assessed (Fixed, Variable or Flexible). For Option 1 and 2 just one subset of repayment terms will be considered and for Option 3 only Option 3b will be used in the report, the reasons for this will be explained later.
Arrangement Option TermOption 1a 5/10/15 yearsOption 1b 5 YearsOption 1c 10 YearsOption 1d 15 YearsOption 1e 20 YearsOption 2a 5/10/15 yearsOption 2b 5 YearsOption 2c 10 YearsOption 2d 15 YearsOption 2e 20 YearsOption 3a Balloon PaymentsOption 3b Repay QuicklyOption 3c Free up Reserves
Option 1) Fixed Interest Fixed Terms
Option 2) Variable
Interest Fixed Terms
Option 3) Interest Only

FINANCIAL ANALYSIS
22 | Page
5 REPAYMENT TERMS (5, 10, 15 OR 20 YEARS)
5.1 Current Practice – Mixed Terms The City has traditionally fixed the repayment term at either 5 years or 10 years, depending on the size of the borrowings. For example, the $8.5m for the Multi Storey Car Park is repaid over a 10 year period, whereas the Bramston Park Clubrooms $1.8m is repaid over a 5 year basis. The SFP has assumed 15 year terms for JPACF borrowings projected in 2017-18 and 2018-19, the 15 year term was suggested by WATC in 2015 rather than the 10 year term previously assumed. The City does not currently, nor was it intending to have 20 year repayments, but these are evaluated in this section.
5.2 Key Features The different repayment terms have the following features: • Longer the term the higher the interest costs • Shorter the term the higher the annual repayment and the more pressure there is on
operating cash flow to afford the repayments.
5.3 Repayment Options Evaluated Five options have been evaluated for the different repayment terms. a) Option 1a - Firstly, the current practice of mixed terms (5, 10 or 15 years) is the first
option. b) Option 1b - Then a separate option where all borrowings are taken on a 5 year repayment
term c) Option 1c – All borrowings on a 10 year repayment term d) Option 1d – All borrowings on a 15 year repayment term e) Option 1e – All borrowings on a 20 year repayment term For ease of comparison the arrangement method assumed for all 5 options is just a Fixed Interest arrangement.
FINANCIAL ANALYSIS
23 | Page
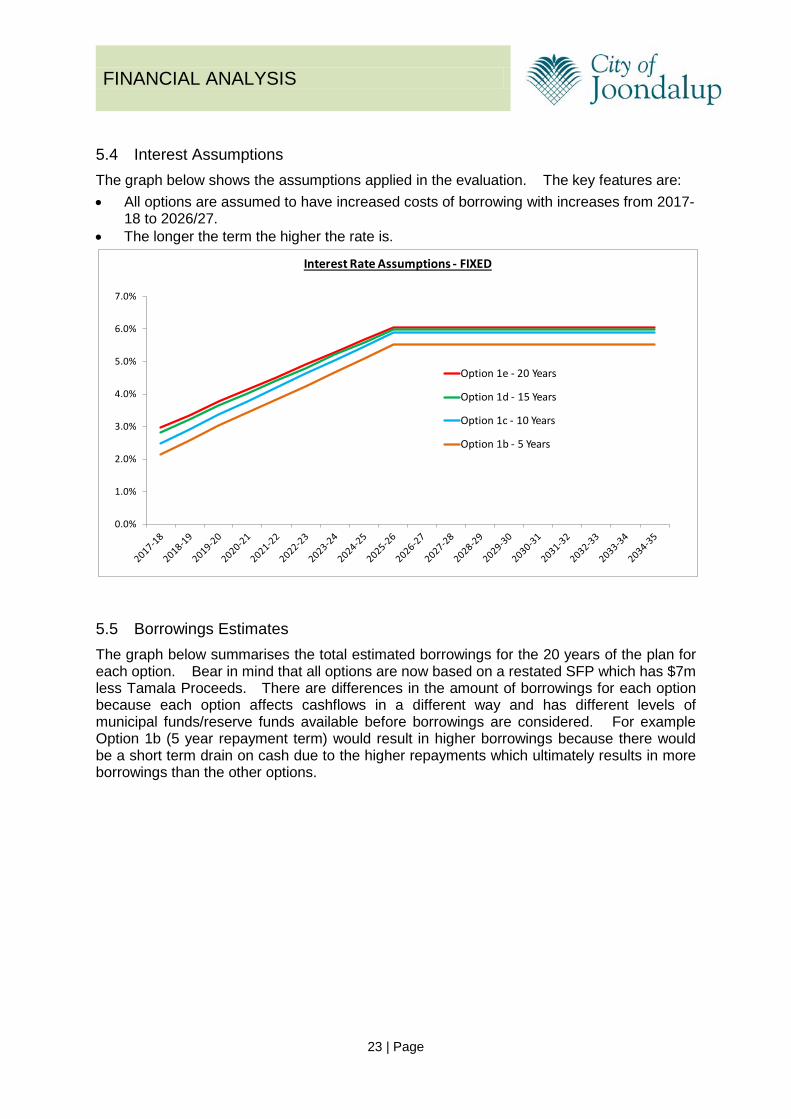
5.4 Interest Assumptions The graph below shows the assumptions applied in the evaluation. The key features are: • All options are assumed to have increased costs of borrowing with increases from 2017-
18 to 2026/27. • The longer the term the higher the rate is.
5.5 Borrowings Estimates The graph below summarises the total estimated borrowings for the 20 years of the plan for each option. Bear in mind that all options are now based on a restated SFP which has $7m less Tamala Proceeds. There are differences in the amount of borrowings for each option because each option affects cashflows in a different way and has different levels of municipal funds/reserve funds available before borrowings are considered. For example Option 1b (5 year repayment term) would result in higher borrowings because there would be a short term drain on cash due to the higher repayments which ultimately results in more borrowings than the other options.
0.0%
1.0%
2.0%
3.0%
4.0%
5.0%
6.0%
7.0%
Interest Rate Assumptions - FIXED
Option 1e - 20 Years
Option 1d - 15 Years
Option 1c - 10 Years
Option 1b - 5 Years

FINANCIAL ANALYSIS
24 | Page
5.6 Loan Repayments The graph below summarises the annual loan repayments for each option. This shows that Option 1b has much higher loan repayments in the earlier years but this reduces greatly in 2024/25 as the principal is reduced. Meanwhile the 20 year option provides a much more steady repayment profile.
$55 $55 $55 $55 $55
$6$14
$7 $6 $5
$30$30
$30 $30 $29
$91$98
$92 $91 $89
$0
$10
$20
$30
$40
$50
$60
$70
$80
$90
$100
Option 1a5/10/15 years
Option 1b5 Years
Option 1c10 Years
Option 1d15 Years
Option 1e20 Years
$ms
New Borrowings
Self Funded (EQ, MSCP)Others
JPACF
$0
$5
$10
$15
$20
$25
$ms
Loan Repayments (P+I)
Option 1a - 5/10/15 years
Option 1b - 5 Years
Option 1c - 10 Years
Option 1d - 15 Years
Option 1e - 20 Years

FINANCIAL ANALYSIS
25 | Page
5.7 Principal Owing The graph below shows the principal outstanding for each option: Key issues to note are: • Year 20 – at 2034/35 Options 1d (15 year repayment terms) and Option 1e (20 year
repayment terms) still have principal outstanding on loans. All other options have repaid their borrowings before year 20 and most notably Option 1b has repaid by 2026/27
• Maximum borrowings – the highest point of borrowings outstanding is in 2022/23 for Option 1e (20 year repayment terms)
5.8 Net Cash at Year 20 The graph below is the total net cash at 2034/35, which is the difference between cash reserves and principal outstanding. This indicates that Option 1b has a much higher outcome than any of the other options with approx $28m more cash than the next highest option.
$0
$10
$20
$30
$40
$50
$60
$70
$80
$90
$ms
Principal Outstanding
Option 1a - 5/10/15 years
Option 1b - 5 Years
Option 1c - 10 Years
Option 1d - 15 Years
Option 1e - 20 Years

FINANCIAL ANALYSIS
26 | Page
5.9 Interest Paid The graph below shows that the 5 year repayment terms would only result in Interest costs of $17.1m which is less than 50% of the current method (Option 1a) where $37.7m interest is paid and far lower than the $46.8m paid in Option 1e. Indeed the 20 year repayment term results in interest costs which are approx 50% of the total amount borrowed, this is inefficient.
$231
$269
$241 $231 $230
-$50
$0
$50
$100
$150
$200
$250
$300
Option 1a5/10/15
years
Option 1b5 Years
Option 1c10 Years
Option 1d15 Years
Option 1e20 Years
$ms
Net Cash at Year 20
Principal Owing
Reserves
Net Cash
$0.0
$0.5
$1.0
$1.5
$2.0
$2.5
$3.0
$3.5
$4.0
$ms
Interest Expense on Borrowings
Option 1a - 5/10/15 years
Option 1b - 5 Years
Option 1c - 10 Years
Option 1d - 15 Years
Option 1e - 20 Years

FINANCIAL ANALYSIS
27 | Page
5.10 Operating Surplus Ratio The most important indicator for financial sustainability is the Operating Surplus Ratio, which includes both the Interest Expense and the Earnings on Cash Reserves. Option 1b would initially have a negative impact due to the higher interest expense and drain on cash but eventually the benefits in cash would make this the better option.
5.11 Debt Service Coverage Ratio The Debt Service Coverage Ratio compares the amount of Loan Repayments (Principal + Interest) versus Operating Surplus before interest and depreciation. The Ratio is a key ratio within the City’s SFP, and is also used by WATC to assess capacity. Ideally the City strives to achieve a multiple of 5 or more, i.e. Operating Surplus is at least 5 times more than loan repayments, although the WATC threshold for a City the size of Joondalup is a multiple of 3. Option 1b presents a challenge in this ratio due to the higher loan repayments and as a result fails the test in 3 out of 20 years; likewise Option 1c fails the ratio in some years.
-4.0%
-3.0%
-2.0%
-1.0%
0.0%
1.0%
2.0%
3.0%
4.0%
2015-16 2016-17 2017-18 2018-19 2019-20 2020-21 2021-22 2022-23 2023-24
Operating Surplus Ratio (5 Year Average)
Option 1a - 5/10/15 years
Option 1b - 5 Years
Option 1c - 10 Years
Option 1d - 15 Years
Option 1e - 20 Years

FINANCIAL ANALYSIS
28 | Page
5.12 WATC Indicative Additional Borrowing Capacity Model WATC have provided a tool to assist Local Government in assessing their borrowing capacity. The City has added the key parts of the WATC model to the SFP model so that the borrowing criteria can be assessed automatically as the SFP is updated. There are 2 main elements to the WATC model, the Debt Service Coverage Ratio as described above and the Net Debt Ratio. The Net Debt Ratio compares the Principal owing versus Cash Reserves and indicates a maximum of 50%. The graph below summarises the total failures of the WATC criteria for each option, identified as either a failure of the Debt Service Coverage Ratio or the Net Debt Ratio. The only failures are for the Debt Service Coverage Ratio where it falls below a threshold of 3.
0.0
1.0
2.0
3.0
4.0
5.0
6.0
7.0
8.0
2015-16 2016-17 2017-18 2018-19 2019-20 2020-21 2021-22 2022-23 2023-24 2024-25 2025-26
Debt Service Coverage Ratio
Option 1a - 5/10/15 years
Option 1b - 5 Years
Option 1c - 10 Years
Option 1d - 15 Years
Option 1e - 20 Years
WATC Threshold
0
5
3
0 00
1
2
3
4
5
6
Option 1a5/10/15 years
Option 1b5 Years
Option 1c10 Years
Option 1d15 Years
Option 1e20 Years
WATC Borrowings Criteria - No of Years Failed
Net Debt Ratio
Debt Service Coverage Ratio

FINANCIAL ANALYSIS
29 | Page
5.13 Key Ratios The graph below summarises the overall impact on Key Ratios. The achievement of a Balanced Cash budget is a must for all 20 years which is the case for all options. Likewise it is crucial that the Debt Service Coverage Ratio is achieved in all 20 years, this is not the case for the 5 year repayment option or 10 year repayment option.
5.14 Summary The table below ranks each option against 5 of the key metrics and then calculates an overall average, the lower the score the higher the ranking. This indicates that Option 1a (mixed terms) has the best overall ranking. There is no ‘one case that fits all’’ for borrowings for Local Government and some options are better than others in one criteria but not so in other factors. However the analysis does help to rule out the use of 5 year or 10 year borrowings for all borrowings, as the Debt Service Coverage Ratio is failed. This doesn’t mean to say though that the City would not enter into 5 or 10 year terms for some borrowings, just not for all of them. Meanwhile, the disadvantage with the 15 year terms and 20 year terms is the higher interest repayments and the lower net cash. In summary the current method of having different terms (5, 10 or 15 years) is a more effective approach when using Fixed Interest arrangements. This will be the same for Option 2 (Variable Interest Rates). Therefore Options 1b, 1c, 1d, 1e, 2b, 2c, 2d, 2e can now be ruled out for the remainder of this paper.
20 20 20 20 20
20 20 20 20 20
12 12 12 12 12
20 17 17 20 20
1311 13 13 13
8580 82 85 85
0
10
20
30
40
50
60
70
80
90
100
Option 1a5/10/15 years
Option 1b5 Years
Option 1c10 Years
Option 1d15 Years
Option 1e20 Years
Key Ratios (Max 100)
Asset Sustainability Ratio %Debt Service Coverage RatioOperating Surplus Ratio %Balanced Cash BudgetRate % Increase

FINANCIAL ANALYSIS
30 | Page
Option 1a5/10/15 years
Option 1b5 Years
Option 1c10 Years
Option 1d15 Years
Option 1e20 Years
1 Borrowings 2 5 4 2 1
2 Interest Payments Total 3 1 2 4 5
3 Net Cash 3 1 2 4 5
4 Debt Service Coverage Ratio 1 5 4 1 1
5 Ratios 3 5 4 2 16 Average of above 2.4 3.4 3.2 2.6 2.6
Rankings based on above

FINANCIAL ANALYSIS
31 | Page
6 FIXED VS VARIABLE VS FLEXIBLE ARRANGEMENT
6.1 Current Practice At present the City uses Option 1 whereby it fixes the interest rate at the time of setting up the loan. This is common practice for most Local Governments and provides the City with a guaranteed no-change set of cashflows that it can include in budgets and long-term plans.
6.2 Arrangement Options Evaluated Three different arrangement types have been evaluated: Option 1 - Fixed Interest Option 2 - Variable Interest Option 3 – Flexible Repayment There are several different types of ways that these 3 options can be set up. The table below explains some of these features and also specifies the assumptions used for the evaluation in this report. There are some other different options which are subject to comment later on in the report.
Option 1 Option 2 Option 3
Fixed Interest Variable Interest Interest Only1 Currently Yes No No
2 Term Maximum 15 Years, but attempt to pay back earlier
3Interest Rate
Fixed at time of setting up loan.
Varies according to WATC costs of borrowing. Eg. 90 Day Bank Bill Swap Rate (tbc)
Could be Fixed or Variable.
Model has assumed the interest rate is variable
4 Principal Repayment
This could vary depending on different circumstances, for example a large one-off repayment (a 'balloon' payment could be planned as is the case with Edgewater Quarry).Alternatively a minimum repayment could be established.For the purposes of the evaluation it is assumed that principal is repaid if affordable to do so. Also see Key Features
5 Frequency of Payments
Quarterly Quarterly Probably Quarterly (tbc). Alternative mechanisms could be evaluated
6 Cashflows
Fixed Repayments throughout the term of the loan, so the future cashflows are known with 100% certainty.
The cashflows will vary depending on the interest rate.
However the amount of principal repaid is assumed to be same as Option1
Would vary signficantly depending on interest rate, amount of surplus cash.
Assumed 5, 10 or 15 years as per previous section. The larger borrowings (e.g. JPACF)
would be 15 years
Principal is paid frequently and continually reduces.
Arrangements Evaluated

FINANCIAL ANALYSIS
32 | Page
6.3 Option 3 Key Features Option 3 has a wide number of variations on how it could work in practice. The model has had to make the following assumptions, but these could be different in practice: • Principal is paid back as quickly as possible, but a balanced budget must be achieved
each year. Therefore a calculation is made each year of the amount of municipal funds that are available for loan repayments but only after achievement of a balanced budget.
• New Borrowings – before any repayment is made to principal any surplus cash is first of all reduced against any new borrowings that are estimated.
• Repayment of principal is prioritised ahead of expenditure on the "CWP renewal” line. The SFP has set aside expenditure from 2020/21 to “CWP Renewal” which is required to achieve an Asset Sustainability Ratio of 90%. There is no specific program where this expenditure has been identified, although there are already increases for specific programs from 2020/21 onwards. Whilst the need to have adequate planning for capital renewals is vital, Option 3 is based on the premise that surplus funds should be used to repay principal. As a result of this assumption, Option 3 has lower capital expenditure for some of the earlier years in the plan and the Asset Sustainability Ratio falls below 90% where Option 1 & 2 it doesn’t.
• Option 3 also prioritises Loan repayments ahead of payback to the Strategic Asset Management Reserve. The SFP currently has a mechanism in place whereby the Strategic Asset Management Reserve is topped up by surplus funds from the Municipal Fund. The rationale for Option 3 prioritising repayment of debt ahead of reserve is that it is a better use of funds to repay debt which has a higher interest rate than putting into reserve which earns a lower rate. Meanwhile Option 1 and 2 stretch out the repayments for larger loans to 15 years which results in surplus cash which has to go to reserve (even though it earns less than the cost of borrowings).
Option 1 Option 2 Option 3
Fixed Interest Variable Interest Interest Only
7Reserves - impact on repayments
This option could provide flexibility for the City to adapt the use of reserves and potentially minimise interest expenses.
8
Disposal Proceeds e.g. Tamala Park
Can be used to repay principal. If the proceeds are higher than more principal can be repaid.
9Day to Day Cash
No impact No impact
Where surplus cash is available in early part of year (due to Rates Income) it may be a better overall position for the City to repay borrowings and hence reduce interest costs - this impact may be better than the earnings that the City would otherwise earn from banking surplus cash. This type of arrangement could be similar to an ''offset' account.
10WATC Approval
Likely (as long as criteria is sound)
Less Likely but still probable (as long as the criteria is sound)
Less Likely but still possible (as long as the criteria is sound)
Arrangements Evaluated
Parking Surpluses are used to repay loans for Multi Storeys
Would not have a direct impact on the borrowings as a fixed term schedule is set up

FINANCIAL ANALYSIS
33 | Page
6.4 Interest Assumptions for the 3 Options The graph below shows the assumptions applied in the evaluation. The key features of the assumptions are: • All options are assumed to have increased costs over time, at the same increments. • Fixed Interest Rates are assumed to be 0.5% more expensive than the variable rates.
It is reasonable to assume that variable rates are cheaper than Fixed Interest. • Rates shown on the graph for Fixed and Variable relate to 15 year terms, which are the
key assumptions for Option 1 and 2 due to the due to the JPACF borrowings. • Flexible assumptions (Option 3) – the rates shown on the graph for Flexible are for a 10
year variable term. As Option 3 is repaying quicker it is assumed that the prevailing rate would be a 10 year variable rate.
6.5 Interest Rates assumed for JPACF The table below explains the rates assumed for the JPACF borrowings for each option. These are shown separately as they are by far the biggest borrowings and the biggest impact on the differences between each option
Option Interest Rates Comments
Option 1 Fixed
2017/18 – 2.82% 2018/19 – 3.22%
These rates are the fixed rates for a 15 year term for those 2 years. The model then locks down those rates for the duration of the 15 year term
Option 2 Variable
2017/18 – 2.32% to
2034/35 - 5.49%
Under option 2 the rates would vary each year. The rates would initially be lower than the Fixed Rates, but are then projected to increase and eventually be higher than the Fixed Interest rates. The final year of the 15 year term is 2034/35 when the rates are estimated to be 5.49%
Option 3 Flexible
2017/18 – 1.99% to
Option 3 is based on 10 year variable rates. The initial rate in 2017/18 is therefore assumed to be 3.2%,
0.0%
1.0%
2.0%
3.0%
4.0%
5.0%
6.0%
7.0%
Interest Rate Assumptions - Fixed, Variable & Interest Only
Option 1 - Fixed Interest (15 Year Term)
Option 2 - Variable Interest (15 Year Term)
Option 3 - Flexible (10 Year Term)

FINANCIAL ANALYSIS
34 | Page
2023/24 – 4.54% which is slightly lower than the 15 year variable rate. As per Option 2, Option 3 also assumes that the rates increase and by 2021/22 they are assumed to be higher than the Fixed Rates that have been locked down in Option 1. However Option 3 pays back the principal much quicker and the final year without borrowings is 2023/24 with an interest rate of 4.54% assumed.
6.6 Attachments As explained earlier, Attachment 1 is the Adopted 20 Year SFP, as at June 2016. Attachments 2 to 5 are the updated versions of the SFP based on the assumptions explained above: • Attachment 2 – Option 1 Fixed Interest Fixed Term • Attachment 3 – Option 2 Variable Interest Fixed Term • Attachment 4 – Option 3 Flexible Repayment • Attachment 5 – Option 3 vs. Option 1
6.7 Borrowings Estimates The graph below summarises the total estimated borrowings for the 20 years of the plan for each option. Bear in mind that all options are now based on a restated SFP which has $7m less Tamala Proceeds. The graph indicates that the borrowings would be similar for Option 1 and Option 2, but much lower for Option 3. As explained in section 6.3, Option 3 assumes that surplus municipal funds should first of all be used to reduce the raising of new borrowings before repaying existing borrowings.
$55 $55
$6 $6
$30 $30
$91 $91
$52
$0
$10
$20
$30
$40
$50
$60
$70
$80
$90
$100
Option 1 - Fixed Interest
Option 2 - Variable Interest
Option 3 - Flexible
$ms
New BorrowingsSelf Funded (EQ, MSCP)OthersJPACFOverall City Loans

FINANCIAL ANALYSIS
35 | Page
6.8 Loan Repayments The graph below shows the annual loan repayments for each option. Options 1 & 2 have a stable set of repayments in comparison to the volatile repayments of Option 3. Option 3 has large repayments in 2023-24 due to Edgewater Quarry sales proceeds and surplus municipal funds), which then reduce the principal outstanding significantly and causing future repayments to be lower.
6.9 Principal outstanding The graph below shows the principal outstanding for each option. This indicates that at Year 20 (2034/35) Options 1 and 2 still have principal outstanding on loans but Option 3 though has repaid all principal by 2024/25. At 2024/25 there is still $53m principal for Option 1 and 2 this large gap to Option 3 is caused mostly by the following two factors: • $18m less transferred into Strategic Asset Management Reserve (SAMR) for Option 3.
The mechanism for Option 3 assumes that surplus funds should be used to repay borrowings before the reserve is topped back up. The issue of paying $18m less in Option 3 may appear to give it an unfair advantage to Option 1 and 2, but this is not the case – under Option 1 and Option 2 the loan repayments are stretched out over a longer period (15 years for the JPACF) resulting in surplus cash - to balance the books the cash has to go to either Reserve or Capital Renewal as described below – it is therefore completely appropriate the Option 3 has the benefit of less transferred into reserves.
• $29m less set aside for Capital renewal in Option 3. The SFP model currently strives to achieve an Asset Sustainability Ratio of between 90% and 110% and to achieve this surplus funds are shown as Backlog Capital Replacement. The allocation to Capital renewal is arbitrary and is not identified against specific programs. There is already large increases built into the SFP in specific programs from 2020/21 (e.g. Road Resurfacing increases from $7m to $10m) and it is possible that the arbitrary allocation to Backlog Replacement is unnecessary – this will ultimately be determined by the completion of all Asset Management Plans. In the meantime Option 3 has assumed that
$0.0
$5.0
$10.0
$15.0
$20.0
$25.0
$30.0
$35.0
$ms
Loan Repayments (Principal & Interest)
Option 1 - Fixed Interest
Option 2 - Variable InterestOption 3 - Flexible

FINANCIAL ANALYSIS
36 | Page
priority can be given for repayment of borrowings rather than the allocation to unidentified backlog capital replacement.
From 2024/25 onwards Option 3 makes up for the above two factors as it is in a stronger position than Option 1 and 2 with no borrowings. Therefore by Year 20, Option 3 has more in reserve than Option 1 or Option 2. The ability to reduce the principal to zero by 2024/25 is also underpinned by the other assumptions in the SFP, most notably the increase in General Rates between 4% and 5% for the next few years. If the City does not increase General Rates by 4% to 5% in the next few years then the principal could not be repaid by 2024/25. However the General Rates increases are the same in all three options so the differences in the options would be the same.
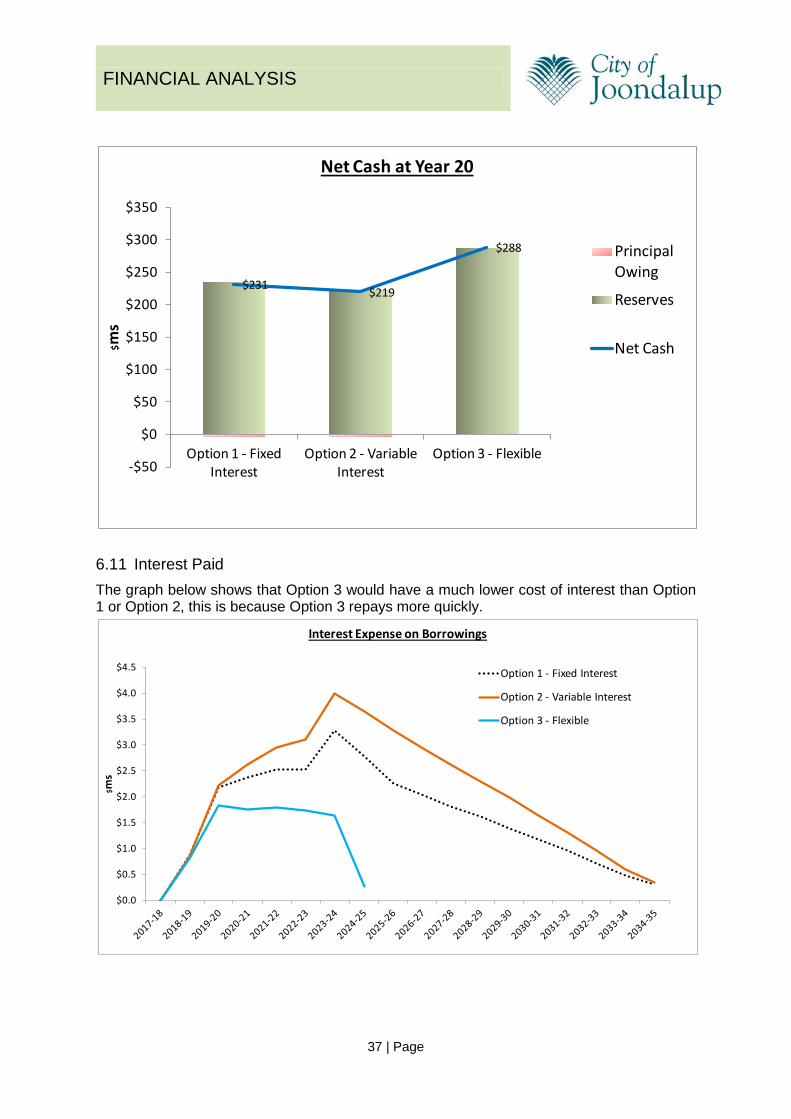
6.10 Net Cash at Year 20 The graph below is the total net cash at 2034/35, which is the difference between cash reserves and principal outstanding. Option 3 has the better outcome with Options 1 and 2 lagging behind. This is because Option 3 makes a much better use of cash then Option 1 and 2.
$53
$0
$10
$20
$30
$40
$50
$60
$70
$80
$ms
Principal Outstanding
Option 1 - Fixed Interest
Option 2 - Variable Interest
Option 3 - Flexible
FINANCIAL ANALYSIS
37 | Page
6.11 Interest Paid The graph below shows that Option 3 would have a much lower cost of interest than Option 1 or Option 2, this is because Option 3 repays more quickly.
$231 $219
$288
-$50
$0
$50
$100
$150
$200
$250
$300
$350
Option 1 - Fixed Interest
Option 2 - Variable Interest
Option 3 - Flexible
$ms
Net Cash at Year 20
Principal Owing
Reserves
Net Cash
$0.0
$0.5
$1.0
$1.5
$2.0
$2.5
$3.0
$3.5
$4.0
$4.5
$ms
Interest Expense on Borrowings
Option 1 - Fixed Interest
Option 2 - Variable Interest
Option 3 - Flexible

FINANCIAL ANALYSIS
38 | Page
6.12 Operating Surplus Ratio Option 3 has lower interest payments and higher interest earnings compared to Options 1 and 2 and therefore has a better Operating Surplus Ratio outcome.
6.13 Debt Service Coverage Ratio As explained in section 5, the City strives for a multiple of 5, but the minimum threshold can be a multiple of 3 as advised by WATC. Option 3 falls below the multiple of 3.0 in 2 years, and these 2 years show as failures in the WATC Borrowings Criteria. However one of the problems with the Debt Service Coverage Ratio is that it fails to acknowledge one-off events which trigger large repayments (e.g. sales proceeds from Edgewater Quarry) which accounts for 1 of the years that has failed. The other year that is failed is again due to a healthy reason, the projection that the loan repayments in 2019/20 could be high so as to pay back as much principal as possible. Both failures of the ratio for Option 3 may therefore be acceptable, but there would need to be detailed discussions anyway with WATC if Option 3 was preferred.
-6.0%
-4.0%
-2.0%
0.0%
2.0%
4.0%
6.0%
8.0%
2015-16 2016-17 2017-18 2018-19 2019-20 2020-21 2021-22 2022-23 2023-24 2024-25 2025-26 2026-27
Operating Surplus Ratio (5 Year Average)
Option 1 - Fixed Interest
Option 2 - Variable Interest
Option 3 - Flexible

FINANCIAL ANALYSIS
39 | Page
6.14 WATC Criteria The graph below shows that Option 2 and Option 3 would fail the WATC criteria in some of the years, the failure is due to the Debt Service Coverage Ratio falling below a multiple of 3.
0.0
1.0
2.0
3.0
4.0
5.0
6.0
7.0
8.0
2015-16 2016-17 2017-18 2018-19 2019-20 2020-21 2021-22 2022-23 2023-24 2024-25 2025-26 2026-27
Debt Service Coverage Ratio
Option 1 - Fixed Interest
Option 2 - Variable Interest
Option 3 - Flexible
Desired Threshold
0
1
2
0
1
1
2
2
3
Option 1 - Fixed Interest
Option 2 - Variable Interest
Option 3 - Flexible
WATC Borrowings Criteria - No of Years Failed
Net Debt Ratio
Debt Service Coverage Ratio

FINANCIAL ANALYSIS
40 | Page
6.15 Key Ratios The graph below summarises the overall impact on Key Ratios. The achievement of a Balanced Cash budget is a must for all 20 years which is the case for all options. Likewise it is crucial that the Debt Service Coverage Ratio is achieved in all 20 years. The only difference between the options is the Asset Sustainability Ratio because the repayments under option 3 are given a higher priority than expenditure to backlog replacement. The Key Ratios are there to help guide the development and review of the plan, but it may not be necessary or ideal for the City to achieve every ratio every year.
20 20 20
20 20 20
12 12 12
20 20 20
13 13 11
85 85 83
0
10
20
30
40
50
60
70
80
90
100
Option 1 - Fixed Interest
Option 2 - Variable Interest
Option 3 - Interest Only
Key Ratios (Max 100)
Asset Sustainability Ratio %
Debt Service Coverage Ratio
Operating Surplus Ratio %
Balanced Cash Budget
Rate % Increase
FINANCIAL ANALYSIS
41 | Page
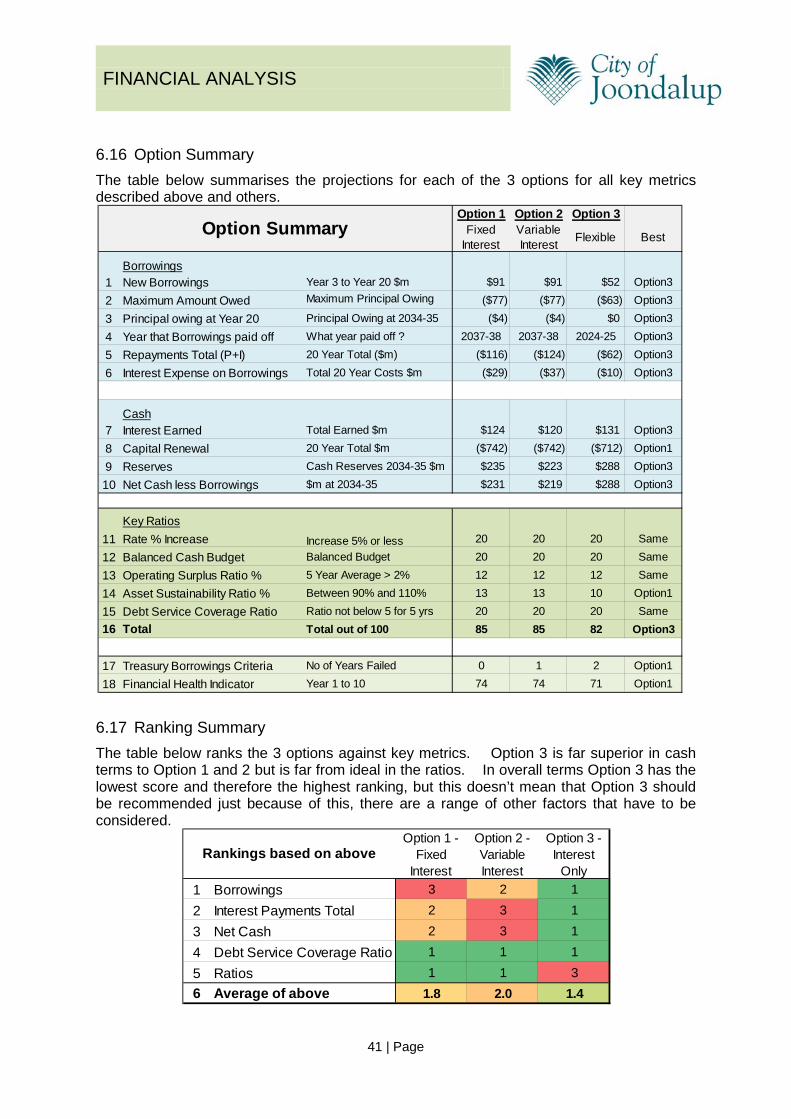
6.16 Option Summary The table below summarises the projections for each of the 3 options for all key metrics described above and others.
6.17 Ranking Summary The table below ranks the 3 options against key metrics. Option 3 is far superior in cash terms to Option 1 and 2 but is far from ideal in the ratios. In overall terms Option 3 has the lowest score and therefore the highest ranking, but this doesn’t mean that Option 3 should be recommended just because of this, there are a range of other factors that have to be considered.
Option 1 Option 2 Option 3Fixed
InterestVariable Interest Flexible Best
Borrowings1 New Borrowings Year 3 to Year 20 $m $91 $91 $52 Option3
2 Maximum Amount Owed Maximum Principal Owing $
($77) ($77) ($63) Option3
3 Principal owing at Year 20 Principal Owing at 2034-35 ($4) ($4) $0 Option3
4 Year that Borrowings paid off What year paid off ? 2037-38 2037-38 2024-25 Option3
5 Repayments Total (P+I) 20 Year Total ($m) ($116) ($124) ($62) Option3
6 Interest Expense on Borrowings Total 20 Year Costs $m ($29) ($37) ($10) Option3
Cash7 Interest Earned Total Earned $m $124 $120 $131 Option3
8 Capital Renewal 20 Year Total $m ($742) ($742) ($712) Option1
9 Reserves Cash Reserves 2034-35 $m $235 $223 $288 Option3
10 Net Cash less Borrowings $m at 2034-35 $231 $219 $288 Option3
Key Ratios11 Rate % Increase Increase 5% or less 20 20 20 Same
12 Balanced Cash Budget Balanced Budget 20 20 20 Same
13 Operating Surplus Ratio % 5 Year Average > 2% 12 12 12 Same
14 Asset Sustainability Ratio % Between 90% and 110% 13 13 10 Option1
15 Debt Service Coverage Ratio Ratio not below 5 for 5 yrs 20 20 20 Same16 Total Total out of 100 85 85 82 Option3
17 Treasury Borrowings Criteria No of Years Failed 0 1 2 Option1
18 Financial Health Indicator Year 1 to 10 74 74 71 Option1
Option Summary
Option 1 - Fixed
Interest
Option 2 - Variable Interest
Option 3 - Interest
Only1 Borrowings 3 2 1
2 Interest Payments Total 2 3 1
3 Net Cash 2 3 1
4 Debt Service Coverage Ratio 1 1 1
5 Ratios 1 1 36 Average of above 1.8 2.0 1.4
Rankings based on above

FINANCIAL ANALYSIS
42 | Page
7 FIXED INTEREST AGREEMENTS – OTHER ISSUES
7.1 Lack of Flexibility One of the major disadvantages with fixed interest arrangements is the lack of flexibility and ability to adapt to changing circumstances. If the City sets up a 15 year Fixed Interest Fixed Term for the JPACF project it is stuck with it. This may not be ideal if there were changes in some circumstances. For example it is intended that the proceeds from Tamala Park land sales are used to assist in the repayment of the JPACF borrowings. If the property market improved and the Tamala Park land sales were higher than the loan repayments in one year, then the surplus proceeds would just have to be put into reserve. This may not be the optimal treasury solution if there was flexibility – it is likely that the earnings on those reserves would be less than the benefit that the City would otherwise have had, had it been able to reduce the borrowings outstanding and reduce the interest costs. Unfortunately a Fixed Interest arrangement does not provide for flexible repayments without there being a cost (“early termination charges”). Furthermore if the variable interest rates eventually become lower than the fixed rates (which they are likely to), then the City is paying higher interest costs than it may be. This is illustrated further in the next paragraph with regards the existing borrowings that the City has.
7.2 Existing Borrowings The chart below compares the interest cost (%) for all existing City borrowings and compares to the RBA cash rate and the estimated variable rate that the City may have paid had it set up the borrowings on a variable rate basis. This shows that all borrowings have paid a higher cost than it may otherwise have had to. Had variable interest rates been used instead of fixed rates, this could have reduced the interest expense on borrowings of circa $2m (this is based on the full costs of interest over the terms of the loans). It is vital to emphasise that this does not mean that the City made any bad judgement/error in setting up these loans. Fixed Interest Loans have significant advantages over other arrangements i.e. certainty, transparency. The City doesn’t have a crystal ball and cannot be expected to foresee the trend in interest rates. At the time of setting the earlier loans which are at over 5% it may well have been a view that the interest rates would increase in the years ahead not reduce. The economy (both nationally and globally) has been subject to significant volatility since the GFC.

FINANCIAL ANALYSIS
43 | Page
7.3 ACELG The ACELG report provides further comments regarding the use of Fixed Interest Rates and other general observations regarding local government approach to borrowings • In Local Government, debt levels should not be as “low as possible”” in an absolute
sense but should instead be as low as possible relative to what is needed by a Local Government in order to provide affordable, preferred service levels on an ongoing basis.
• Any well managed organisation that is dependent on large investment in infrastructure assets to deliver its service objectives is probably justified in having a considerable level of borrowings.
• It might be appropriate for households or businesses to borrow at fixed rates as they have little capacity to accommodate potential increase in variable rates, but local governments different fundamentally as they have a high degree of certainty regarding future income projections and can set their own income levels.
• A sound long term financial plan can help make decisions about affordable and appropriate levels of debt.
• A rational person would pay off credit card debt in full if possible (and thereby avoid interest charges) rather than only make the required minimum monthly payment rather than keep money in the bank for a rainy day. Local Governments could operate in the same manner, potentially avoiding raising borrowings when they have sufficient cash and liquidity to meet immediate foreseeable needs
• A Local Government is exposed to interest rate risk whenever it borrows, or lends money, regardless of whether the interest rates fixed or variable. Locking into a long term fixed interest rate borrowing effectively means that a Local Government is taking a risk that the variable interest rates over the period of the borrowing will be higher than the fixed rate. If a Local Government takes out a fixed interest rate loan and interest rates on average fall over the duration of the loan then the Local Government will be worse off than it would have been if it had taken out a variable interest rate. Such a Local Government may not
0.00%
1.00%
2.00%
3.00%
4.00%
5.00%
6.00%
7.00%
Interest Rate on Existing Borrowings vs Variable Rate
Sorrento Beach
Aquatic Facilities
West Coast Drive
RLCIP
Multi Storey
Variable Rate
RBA Rate
These loans taken out in 2010-11 and 2011-12 are now paying a much higher rate of interest compared to the variable rate
Loans taken out as recently as last year are now likely to pay a higher rate of interest than could otherwise have been payable under a Variable loan

FINANCIAL ANALYSIS
44 | Page
have been intending to risk on interest rate movements but choosing a fixed interest rate does not obviate risk, it only removes only one risk, the risk from higher average variable interest rates.
• On average fixed interest rate borrowings are usually slightly more expensive than variable rate borrowings because of the certainty they offer. Fixed Interest effectively reflect the market’s expectations of likely variable interest rates over the term plus a margin for the interest rate risk borne by the lender
• Fear of debt is a key barrier to the optimal use of debt financing in local government. • Many Local Governments have traditionally engaged in single purpose borrowings to
finance a particular project regardless of their current holdings or future cash flow projections
• Even when Local Governments have undertaken borrowings to finance specific assets it may be more fruitful for them to think of those borrowings as simply part of the overall mix from their total stock is financed. This will enable borrowing to be managed holistically and to focus on reducing interest costs. It can be misleading to link the cost of borrowings to the acquisition of some assets and not to others; such an approach is arbitrary, illusory and distracting. Local Governments need to manage their total expenses, total assets and total liabilities.
7.4 Intergenerational Inequality One of the problems with quick repayment terms is that it puts the burden of payment on existing ratepayers whereas future ratepayers enjoy the benefit of the asset. To improve intergenerational equality a longer repayment term in line with the life of the asset/project (e.g. 40 years) could be considered. However loans that are too long are inefficient because the costs of interest end up being higher than the principal. Indeed a 20 year repayment term is considered to be inefficient but for comparative purposes is included in this evaluation. Future ratepayers will have the burden of capital replacement and the ongoing operational subsidy from a new project/facility.

FINANCIAL ANALYSIS
45 | Page
8 NON FINANCIAL EVALUATION
8.1 RAG The table compares each of the 3 options in a simplified RAG format. The scoring is made with comparison to the other options i.e. where an option is shown as red this just means it is not as good as the other options but this does not necessarily mean that that particular metric is a major concern. In summary this shows that there are dis/advantages with the different options, Option appears to be an arrangement that provides more certainty but has significant disadvantages to the other methods.
Issue Option 1 Option 2 Option 3 Comments
Issue DescriptionFixed Interest Fixed Term
Variable Interest Fixed
Term
Interest OnlyReason for different scores
1 TRANSPARANCYHow easy is it to identify the exact repayments for each project ?
The existing method of setting up and monitoring repayments is extremely transparant and can be clearly identified to each project that the borrowings are set up for.If the City moved to an Interest only arrangement it would make the cashflows attributable to each project slightly more tricky to identify.
2 MANAGEMENTEnsure that payments are made accurately in accordance with contract and on time.
Similar to above, Option 2 would be slightly more cumbersome to manage than Option 1 (but not that much more difficult). Option 3 would require a set of new actions and monitoring processes to manage the risks.
3 RISK / CERTAINTY
Could the City be subject to unforeseen exernal economic impacts that result in signficant impacts to long term plans.
Existing method (Option 1) provides great certainty and minimises risk because if Interest Rates were to unexpectedly to increase the borrowing terms would be fixed.Option 2 would be subject to fluctuations in interest rates.Option 3 is also assumed to be variable
4LOST OPPORTUNITY
Does the option limit the ability to have lower repayment costs?
Fixed Interest Rates provide little opportunity to take advantage of lower rates. Existing arrangements can be amended, but this comes with a cost.
5 SPECULATINGIs the method used a form of speculating that the City will beat the Market
Option 1 provides certainty but is a form of speculating because the City is speculating that it is better to have a fixed rate rather than go with market rates (variable rates). There is normally a premum to pay for Fixed Interest Rates.Options 2 and Options 3 would take advantage of the market rates and are NOT speculative.
6 FLEXIBILITY Ability to react to changing circumstances
Option 3 would be able to react more quickly to changing circumstances

FINANCIAL ANALYSIS
46 | Page
SENSITIVITY ANALYSIS
9 ECONOMIC CLIMATE
9.1 Global & National The Global economy is arguably in a worse position than it was at the time of the GFC. There is a huge amount of uncertainty, and there are growing concerns from many parties that the next global financial crisis is looming. Some of the danger signs regarding the global economy are: • China – slowdown of growth. • Quantitative Easing – financial institutions around the globe (US, Japan, Europe, UK)
have printed money with the aim of the keeping their economies afloat. They can’t keep printing forever.
• Oversupply - It is now confirmed also that there is an oversupply of many items, for example apartment units in Australian Cities. The low supply of money has fed the production and growth without this being backed up by demand.
• Interest Rates are at an unprecedented level. Indeed in some economies (e.g. Japan), there are negative rates on govt bonds. Meanwhile the UK recently reduced their rates from 0.5% to 0.25%
• Inflation – under any normal circumstances the vast amount of printing money would have resulted in inflation but it hasn’t. It is possible at some stage that there could be high inflation (and potentially much higher interest rates).
• Overpriced stock markets – most major stock markets are generally accepted as being overpriced. The principal measure for this is the Price/Earnings ratio which compares the price of a share to the earnings (dividends) received. The overall average in Australia is much higher than the long term average which indicates that stocks are offering a very low rate of return compared to their price
The above issues are not necessarily issues that the City of Joondalup can be overly concerned about, after all the City is not an investor. However there is a risk of volatility in the future which could have a significant impact on interest rates and depending on the arrangements in place for repayments could have a major impact. Whilst the issues regarding a potential further collapse may appear to be scaremongering one should remember the catastrophic impacts that one would not have thought possible in 2007 (major investment houses going bust and banks bailed out by governments).
9.2 West Australia The West Australian economy has also suffered from slower growth in the past couple of years and is in a period of transition from a resources boom. Some key impacts have been • Property market slowdown, causing a reduction in the Tamala Park proceeds • Unemployment increases • Wages increase are much smaller • Rates revenue increases smaller • Closure of some major retail enterprises (e.g. Masters, Dick Smith). Whilst the business
model for these businesses may have had an impact, the slowing economy also contributed.

FINANCIAL ANALYSIS
47 | Page
9.3 OECD (22nd September 2016) The OECD (Organisation for Economic Co-operation and Development) issued a global economic warning on 22nd September 2016, saying conditions are worsening with low interest rates threatening the future of the entire banking system. The OECD referred to risks growing in China and continuing problems in the US, Europe, Britain and Japan. The report said that the world appeared trapped in a cycle of low growth, stagnant wages and ebbing productivity and that lower interest rates could not solve the global economy’s woes. Whilst the Reserve Bank in Australia has taken interest rates to a record low, government debt in 35 per cent of the developed world is being sold at negative rates.

FINANCIAL ANALYSIS
48 | Page
10 SENSITIVITY ANALYSIS (1) – CHANGES IN INTEREST RATES
10.1 Overview The sensitivity analysis is arguably more important than the evaluation in the earlier section. The projected values are only estimates based on assumptions, and the final outcome will be different for one reason or another. The interest rate assumptions shown in Appendix 1 will not come to pass exactly as stated; they will either be higher or lower. The key issue is to consider how much higher or lower the rates could be and what the impacts could be for each option. The next few paragraphs will provide analysis of some of the key metrics, based upon the scenario of the interest rates being lower or being higher than projected. This information must be assessed just as importantly as the projections in section 7.
10.2 Scenario Analysis – 8 Interest Rate Scenarios There are 8 scenarios applied for the 3 options (Fixed, Variable or Flexible) across a range of different metrics. The 8 scenarios are all based on the interest rate projections being lower or higher than the projections in Appendix 1 and used in earlier evaluation. The 8 scenarios are explained as follows • Scenarios 1 to 3 - The first 3 scenarios all consider the impact if the interest rate were
lower than the projected interest rates. The sensitivity analysis has only went as far as considering a reduction of 1%, 2% or 3% because the interest rates in the early years are already low
• Scenarios 4 to 8 then evaluate the costs of interest rate rises, in 2 per cent increments i.e. 2%, 4%, 6%, 8%, 10^%. There are more scenarios for interest rate increases just so the magnitude of the risk can be considered in more depth than the opportunity. It is not suggested that it is more likely that interest rates will increase, indeed in the short-term (next 2 to 5 years) it is generally accepted that interest rates will reduce further.
The graph below shows the interest rate scenarios applied to Option 1 (Fixed). The dashed line is the assumption used earlier. The graph shows the 3 scenarios considered where interest rates are lower than the projections and then the 5 scenarios where interest rates are higher.

FINANCIAL ANALYSIS
49 | Page
10.3 Interest Expense on Borrowings – Sensitivity Analysis The first metric considered in the Sensitivity Analysis shows the overall 20 year cost of the interest expense on borrowings. This shows similar trend for each option, with reduced interest costs for Scenarios 1 to 3 and higher interest payments for Scenarios 4 to 8. Option 3 has the better results for all scenarios, and the worse the interest rate becomes the better it is compared to the other options.
0.0%
2.0%
4.0%
6.0%
8.0%
10.0%
12.0%
14.0%
16.0%
18.0%
Interest Rate Scenarios
10% more
8% more
6% more
4% more
2% more
as per WATC projection1% less
2% less
Interest Expense on Borrowings- Sensitivity Analysis
Option 1 - Fixed
Interest
Option 2 - Variable Interest
Option 3 - Flexible
Interest Rate LESS than projected1 3% less ($9) ($17) ($2)
2 2% less ($16) ($23) ($5)
3 1% less ($22) ($30) ($7)
Interest Rate as projected ($29) ($37) ($10)
Interest Rate MORE than projected4 2% more ($44) ($53) ($16)
5 4% more ($60) ($69) ($22)
6 6% more ($76) ($86) ($30)
7 8% more ($94) ($105) ($40)
8 10% more ($115) ($130) ($51)

FINANCIAL ANALYSIS
50 | Page
10.4 Borrowings – Sensitivity Analysis The table below shows the projected 20 year borrowings for each scenario and option. There is little variation between the scenarios because most of the borrowings are in the early years of the plan and the scenarios have less impact in the earlier years.
10.5 Net Cash – Sensitivity Results The difference between Option 3 and the others below is much more profound with the Net Cash results summarised below. Options 1 and 2 would have significantly lower net cash at year 20 due to the prolonged (15 year) term of high interest rates, whereas Option 3 would pay off principal as quickly as possible and negates the higher rates as much as possible
Borrowings 20 Year TotalSensitivity Analysis
Option 1 - Fixed
Interest
Option 2 - Variable Interest
Option 3 - Flexible
Interest Rate LESS than projected1 3% less $89 $89 $51
2 2% less $90 $90 $51
3 1% less $90 $90 $52
Interest Rate as projected $91 $91 $52
Interest Rate MORE than projected4 2% more $92 $92 $52
5 4% more $92 $92 $53
6 6% more $93 $93 $53
7 8% more $94 $94 $56
8 10% more $95 $95 $60
Net CashSensitivity Analysis
Option 1 - Fixed
Interest
Option 2 - Variable Interest
Option 3 - Flexible
Interest Rate LESS than projected1 3% less $259 $248 $292
2 2% less $250 $239 $291
3 1% less $241 $229 $289
Interest Rate as projected $231 $219 $288
Interest Rate MORE than projected4 2% more $210 $200 $285
5 4% more $194 $182 $283
6 6% more $172 $158 $277
7 8% more $150 $139 $264
8 10% more $131 $117 $249

FINANCIAL ANALYSIS
51 | Page
10.6 Debt Service Coverage Ratio The table below shows that Option 1 and Option 2 would be more exposed to failures in the Debt Service Coverage Ratio as a result of higher interest costs. Option 3 would only fail the ratio under Scenario 3.
10.7 Total Ratios The table below shows that Option 3 achieves fewer ratios than Option 1 and 2.
Treasury Borrowings CriteriaNumber of Years Failed out of 20
Option 1 - Fixed
Interest
Option 2 - Variable Interest
Option 3 - Flexible
Interest Rate LESS than projected1 3% less 0 0 2
2 2% less 0 0 2
3 1% less 0 0 2
Interest Rate as projected 0 1 2
Interest Rate MORE than projected4 2% more 1 2 2
5 4% more 2 3 3
6 6% more 3 3 3
7 8% more 3 3 3
8 10% more 5 5 4
Total RatiosNumber Achieved out of 100
Option 1 - Fixed
Interest
Option 2 - Variable Interest
Option 3 - Flexible
Interest Rate LESS than projected1 3% less 86 86 84
2 2% less 85 85 84
3 1% less 85 85 83
Interest Rate as projected 85 85 82
Interest Rate MORE than projected4 2% more 84 81 82
5 4% more 81 80 81
6 6% more 79 79 81
7 8% more 78 76 80
8 10% more 76 75 75
FINANCIAL ANALYSIS
52 | Page
10.8 Summary Sensitivity Analysis In summary, the sensitivity analysis indicates that Option 3 is more responsive to higher interest rates than Option 1 and Option 2. This is demonstrated in lower interest costs, higher net cash and better Debt Service Coverage Ratio. The only metric where Option 3 is worse off is the Total Ratios, due to the Asset Sustainability Ratio.
10.9 Likelihood of Interest Rate Changes It is expected that there will be further reductions in the RBA rate (currently at 1.5%) and therefore further reductions in the cost of borrowings. However it is impossible to predict with any great certainty where the rates may go and taking account of the economic climate, there is also a possibility that rates will increase. Either way the scenarios show that Option 3 provides a better outcome than Option 1 or Option 2 because of the quicker repayment of principal.

FINANCIAL ANALYSIS
53 | Page
11 SENSITIVITY ANALYSIS (2) – GENERAL RATES
11.1 Current Assumptions All of the options evaluated previously, and all of the scenarios above, all assume the same Rates % Increases as per the Adopted SFP. The SFP has assumed rates increases of between 4% to 5% for future years. Increases of 4% to 5% for the next few years appear high because the rate increase for 2016/17 was 2.5% and also because the next few years are forecast to be low inflation. Meanwhile the SFP has already included low increases for costs (2% for Employment Costs in next few year and 2% to 2.5% for Materials & Contracts), and therefore the income projections appear to be out of step with the cost increases.
11.2 Lower Rates Increases It is therefore worth considering the impact on borrowings if there were lower General Rates increases. The graph below shows the current assumptions within the adopted SFP and the alternative scenario of having a 2.5% increase for the next 3 years.
11.3 Longer to Repay Principal The graph below compares the impacts for Option 1 and 3 of having lower increases in General Rates. Also shown on the graph is the projections based on the earlier analysis. This shows that for Option 3 it will take a couple of more years for the principal to be repaid.
$0
$10
$20
$30
$40
$50
$60
$70
$80
$90
$ms
Principal Outstanding
Option 1 - Fixed Interest
Option 3 - Flexible
Option 1 but lower General Rates increases
Option 3 but lower General Rates increases

FINANCIAL ANALYSIS
54 | Page
11.4 Impact on 3 Options The table below summarises the impact of the lower General Rates increases on each option. Net Cash would be much worse off for all options, but Option 3 would still have the higher outcome.
Option 1 Option 2 Option 3
Fixed Interest
Variable Interest Flexible Best
Borrowings1 New Borrowings Year 3 to Year 20 $m $132 $137 $80 Option3
2 Maximum Amount Owed Maximum Principal Owing $
($83) ($83) ($73) Option3
3 Principal owing at Year 20 Principal Owing at 2034-35 ($31) ($35) $0 Option3
4 Year that Borrowings paid off What year paid off ? 2037-38 2037-38 2026-27 Option3
5 Repayments Total (P+I) 20 Year Total ($m) ($140) ($150) ($101) Option3
6 Interest Expense on Borrowings Total 20 Year Costs $m ($39) ($48) ($21) Option3
Cash7 Interest Earned Total Earned $m $84 $83 $82 Option4
8 Capital Renewal 20 Year Total $m ($710) ($707) ($689) Option1
9 Reserves Cash Reserves 2034-35 $m $79 $76 $84 Option3
10 Net Cash less Borrowings $m at 2034-35 $47 $40 $84 Option3
Key Ratios11 Rate % Increase Increase 5% or less 20 20 20 Same
12 Balanced Cash Budget Balanced Budget 19 19 20 Option3
13 Operating Surplus Ratio % 5 Year Average > 2% 8 8 8 Same
14 Asset Sustainability Ratio % Between 90% and 110% 10 10 8 Option1
15 Debt Service Coverage Ratio Ratio not below 5 for 5 yrs 17 16 20 Option316 Total Total out of 100 74 73 76 Option3
17 Treasury Borrowings Criteria No of Years Failed 3 3 4 Option1
18 Financial Health Indicator Year 1 to 10 66 64 64 Option1
Sensitivity Analysis (2)General Rate Increases Lower than
planned

FINANCIAL ANALYSIS
55 | Page
12 SENSITIVITY ANALYSIS (3) – HIGHER INTEREST RATES 2020
12.1 Increase in 2020 The scenarios in Sensitivity Analysis (1) assumed that the interest rates would vary equally for all scenarios from 2017/18. The majority of the borrowings are for the JPACF in 2017/18 and 2018/19 and it is therefore worth considering the impacts if there were a large increase (e.g. 10%) in Interest Rates from 2019/20, after the JPACF had been constructed. Whilst a 10% increase in one year is of course highly unlikely it is worth evaluating because it tests the extremes of Option 1 and Option 3. So if there were a 10% increase in 2019/20 for Option 1 (Fixed Rates) the majority of the borrowings would be locked down at a lower rate in 2017/18 and 2018/19. Meanwhile for Option 3 the higher variable rates from 2019/20 would be applicable to the JPACF borrowings and the principal would be more exposed. This analysis helps to evaluate the higher risk that Option 3 may be perceived to have compared to option 1. This sensitivity analysis only compares Option 1 and Option 3 so that it is easier to review.
12.2 Summary of Options The Chart below summarises the assumptions for this analysis. This shows that for Option 1 the large JPACF borrowings in 2017/18 and 2018/19 are secured at a low rate of 2.8% and 3.2%. Meanwhile Option 3 is exposed to the higher rates on borrowings from 2019/20 onwards. Option 1 becomes exposed to the higher rates when it has to borrow in the 3 years 2020/21 to 2022/23, but the size of the borrowings are much smaller than the JPACF borrowings.
$24.7
$34.3
2.8% 3.2%
2.0% 2.4%
12.9% 13.3% 13.7% 14.1% 14.5% 15.0% 15.4%
$0.0
$5.0
$10.0
$15.0
$20.0
$25.0
$30.0
$35.0
$40.0
0.0%
2.0%
4.0%
6.0%
8.0%
10.0%
12.0%
14.0%
16.0%
18.0%
2017-18 2018-19 2019-20 2020-21 2021-22 2022-23 2023-24 2024-25 2025-26
$m B
orro
win
gs
% In
tere
st R
ate
Sensitivity 3 - Very High Increase in Interest Rates 2020
Option 1 Borrowings
Óption 3 Borrowings
Option 1 - Fixed Interest
Option 3 - Flexible

FINANCIAL ANALYSIS
56 | Page
12.3 Summary Impacts The table below summarises the impact of the sensitivity analysis. The impacts have a mixed set of results. Option 3, whilst exposed to much higher interest rates than Option 1, still has lower borrowings than Option 1 and is still able to repay all borrowings by 2025-26. The impacts on cash are mostly beneficial for Option 3 with more reserves at Year 20, albeit there is $47.9m less spent on Capital Renewal. The Key Ratios are much more of a concern for Option 3, with 9 fewer ratios achieved; this is driven by the assumptions in Option 3 to repay debt as quickly as possible whilst still achieving a balanced budget. There are 3 years where the Debt Service Coverage Ratio fails for Option 3 compared to just one for Option 1, but this is actually driven by large loan repayments and a failure of the ratio to take account of the one-off large repayments.
Option 1 Option 3 Difference
Fixed Interest Flexible Opt 3 vs
Opt 1 Best
Borrowings1 New Borrowings Year 3 to Year 20 $m $91 $57 ($34) Option3
2 Maximum Amount Owed Maximum Principal Owing $
($77) ($63) $15 Option3
3 Principal owing at Year 20 Principal Owing at 2034-35 ($6) $0 $6 Option3
4 Year that Borrowings paid off What year paid off ? 2037-38 2025-26 12 yrs Option3
5 Repayments Total (P+I) 20 Year Total ($m) ($132) ($102) $30 Option3
6 Interest Expense on Borrowings Total 20 Year Costs $m ($47) ($45) $2 Option3
Cash7 Interest Earned Total Earned $m $118 $116 ($1) Option1
8 Capital Renewal 20 Year Total $m ($742) ($694) $48 Option1
9 Reserves Cash Reserves 2034-35 $m $214 $256 $42 Option3
10 Net Cash less Borrowings $m at 2034-35 $207 $256 $49 Option3
Key Ratios11 Rate % Increase Increase 5% or less 20 20 0 Same
12 Balanced Cash Budget Balanced Budget 20 20 0 Same
13 Operating Surplus Ratio % 5 Year Average > 2% 12 10 -2 Option1
14 Asset Sustainability Ratio % Between 90% and 110% 13 9 -4 Option1
15 Debt Service Coverage Ratio Ratio not below 5 for 5 yrs 20 17 -3 Option116 Total Total out of 100 85 76 -9 Option1
17 Treasury Borrowings Criteria No of Years Failed 1 3 2 Option1
18 Financial Health Indicator Year 1 to 10 74 66 -8 Option1
Sensitivity Analysis (3)Very large increase in Interest Rates
from 2020

FINANCIAL ANALYSIS
57 | Page
13 FINANCING BY OTHER LOCAL GOVT
13.1 WATC Consultation WATC have been informally consulted about some of the options in this paper. Whilst most Local Government tends to use Fixed Interest Fixed Term arrangements, WATC did suggest that alternative flexible arrangements could be put in place. For example to accommodate the JPACF loan of circa $50m, rather than just put it on a 15 year repayment term it could be split up into different bundles with different repayment terms which allows the flexibility to repay the principal earlier if possible. If the surplus doesn’t materialise (e.g. Tamala Park reduce their distributions yet again), the loan could just be refinanced using up-to-date market rates.
13.2 Financing by other Local Government There are few examples of Local Government in WA doing anything different other than the standard fixed term fixed interest arrangements. The City of Cockburn recently completed the construction of a new sports facility and borrowings were used for a 10 year fixed interest fixed term with WATC. The City of Gosnells uses a short-term (3 years) overdraft arrangement to help with the construction of projects. Meanwhile the City of Wanneroo has taken on a $60m loan at interest-only which will have to be repaid at an agreed point in time; this loan was linked to Developer contributions and quite unique to the growth in Wanneroo.
FINANCIAL ANALYSIS
58 | Page
14 OTHER OPTIONS & ISSUES
14.1 Flexible with Balloon Payments It is possible to set up Flexible arrangements without any principal repayments during the course of the loan and only paid at the end of the loan (referred to a ‘balloon’ payment). This type of mechanism can be useful for specific projects which have a certain event that is expected to provide funds to assist with the principal repayment, such as the Edgewater Quarry project which assumes land proceeds are received 3 years after construction and can be used to repay in full the borrowings. However balloon payment type structures should only be considered for projects that have a specific event. In the case of the JPACF there is no specific year where proceeds are received to assist with principal repayments. Also there is no timeframe in which the JPACF becomes profitable and should be used to repay principal. The key component for JPACF repayments is the Tamala Park proceeds, which are uneven and whose schedule changes each year due to property market conditions. Therefore for projects such as JPACF which can be regarded as traditional type borrowings which have to be honoured against general municipal funds, a balloon type structure is not viable.
14.2 Reserves Freed Up There is a further opportunity the City could consider in the use of reserves. The graph below summarises the assumptions for costs of borrowings (15 year term) versus the expected % earnings on cash. This shows that the costs of borrowings are expected to be higher than cash reserves. In reality this is not always the case, but this is a reasonable assumption for this report and indeed for considering future borrowing arrangements. On this basis, the overall City cashflows would be better off by using cash to minimise interest costs rather than tied up in reserves. There are several reserves which cannot be considered in this way as they are tied up for legislative reasons (e.g. employee provisions), However where there are reserves established at the direction of Local Government (e.g. Parking Reserve) which are designated for a specific purpose, the funds could be freed up (on Local Government approval) to reduce borrowings. This option has been modelled (Option 3c) and was combined with other features of Option 3b (i.e. repay principal as quickly as possible) – there were marginal benefits and it is worth considering at a later point in time. There is enough to consider in this report with interest-only borrowings without complicating the scenarios further with changing the use of reserves.

FINANCIAL ANALYSIS
59 | Page
14.3 Day to Day Surpluses Could Reduce Costs of Borrowing Following on from above there is yet another scenario that could potentially be evaluated. On a day to day basis short-term surpluses could be used to offset (reduce) the costs of borrowing rather than banked. This facility could operate in the same way as an offset account works for a household mortgage. The graph below shows the surplus funds that are available to the City during the year as General Rates are received in advance of expenditure during the year. This option has not been explored in detail and is potentially an issue for future consideration.
0.0%
1.0%
2.0%
3.0%
4.0%
5.0%
6.0%
7.0%
Costs of Borrowings vs Earnings on Cash
Costs of Borrowing (15 Year Fixed Rate)
Assumed Earnings % on Cash
-$20
-$10
$0
$10
$20
$30
$40
$50
$60
Jul Aug Sep Oct Nov Dec Jan Feb Mar Apr May Jun
$ms
Surpluses day to day

FINANCIAL ANALYSIS
60 | Page
14.4 Existing Borrowings Refinanced and/or use existing Reserves to pay off As explained in Section 3, the analysis in this report has simply assumed that the cashflows for all existing borrowings will continue as they are, and are therefore treated equally in all options. However the existing borrowings were set up on Fixed Interest Rate arrangements, which are higher than the current prevailing rate and much higher than the interest being earned on cash reserves. If the City did adopt a more holistic approach to financing and the use of reserves, then it could re-evaluate the existing borrowings by reviewing the use of all existing reserves.
14.5 Market Options instead of WATC WATC is the primary provider of borrowings to Local Government. It is highly unlikely the City would want to consider alternative forms of finance from other providers. In any case, other lenders would expect borrowings to be secured against assets, whereas WATC borrowings are simply secured against general municipal funds.
14.6 Lock in Low Fixed Interest Rates Now A potential option for the City if it is intent on the continued use of Fixed Interest is to lock in a rate in advance of needing it. For example if the JPACF was approved then the borrowings could be secured 2 or 3 years ahead of when the final construction payments are made. This option is an extreme version of Option 1, it would provide great transparency/certainty to the City, but suffers even more from all of the other disadvantages of Option 1 (lack of flexibility, costs more in the long run compared to Option 3)./
14.7 Financing Increased Renewal Expenditure / Asset Renewal Reserve The City is relatively young in terms of the age of its assets and infrastructure, most of which will not yet have required replacement. However the City will eventually need to increase the amount of Capital Renewal expenditure to ensure that the infrastructure provide the levels of service that the Community expects. The Adopted SFP has already built in estimated increases for several capital programs, and has identified potential additional expenditure to ensure that it can renew assets in line with consumption. The exact levels of capital renewals required for each program will be determined from detailed Asset Management Plans; these are in the process of being updated. The City will need to assess how it plans and finances increased renewal expenditure. The City could just continue with the current default approach within the SFP where higher capital renewals are built into the projections in the year in which they are expected to be required and there are adequate municipal funds to finance the expenditure. Alternatively, the expenditure could be smoothed out to avoid large lumps of expenditure. Another financing approach is to set aside funds each year in advance into a reserve (e.g. an Asset Renewal Reserve) which is then built up and finances the expenditure when required. This report does not seek to recommend the best approach for financing increased renewals. However the establishment of an Asset Renewal Reserve would be at odds to the recommendation for Option 3 where surplus funds are better used to repay borrowings, rather than build up reserve funds. At this stage the City has insufficient information regarding future renewal requirements to evaluate the optimum financing route, this will be

FINANCIAL ANALYSIS
61 | Page
assessed each year as part of the updates to the SFP and as Asset Management Plans for each program are finalised. The key issue though is that the City must be aware of increased renewal expenditure in years ahead and that it will need to plan for this – at present the SFP and the various options evaluated in this report have included indicative estimates of increased renewal expenditure.

FINANCIAL ANALYSIS
62 | Page
SUMMARY – RECOMMENDATION & NEXT STEPS
15 RECOMMENDATION
15.1 Repayment Terms – Maximum 15 years The analysis in this report does not make a recommendation that there should be a standard term applied to all borrowings (5, 10, 15 or 20 years). The report finds that the current process of considering the term relative to the size of the borrowings is the most appropriate. The analysis is conclusive in respect of a 20 year repayment term, this is inefficient due to the size of the interest payments and despite the intergenerational inequality that may appear to arise with shorter repayments, it is normally always better to repay borrowings as quickly as possible (depending on cash flow).
15.2 Recommendation - Flexible Arrangements with Flexible Repayment With regards the type of arrangement (Fixed, Variable or Flexible) it is recommended that the City sets up borrowings from 2017/18 onwards on an interest only basis with flexible repayment terms. This recommendation is made taking account of all the information in this report, specifically that: • Section 6 has assessed Option 1, 2 and 3 against a range of metrics. Option 3 (Flexible)
comes out on top in most areas, only failing slightly with the Asset Sustainability Ratio. • Borrowings could be repaid by 2024-25 (Option 3) rather than 2037/38 (Option 1 and
Option 2) • Sensitivity analysis also indicates that Options 1 and 2 would be worse for the City with
higher rates. Option 3 provides the ability to repay much quicker and therefore mitigates this risk. This may appear to be at odds with normal understanding that Fixed Interest mitigates risk, but the risk is only mitigated after the borrowings are set up and only if the Variable rate increases much more than the Fixed Rate.
• RAG Analysis – Fixed Rates provide less flexibility Option 3 is also better off when the Guiding Principles are considered because: • Prudent – Option 3 pays off borrowings quicker which is a more prudent approach than a
protracted 15 year repayment term • Long Term approach – the analysis in this report has considered the long-term • Flexibility
15.3 Additional Monitoring Processes for Flexible Repayment Arrangements The traditional method of financing (Fixed Interest) provided a clear view of City cashflows that would provide certainty in the annual budget. There would be no issues during the financial year in terms of the amount to be repaid because it would be known. However with a Flexible Repayment arrangement there would need to be additional tasks to ensure the City was proactively managing the process. This could involve one or more of the following: • Finance Committee – it may be useful for the City to prepare a bi-monthly report to the
FC which provides details of: - Interest Rate currently applicable on borrowings ? - How is the interest rate compared to the budget ?

FINANCIAL ANALYSIS
63 | Page
- When is next repayment of borrowings due, and is there capacity to pay more ? • Mid Year Review – may also be a useful opportunity to review the current position with
borrowings, risks and whether there is potential for more repayments than budgeted ? • Report to Audit Committee to comment on the risks/sensitivity of the new approach
FINANCIAL ANALYSIS
64 | Page
16 NEXT STEPS
16.1 Independent Review of this Report Required Whilst it is recommended to move to a Flexible arrangement, it is recognised that this is a significant change to the apparently safe haven of fixed interest arrangements. It would be beneficial for the City and Elected Members to have an independent external review of this recommendation before it is accepted. An external consultant should be used to validate the evaluation in this report and to provide further commentary on the risks and issues of this approach. The review must be as objective as possible.
16.2 JPACF Business Case (October 2016) There should not be any changes to the financing assumptions in the JPACF business case as the findings in this report need to be validated. The JPACF Financial Model should continue to assume a 15 year repayment term with Fixed Interest. However the Business Case can mention that a detailed review of financing options is underway and that there is a potential for interest costs to be reduced significantly from circa $23m to $10m.
16.3 When Could New Arrangements be Implemented by? The new approach should be aimed to be implemented by 2017/18, not 2016/17. The 2016/17 Budget has assumed that there would be new borrowings in the traditional format (Fixed Interest) for the Warwick Hockey Facility – as this has already been subject to the adopted budget by Local Government this arrangement should just be set up in this way. In 2017/18 there is supposed to be borrowings for the JPACF, however this was on the premise of construction commencing in 2017/18 which is highly unlikely. In any case there is already a large budget ($11.4m) in 2016/17 a large part of which will be carried over to 2017/18 and there would be adequate reserves to manage any other costs in 2017/18. Therefore the earliest that any new arrangement would be required would be for financial year 2018/19 so there is plenty of time to consider this report, have the findings reviewed in more detail and implemented. Whilst there is plenty of time though, Elected Members should be briefed so that they are aware of the work to minimise the overall costs to the City of the JPACF borrowings.
16.4 Master Borrowing Agreement with WATC The City currently has a master borrowing agreement with WATC, which only allows for Fixed Interest arrangements. This would have to be amended. In any case there would need to be more detailed discussions with WATC regarding the change in approach.
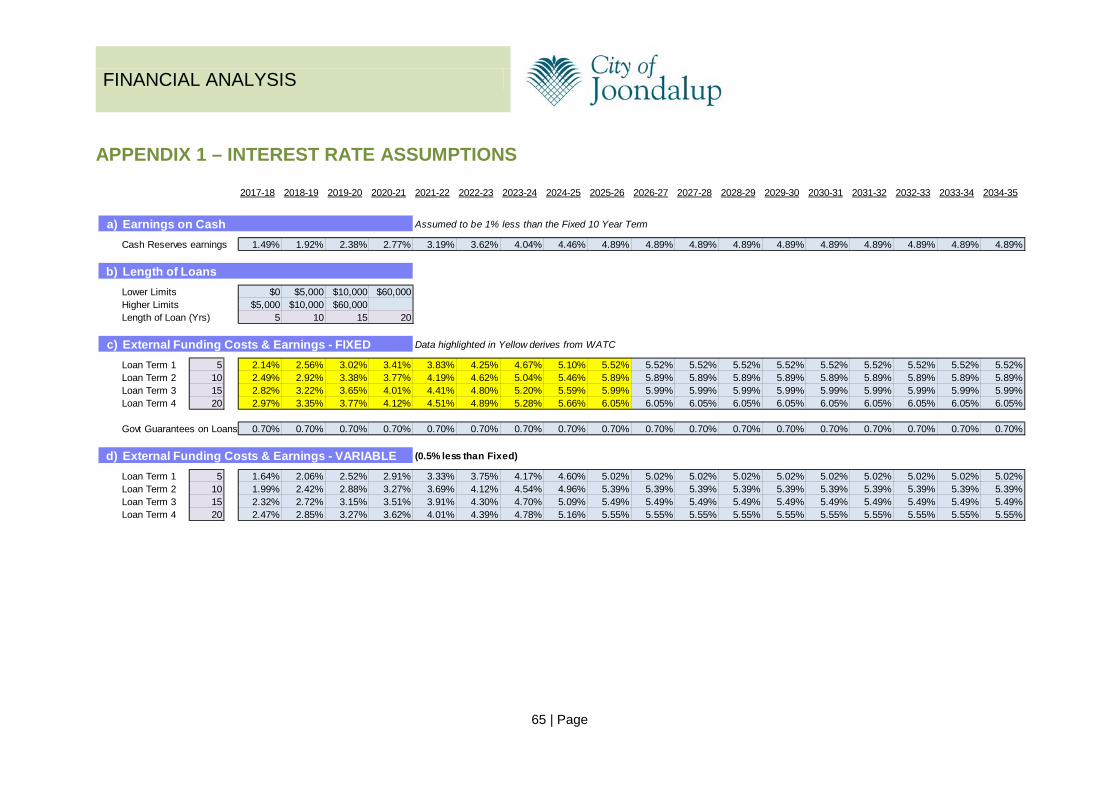
FINANCIAL ANALYSIS
65 | Page
APPENDIX 1 – INTEREST RATE ASSUMPTIONS
2017-18 2018-19 2019-20 2020-21 2021-22 2022-23 2023-24 2024-25 2025-26 2026-27 2027-28 2028-29 2029-30 2030-31 2031-32 2032-33 2033-34 2034-35
a) Earnings on Cash Assumed to be 1% less than the Fixed 10 Year Term
Cash Reserves earnings 1.49% 1.92% 2.38% 2.77% 3.19% 3.62% 4.04% 4.46% 4.89% 4.89% 4.89% 4.89% 4.89% 4.89% 4.89% 4.89% 4.89% 4.89%
b) Length of LoansLower Limits $0 $5,000 $10,000 $60,000Higher Limits $5,000 $10,000 $60,000Length of Loan (Yrs) 5 10 15 20
c) External Funding Costs & Earnings - FIXED Data highlighted in Yellow derives from WATC
Loan Term 1 5 2.14% 2.56% 3.02% 3.41% 3.83% 4.25% 4.67% 5.10% 5.52% 5.52% 5.52% 5.52% 5.52% 5.52% 5.52% 5.52% 5.52% 5.52%Loan Term 2 10 2.49% 2.92% 3.38% 3.77% 4.19% 4.62% 5.04% 5.46% 5.89% 5.89% 5.89% 5.89% 5.89% 5.89% 5.89% 5.89% 5.89% 5.89%Loan Term 3 15 2.82% 3.22% 3.65% 4.01% 4.41% 4.80% 5.20% 5.59% 5.99% 5.99% 5.99% 5.99% 5.99% 5.99% 5.99% 5.99% 5.99% 5.99%Loan Term 4 20 2.97% 3.35% 3.77% 4.12% 4.51% 4.89% 5.28% 5.66% 6.05% 6.05% 6.05% 6.05% 6.05% 6.05% 6.05% 6.05% 6.05% 6.05%
Govt Guarantees on Loans 0.70% 0.70% 0.70% 0.70% 0.70% 0.70% 0.70% 0.70% 0.70% 0.70% 0.70% 0.70% 0.70% 0.70% 0.70% 0.70% 0.70% 0.70%
d) External Funding Costs & Earnings - VARIABLE (0.5% less than Fixed)
Loan Term 1 5 1.64% 2.06% 2.52% 2.91% 3.33% 3.75% 4.17% 4.60% 5.02% 5.02% 5.02% 5.02% 5.02% 5.02% 5.02% 5.02% 5.02% 5.02%Loan Term 2 10 1.99% 2.42% 2.88% 3.27% 3.69% 4.12% 4.54% 4.96% 5.39% 5.39% 5.39% 5.39% 5.39% 5.39% 5.39% 5.39% 5.39% 5.39%Loan Term 3 15 2.32% 2.72% 3.15% 3.51% 3.91% 4.30% 4.70% 5.09% 5.49% 5.49% 5.49% 5.49% 5.49% 5.49% 5.49% 5.49% 5.49% 5.49%Loan Term 4 20 2.47% 2.85% 3.27% 3.62% 4.01% 4.39% 4.78% 5.16% 5.55% 5.55% 5.55% 5.55% 5.55% 5.55% 5.55% 5.55% 5.55% 5.55%

FINANCIAL ANALYSIS
66 | Page
APPENDIX 2 – EXISTING BORROWINGS
Purpose YearDrawn
YearFinal
Borrowed Balance 30 June 2016
Interest Principal Balance 30 June 2017
Aquatic Facilities Upgrade 2009-10 2019-20 5,800,000 2,730,654 166,775 624,200 2,106,454
West Coast Drive 2009-10 2019-20 885,000 416,660 25,418 95,244 321,413
Seacrest Sports Facility 2010-11 2020-21 841,320 463,584 29,861 86,735 376,848
Forrest park Sports Facility
2010-11 2020-21 553,500 304,989 19,646 57,063 247,926
Fleur Frame Pavilion Upgrade
2010-11 2020-21 1,529,180 842,609 54,277 157,652 684,958
Multi Storey Car Park 2014-15 2024-25 8,500,000 7,754,454 263,585 767,022 6,987,432
Bramston Park 2015-16 2020-21 1,769,000 1,686,388 54,889 336,375 1,350,013
SES Facility Upgrade 2015-16 2020-21 729,000 694,956 22,407 138,619 556,337
Warwick Hockey Centre 2016-17 2021-22 4,545,423 0 0 0 4,545,423
$14,894,594 $636,858 $2,262,910 $17,176,804