project management, planning and control || worked example 4
TRANSCRIPT

48 Worked example 4: battle tank
BUSINESS CASE FOR BATTLE TANK TOP SECRET
Memo: From: General JohnsonTo: The Department of Defence
1 September 2006
Subject: new battle tank
It is imperative that we urgently draw up plans to design, evaluate, test, build and commissiona new battle tank.
The ‘What’
A new battle tank which:
(a) Has a 90 mm cannon(b) Has a top speed of at least 70 mph(c) Weighs less than 60 tonnes fully loaded and fuelled(d) Has spaced and active armour(e) Has at least 2 machine gun positions including the external turret machine gun(f) Has a crew of not more than 4 men (or women)(g) Has a gas turbine engine and a fuel tank to give a range of 150 miles (240 km).(h) In addition: The cost must not exceed $5 500 000 each(j) 500 units must be ready for operations by February 2008.
The ‘Why’
(a) The existing battle tanks will be phased out (and worn out) in 2008(b) Ruritania is developing a tank which is superior to our existing tanks in every way(c) The existing tank at 80 tonnes is too heavy for 50% of our road bridges(d) The diesel engine is too heavy and unreliable in cold weather(e) The armour plate on our tanks can be penetrated by the latest anti-tank weapon(f) A new tank has great export potential and could become the standard tank for NATO.
Major risks
(a) The cost may escalate due to poor project management(b) The delivery period may be later than required due to incompetence of the contractors

Worked example 4: battle tank 373
(c) The fuel consumption of the gas turbine may not give the required range(d) Ruritania will have an even better tank by 2008(e) No matter how good our tank is, NATO will probably buy the new German Leopard Tank(f) Heavy tanks may eventually be replaced by lighter airborne armoured vehicles.
Figure 48.1 Battle tank
ConceptFeasibility
DefinitionDesign
Product’nIn-service
DisposalProject life cycle
Product life cycle
Extended life cycle
Life cycles
= Decision points
Figure 48.2 Life cycles & phases
374 Project Management, Planning and Control
Tank0.0
Frame1.1
Suspens.1.2
Armour2.1
Interior2.2
Engine4.1
Transm.4.2
Barrel3.2.1
Breach3.2.2
Sight3.2.3
Casting3.1
Cannon3.2
M/c.Gun3.3
Electro3.4
Turret3.0
Body2.0
Chassis1.0
Drive4.0
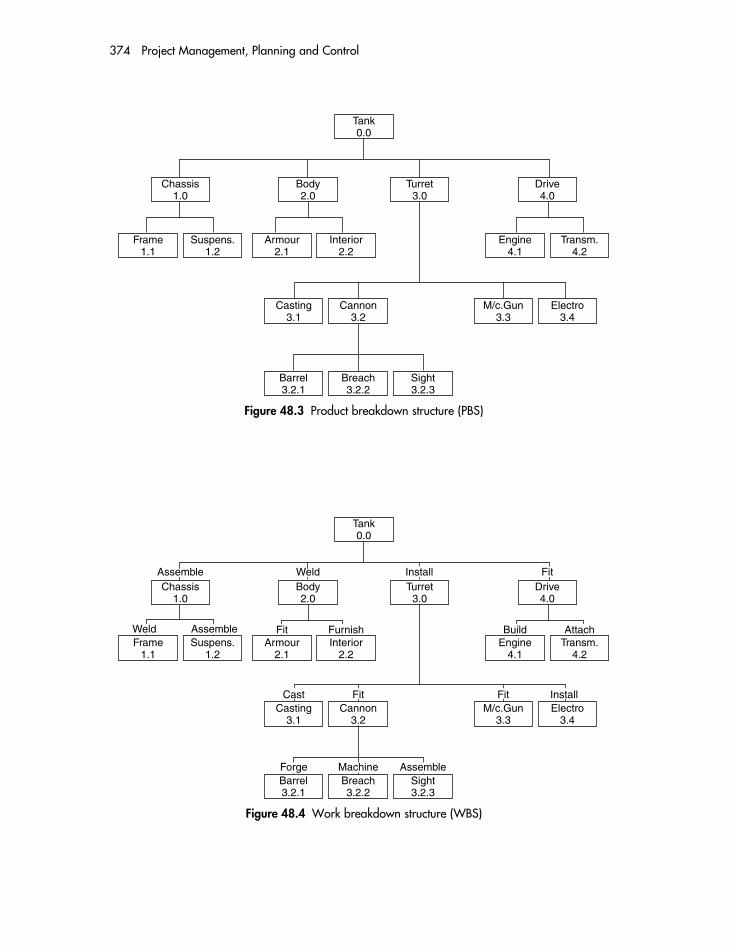
Figure 48.3 Product breakdown structure (PBS)
Tank0.0
Frame1.1
Suspens.1.2
Armour2.1
Interior2.2
Engine4.1
Transm.4.2
Barrel3.2.1
Breach3.2.2
Sight3.2.3
M/c.Gun3.3
Electro3.4
Turret3.0
Body2.0
Chassis1.0
Drive4.0
Casting3.1
Cannon3.2
Assemble
Assemble
Weld
Weld
Fit
Fit Furnish
Cast
Forge Machine Assemble
Fit Fit Install
Build Attach
Install
Figure 48.4 Work breakdown structure (WBS)
Worked example 4: battle tank 375
Tank0.0
Frame1.1
Suspens.1.2
Armour2.1
Interior2.2
Engine4.1
Transm.4.2
Barrel3.2.1
Breach3.2.2
Sight3.2.3
M/c.Gun3.3
Electro3.4
Turret3.0
Body2.0
Chassis1.0
Drive4.0
Casting3.1
Cannon3.2
$5500 K
1000 K
600 K 400 K 700 K
500 K
80 K 250 K 70 K
400 K 100 K 800 K
800 K 800 K 400 K
1500 K 1800 K 1200 K
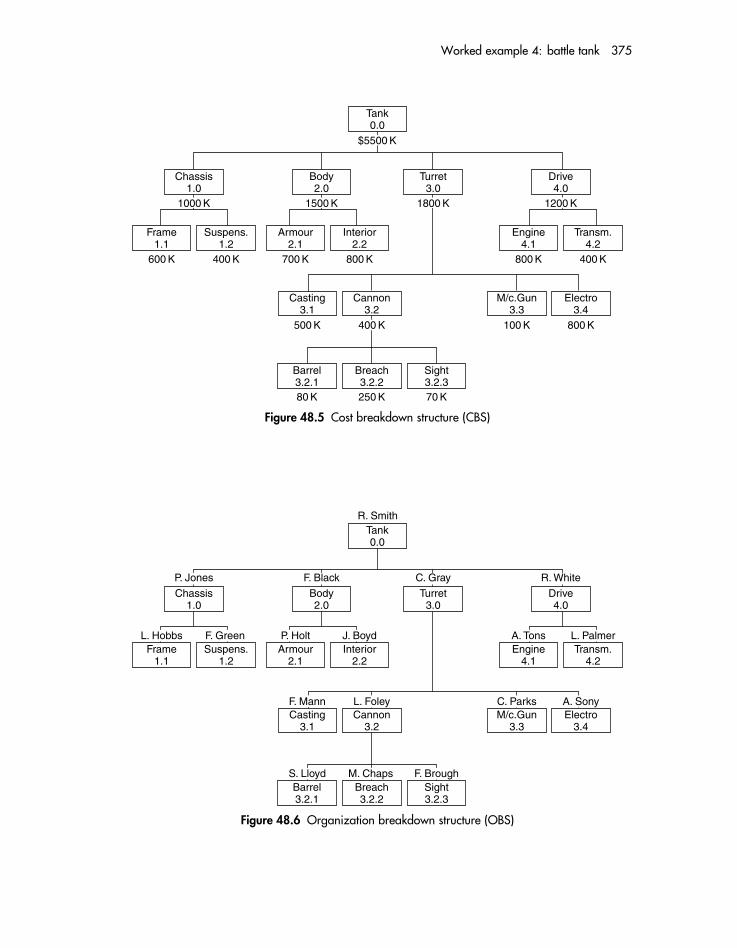
Figure 48.5 Cost breakdown structure (CBS)
Tank0.0
Frame1.1
Suspens.1.2
Armour2.1
Interior2.2
Engine4.1
Transm.4.2
Barrel3.2.1
Breach3.2.2
Sight3.2.3
M/c.Gun3.3
Electro3.4
Turret3.0
Body2.0
Chassis1.0
Drive4.0
Casting3.1
Cannon3.2
P. Jones
L. Hobbs F. Green P. Holt
F. Mann
S. Lloyd M. Chaps F. Brough
L. Foley C. Parks A. Sony
J. Boyd A. Tons L. Palmer
F. Black C. Gray R. White
R. Smith
Figure 48.6 Organization breakdown structure (OBS)

376 Project Management, Planning and Control
R. S
mith
F. M
ann
L. F
oley
C. P
arks
A. S
ony
S. L
loyd
M. C
haps
F. B
roug
h
Turret
Casting
Cannon
M/c Gun
Electro.
Barrel
Breach
Sight
R A A A
A
A A A A
C R
C R
C C
C C
C C
R
–
– –
C C –
C C C A R––
–
–
–
––
C C C
C
C A
R
C R
C
R C
A –
C C C
A A C
C
A
R = ResponsibleC = Must be consultedA = Must be advised – = Not affected
C
A
A
A
Figure 48.7 Responsibility matrix
26
Electron
Cannon
Calibr
M/c Gun
Turretcast Machine Fit A Fit B
Finaltest
1615
161
15
C.P.
Duration weeks
422
2
8
88
6
6
116
5
0
0
0
0
0
275 9 11
8 11
8 8 11
8 11
3
Figure 48.8 Activity on arrow network (AOA)
Worked example 4: battle tank 377
0 2 2Cast
5 5 5
0 8 8Cannon
5 0 8
0 6 6M/c Gun
5 5
5
11
0 6 6Electron
2 2
2
8
8 3 11Calibr
8 0 11
2 2
4FF 1
4Machine
7 5 9
8 2 10Fit A
9 1 11
11 4 15Fit B
11 0
C.P.Duration weeksFF = Free Float
15
15 1 16Fin. test
15 0 16
FF
FF
FF
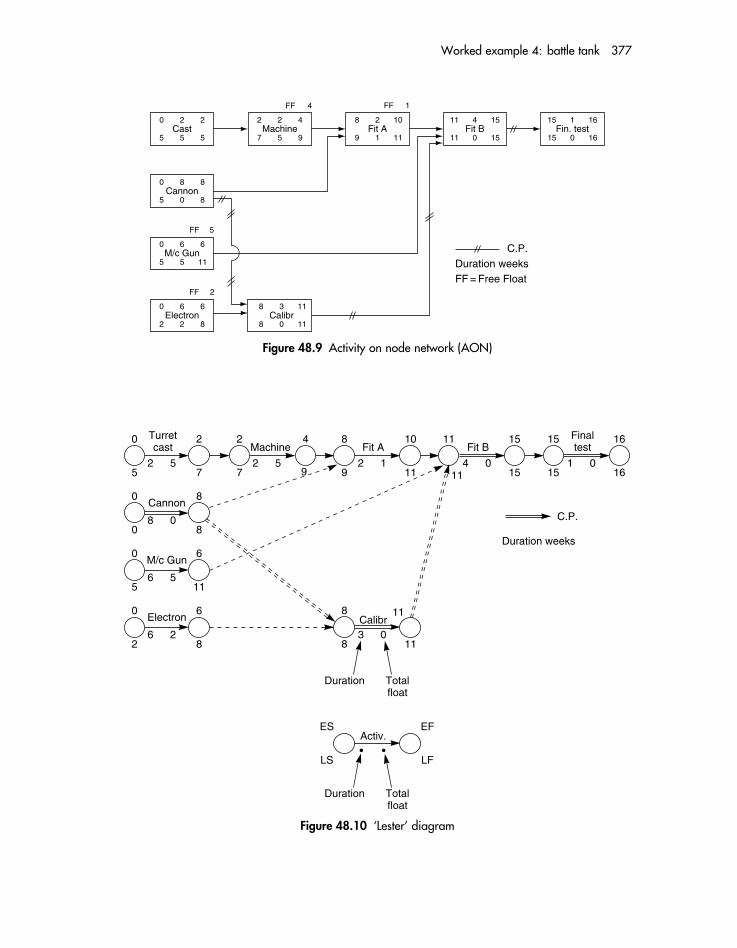
Figure 48.9 Activity on node network (AON)
Machine Fit A
2 5 2 1
Fit B
4 0
Turretcast
0
52 5
2
7
CannonC.P.
0
08 0
8
8
M/c Gun0 6
56 5
11
Electron0 6
26 2
8
2
7
4
9
10
11
11
11
Finaltest
Duration weeks
1 0
15
15
16
16
15
15
8
9
Calibr
Duration Totalfloat
3 0
11
11
8
8
Activ.
Duration Totalfloat
ES
LS
EF
LF
Figure 48.10 ‘Lester’ diagram

378 Project Management, Planning and Control
Cast
0 1 2 3 4 5 6 7 8 9 10 11 12 13 14 15 16 17 18
0 1 2 3 4 5 6 7 8 9 10 11 12 13 14 15 16 17 18
223 3 4 4 4 46 68 811
11
11 12
22 34 46 54 62 65 68 74 80 82 86 90 94 98 100
12
Machine
Fit A
Fit B
Cannon
M/c Gun
Electron
Calibr
Final test
Weeks
Total
Cumulativetotal
Weeks
2
2 2
2 2
2 2 2
2
2
2
3
3
3 3 3
3 3 3 3
3 3 3 3
3
4
4 4 4
4
4 4 4 4
Cast
0 1 2 3 4 5 6 7 8 9 10 11 12 13 14 15 16 17 18
0
0
2
4
6
8
10
12
1 2 3 4 5 6 7 8 9 10 11 12 13 14 15 16 17 18
0
1
2
3
4
5
6
7
8
9
10
223 3 4 4 4 46 68 811
11
11 12
22 34 46 54 62 65 68 74 80 82 86 90 94 98 100
12
Machine
Fit A
Fit B
Cannon
M/c Gun
Electron
Calibr
Final test
Weeks
Total
Cumulativetotal
Figure 48.11 Histogram and ‘S’ curve

Activity
M/H Week 4 Week 8 Week 12 Week 16
Budg Plan Plan Plan PlanAct Act Act Act% % % %EV EV EV EV
160 180 180
200
100 100
100
160 180 100 160160
240 200
300 340
600
850
820
700
250
110
850
820
320
320
840
840
640
100
100
10
100
100
240
256
840
840
640
144
64
200 100
100
50
20 32
100
100
100
100
240
240
180 100 160
192180
600
620
420 780 756
700
140
756
512
700
50 90
90
80
80
80
60
60
40
500 504
256300
80
Casting
Machine 240
320
640
840
840
640
240
80
4000 1840 1760
38.3%
.870 87%
.832
.80
4598
19.2
=
=
=
=
= = =
=
=
=
=
=
=
=
=
=
=
=
=
=
=
=
=
=
1532 2720 2480 2424 3440 3270 3184 4000 4050 3632
(Cost)
Fit A
Fit B
Cannon
M/C Gun
Electronic
Calibrate
Test
Total
% Complete
CPI (Efficiency)
SPI (Cost)
SPI (Time)
Final cost
Final time
Budget man hours = duration × no. of men × 40 hrs/week Duration in weeks
1532
4000
2424
4000
3184
3270
3184
3440
10.3
12
.973 .896
79.6% 90.8%
90%
.908
.856
4462
17.6
97%
.925%
.858%
4110
17.3
4000
.973
16
.925
3684
4000
3632
4000
3632
4050
3632
4000
13.7
16
4000
.896
16
.908
2424
2480
2424
2720
6.7
8
.977
.891
.837
4094
17.9
98%
60.6%
4000
.977
16
.891
1532
1760
1532
1840
4000
.870
16
.832
3.2
4
Figure 48.12 Earned value table

380 Project Management, Planning and Control
4600
4400
4200
4000
3800
3600
3400
3200
3000
2800
2600
2400
2200
2000
1800
1600
1400
1200
1000
800
600
400
200
100
0
1
1
2 3 4 5 6 7 8 9 10 11 12 13 14 15 16 170
10
20
30
40
50
60
70
80
90
100
Week
Plan’s(BSWS)
Actual(ACWP)
E.V.(BOWP)
% Complete
CPI (Efficiency)
SPI
38%
.87 = 87% .977 = 98% .973 = 97% .896 = 90%
.908.925.891.832
61% 80% 91%
Budget
% Efficiency
Actual
Planned
E.V.
% Complete
%
1532
2424
3184
3632
4050
4000
3270
3440
2840
2720
1760
1840
Report dates
Figure 48.13 Control curves