project id: 07 gwk 01 (project overview) integration in the...
TRANSCRIPT

Project ID: 07 GWK 01 (Project Overview) 01.05.2000 – 30.04.2003 INTEGRATION IN THE GLOWA VOLTA PROJECT: FROM CONCEPT TO FEASIBILITY P.L.G. Vlek, N. van de Giesen Center for Development Research (ZEF), Bonn University, Walter-Flex-Str. 3, 53113 Bonn, Germany [email protected], [email protected], http://www.glowa-volta.de
Keywords: Integrated watershed management, global change, hydrological cycle, West Africa
Abstract: Integration in the GLOWA Volta project is a means to an end. The end is to establish a decision support system (DSS) for water management that is scientifically sound and can be readily used by decision makers in the region in order to optimize water allocation between regions and sectors. Economic, social and natural science issues will have to be brought into the analysis. The GLOWA Volta project makes it its primary task to insure that this is done from the onset as can be seen from the diagrammatic presentation of the project in Figure 1. In the following chapter we highlight some areas where integration of various disciplines has been accomplished in innovative ways, demonstrating the validity of addressing the integration issue early in the project. The chapter closes with a short description of the infra-structure that was needed for the implementation of the project.
Results: The overall goal of the GLOWA Volta project is to develop, in close collaboration with our partners in Ghana, a tool (Decision Support System) that will help the authorities in Ghana, and later Burkina Faso, to optimize water allocation within the basin. The art of water allocation is to properly and equitably account for the various economic development interests of the region while insuring that the ecosystems that depend on this resource are not threatened. This should be done with the recognition that water availability may change under changing global climate conditions. This Status Report covers progress made in the first 20 months of the GLOWA Volta project. The report is divided in an overview section and three parts presenting more in-depth results. Here in the overview, we focus on Integration and Infrastructure development.
Integration Understanding the complex relations between the water cycle, climate, and economic development requires insights from many scientific disciplines. The real challenge of the GLOWA program is not only to collect information using the various means and methods of these disciplines, but above all to tie all this information together in a meaningful and quantitative way. The sources, type and coverage of the data were discussed at length in our 2001 Year Report. In this status report, we emphasize the progress we made in scientific integration of this multi-faceted information.
As the project scientists have noticed over the past two years, bridging different disciplines comes at great transaction cost. Explaining one's own and exploring someone else's scientific possibilities and limits is prone to misunderstanding, and it is time consuming and frustrating at times. Scientific integration must add value in order to be justified. We identified three integrative focal points where added value can be gained. In each of these, questions are
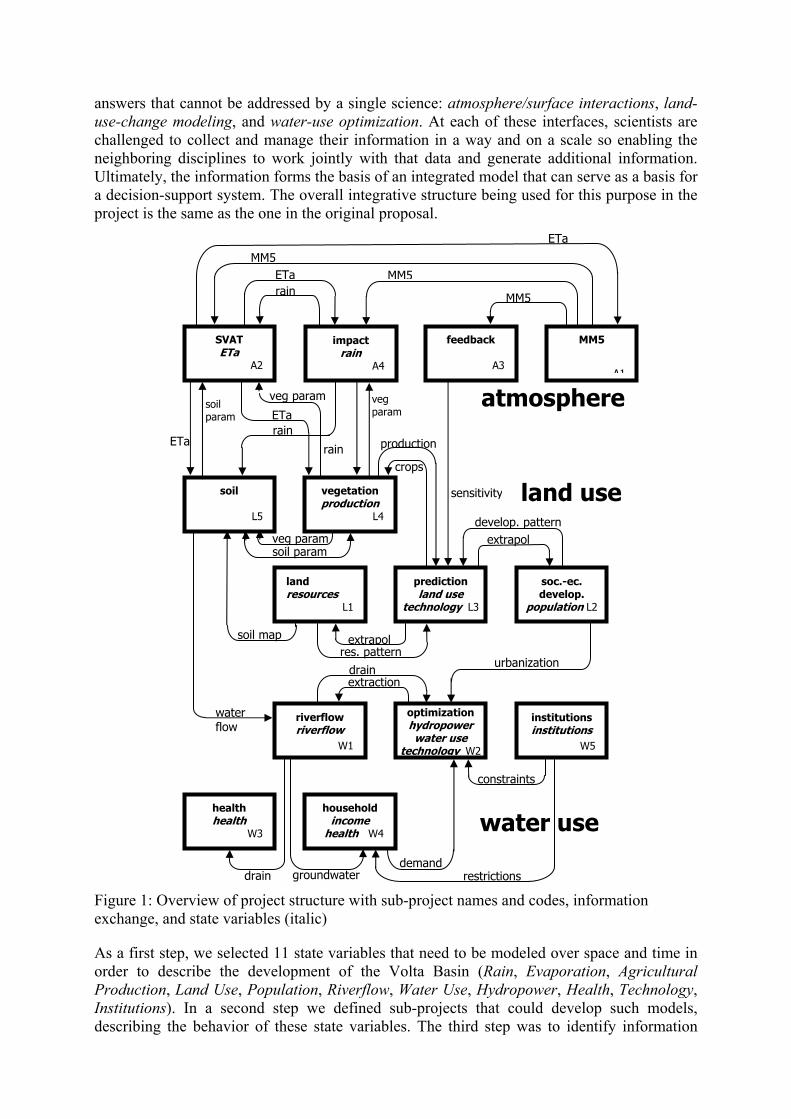
answers that cannot be addressed by a single science: atmosphere/surface interactions, land-use-change modeling, and water-use optimization. At each of these interfaces, scientists are challenged to collect and manage their information in a way and on a scale so enabling the neighboring disciplines to work jointly with that data and generate additional information. Ultimately, the information forms the basis of an integrated model that can serve as a basis for a decision-support system. The overall integrative structure being used for this purpose in the project is the same as the one in the original proposal.
Figure 1: Overview of project structure with sub-project names and codes, information exchange, and state variables (italic)
As a first step, we selected 11 state variables that need to be modeled over space and time in order to describe the development of the Volta Basin (Rain, Evaporation, Agricultural Production, Land Use, Population, Riverflow, Water Use, Hydropower, Health, Technology, Institutions). In a second step we defined sub-projects that could develop such models, describing the behavior of these state variables. The third step was to identify information
veg param
ETa
land resources
L1
MM5
MM5 MM5ETa
soil param
soil map res. pattern
extrapoldevelop. pattern
production
extrapol
sensitivity
urbanization
crops
water flow
rain
MM5
A1
drainextraction
demand
health health
W3
restrictionsgroundwater
rain ETa
veg param
rain
ETa soil param
vegetation production
L4
veg param
impact rain
A4
SVAT ETa
A2
feedback
A3
soc.-ec. develop.
population L2
soil
L5
drain
constraints
prediction land use
technology L3
riverflow riverflow
W1
optimization hydropower water use
technology W2
institutions institutions
W5
household income
health W4
atmosphere
land use
water use
needs and define additional sub-projects that could produce that information as intermediate outputs. We organized the sub-projects in three research clusters: atmosphere, land use, and water use. These clusters are not defined along disciplinary lines but coincide with the three main parts of the hydrological cycle. The sub-projects in each cluster serve as the basic planning blocks, associated with specific human and material resources. Most sub-projects are not integrative in nature and basically cover one discipline such as soil science or household economics. The information dependencies between the sub-projects are shown by the arrows in Figure 1. Information exchange mainly takes place between kindred disciplines: the agronomist communicates with the soil physicist, the soil physicist communicates with the hydrologist, etc. The coherence of this network is described below in more detail for each individual cluster in the three sections of the Status Report. First, we present the integrative foci, atmosphere/surface interactions, land-use-change modeling, and water-use optimization.
Atmosphere/surface interactions need to be understood to account for the feedback between climate and change in land-surface properties. Land-use change is the main global change phenomenon within the Volta Basin. The extensive efforts to simulate regional climate change with the MM5 atmospheric model depend crucially on the proper quantification of the effects that these land surface changes have on the atmosphere. The integrative challenge is bridging the gap between meteorology and hydrology. In Figure 1, these atmosphere/surface interactions are represented by the large number of intersecting arrows. Although these natural sciences have much in common, both involving fluid dynamics, phase transitions and massive computational efforts, in communicating with each other they are confronted with a very important scale gap. The smallest grid cell size at which long-term climatological atmospheric simulations with our adjusted MM5 model are feasible is about 9x9km². Most process-based hydrological models are at the scale of a uniform field in case of evapotranspiration or a hill slope in case of runoff. Hydrologists do have models at the watershed scale (>10 km²), but these are either lumped conceptual models or distributed models with a very fine internal resolution of, say, 30x30m. The conceptual models do not have much predictive value because we do not know how, for example, changes in land-use affect the parameters of conceptual models.
What is needed to bridge the scale gap is a method to aggregate measurable physical properties of landscape elements (fields, slopes) into effective parameters at the 9x9km² scale. In some cases, such as albedo, one can simply take a linear average but when it comes to parameters such as surface runoff, evapotranspiration, rooting depth or roughness length, aggregation is much more difficult. We are approaching this problem both empirically and through numerical simulations. We have given priority to dealing with surface runoff and evapotranspiration.
To model surface runoff, rainfall at the 9x9km² grid is first statistically disaggregated based on measurements made at a nested grid of rain gauges. This serves as input into a surface runoff model that is calibrated on the basis of runoff plots of three different lengths to ensure it correctly captures any scale effects. Runoff from the slopes is then summed to give the 9x9km² values. To date, the disaggregated rain measurements, a runoff model, and the runoff plots are in place, but we still need one season of runoff measurements. We also measure the total surface runoff from our experimental watersheds, which helps to test our aggregated surface runoff model and, through the mass balance, puts constraints on the evapotranspiration model.
Evapotranspiration is modeled using the Surface-Vegetation-Atmosphere-Transfer (SVAT) model, developed specifically for the MM5 atmospheric model. We have numerically tested the sensitivity of the model with respect to all parameters in order to better concentrate our parameterization efforts. Great effort went into measuring evapotranspiration at a large,
aggregated scale. Scintillometers were installed in each of the three experimental watersheds to measure directly the sensible heat flux over distances of more than two kilometers. By measuring ground heat flux and net radiation, evapotranspiration can be calculated as the remaining term in the energy balance. Because scintillometers measure spatially aggregated heat fluxes, they are our key instruments in bridging the scale gap between meteorology and hydrology. In close cooperation with the Meteorology Department of Wageningen University, we have been able to make almost continuous routine measurements with the scintillometers in West Africa.
Land-use-change modeling (sub-project "L3 Prediction") occupies a central position in the land-use cluster. Clearly, land-use change is the result of social as well as physical factors. This is reflected in Figure 1, where the sub-project "L3 Prediction" receives information from many different sub-projects covering a number of disciplines. In its turn, land-use change plays a pivotal role in affecting local climate and in the partitioning of rainfall between evapotranspiration, and groundwater and surface flow. We are developing in parallel different types of models, from classical multiple-linear regressions to state-of-the-art multiple-agent models that will capture the effect of various processes on the dynamics of land-use change. All models have in common that they are very data hungry. The main integrative progress so far pertains, therefore, to better methods of data gathering.
Land-use change tends to take place unevenly over space and time. As data gathering on the ground is time and money consuming, it makes sense to focus intensive ground campaigns in those areas where change is indeed taking place. We call such areas "hotspots" and we have used a two-tiered identification process. First, we mapped large-scale changes during a land-use workshop based on expert opinion from the region. We then used remotely sensed data to zoom in and quantify specific hotspots. A very important result has been the mapping of the land use and land cover for 1991 and 2000 on the basis of Landsat images using test sets and maximum likelihood classification. The formerly used land-use classification method was based on manual classification, which was prohibitively labor intensive. The present method allows for quick mapping of the complete basin, which is the size of Germany, at different dates (a 1984 map is presently in the making).
Changes in tree densities are expected to have the most profound hydrological impact and special attention has, therefore, been given to this land-cover characteristic both during field research and subsequent classification. The new land-use maps are used to detect changes over the past decades, thereby helping to identify and quantify hotspots. Land-use change in the Volta Basin turns out to be a very dynamic process. Every deforested patch cannot simply be equated with land-use intensification because farms and complete villages may have moved over large distances, leaving behind an area under natural reforestation. Two hotspots are currently under intensive ground investigation: Wuripe, southwest of Tamale, where dense woodland is being replaced by agriculture, and the Northeast near Navrongo, where irrigation development is most intensive.
We have the good fortune to have access to the Ghana Living Standards Survey (GLSS) that contains regularly collected standard socio-economic variables such as income, agricultural production, and family composition. The project will model land-use and household water demands. For that purpose additional data on a community and household level are required. Thus, limited surveys concerning variables not covered in the GLSS were undertaken, using a common sampling frame that was developed to link our surveys to the GLSS. First, a cluster analysis of all villages in the GLSS was performed. This analysis included also evaporation and geology as important determining physical factors. From each cluster, one or two representative villages were selected for extensive household and community surveys. Although the survey was mainly socio-economically oriented, soil and water samples were

also taken to be better able to capture household decision making in its biophysical context and link up environmental information gathered elsewhere in the project. Finally, a short list of standard questions was developed that identifies the GLSS cluster to which the community belongs. These questions are used by natural scientists, too, for example during ground truthing of the remotely sensed data, and serve as a "social positioning system".
Water-use optimization (sub-project "L2 Optimization") is the central activity in the water-use cluster. Figure 1 shows that economic optimization is subject to hydrological and institutional constraints. As such, it is the third integrative focal point in the project. The water optimization module will be the nucleus of the actual decision support system, which will form the final outcome of the GLOWA Volta project. Because of its importance, it was decided to test the feasibility of linking hydrological and institutional functions in a model early on in the project. We used a standard economic optimization model in which an objective function is maximized. The constraints under which water productivity is optimized can be hydrological and institutional in nature. This early model helps define precise data needs in terms of water supply and demand. The model implements existing integrative knowledge and will gradually be enriched by updated information and new primary data. Presently, the model optimizes over different water uses at thirteen nodes in the river network. The innovation is that optimizations can be carried out at different levels of aggregation. The optimization model has active links to a large set of sub-models that contain auxiliary information such as institutional development scenarios and crop-water demand calculations.
In stereotypical watersheds, hydropower is generated upstream in the mountains and irrigation takes place downstream in the plains. In such cases, water can be used for hydropower without significantly affecting irrigated agriculture. In the case of the Volta Basin, however, hydropower is generated very close to the sea whereas almost all of the irrigable areas are upstream in Northern Ghana and Burkina Faso. Hydropower and irrigation are, therefore, in more direct competition for water. The present model helps make optimal decisions, taking into account different forms of irrigation and alternative energy sources. Even after the first few modeling rounds, the number of links to the optimization module is much larger than suggested by Figure 1. It seems that this relatively straightforward approach to integrating hydrology, institutions and economy allows us to mimic highly complex relations.
Infrastructure Building scientific and logistic infrastructure for a project is in itself not a scientific accomplishment, but it is included here to give an insight into what is presently possible in Africa. It will facilitate the discussion on future cooperation. Early on, a project coordination office was established at the Savanna Agricultural Research Institute (SARI), the host institute in Tamale, Ghana. The office coordinates transportation, organizes importation of scientific equipment, and takes care of general and financial administration. The project has six vehicles for transport between and at test sites.
Three experimental watersheds have been instrumented, all of which are in or near hotspot areas. The first watershed is in Ejura, about 80 km northeast of Kumasi. Ejura is representative of the southern part of the basin with higher rainfall (1200 mm/yr) and steeper slopes. Ejura is also an area that has seen many new settlers over the past 20 years. The second watershed lies close to the town Tamale and is characteristic for the central part of the basin with rainfall around 1100 mm/yr and moderate slopes. Land-use intensity in the neighborhood of this large town is high. The third watershed is in Navrongo, close to the northern border of Ghana with Burkina Faso. Rainfall here is about 1000 mm/yr, population density is high, and slopes are flat. Navrongo has a granite geology, whereas the first two sites are underlain by sedimentary rocks. The watersheds have a size of about 15km². At the outlet of each watershed, a flume or weir has been installed with which continuous surface runoff

measurements are made. Meteorological stations have been installed, as well as scintillometers that measure sensible heat flux across the watersheds. In Navrongo and Ejura, simple field stations have been set up to facilitate on-going field work by graduate students.
Information exchange is very important in an integrated project. Our website (www.glowa-volta.de) at present serves mainly to keep people from outside the project informed about progress made. It gives an overview of the activities of all staff and students involved in the project, and shows recent progress. It also contains PDF files of most project-linked publications. For internal exchange of large data sets, we have set up an FTP server at ZEF where, for example, all weather data produced by MM5 at the Institute for Meteorology and Climate Research (IMK) in Garmisch-Partenkirchen are stored on a daily basis. Given the poor Internet facilities in Ghana, FTP is also the protocol of our choice for exchanging data and information between Germany and Ghana.
Project ID: 07 GWK 01 (Atmosphere Cluster) 01.05.2000 – 30.04.2003 ATMOSPHERIC MODELING AND INTEGRATION BETWEEN METEOROLOGY AND HYDROLOGY D. Burose1,3, J. Friesen1, J. Intsiful1,2, G. Jung2, H. Kunstmann2, A. Moene3, P. Oguntunde1, N. van de Giesen1
1Center for Development Research, Bonn University, Walter-Flex-Str 3, D-53113 Bonn [email protected]; http://www.glowa-volta.de 2Institute for Meteorology and Climate Research, Section Atmospheric Environmental Research (formerly Fraunhofer Institute for Atmospheric Environmental Research, IFU), Karlsruhe Research Center Technology and Environment, Kreuzeckbahnstraße 19, D-82467 Garmisch-Partenkirchen [email protected] 3Meteorology and Air Quality, Wageningen University, Postbus 9101, 6700 HB Wageningen, Netherlands [email protected]
Keywords: Meteorology, hydrology, atmospheric modeling, upscaling, energy fluxes, evapotranspiration, downscaling, rainfall, MM5
Abstract: Understanding feedback mechanisms between atmosphere and land surface is crucial for predicting impact of global change on the regional hydrological cycle. Unfortunately, meteorological models have different scales than hydrological land surface models, which hinders feedback analysis. Results from innovative field measurements (scintillometry) are presented that help integrate hydrology and meteorology by bridging this scale gap. Subsequently, the operationalization of the MM5 meteorological model is described. Numerical experimentation with MM5 shows that changes in land surface properties do have large feedback effects on regional circulation patterns.
Results: In this part of the status report, from modeling and measurement of the atmosphere and land surface-atmosphere interactions are presented. First, the integration of meteorology and hydrology through downscaling and upscaling is described. Second, results from our meteorological modeling activities is presented.
Integration of meteorology and hydrology Meteorology and hydrology are closely related conceptually. Both disciplines deal with fluid dynamics and phase transitions and tackle their subjects with highly formalized mathematical tools. Yet, the main issue addressed under this heading is the integration of meteorology and hydrology. Physically, this integration concerns the interactions between land surface and atmosphere that form the feedback between landuse and climate change and are of central interest to GLOWA. As explained in the introduction, coupling the results from both disciplines is hindered by scaling issues in the measurement and modeling of water and energy fluxes. In the GLOWA Volta project, we try to bridge the scale gap through numerical simulations, remote sensing of the distribution of evapotranspiration over space, and through field measurements. Here, the emphasis is on field measurements. Water and energy fluxes are calculated with the aid of balances. At the watershed level, the water balance equates rainfall to the sum of evapotranspiration, surface runoff, subsurface runoff, and change in storage within the watershed. Over longer periods, the change in storage

is in the West African context negligible compared to the other terms. Rainfall and surface runoff are directly measured at the experimental sites, but subsurface runoff and evapotranspiration are difficult to measure at this larger scale. With the energy balance we can calculate evapotranspiration and subsequently each component of the water balance. The energy balance equates net radiation to the sum of sensible heat flux (the energy that warms the atmosphere), latent heat flux (the energy needed for evapotranspiration), and ground heat flux. Net radiation is generally easy to measure at different scales. Ground heat flux is more difficult to measure at larger scales but tends to be small when compared to the total energy flux and is, in West Africa, close to zero when integrated over a full day. That leaves sensible heat flux and evapotranspiration. If one could measure either at the appropriate scale one can close both the energy and water balances.
There are several ways to measure the energy fluxes at the land surface over larger areas. We chose to measure the sensible heat flux with scintillometers because they are relatively robust and can be operated without intensive expert supervision. A scintillometer measures the sensible heat flux along a line between a transmitter and a receiver. The distance between transmitter and receiver can be up to 5km. Because the measurement integrates over this distance, this technique is very useful for measuring heat flux over complex terrain at watershed level. The transmitter sends an infrared light beam (940 nm) to the receiver. Turbulence causes variation in the breaking index of air and thereby variation in the strength of the received signal, like the scintillation caused by rising air over a hot road surface.
The variance of the logarithm of the intensity of the received signal is a function of the turbulence structure parameter for the breaking index, Cn. Cn is in turn directly related to the turbulence structure parameters for heat, CT, and vapor transport, Cq. The contribution of the latter to Cn is minimal for the wavelength used which makes calculation of the CT possible. Once CT is known, the sensible heat flux can be calculated. Four different algorithms exist to calculate the sensible heat flux from Cn. The algorithms differ in their assumptions concerning the stability of the atmospheric boundary layer and the relative contributions of buoyancy and shear stress to the generation of turbulent energy. Present analysis focuses on selecting the optimal algorithm for different periods using auxiliary data in the context of the Volta Basin.
Figure 1: Diurnal changes in energy fluxes for 4 December 2001 at the Tamale experimental watershed
-100
0
100
200
300
400
500
6 7 8 9 10 11 12 13 14 15 16 17 18 19 20
W/m
²
Sensible heat
Soil heat
Net radiation
Latent heat (ET)
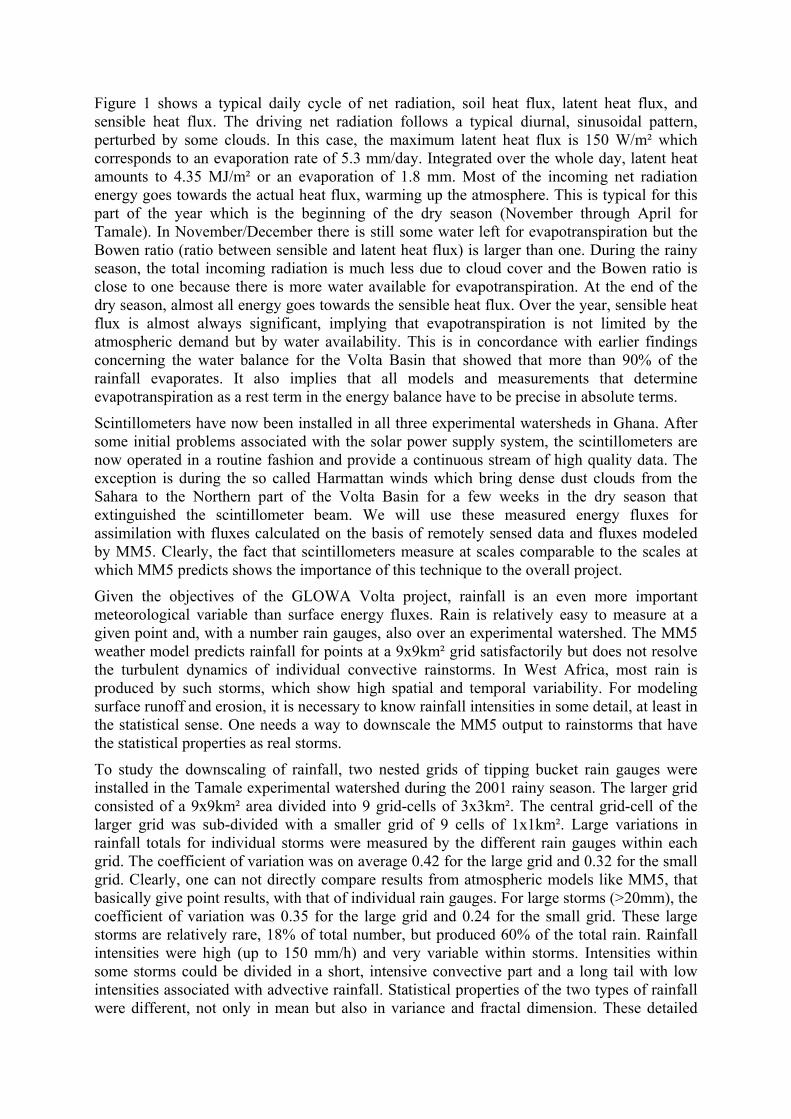
Figure 1 shows a typical daily cycle of net radiation, soil heat flux, latent heat flux, and sensible heat flux. The driving net radiation follows a typical diurnal, sinusoidal pattern, perturbed by some clouds. In this case, the maximum latent heat flux is 150 W/m² which corresponds to an evaporation rate of 5.3 mm/day. Integrated over the whole day, latent heat amounts to 4.35 MJ/m² or an evaporation of 1.8 mm. Most of the incoming net radiation energy goes towards the actual heat flux, warming up the atmosphere. This is typical for this part of the year which is the beginning of the dry season (November through April for Tamale). In November/December there is still some water left for evapotranspiration but the Bowen ratio (ratio between sensible and latent heat flux) is larger than one. During the rainy season, the total incoming radiation is much less due to cloud cover and the Bowen ratio is close to one because there is more water available for evapotranspiration. At the end of the dry season, almost all energy goes towards the sensible heat flux. Over the year, sensible heat flux is almost always significant, implying that evapotranspiration is not limited by the atmospheric demand but by water availability. This is in concordance with earlier findings concerning the water balance for the Volta Basin that showed that more than 90% of the rainfall evaporates. It also implies that all models and measurements that determine evapotranspiration as a rest term in the energy balance have to be precise in absolute terms.
Scintillometers have now been installed in all three experimental watersheds in Ghana. After some initial problems associated with the solar power supply system, the scintillometers are now operated in a routine fashion and provide a continuous stream of high quality data. The exception is during the so called Harmattan winds which bring dense dust clouds from the Sahara to the Northern part of the Volta Basin for a few weeks in the dry season that extinguished the scintillometer beam. We will use these measured energy fluxes for assimilation with fluxes calculated on the basis of remotely sensed data and fluxes modeled by MM5. Clearly, the fact that scintillometers measure at scales comparable to the scales at which MM5 predicts shows the importance of this technique to the overall project.
Given the objectives of the GLOWA Volta project, rainfall is an even more important meteorological variable than surface energy fluxes. Rain is relatively easy to measure at a given point and, with a number rain gauges, also over an experimental watershed. The MM5 weather model predicts rainfall for points at a 9x9km² grid satisfactorily but does not resolve the turbulent dynamics of individual convective rainstorms. In West Africa, most rain is produced by such storms, which show high spatial and temporal variability. For modeling surface runoff and erosion, it is necessary to know rainfall intensities in some detail, at least in the statistical sense. One needs a way to downscale the MM5 output to rainstorms that have the statistical properties as real storms.
To study the downscaling of rainfall, two nested grids of tipping bucket rain gauges were installed in the Tamale experimental watershed during the 2001 rainy season. The larger grid consisted of a 9x9km² area divided into 9 grid-cells of 3x3km². The central grid-cell of the larger grid was sub-divided with a smaller grid of 9 cells of 1x1km². Large variations in rainfall totals for individual storms were measured by the different rain gauges within each grid. The coefficient of variation was on average 0.42 for the large grid and 0.32 for the small grid. Clearly, one can not directly compare results from atmospheric models like MM5, that basically give point results, with that of individual rain gauges. For large storms (>20mm), the coefficient of variation was 0.35 for the large grid and 0.24 for the small grid. These large storms are relatively rare, 18% of total number, but produced 60% of the total rain. Rainfall intensities were high (up to 150 mm/h) and very variable within storms. Intensities within some storms could be divided in a short, intensive convective part and a long tail with low intensities associated with advective rainfall. Statistical properties of the two types of rainfall were different, not only in mean but also in variance and fractal dimension. These detailed
measurements over time and space will enable the statistical downscaling from a 9x9km² grid to individual slopes.
Meteorological modeling The upscaling and downscaling of meteorological variables described above is very important for the proper understanding of the feedback between land surface and atmosphere. Any changes in this feedback will have direct and indirect effects on the regional weather. Our main instrument for the analysis of the impact of these changes and global climate change is the meso-scale meteorological model MM5. Significant progress has been made in the first twenty months of the project in adapting MM5 for use in West Africa. Here, we first present the general set-up and the optimal choice of sub-models that is now used for our daily weather hindcast. We then describe the technical adjustments that were needed to run MM5 for climate simulations from 2030 to 2039. Finally, numerical experiments concerning the effect of changes in land surface properties on regional weather are presented.
MM5 is run using three nested domains, having a horizontal resolution of 81x81 km2 (61x61gridpoints), 27x27 km2 (61x61), and 9x9 km2 (121x67) respectively and 26 vertical layers extending up to 30 mbar. The boundary conditions for the largest domain are provided by global analysis data in the case of daily hindcasting and GCM data such as ECHAM4 for climate simulations. The largest domain provides the boundary conditions for the second domain, and the second domain for the third. The third domain covers the Volta Basin. MM5 includes the Oregon-State-University Land-Surface-Model (OSU-LSM) thereby allowing investigation of feedback mechanisms between land use change and precipitation as well as regional climate simulations. The OSU-LSM makes use of vegetation and soil type in calculating infiltration, percolation and evapotranspiration. Inputs are surface-layer exchange coefficients, radiative forcing. Precipitation rate and surface fluxes are fed back to the atmosphere.
MM5 comes with different empirical schemes for microphysics (6), cumulus parameterization (4), and cloud radiation (3). To find the optimal combination among the 72 possible combinations of schemes, a step-wise optimization was performed by comparing rainfall measured at 28 stations with predicted rainfall over the period 15 July 1998 through 14 August 1998. Large differences were found for different schemes. The optimal combination used the cumulus parameterization of Grell, microphysics according to Reisner, and the radiation scheme according to Dudhia with a RMSE of 56 mm. Given the large natural spatial variability, as described above, this result is satisfying.
Since 1 October 2000, MM5 is used for operational hindcasting. Each night, data are automatically retrieved from NCEP (global re-analysis) and WMO sources (observation data), and an operationalized preprocessing chain of MM5 is started. In approximately 6 hours on a double processor SGI Octane 250 MHz, MM5 calculates the weather patterns in the three domains for the past 24 hours. Data for the smallest domain, covering the basin, is then made available on a FTP server to all project partners, especially the hydrologists, remote sensing specialists, agronomists and agricultural economists who use the data as distributed input for their own models. For each of the 8107 grid-points and for each three-hour interval, the values of 20 variables are stored, such as rainfall, air temperature, latent and sensible heat flux. The actual precipitation field is visualized and can be viewed under http://www.glowa-volta.de/atm/hindcast.htm. Figure 2 is an example from August 2001.
The main purpose of MM5 is to run climate simulations to investigate how land use change and global climate change affects precipitation. However, MM5 is designed as weather prediction model and had to be adjusted to do long-term simulations. Global climate enters as boundary conditions of a GCM at the largest domain. The GCM used here was ECHAM4 of the Deutsches Klimarechenzentrum for the years 2030 through 2039. A series of practical
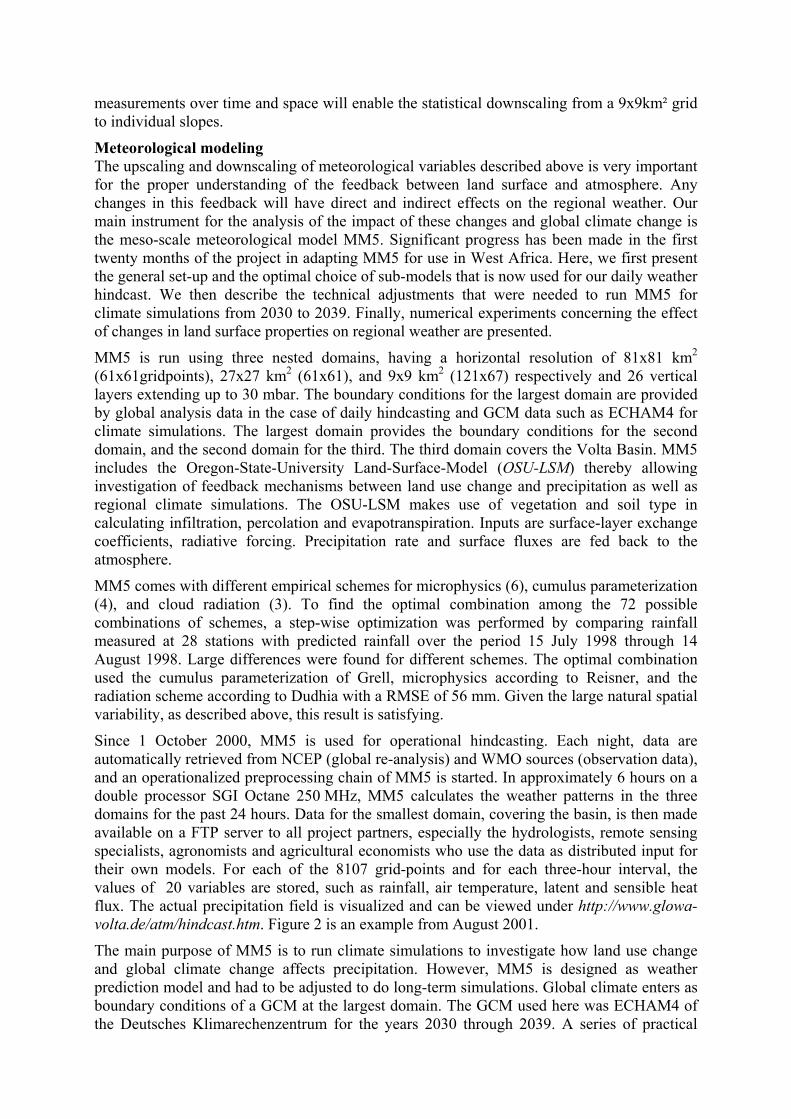
problems had to be solved before the 4.3 GByte of ECHAM4 data could be used with MM5, such as adjusting calendars (ECHAM4 simulations have 360 days per year), map projections of grid points, and vertical interpolation to pressure levels. First tests with data from recent years show that certain structural phenomena, such as the reduced rainfall along the coast between Accra and Lomé, the so called "Togo gap", are indeed reproduced even though these phenomena are not discernable in the much coarser ECHAM4 data.
Figure 2: Rainfall (mm) output of MM5 with simplified scale
Most models developed within the GLOWA Volta project will be small enough to run interactively for decision support. Clearly, MM5 climate simulations are too CPU intensive for interactive use. It is, therefore, very important that a set of landuse change scenarios is developed that cover the extremes in terms of climate impact. The climates associated with these scenarios can then again be used interactively. As a first step, we identify areas that have relatively large impacts on regional circulation. This is done through different types of feedback analysis.
First, the effect of changes in initial soil moisture was studied for a one month period. Changes in soil moisture had large, but locally different, effects, showing that land surface properties are indeed of great importance for local weather. Surprisingly, lower initial soil moisture in the Volta Basin resulted in higher rainfall caused by an increase in precipitation efficiency. To better understand which areas are important, evapotranspiration tagging is now used to trace water that evaporates in a certain to the place where it rains down again. Again, results show large spatial variation suggesting that the large effort that goes into the meteorological modeling is necessary in order to be able to understand the feedback between atmosphere, landuse and water use.

Project ID: 07 GWK 01 (Land Use Cluster) 01.05.2000 – 30.04.2003 DATA GATHERING METHODS FOR LAND-USE CHANGE MODELING W. Agyare, A. Ajayi, B.O. Antwi, T. Bagamsah, T. Berger, A. Braimoh, N. Codjoe, S. Duadze, M. Fosu, G. Menz, S.J. Park, D. Tsegai, F. Vescovi, P.L.G. Vlek, T. Yilma, Center for Development Research (ZEF), Bonn University, Walter-Flex-Str. 3, 53113 Bonn, Germany. [email protected], http://www.glowa-volta.de
Keywords: Land-use change, SVAT model, common sampling frame, hotspot analysis
Abstract: This research cluster aims to 1) understand the interactions between people and their natural environment to predict land-use change within the Volta Basin, and 2) model the effect of land-use change on surface parameters that directly affect the hydrological cycle. During interdisciplinary discussions, a new methodological framework was created and implemented during field campaigns. Household and community surveys were completed during the year 2001 using a ‘common sampling frame (CSF)’, in which data sets taken from the Ghana Living Standards Survey (GLSS) and biophysical factors were merged to increase the reliability of survey activities and to generalize the findings to national and basin levels. Intensive field measurements were carried out to characterize the input parameters used in the Soil-Vegetation-Atmosphere-Transfer (SVAT) model in three experimental watersheds. Remote sensing and GIS facilitated coordination between surveys and field experimentation. In addition, an interdisciplinary effort to build a land-cover and soil database was initiated to link research findings at different spatial scales. In order to ensure further interdisciplinary linkages, detailed socio-economic and natural resource aspects of land-use change were investigated at three ‘hotspots’ within the basin.
Results: This research cluster involves a wide variety of research disciplines and techniques, including remote sensing, geographical information systems, agricultural economics, landscape ecology, soil science, and hydrology. Harmonizing these different disciplinary viewpoints and techniques was the main methodological challenge. Continuous interdisciplinary discussions created a new methodological framework (Figure 1), which was implemented during the field campaigns of the year 2001. This framework ensures a maximum of overlap not only between socio-economic and biophysical field observations, but also between different observation scales of individual subprojects.
Three integrative research methodologies were developed and applied: a common sampling frame, intensive field experiments, and cross-scale linkages. The main research progress will be described in this section according to these methodologies.
Common sampling frame Land use change is the outcome of social as well as physical factors and processes. Predictions concerning land use change can only be made if all relevant factors are taken into account. Such interdisciplinary modeling demands a coherent database but building such a database poses methodological problems. For socio-economists, the main unit of observation is the individual household that takes decisions regarding the use of water and land resources.

Institutional analysts, on the other hand, focus on decision-making processes at higher levels of social organization, such as community, region and country. Finally, hydrologists and soil scientists, Survey sites Field experimental sites
- Primarily model development and parameterisation (L4 and L5)
- Long-term measurement or intensive field studies
- Spatial scale : catchments or hillslopes -Selected by criteria reflecting representative landscape elements within the basin
- Spatial extrapolation is the main challenge
- Primarily basin - wide socio - economic studies (L2 and L3) - community and household survey - Spatial scale : basin wide - Selection based by a stratification of exisitng socio - economic and ecological data - Spatial disaggregation may be the main challenge
Cross-scale
Basin wide soil data base construction
GLOWA land cover directory
- Area where accererated socio -economic and natural processes occurs;- „hotspots“ exemplify the dominant processes within the basin (debatable?); - intensive interdescriplinary efforts or a case study
W2
W3
W4
W5
A2
A3
W2
„Hotspots“
Spatial analysis and data base management (RS and GIS) (for all subprojects)
Spatial analysis and data base management (RS and GIS) (for all subprojects)
Spatial analysis and data base management (RS and GIS) Spatial analysis and database management (RS and GIS) (for all subprojects)
Field experimental sites
- Primarily model development and parameterisation (L4 and L5)
- Long-term measurement or intensive field studies
- Spatial scale : catchments or hillslopes -Selected by criteria reflecting representative landscape elements within the basin
- Spatial extrapolation is the main challenge
- Primarily basin - wide socio - economic studies (L2 and L3) - Community and household survey - Spatial scale : basin-wide - Selection based by a stratification of exisitng socio - economic and ecological data - Spatial disaggregation may be the main challenge
Basin-wide soil data-base construction
GLOWA land-cover directory
- Area where accererated socio -economic and natural processes occur;- “hotspots” exemplify the dominant processes within the basin (debatable?); - intensive interdescriplinary efforts or a case study
W2
W3
W4
W5
A2
A3
W2
“Hotspots”
Figure 1: Methodological framework for land-use clusters and linkages with atmosphere and water use clusters
use research units that are related to landscape boundaries rather than social entities. In order to link data across different observational units, a common sampling frame (CSF) was developed that allows generalization of the findings to the basin level through the Ghana Living Standards Survey (GLSS). The GLSS was used as a "map" of the socio-economic landscape, not unlike the way in which satellite data provide a map of the physical landscape.
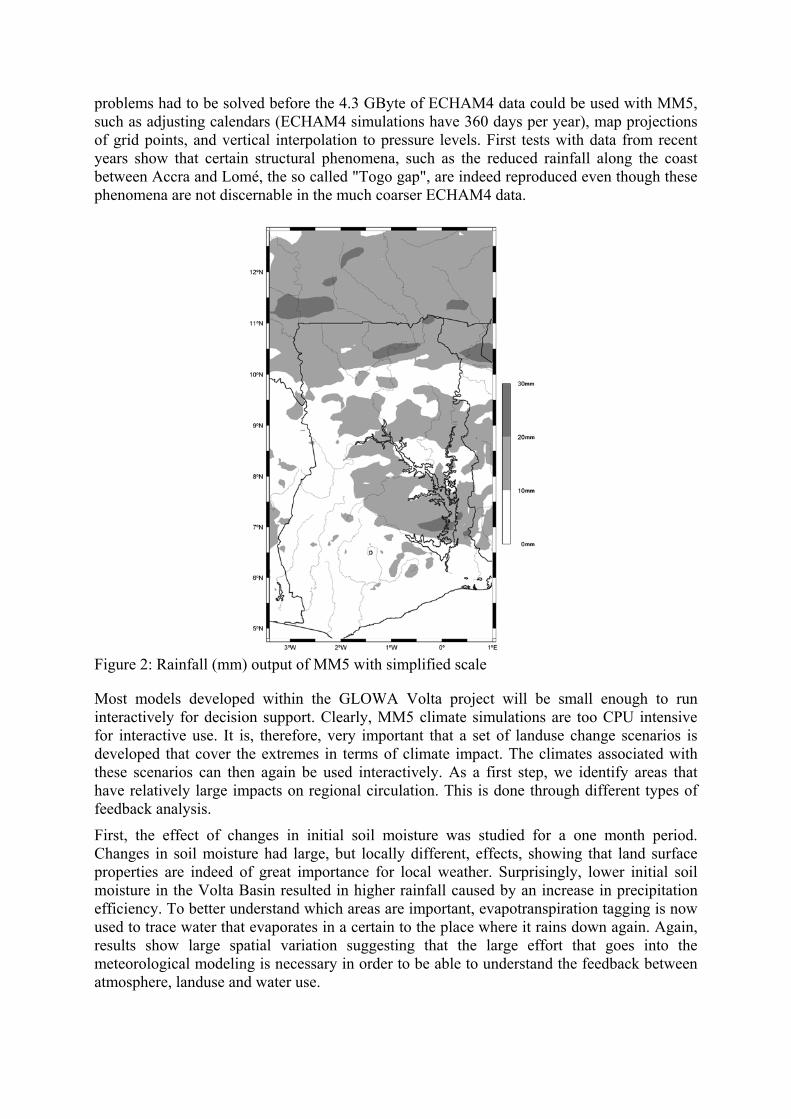
Representative communities were selected from the Ghana Living Standards Survey as main observation units. The GLSS, which was conducted by Ghana’s Statistical Service, provides comprehensive data on various aspects of household economic and social activities, as well as on community characteristics. Of the 6,000 households sampled in the GLSS, 2,240 fall within the Volta Basin. A list of 22 selection variables was constructed that captured socio-economic as well as physical and ecological characteristics within the basin. A principal component analysis and subsequent cluster analysis identified 10 clusters or strata of communities with different characteristics with regard to the selection criteria. Depending on cluster size, one or two communities closest to the cluster centroid were selected as representative communities (Figure 2). The experimental watersheds were added to the sample to ensure overlap. This resulted in a survey list of 20 communities. The various sub-observation units such as sample households, plots and water sources were randomly drawn from each survey community. An interdisciplinary research team conducted the survey activities and field measurements in 2001. In addition, a short standard questionnaire was developed that determines to which cluster a household belongs. This standard questionnaire
was used as a "Social Positioning System" in other surveys (see below) to facilitate proper interpolation of the results.
Figure 2: The study sites where main research activities were carried out during the year 2001.
Experimental watersheds Characterization of the SVAT input parameters for the MM5 meteorological model (see Atmosphere Cluster) requires intensive field sampling and experimentation. Three experimental watersheds were chosen, representing the agroecological zones in the Ghanaian part of the Volta Basin. From North to South: Navrongo, Tamale, and Ejura (Figure 2). All necessary equipment, including weirs, automatic meteorological stations, scintillometers, and surface-runoff plots, was installed and measurements started in April 2001. Many of these research activities are closely linked with individual research activities of subprojects in the Atmosphere and Water Use clusters. This section presents only progress concerning soil and vegetation characterization at the experimental watersheds.
The first phase of the field investigation of spatial variability of soil attributes was completed at the Tamale site. Objectives of this study were to 1) compare different available pedotransfer functions for the prediction of soil-physical properties, and 2) find correlations between individual soil attributes and other, more readily available, variables such as topography and remote sensing signals. The second objective assumes that soil attributes at a given location are the product of various environmental factors that can be modeled and predicted by advanced soil-landscape analysis. Once this analysis is completed, it will greatly accelerate the soil characterization for the whole basin.
To study the partitioning of rainfall over surface runoff and infiltration, sets of runoff plots were installed. Plots of different lengths are used to verify runoff models that explicitly address scale effects, thereby allowing aggregation of point runoff to slope and watershed runoff. Detailed micromorphological characterization and infiltration tests of the plots at the Ejura site reveal that surface crusting is the main cause for enhanced surface runoff. Crusting, in turn, is closely linked with land-use systems. A new terrain characterization algorithm was developed to classify landscapes into different hydrological response zones over the
catchment. This algorithm will be tested at the experimental sites, once the on-going measurements for a detailed digital elevation model (DEM) have been completed. This approach will greatly improve our ability to characterize the spatial distribution of surface runoff.
To measure long-term erosion rates under different environmental and land-use conditions, Cs-137 and Pb-210 techniques were applied. During the last two decades, the efficiency and the value of the Cs-137 has been increasingly recognized as a means to estimate spatially distributed mid-term (10-30 years) soil erosion rates. The application of this technique under tropical conditions, however, has been limited, firstly because the amount of radionuclide fallout was low due to the atmospheric circulation and secondly because of the lack of available equipment in the tropics. Two transects at the Ejura site show that the level of Cs-137 is indeed low (2-3Bq/kg with 10% measurement error), but high enough to utilize this technique for the validation of surface runoff and erosion process models.
An initial survey of vegetation characteristics was performed during remote sensing field campaigns and during a bush fire survey during the year 2001. A more intensive biomass measurement campaign in connection with the spatial characterization of the vegetation will be carried out in the middle of 2002. Vegetation characteristics vary over the landscape. The Normalized Difference Vegetation Index (NDVI) generated from remote sensing images shows interesting correlation patterns with topography at the Tamale site. Water movement through the landscape as well as land management by farmers, who grow different crops at different topographical positions, result in a clear spatial organization of the vegetation. Like the soil-landscape analysis, this vegetation-landscape analysis will greatly improve vegetation characterization throughout the basin.
Cross-scale linkage – ‘hotspots’ and resource database construction The common sampling frame and experimental watershed approaches differ in their spatial scales and measurement intensity. Remote sensing and GIS are very efficient tools to bridge the different spatial scales of the field investigations. Continuous discussions between those scientists involved in the experimental watersheds and those involved in household and community surveys, facilitated the forging of one spatial information system. As an example, during the cluster analysis of GLSS data, ecological selection variables, such as climate and geology, were included to ensure that different physical environments were accounted for. On the other hand, socio-economists collected soil samples and land-cover information during their household and community survey. All this information was geo-referenced using GPS, and stored in a consistent database structure throughout the project. Social information can thus be linked to physical characteristics. At the same time, our standard questionnaire or Social Positioning System allows the linking of environmental information with the GLSS. Thus, the database provides an informational link between research findings at different spatial scales by different disciplines.
As part of our effort to ensure a tight cross-scale linkage, the GLOWA Volta land-cover and land-use classification was developed and implemented during the year 2001. The classification system is a modification and compilation of the following existing classification systems: 1) Ghana land-cover and land-use classification system; 2) FAO Africover Land Cover Classification (LCCS), and 3) ITC/FAO/WAU Land Use Database (LUDB). The first priority for the GLOWA Volta classification system was consistency with existing Ghanaian and International classification systems, in order to avoid unnecessary loss of information and to secure future collaboration with other research activities. In the new system, land cover and land use are separately considered as a hierarchical and modular system. A standard land-cover-recording chart was developed and used in all surveys.
Construction of the soil database is another effort to ensure cross-scale linkages and interdisciplinary collaboration. Given the objectives of the land-use cluster, characterization of soil quality as a natural potential factor for land-use change and hydrological properties as parameters for the SVAT model is essential. Although a FAO Level 2 soil map is available in Ghana in digital form, detailed soil attribute information required for land-use and SVAT modeling is lacking. During the household survey and other detailed field investigations, basic soil attributes including bulk density, soil pH, organic carbon and soil texture were measured as key soil attributes.
As it is not possible to study land-use change for the whole Volta Basin at a fine spatial resolution, there is a need to select key areas to do detailed research. We use the so-called ‘hotspot’ concept to select sites and link local to regional land-use change. Hotspots are defined as areas where accelerated socio-economic and natural processes occur. Due to their rapid changes, investigations at hotspots increase the chances of finding land-use change drivers and constraints within a relatively short time period. At three hotspots, field surveys were conducted in 2001. The topics of these studies are 1) population growth and migration in Kassena-Nankana district; 2) seasonal migration and land-use changes in Wuripe village, northern Ghana; and 3) the influence of bushfires on vegetation characteristics and nutrient cycles (see Figure 2). They all involved both socio-economic (questionnaire and interview) and natural resource (soil and vegetation sampling) aspects of land-use change.

Project ID: 07 GWK 01 (Water Use Cluster) 01.05.2000 – 30.04.2003 OPTIMIZING WATER USE FOR FUTURE SUPPLY AND DEMAND B. Amisigo, T. Berger, M. Iskandarani, W. Laube, J. Liebe, O. Müller, P. Obeng-Asiedu, Y. Osei-Asare, C. Ringler, N. van de Giesen, A. van Edig, C. van der Schaaf Center for Development Research (ZEF), Bonn University, Walter-Flex-Str. 3, 53113 Bonn, Germany. [email protected], http://www.glowa-volta.de
Keywords: transboundary water management, inter-sectoral water allocation, water institutions, household water security, water-related health aspects
Abstract: The water cluster examines changes in water supply and demand as well as the hydrological and socio-economic trade-offs in water allocation. Research activities focused on analyzing secondary data, collecting primary data on household and community level, as well as conducting first analyses of policy scenarios with the help of an integrated economic-hydrologic optimization model. Based on ten-year average data and an institutional analysis of the water sector, we developed alternative water management scenarios and assessed them in first runs of the economic-hydrologic optimization model. The initial model results suggest that the effect of increased irrigation development is small compared to rainfall and runoff variability in the Volta basin. A series of models runs simulates the effects of different scenarios of electricity trade and power generation expansion. As far as the domestic use of water on household and community level is concerned, secondary data analysis showed that only around forty percent of rural households and about fifty percent of urban households use improved water sources for their drinking water needs. Further efforts to expanding the provision of improved water sources are, however, only one part of the solution. The analysis indicated that a household’s choice between improved and traditional drinking water sources not only depends on the household’s income level and distance to the source but is also determined by other factors such as education and preferences or taste. Mapping of water-related diseases, moreover, underlines the importance of health effects through water use.
Results: Research in the five subprojects of the water use cluster has yielded the following achievements, which in some cases are quantitative and qualitative results and in other cases intermediate “products” for on-going research activities.
Node-link network The node-link network, jointly developed in subprojects W1 and W2, represents the spatial structure of the surface water resources system in the Volta Basin. It consists of source nodes (rivers and reservoirs) and demand nodes (irrigated cropping areas, industrial and household consumption, hydropower). Based on time-series data for rainfall and run-off, a total of thirteen nodes has been identified in the Volta Basin, divided over different agro-ecological zones (Figure 1). Five nodes are in the Sudan savanna, six in the Guinea savanna, and two in the Coastal savanna. Crop-water demands and irrigation efficiencies were calculated for these agro-ecological zones. For each node, a hydrologic water balance was established to inform the subsequent water optimization model.
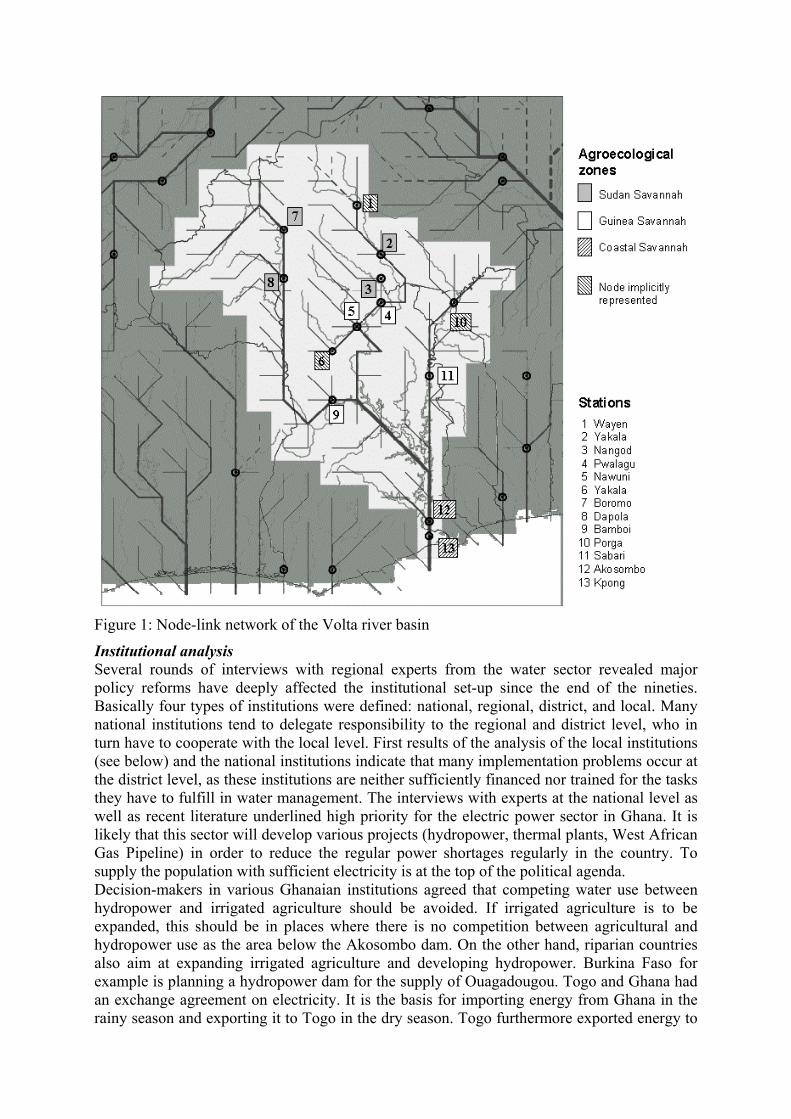
Figure 1: Node-link network of the Volta river basin
Institutional analysis Several rounds of interviews with regional experts from the water sector revealed major policy reforms have deeply affected the institutional set-up since the end of the nineties. Basically four types of institutions were defined: national, regional, district, and local. Many national institutions tend to delegate responsibility to the regional and district level, who in turn have to cooperate with the local level. First results of the analysis of the local institutions (see below) and the national institutions indicate that many implementation problems occur at the district level, as these institutions are neither sufficiently financed nor trained for the tasks they have to fulfill in water management. The interviews with experts at the national level as well as recent literature underlined high priority for the electric power sector in Ghana. It is likely that this sector will develop various projects (hydropower, thermal plants, West African Gas Pipeline) in order to reduce the regular power shortages regularly in the country. To supply the population with sufficient electricity is at the top of the political agenda. Decision-makers in various Ghanaian institutions agreed that competing water use between hydropower and irrigated agriculture should be avoided. If irrigated agriculture is to be expanded, this should be in places where there is no competition between agricultural and hydropower use as the area below the Akosombo dam. On the other hand, riparian countries also aim at expanding irrigated agriculture and developing hydropower. Burkina Faso for example is planning a hydropower dam for the supply of Ouagadougou. Togo and Ghana had an exchange agreement on electricity. It is the basis for importing energy from Ghana in the rainy season and exporting it to Togo in the dry season. Togo furthermore exported energy to

Ghana in the peak time of the daily power consumption. Togo has recently developed its own thermal plants and does no longer depend on Ghana for power production. Close cooperation is thus needed for the riparian countries in the Volta basin to make an optimal use of the available water resources.
Development of scenarios for water-optimization model One major result of the institutional analysis was the development of scenarios for the integrated water-optimization model. Institutions, formal as well as informal, were integrated as constraints in the economic model. Policy scenarios were based on official Ghanaian development planning for the next two decades that entail major changes for water use. The scenarios were grouped according to the principal water-use sectors agriculture, households, industries, and hydropower. The scenarios also include institutional and socio-economic processes such as international cooperation and increased demand for energy and food: - The first scenario prescribes basic supplies of water and electricity for the Ghanaian
population in 2020. By then, every citizen will have access to potable water and electricity.
- The second scenario relates to the expansion of irrigated agriculture. It assumes that the area under cultivation will either be increased 26-fold by 2020, as suggested in policy documents, or that all presently planned irrigation projects will be established.
- The third scenario includes changes in hydropower production in Ghana. In this scenario, the Bui hydropower project is realized, and energy imports and exports are changed.
- The fourth scenario sets increased hydropower and agricultural development for Burkina Faso. If Burkina Faso starts to develop either irrigation or hydropower projects this may have impacts on the availability of water to Ghana.
- The fifth scenario shows the effect of electricity trade and capacity expansion in Ghana and the neighboring countries.
Preliminary assessment of policy scenarios The scenarios outlined above are analyzed in subproject W2 with an integrated mathematical programming model that combines the hydrologic node-link network, the water-production functions for agriculture and hydropower, and the market and policy environment. Demand functions for agricultural products are included. Institutional constraints are reflected in water quotas allocated to different water sectors. In the first simulation runs, the quantities for domestic demand, energy, as well as energy imports and exports were fixed. The model was then used to determine the least-cost energy generation in Ghana while allocating water across different demand nodes based on its economic value. Although the simulations need further validation, some results will be presented here in order to demonstrate the type of information the model generates.
The model scenarios based on ten-year averages for runoff and rainfall show the difficulty of producing enough hydropower. Average energy demands in Ghana can only be met by over-exploiting the water resources entering Lake Volta in the order of ten percent of normal long-term storage levels. All other things being equal, hydropower generation would have to be reduced if Lake Volta were to be operated in a sustainable manner. Another series of simulations analyzes the effects of different scenarios of electricity trade and capacity expansion in Ghana and the neighboring countries. Based on model data for the West Africa Power Pool (WAPP), developed in an USAID funded research project at Purdue University, we test different investment scenarios such as new hydropower and combined cycle generation in Ghana. Irrigation development upstream in Burkina Faso or Northern Ghana does have an effect on the reservoir level but not as dramatic as public debates in the Ghanaian media might suggest. Rather, the model runs support the general hypothesis that climate impacts on the hydrologic cycle are decisive for local water availability and thus economic demand patterns. Since the model employs a spatial representation of available

water resources in the Volta basin, the spatially explicit predictions from the Atmosphere Cluster will be linked directly to find future optimal water distributions. Preliminary model runs only employed secondary data that will be gradually substituted by primary data such as already collected in subprojects W4 and W5. The water allocation model will be integrated with the multiple-agent land use models of subprojects L2 and L3. As outlined in Berger and Ringler (2002), a multi-level multiple-agent framework promises to capture more fully the temporal and spatial scales of interactions between people and their natural environment; to address interrelated water management and land use decisions; and to include policy responses by farmers and other resource users.
Household water security The basis of the economic and institutional analysis on local level is a comprehensive community and household survey that was designed and implemented in 2001 (see also Land Use Cluster). The survey design applies an integrated sampling approach, which facilitates interdisciplinary research by linking biophysical and socio-economic field observations. A priory analysis of the Ghana Living Standards Survey (GLSS) was undertaken to gain first insights into socio-economic conditions and water-use patterns in the basin. Several hypotheses on the determinants and likely consequences of water insecurity could be tested. We compared patterns by means of maps and graphs and conducted statistical analyses on households’ use of alternative water sources, water expenditures, the incidence of water-borne diseases, and potential links to migration. The results of the statistical data analysis showed that, although substantial success has been made by recent programs in providing communities with access to improved water sources, the actual use of such sources still varies geographically and between households. Within the Volta Basin, around 41% of rural households and about 51% of urban households use improved water sources - such as boreholes or piped water - for their drinking water needs. In the rural areas, about 42% of the households still rely on traditional surface-water sources, such as rivers, lakes, springs or ponds. Rainwater collection does not seem to play a role in the drinking water supply within the basin.
Figure 2 shows the incidence of improved water usage in the Ghanaian part of the Volta Basin based on the GLSS survey sites. It seems that sufficient provision of improved water sources is only one part of the solution. Our results show that household income is an important determinant in preferring improved water sources over traditional water sources. Moreover, education programs may help to increase the use of the improved sources, particularly in communities where until recently no wells with pumps existed, because these communities are not used to the taste of pumped water and are not familiar with the technology. In our analysis of household water expenditures, we find that even when indirect costs are included, the average share of income spent on water lies within the range of 3-5% as recommended by the World Bank. We further examined the consequences of improved water access on migration patterns. Our results indicate that water access and availability have a significant impact on migration.
Water-related health aspects Closely related to water availability, access and usage is people’s health. According to statistical analysis of GLSS data, the major health problems of communities in the Volta basin are malaria, measles, hernia and river blindness. Of these diseases, malaria and river blindness are directly related to water. The incidence of malaria and river blindness in the sample is about 88 percent and 24 percent of the households, respectively. This makes malaria the most important water-related disease in the basin. Data analysis on malaria transmission intensity in the Nouna District in Burkina Faso points to Anopheles gambiae s. l. and Anopheles funestus as the principal vectors throughout the year, with high transmission intensities (sporozoite rates 5-15%) documented over the main transmission season (June until December), but very

low transmission intensity (sporozoite rates <1%) during the dry and hot season (February until May). There are considerable variations in malaria transmission intensity by village and season.
Figure 2: Incidence of improved water usage in the Ghanaian part of the Volta Basin
References: Asante, A., Berger, T., Engel, S., Iskandarani, M.: Water security in the Ghanaian Volta Basin:
Patterns, determinants, and consequences, Quarterly Journal of International Agriculture 41 (2002), No. 1 (in press).
Berger, T., Ringler, C.: Trade-offs, efficiency gains and technical change – Modeling water management and land use within a multiple-agent framework, Quarterly Journal of International Agriculture 41 (2002), No. 1 (in press).