project foresight annual report, 2011-2012
TRANSCRIPT

Project FORESIGHT Annual
Report, 2011-2012
Forensic Science Initiative, College of Business & Economics, West Virginia University
Redacted
FORESIGHT
Laboratory
Participant ABC
May 2013
1 | P a g e
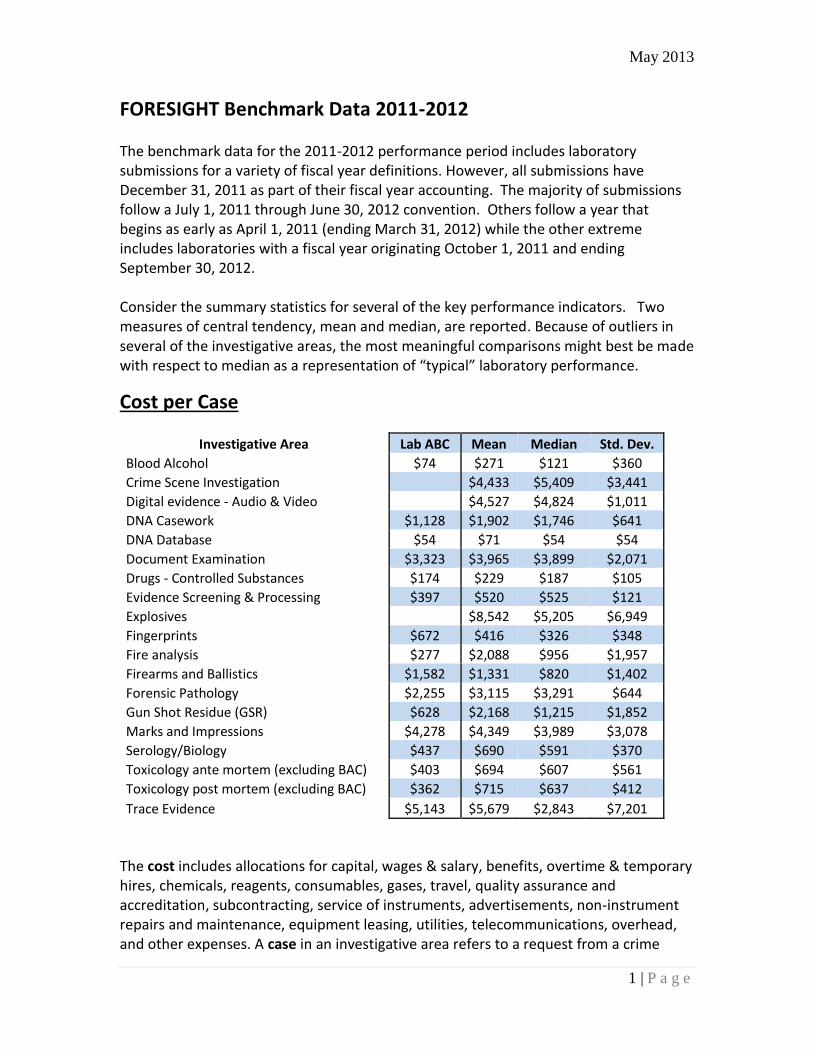
FORESIGHT Benchmark Data 2011-2012 The benchmark data for the 2011-2012 performance period includes laboratory submissions for a variety of fiscal year definitions. However, all submissions have December 31, 2011 as part of their fiscal year accounting. The majority of submissions follow a July 1, 2011 through June 30, 2012 convention. Others follow a year that begins as early as April 1, 2011 (ending March 31, 2012) while the other extreme includes laboratories with a fiscal year originating October 1, 2011 and ending September 30, 2012.
Consider the summary statistics for several of the key performance indicators. Two measures of central tendency, mean and median, are reported. Because of outliers in several of the investigative areas, the most meaningful comparisons might best be made with respect to median as a representation of “typical” laboratory performance.
Cost per Case
Investigative Area Lab ABC Mean Median Std. Dev.
Blood Alcohol $74 $271 $121 $360
Crime Scene Investigation $4,433 $5,409 $3,441
Digital evidence - Audio & Video $4,527 $4,824 $1,011
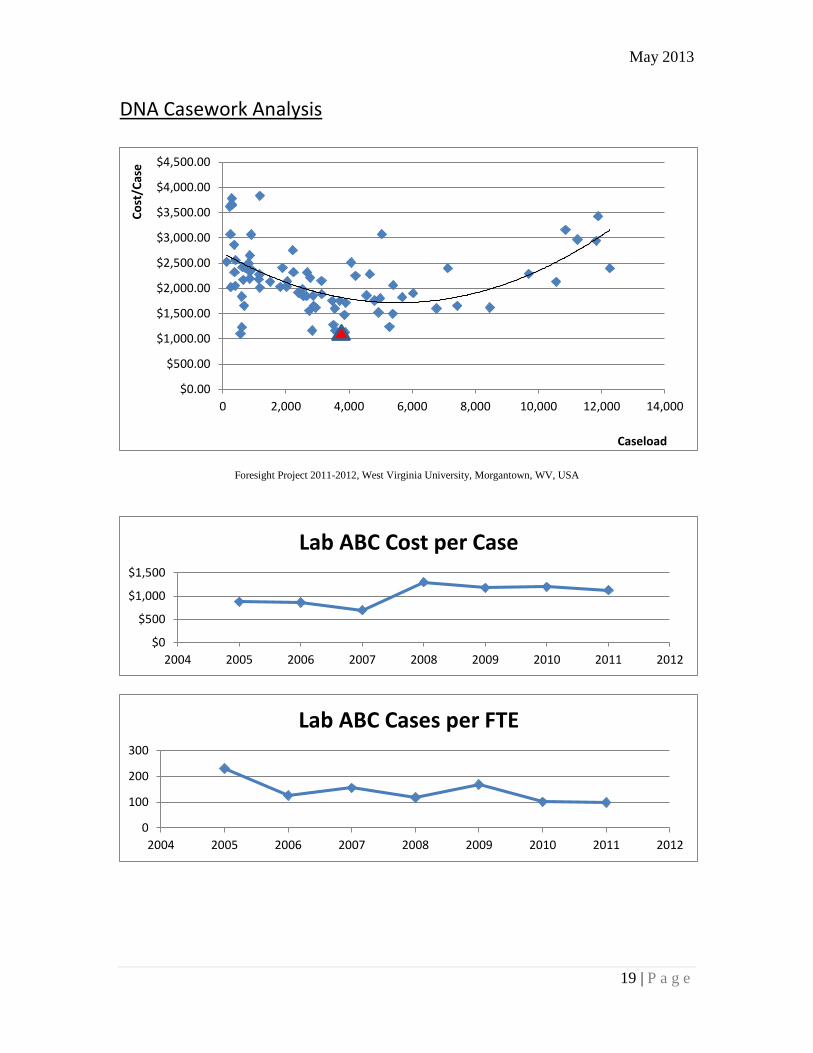
DNA Casework $1,128 $1,902 $1,746 $641
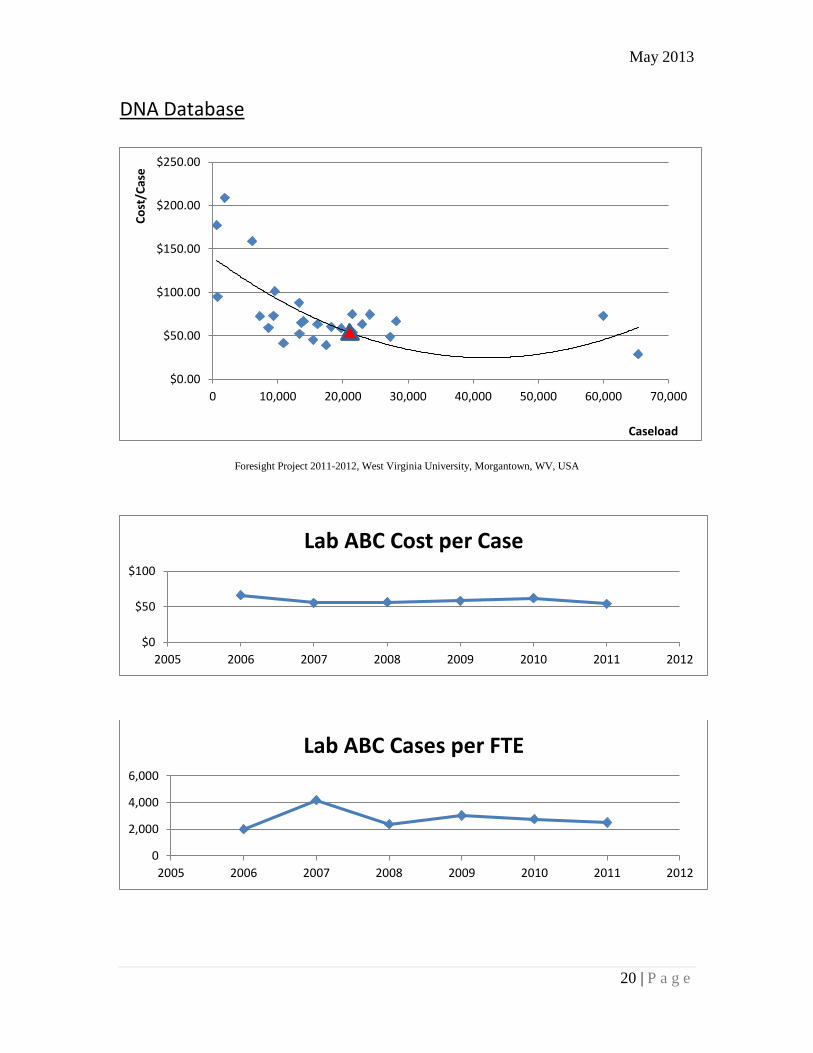
DNA Database $54 $71 $54 $54
Document Examination $3,323 $3,965 $3,899 $2,071
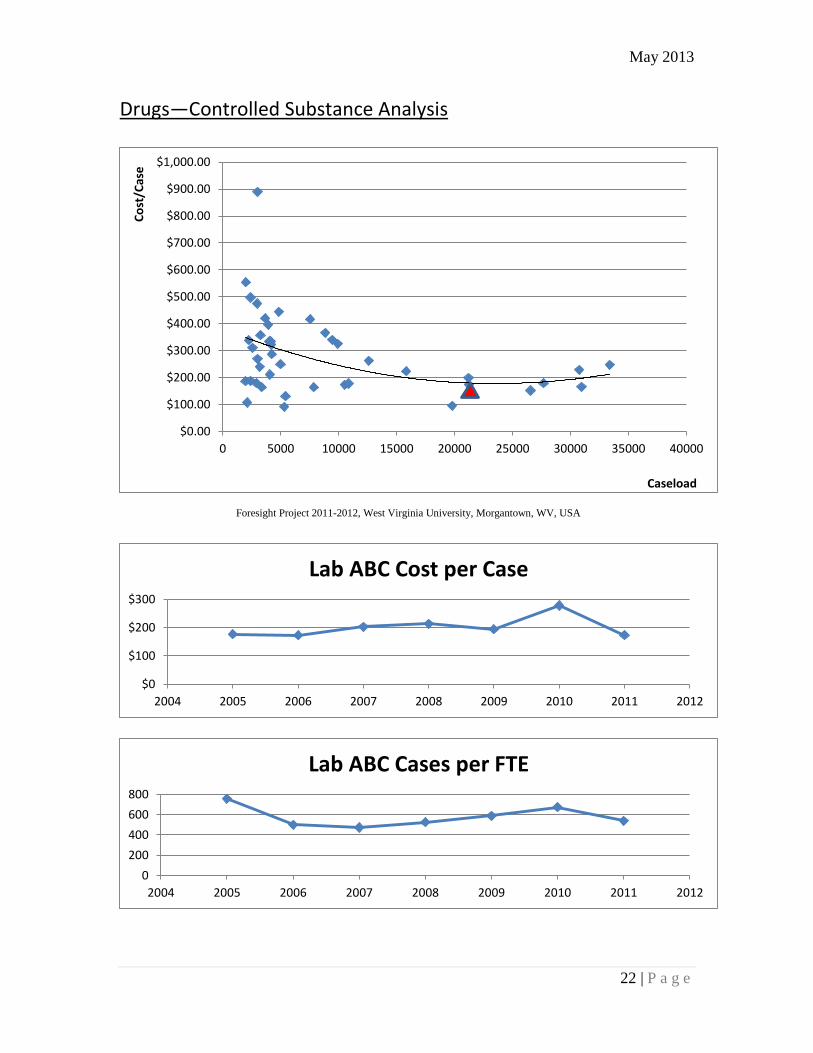
Drugs - Controlled Substances $174 $229 $187 $105
Evidence Screening & Processing $397 $520 $525 $121
Explosives $8,542 $5,205 $6,949
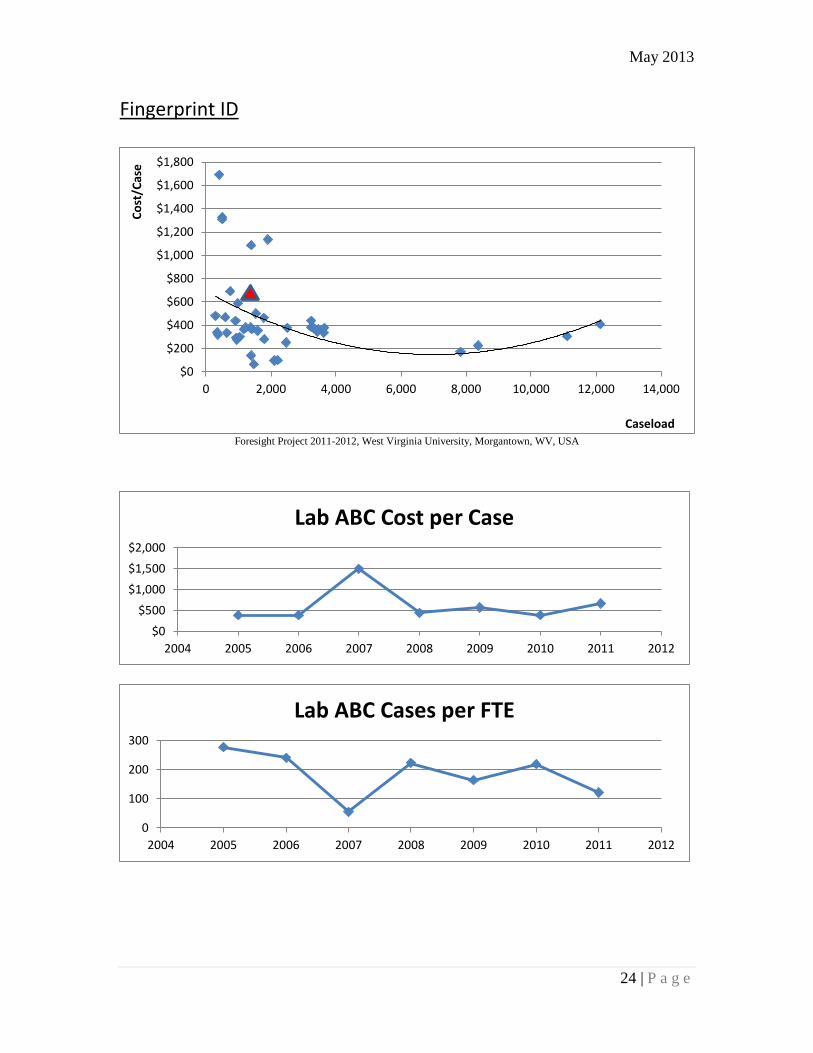
Fingerprints $672 $416 $326 $348
Fire analysis $277 $2,088 $956 $1,957
Firearms and Ballistics $1,582 $1,331 $820 $1,402
Forensic Pathology $2,255 $3,115 $3,291 $644
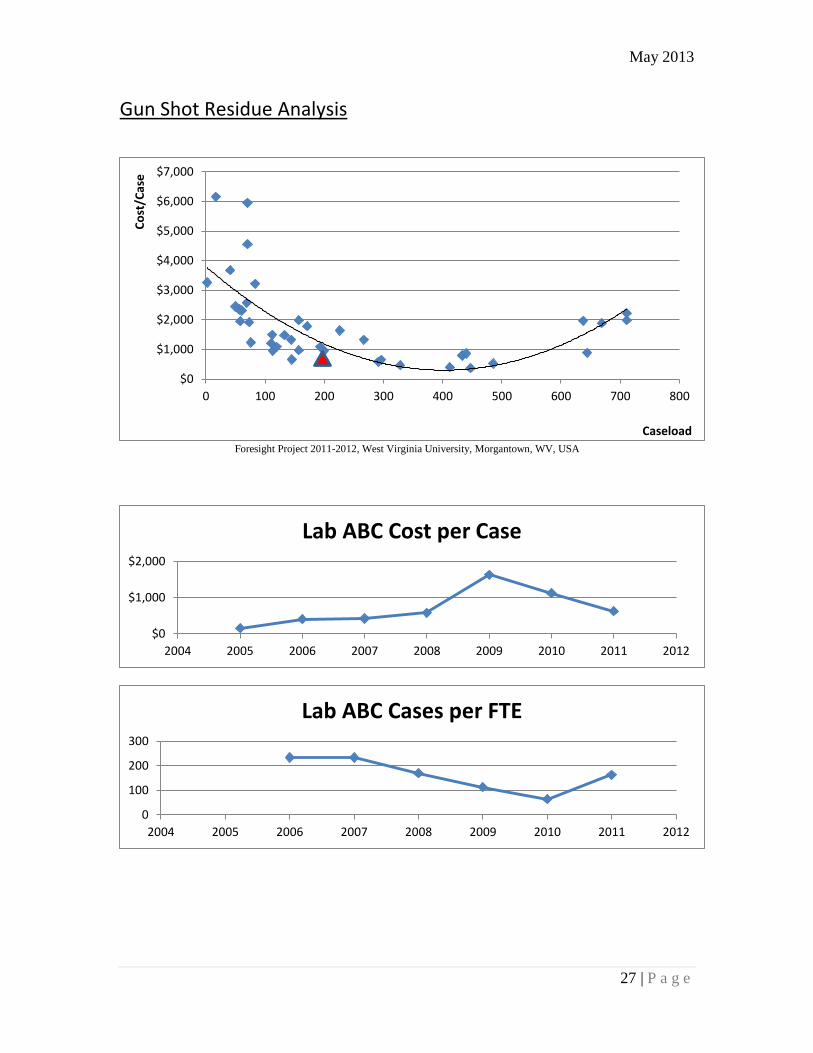
Gun Shot Residue (GSR) $628 $2,168 $1,215 $1,852
Marks and Impressions $4,278 $4,349 $3,989 $3,078
Serology/Biology $437 $690 $591 $370
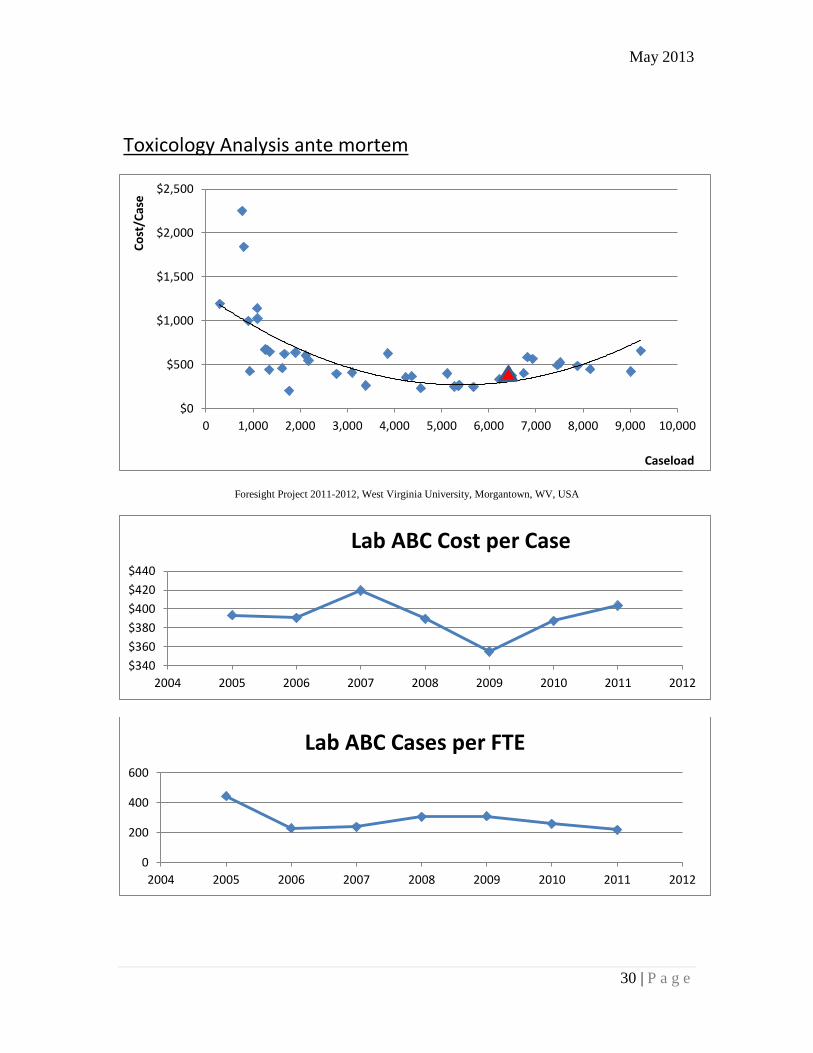
Toxicology ante mortem (excluding BAC) $403 $694 $607 $561
Toxicology post mortem (excluding BAC) $362 $715 $637 $412
Trace Evidence $5,143 $5,679 $2,843 $7,201
The cost includes allocations for capital, wages & salary, benefits, overtime & temporary hires, chemicals, reagents, consumables, gases, travel, quality assurance and accreditation, subcontracting, service of instruments, advertisements, non-instrument repairs and maintenance, equipment leasing, utilities, telecommunications, overhead, and other expenses. A case in an investigative area refers to a request from a crime

May 2013
2 | P a g e
laboratory customer that includes forensic investigation in that investigative area. Note that a customer request may lead to a case in multiple investigative areas.
Cost per Item
Differences in case detail and differences in case complexity across laboratories (and across time) suggest that other relative cost measures may offer more meaningful comparison. FORESIGHT data collection includes measures for items, samples, and tests in each investigative area.
Investigative Area Lab ABC Mean Median Std. Dev.
Blood Alcohol $74 $218 $104 $274
Crime Scene Investigation $12,878 $5,620 $18,469
Digital evidence - Audio & Video $3,767 $3,424 $1,449
DNA Casework $801 $766 $689 $218
DNA Database $56 $984 $52 $2,479
Document Examination $556 $1,501 $1,219 $1,236
Drugs - Controlled Substances $112 $127 $106 $87
Evidence Screening & Processing $97 $260 $97 $288
Explosives $4,408 $2,801 $3,749
Fingerprints $198 $191 $133 $183
Fire analysis $122 $738 $444 $825
Firearms and Ballistics $304 $436 $338 $321
Forensic Pathology $2,255 $3,115 $3,291 $644
Gun Shot Residue (GSR) $483 $1,197 $732 $1,007
Marks and Impressions $2,456 $1,421 $1,086 $813
Serology/Biology $208 $193 $139 $120
Toxicology ante mortem (excluding BAC) $351 $486 $446 $392
Toxicology post mortem (excluding BAC) $333 $373 $333 $210
Trace Evidence $1,940 $3,025 $1,629 $3,581
An item refers to a single object for examination submitted to the laboratory. Note that one item may be investigated and counted in several investigation areas. As noted above, the cost includes allocations for capital, wages & salary, benefits, overtime & temporary hires, chemicals, reagents, consumables, gases, travel, quality assurance and accreditation, subcontracting, service of instruments, advertisements, non-instrument repairs and maintenance, equipment leasing, utilities, telecommunications, overhead, and other expenses.

May 2013
3 | P a g e
Cost per Sample
The sample (defined below) offers a consistently applied metric across laboratories and suggests and average cost measure that is intuitively comparable in cross sectional commentary.
Investigative Area Lab ABC Mean Median Std. Dev.
Blood Alcohol $74 $160 $85 $175
Crime Scene Investigation $13,737 $940 $22,979
Digital evidence - Audio & Video $2,174 $870 $2,469
DNA Casework $801 $514 $481 $222
DNA Database $56 $984 $52 $2,479
Document Examination $556 $1,637 $1,247 $1,481
Drugs - Controlled Substances $112 $110 $81 $87
Evidence Screening & Processing $97 $161 $110 $99
Explosives $2,821 $2,914 $485
Fingerprints $198 $166 $129 $132
Fire analysis $122 $743 $396 $922
Firearms and Ballistics $304 $355 $277 $258
Forensic Pathology $2,255 $2,954 $2,986 $683
Gun Shot Residue (GSR) $483 $702 $324 $1,060
Marks and Impressions $2,456 $1,421 $1,042 $1,203
Serology/Biology $208 $127 $110 $92
Toxicology ante mortem (excluding BAC) $351 $327 $332 $204
Toxicology post mortem (excluding BAC) $333 $311 $333 $225
Trace Evidence $1,940 $2,926 $1,308 $4,050
A sample refers to an item of evidence or a portion of an item of evidence that generates a reported result. As noted above, the cost includes allocations for capital, wages & salary, benefits, overtime & temporary hires, chemicals, reagents, consumables, gases, travel, quality assurance and accreditation, subcontracting, service of instruments, advertisements, non-instrument repairs and maintenance, equipment leasing, utilities, telecommunications, overhead, and other expenses.
May 2013
4 | P a g e
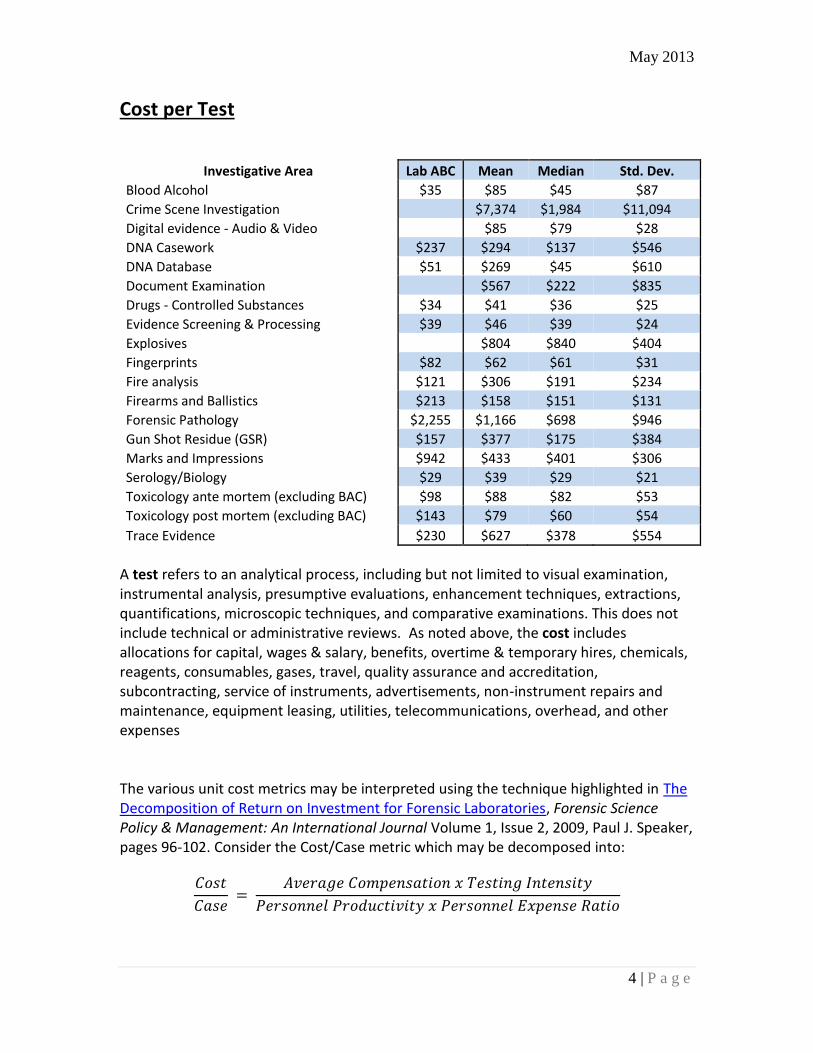
Cost per Test
Investigative Area Lab ABC Mean Median Std. Dev.
Blood Alcohol $35 $85 $45 $87
Crime Scene Investigation $7,374 $1,984 $11,094
Digital evidence - Audio & Video $85 $79 $28
DNA Casework $237 $294 $137 $546
DNA Database $51 $269 $45 $610
Document Examination $567 $222 $835
Drugs - Controlled Substances $34 $41 $36 $25
Evidence Screening & Processing $39 $46 $39 $24
Explosives $804 $840 $404
Fingerprints $82 $62 $61 $31
Fire analysis $121 $306 $191 $234
Firearms and Ballistics $213 $158 $151 $131
Forensic Pathology $2,255 $1,166 $698 $946
Gun Shot Residue (GSR) $157 $377 $175 $384
Marks and Impressions $942 $433 $401 $306
Serology/Biology $29 $39 $29 $21
Toxicology ante mortem (excluding BAC) $98 $88 $82 $53
Toxicology post mortem (excluding BAC) $143 $79 $60 $54
Trace Evidence $230 $627 $378 $554
A test refers to an analytical process, including but not limited to visual examination, instrumental analysis, presumptive evaluations, enhancement techniques, extractions, quantifications, microscopic techniques, and comparative examinations. This does not include technical or administrative reviews. As noted above, the cost includes allocations for capital, wages & salary, benefits, overtime & temporary hires, chemicals, reagents, consumables, gases, travel, quality assurance and accreditation, subcontracting, service of instruments, advertisements, non-instrument repairs and maintenance, equipment leasing, utilities, telecommunications, overhead, and other expenses The various unit cost metrics may be interpreted using the technique highlighted in The Decomposition of Return on Investment for Forensic Laboratories, Forensic Science Policy & Management: An International Journal Volume 1, Issue 2, 2009, Paul J. Speaker, pages 96-102. Consider the Cost/Case metric which may be decomposed into:
𝐶𝑜𝑠𝑡
𝐶𝑎𝑠𝑒 =
𝐴𝑣𝑒𝑟𝑎𝑔𝑒 𝐶𝑜𝑚𝑝𝑒𝑛𝑠𝑎𝑡𝑖𝑜𝑛 𝑥 𝑇𝑒𝑠𝑡𝑖𝑛𝑔 𝐼𝑛𝑡𝑒𝑛𝑠𝑖𝑡𝑦
𝑃𝑒𝑟𝑠𝑜𝑛𝑛𝑒𝑙 𝑃𝑟𝑜𝑑𝑢𝑐𝑡𝑖𝑣𝑖𝑡𝑦 𝑥 𝑃𝑒𝑟𝑠𝑜𝑛𝑛𝑒𝑙 𝐸𝑥𝑝𝑒𝑛𝑠𝑒 𝑅𝑎𝑡𝑖𝑜

May 2013
5 | P a g e
From the decomposition expression for the Cost/Case, an increase in the numerator components, Average Compensation or Testing (or Sampling) Intensity, will increase the cost per case. Similarly, a decrease in denominator component will increase the cost per case. This may occur from either a drop in productivity, as measured by cases processed per FTE, or from an increase in capital investment for future productivity but financed via a drop in personnel expenses relative to total expenses.
Average Compensation
Investigative Area Lab ABC Mean Median Std. Dev.
Blood Alcohol $75,441 $74,241 $76,292 $19,653
Crime Scene Investigation $88,082 $91,150 $16,881
Digital evidence - Audio & Video $82,709 $78,321 $10,813
DNA Casework $61,148 $95,804 $87,242 $41,919
DNA Database $46,827 $60,354 $66,988 $18,431
Document Examination $63,997 $78,142 $74,439 $19,364
Drugs - Controlled Substances $65,855 $77,120 $71,772 $16,264
Evidence Screening & Processing $42,992 $73,357 $60,732 $38,644
Explosives $79,893 $81,758 $34,260
Fingerprints $60,302 $75,901 $72,517 $16,092
Fire analysis $50,427 $88,241 $76,038 $40,314
Firearms and Ballistics $58,872 $87,344 $82,689 $23,627
Forensic Pathology $103,982 $103,604 $102,783 $5,804
Gun Shot Residue (GSR) $73,959 $74,646 $69,843 $19,968
Marks and Impressions $82,190 $71,747 $70,943 $27,460
Serology/Biology $62,416 $74,165 $67,487 $27,022
Toxicology ante mortem (excluding BAC) $60,236 $75,675 $62,374 $25,312
Toxicology post mortem (excluding BAC) $56,718 $75,821 $66,211 $26,589
Trace Evidence $64,075 $100,599 $90,490 $62,848
Note that compensation includes all personnel expenditures. This includes wages, salary, and benefits operating staff, support staff, and administrative staff. Centrally assigned compensation is apportioned to each investigative area according to the percentage of full-time equivalent employees assigned to a particular investigative area. There are a variety of metrics that may be used in the decomposition of average cost to suggest quality and/or risk. Three of these metrics follow to highlight the level of testing, sampling, and items examined per case.

May 2013
6 | P a g e
Items per Case Investigative Area Lab ABC Mean Median Std. Dev.
Blood Alcohol 1.00 1.26 1.03 0.38
Crime Scene Investigation 31.96 1.00 62.43
Digital evidence - Audio & Video 1.25 1.35 0.22
DNA Casework 1.41 2.63 2.35 1.00
DNA Database 0.96 0.89 1.00 0.41
Document Examination 5.98 4.35 3.46 3.28
Drugs - Controlled Substances 1.55 2.46 2.03 1.59
Evidence Screening & Processing 4.07 4.03 4.07 3.13
Explosives 2.03 1.75 0.85
Fingerprints 3.40 2.74 2.25 1.54
Fire analysis 2.28 2.99 2.54 1.41
Firearms and Ballistics 5.20 3.76 2.47 3.66
Forensic Pathology 1.00 1.00 1.00 0.00
Gun Shot Residue (GSR) 1.30 1.96 2.22 0.76
Marks and Impressions 1.74 3.10 3.31 1.39
Serology/Biology 2.10 4.93 3.95 3.26
Toxicology ante mortem (excluding BAC) 1.15 1.71 1.35 1.19
Toxicology post mortem (excluding BAC) 1.09 2.76 2.09 2.48
Trace Evidence 2.65 2.06 2.13 0.47
Samples per Case
Investigative Area Lab ABC Mean Median Std. Dev.
Blood Alcohol 2.00 1.69 1.51 0.80
Crime Scene Investigation 44.17 7.60 69.82
Digital evidence - Audio & Video 4.00 5.40 2.54
DNA Casework 1.79 4.08 3.98 1.52
DNA Database 0.96 0.89 1.00 0.41
Document Examination 5.98 5.08 2.66 4.59
Drugs - Controlled Substances 1.90 3.06 2.21 2.93
Evidence Screening & Processing 4.07 3.92 4.07 1.94
Explosives 4.00 3.89 2.56
Fingerprints 5.39 3.63 2.40 4.03
Fire analysis 2.28 4.09 2.88 2.90
Firearms and Ballistics 6.02 5.12 3.97 4.19
Forensic Pathology 1.00 1.00 1.00
Gun Shot Residue (GSR) 4.00 5.15 4.58 2.85
Marks and Impressions 0.98 3.93 3.50 3.16
Serology/Biology 6.73 6.30 7.82 2.60
Toxicology ante mortem (excluding BAC) 1.16 3.16 1.65 3.55
Toxicology post mortem (excluding BAC) 1.09 4.81 2.08 6.16
Trace Evidence 14.09 3.41 2.13 3.33
May 2013
7 | P a g e
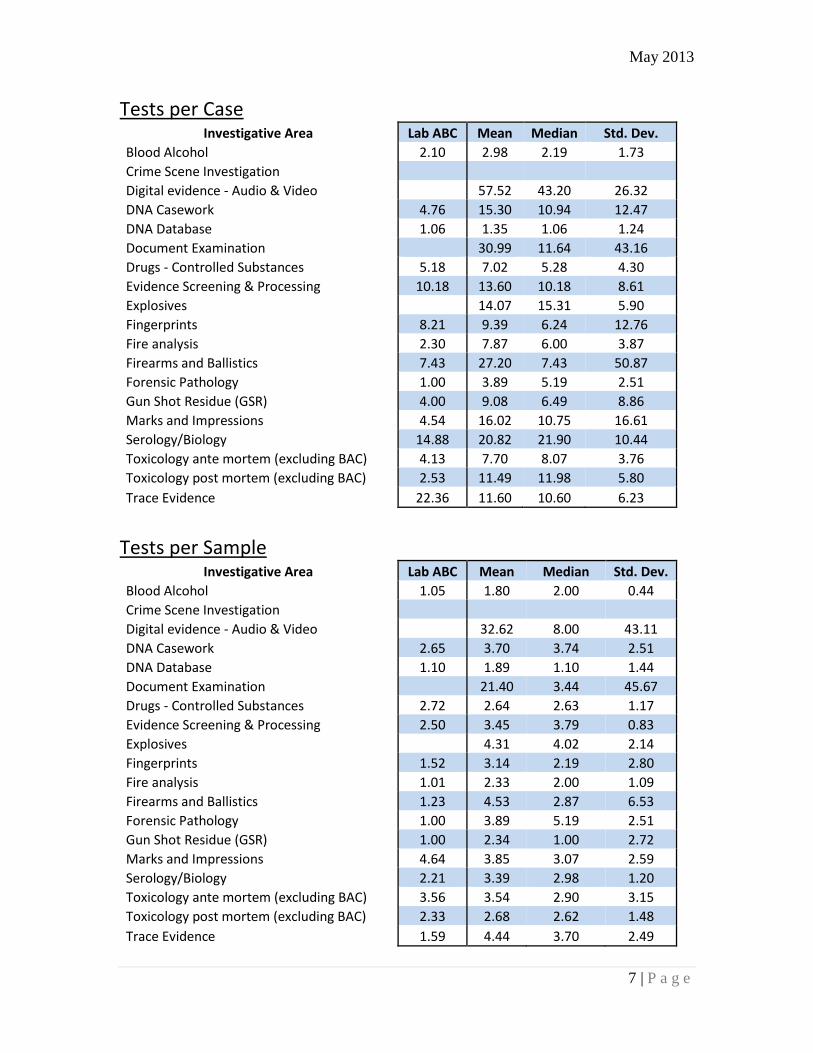
Tests per Case Investigative Area Lab ABC Mean Median Std. Dev.
Blood Alcohol 2.10 2.98 2.19 1.73
Crime Scene Investigation
Digital evidence - Audio & Video 57.52 43.20 26.32
DNA Casework 4.76 15.30 10.94 12.47
DNA Database 1.06 1.35 1.06 1.24
Document Examination 30.99 11.64 43.16
Drugs - Controlled Substances 5.18 7.02 5.28 4.30
Evidence Screening & Processing 10.18 13.60 10.18 8.61
Explosives 14.07 15.31 5.90
Fingerprints 8.21 9.39 6.24 12.76
Fire analysis 2.30 7.87 6.00 3.87
Firearms and Ballistics 7.43 27.20 7.43 50.87
Forensic Pathology 1.00 3.89 5.19 2.51
Gun Shot Residue (GSR) 4.00 9.08 6.49 8.86
Marks and Impressions 4.54 16.02 10.75 16.61
Serology/Biology 14.88 20.82 21.90 10.44
Toxicology ante mortem (excluding BAC) 4.13 7.70 8.07 3.76
Toxicology post mortem (excluding BAC) 2.53 11.49 11.98 5.80
Trace Evidence 22.36 11.60 10.60 6.23
Tests per Sample
Investigative Area Lab ABC Mean Median Std. Dev.
Blood Alcohol 1.05 1.80 2.00 0.44
Crime Scene Investigation
Digital evidence - Audio & Video 32.62 8.00 43.11
DNA Casework 2.65 3.70 3.74 2.51
DNA Database 1.10 1.89 1.10 1.44
Document Examination 21.40 3.44 45.67
Drugs - Controlled Substances 2.72 2.64 2.63 1.17
Evidence Screening & Processing 2.50 3.45 3.79 0.83
Explosives 4.31 4.02 2.14
Fingerprints 1.52 3.14 2.19 2.80
Fire analysis 1.01 2.33 2.00 1.09
Firearms and Ballistics 1.23 4.53 2.87 6.53
Forensic Pathology 1.00 3.89 5.19 2.51
Gun Shot Residue (GSR) 1.00 2.34 1.00 2.72
Marks and Impressions 4.64 3.85 3.07 2.59
Serology/Biology 2.21 3.39 2.98 1.20
Toxicology ante mortem (excluding BAC) 3.56 3.54 2.90 3.15
Toxicology post mortem (excluding BAC) 2.33 2.68 2.62 1.48
Trace Evidence 1.59 4.44 3.70 2.49
May 2013
8 | P a g e
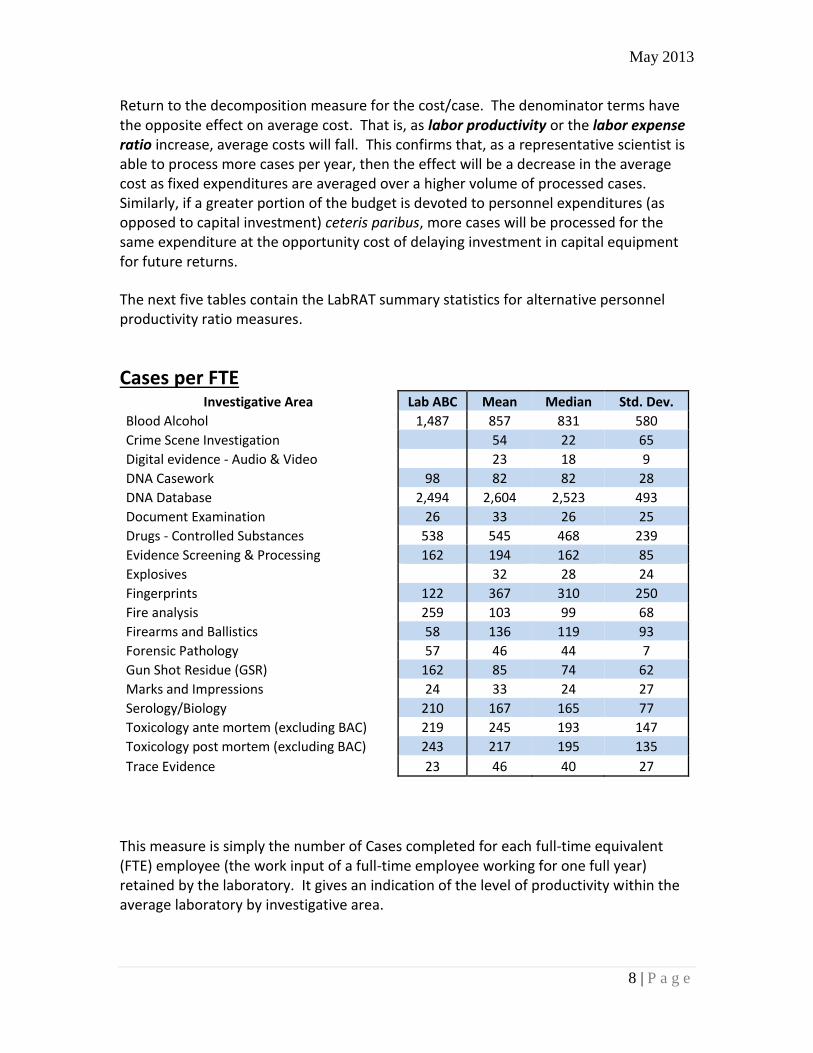
Return to the decomposition measure for the cost/case. The denominator terms have the opposite effect on average cost. That is, as labor productivity or the labor expense ratio increase, average costs will fall. This confirms that, as a representative scientist is able to process more cases per year, then the effect will be a decrease in the average cost as fixed expenditures are averaged over a higher volume of processed cases. Similarly, if a greater portion of the budget is devoted to personnel expenditures (as opposed to capital investment) ceteris paribus, more cases will be processed for the same expenditure at the opportunity cost of delaying investment in capital equipment for future returns.
The next five tables contain the LabRAT summary statistics for alternative personnel productivity ratio measures.
Cases per FTE Investigative Area Lab ABC Mean Median Std. Dev.
Blood Alcohol 1,487 857 831 580
Crime Scene Investigation 54 22 65
Digital evidence - Audio & Video 23 18 9
DNA Casework 98 82 82 28
DNA Database 2,494 2,604 2,523 493
Document Examination 26 33 26 25
Drugs - Controlled Substances 538 545 468 239
Evidence Screening & Processing 162 194 162 85
Explosives 32 28 24
Fingerprints 122 367 310 250
Fire analysis 259 103 99 68
Firearms and Ballistics 58 136 119 93
Forensic Pathology 57 46 44 7
Gun Shot Residue (GSR) 162 85 74 62
Marks and Impressions 24 33 24 27
Serology/Biology 210 167 165 77
Toxicology ante mortem (excluding BAC) 219 245 193 147
Toxicology post mortem (excluding BAC) 243 217 195 135
Trace Evidence 23 46 40 27
This measure is simply the number of Cases completed for each full-time equivalent (FTE) employee (the work input of a full-time employee working for one full year) retained by the laboratory. It gives an indication of the level of productivity within the average laboratory by investigative area.

May 2013
9 | P a g e
Items per FTE Investigative Area Lab ABC Mean Median Std. Dev.
Blood Alcohol 1,487 1,008 966 627
Crime Scene Investigation 2,735 19 5,443
Digital evidence - Audio & Video 29 25 14
DNA Casework 138 210 171 103
DNA Database 2,395 2,471 2,395 1,304
Document Examination 154 197 79 371
Drugs - Controlled Substances 834 1,597 870 1,903
Evidence Screening & Processing 658 614 658 336
Explosives 57 50 40
Fingerprints 413 900 655 604
Fire analysis 589 273 266 162
Firearms and Ballistics 300 383 296 277
Forensic Pathology 57 46 44 7
Gun Shot Residue (GSR) 211 140 150 80
Marks and Impressions 42 84 82 44
Serology/Biology 441 644 559 330
Toxicology ante mortem (excluding BAC) 252 487 252 662
Toxicology post mortem (excluding BAC) 264 799 300 1,459
Trace Evidence 62 84 75 46
Samples per FTE Investigative Area Lab ABC Mean Median Std. Dev.
Blood Alcohol 2,974 1,277 1,081 914
Crime Scene Investigation 3,688 240 6,178
Digital evidence - Audio & Video 99 100 79
DNA Casework 176 327 320 143
DNA Database 2,395 2,471 2,395 1,304
Document Examination 154 267 79 464
Drugs - Controlled Substances 1,025 1,822 1,276 2,395
Evidence Screening & Processing 658 654 658 97
Explosives 48 47 8
Fingerprints 656 1,080 656 982
Fire analysis 589 341 410 207
Firearms and Ballistics 347 421 335 228
Forensic Pathology 57 47 43 8
Gun Shot Residue (GSR) 649 383 385 255
Marks and Impressions 24 103 87 78
Serology/Biology 1,414 892 869 316
Toxicology ante mortem (excluding BAC) 254 883 386 1,670
Toxicology post mortem (excluding BAC) 264 1,600 380 3,490
Trace Evidence 330 118 87 88
May 2013
10 | P a g e
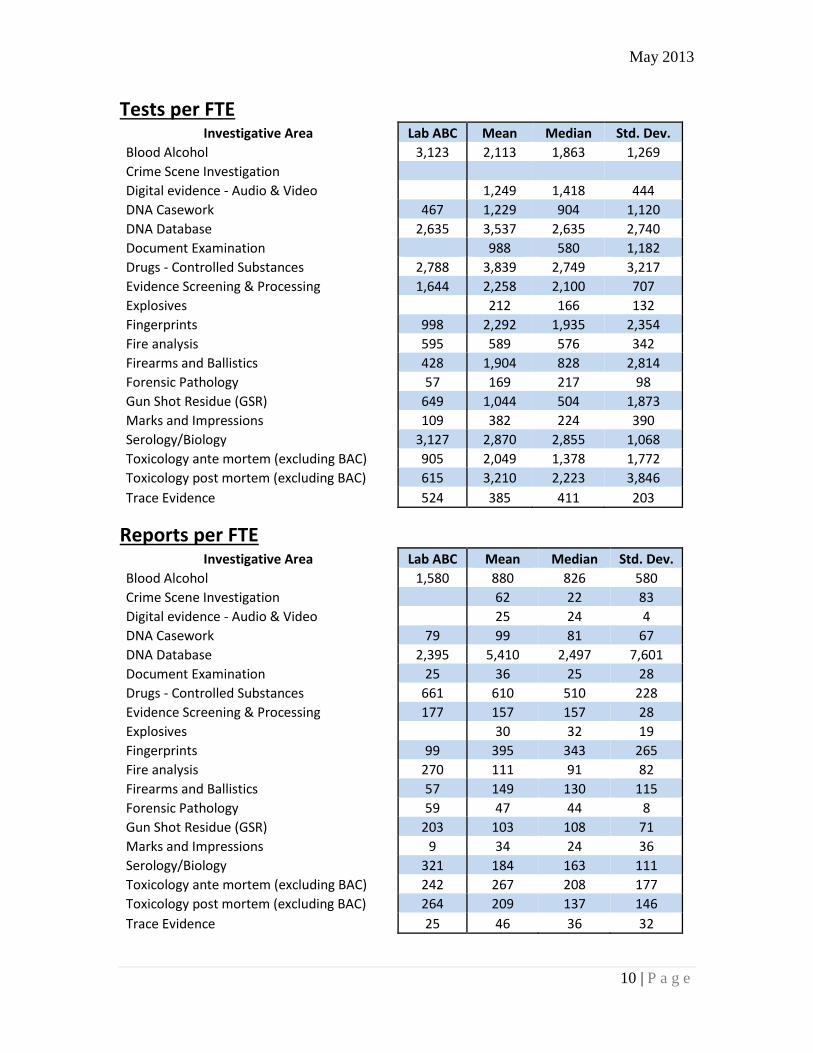
Tests per FTE Investigative Area Lab ABC Mean Median Std. Dev.
Blood Alcohol 3,123 2,113 1,863 1,269
Crime Scene Investigation
Digital evidence - Audio & Video 1,249 1,418 444
DNA Casework 467 1,229 904 1,120
DNA Database 2,635 3,537 2,635 2,740
Document Examination 988 580 1,182
Drugs - Controlled Substances 2,788 3,839 2,749 3,217
Evidence Screening & Processing 1,644 2,258 2,100 707
Explosives 212 166 132
Fingerprints 998 2,292 1,935 2,354
Fire analysis 595 589 576 342
Firearms and Ballistics 428 1,904 828 2,814
Forensic Pathology 57 169 217 98
Gun Shot Residue (GSR) 649 1,044 504 1,873
Marks and Impressions 109 382 224 390
Serology/Biology 3,127 2,870 2,855 1,068
Toxicology ante mortem (excluding BAC) 905 2,049 1,378 1,772
Toxicology post mortem (excluding BAC) 615 3,210 2,223 3,846
Trace Evidence 524 385 411 203
Reports per FTE Investigative Area Lab ABC Mean Median Std. Dev.
Blood Alcohol 1,580 880 826 580
Crime Scene Investigation 62 22 83
Digital evidence - Audio & Video 25 24 4
DNA Casework 79 99 81 67
DNA Database 2,395 5,410 2,497 7,601
Document Examination 25 36 25 28
Drugs - Controlled Substances 661 610 510 228
Evidence Screening & Processing 177 157 157 28
Explosives 30 32 19
Fingerprints 99 395 343 265
Fire analysis 270 111 91 82
Firearms and Ballistics 57 149 130 115
Forensic Pathology 59 47 44 8
Gun Shot Residue (GSR) 203 103 108 71
Marks and Impressions 9 34 24 36
Serology/Biology 321 184 163 111
Toxicology ante mortem (excluding BAC) 242 267 208 177
Toxicology post mortem (excluding BAC) 264 209 137 146
Trace Evidence 25 46 36 32

May 2013
11 | P a g e
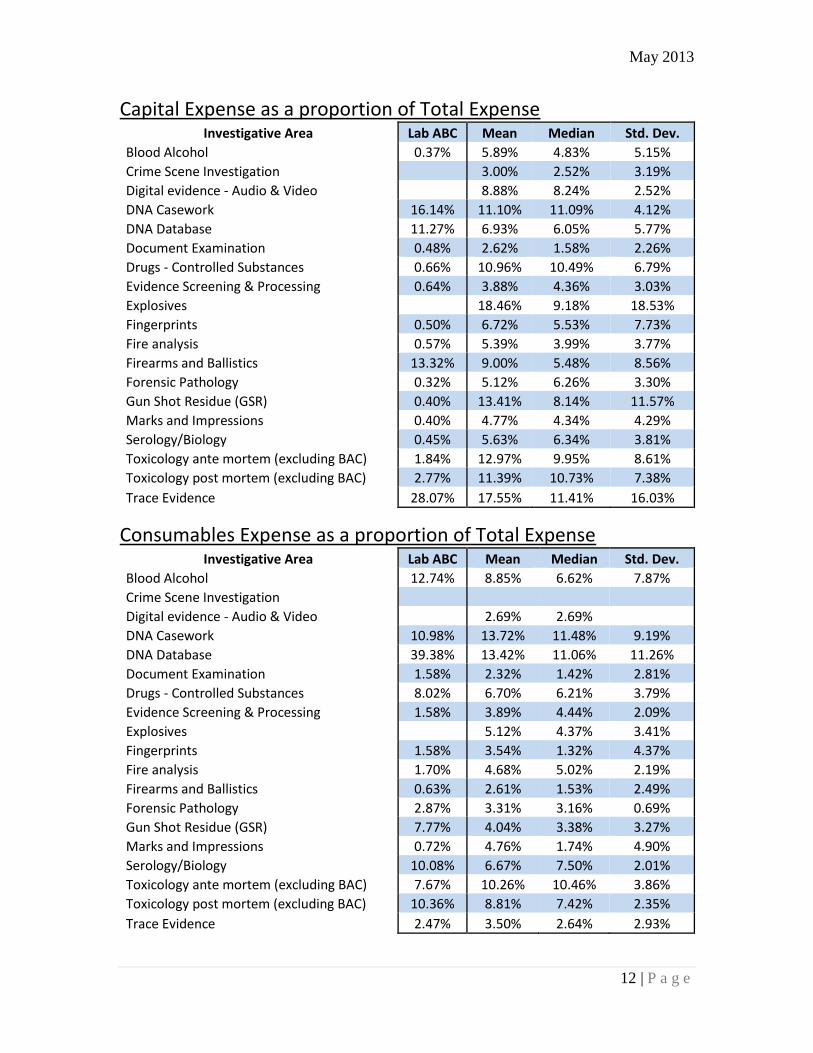
The next decomposition measure, Personnel Expense/Total Expense, serves as a proxy
for the level of analytical technology chosen. This measure has a significant negative
correlation with Capital Expense/Total Expense and serves as simpler decomposition
term for the return on investment.
Below, the cost structure is detailed with a breakdown of expenses in capital, labor,
consumables, versus other costs. Investigative areas that are highly automated, such as
evidenced by the DNA database processing line, should show a lower Personnel
Expense/Total Expense.
Personnel Expense as a proportion of Total Expense
Investigative Area Lab ABC Mean Median Std. Dev.
Blood Alcohol 68.93% 75.31% 79.17% 15.74%
Crime Scene Investigation 76.62% 78.72% 15.11%
Digital evidence - Audio & Video 84.16% 85.11% 2.68%
DNA Casework 55.15% 64.74% 65.75% 12.01%
DNA Database 34.76% 45.80% 54.89% 25.36%
Document Examination 74.93% 79.82% 82.22% 8.28%
Drugs - Controlled Substances 70.33% 72.66% 73.07% 8.44%
Evidence Screening & Processing 67.10% 83.87% 84.19% 13.44%
Explosives 60.97% 63.49% 19.82%
Fingerprints 73.85% 79.47% 77.64% 8.96%
Fire analysis 70.32% 74.61% 77.49% 13.81%
Firearms and Ballistics 64.51% 77.43% 78.62% 9.51%
Forensic Pathology 81.42% 73.66% 74.44% 8.33%
Gun Shot Residue (GSR) 72.55% 69.98% 73.22% 12.54%
Marks and Impressions 79.80% 78.74% 84.91% 14.71%
Serology/Biology 68.05% 76.28% 76.80% 8.18%
Toxicology ante mortem (excluding BAC) 68.23% 63.18% 64.16% 11.40%
Toxicology post mortem (excluding BAC) 64.52% 62.93% 63.99% 13.21%
Trace Evidence 53.16% 67.75% 72.34% 16.06%
May 2013
12 | P a g e
Capital Expense as a proportion of Total Expense Investigative Area Lab ABC Mean Median Std. Dev.
Blood Alcohol 0.37% 5.89% 4.83% 5.15%
Crime Scene Investigation 3.00% 2.52% 3.19%
Digital evidence - Audio & Video 8.88% 8.24% 2.52%
DNA Casework 16.14% 11.10% 11.09% 4.12%
DNA Database 11.27% 6.93% 6.05% 5.77%
Document Examination 0.48% 2.62% 1.58% 2.26%
Drugs - Controlled Substances 0.66% 10.96% 10.49% 6.79%
Evidence Screening & Processing 0.64% 3.88% 4.36% 3.03%
Explosives 18.46% 9.18% 18.53%
Fingerprints 0.50% 6.72% 5.53% 7.73%
Fire analysis 0.57% 5.39% 3.99% 3.77%
Firearms and Ballistics 13.32% 9.00% 5.48% 8.56%
Forensic Pathology 0.32% 5.12% 6.26% 3.30%
Gun Shot Residue (GSR) 0.40% 13.41% 8.14% 11.57%
Marks and Impressions 0.40% 4.77% 4.34% 4.29%
Serology/Biology 0.45% 5.63% 6.34% 3.81%
Toxicology ante mortem (excluding BAC) 1.84% 12.97% 9.95% 8.61%
Toxicology post mortem (excluding BAC) 2.77% 11.39% 10.73% 7.38%
Trace Evidence 28.07% 17.55% 11.41% 16.03%
Consumables Expense as a proportion of Total Expense Investigative Area Lab ABC Mean Median Std. Dev.
Blood Alcohol 12.74% 8.85% 6.62% 7.87%
Crime Scene Investigation
Digital evidence - Audio & Video 2.69% 2.69%
DNA Casework 10.98% 13.72% 11.48% 9.19%
DNA Database 39.38% 13.42% 11.06% 11.26%
Document Examination 1.58% 2.32% 1.42% 2.81%
Drugs - Controlled Substances 8.02% 6.70% 6.21% 3.79%
Evidence Screening & Processing 1.58% 3.89% 4.44% 2.09%
Explosives 5.12% 4.37% 3.41%
Fingerprints 1.58% 3.54% 1.32% 4.37%
Fire analysis 1.70% 4.68% 5.02% 2.19%
Firearms and Ballistics 0.63% 2.61% 1.53% 2.49%
Forensic Pathology 2.87% 3.31% 3.16% 0.69%
Gun Shot Residue (GSR) 7.77% 4.04% 3.38% 3.27%
Marks and Impressions 0.72% 4.76% 1.74% 4.90%
Serology/Biology 10.08% 6.67% 7.50% 2.01%
Toxicology ante mortem (excluding BAC) 7.67% 10.26% 10.46% 3.86%
Toxicology post mortem (excluding BAC) 10.36% 8.81% 7.42% 2.35%
Trace Evidence 2.47% 3.50% 2.64% 2.93%

May 2013
13 | P a g e
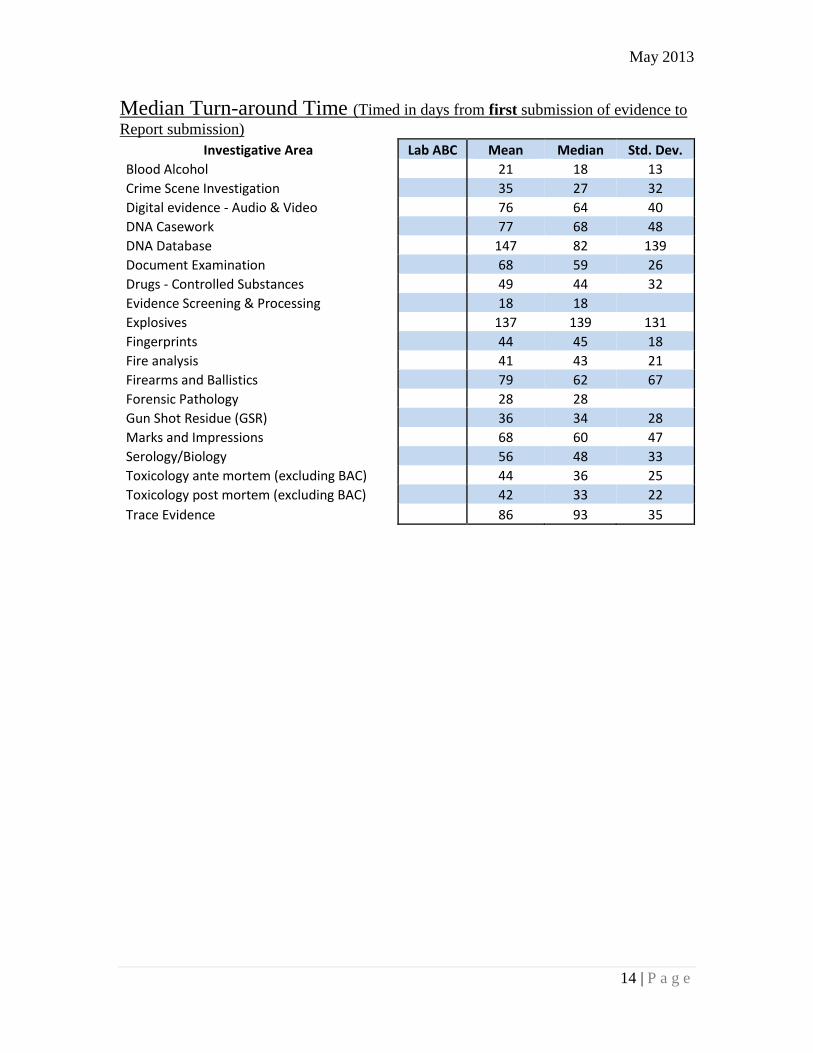
Turn-around Time
Note that turn-around time is offered in two forms. The first is a measure that begins
when the last item of evidence in an investigative area has been submitted to the
laboratory. The second measure begins the turn-around time count with the
submission of the first piece of evidence in an investigative area. Because many
laboratories only record one or the other of these measures, there is some seeming
inconsistency which is attributed to the limited sample. In future years the metric will
be slightly altered to correspond to recommendations from the May 2013 FORESIGHT
participant meeting. The change in the metric will reflect the time from each request
for analysis to issuance of a report. As such, a case in one investigative area may have
multiple turn-around times that correspond to separate requests.
Median Turn-around Time (Timed in days from last submission of evidence to
Report submission) Investigative Area Lab ABC Mean Median Std. Dev.
Blood Alcohol 40 29 12 41
Crime Scene Investigation 39 29 36
Digital evidence - Audio & Video 48 48 6
DNA Casework 63 77 66 59
DNA Database 15 113 82 92
Document Examination 56 43 34 14
Drugs - Controlled Substances 59 45 38 24
Evidence Screening & Processing 36 27 27 13
Explosives 101 31 144
Fingerprints 59 34 35 17
Fire analysis 44 42 46 19
Firearms and Ballistics 132 52 39 57
Forensic Pathology 86 57 57 41
Gun Shot Residue (GSR) 56 44 34 39
Marks and Impressions 39 41 39 28
Serology/Biology 39 43 31 38
Toxicology ante mortem (excluding BAC) 91 33 24 27
Toxicology post mortem (excluding BAC) 49 28 24 14
Trace Evidence 67 75 68 37
May 2013
14 | P a g e
Median Turn-around Time (Timed in days from first submission of evidence to
Report submission) Investigative Area Lab ABC Mean Median Std. Dev.
Blood Alcohol 21 18 13
Crime Scene Investigation 35 27 32
Digital evidence - Audio & Video 76 64 40
DNA Casework 77 68 48
DNA Database 147 82 139
Document Examination 68 59 26
Drugs - Controlled Substances 49 44 32
Evidence Screening & Processing 18 18
Explosives 137 139 131
Fingerprints 44 45 18
Fire analysis 41 43 21
Firearms and Ballistics 79 62 67
Forensic Pathology 28 28
Gun Shot Residue (GSR) 36 34 28
Marks and Impressions 68 60 47
Serology/Biology 56 48 33
Toxicology ante mortem (excluding BAC) 44 36 25
Toxicology post mortem (excluding BAC) 42 33 22
Trace Evidence 86 93 35

May 2013
15 | P a g e
Backlog
Another area of concern involves the increased demand for laboratory services and the
level of backlog. For data collection purposes, the definition of backlog has been
defined as open cases at the end of the fiscal year that have been open for more than
thirty days. As a relative comparative measure, the ratio of open cases to total cases for
the year is presented in the following table.
Cases Open over 30 Days/Annual Caseload
Investigative Area Lab ABC Mean Median Std. Dev.
Blood Alcohol 0.80% 2.62% 0.50% 5.34%
Crime Scene Investigation 9.53% 0.27% 16.24%
Digital evidence - Audio & Video 9.55% 9.55% 0.64%
DNA Casework 9.34% 18.99% 9.34% 22.41%
DNA Database 0.07% 26.92% 25.76% 20.51%
Document Examination 183.16% 40.19% 18.48% 57.79%
Drugs - Controlled Substances 5.94% 6.84% 5.75% 5.45%
Evidence Screening & Processing 25.50% 33.44% 33.44% 11.23%
Explosives 31.07% 20.00% 21.24%
Fingerprints 62.83% 13.52% 5.74% 19.39%
Fire analysis 1.57% 6.18% 7.50% 6.82%
Firearms and Ballistics 94.11% 32.43% 16.46% 34.45%
Forensic Pathology 13.19% 54.06% 39.38% 52.85%
Gun Shot Residue (GSR) 19.50% 10.45% 4.32% 15.67%
Marks and Impressions 239.33% 51.98% 43.75% 74.05%
Serology/Biology 9.08% 6.71% 8.20% 4.21%
Toxicology ante mortem (excluding BAC) 9.91% 6.74% 5.83% 4.96%
Toxicology post mortem (excluding BAC) 5.32% 11.17% 9.74% 6.75%
Trace Evidence 42.42% 53.19% 25.87% 91.74%

May 2013
16 | P a g e
Time in Casework
The final table presents the percentage of time that is dedicated to casework.
Alternatives to time spent in casework include testimony (including preparation and
wait time), research & development activities, teaching to the profession, teaching for
customers, taking continuing education/training sessions, participating in international
and/or interagency cooperative efforts, and developing materials for publication.
Percentage of Time in Casework
Investigative Area Lab ABC Mean Median Std. Dev.
Blood Alcohol 37.15% 36.52% 20.78%
Crime Scene Investigation 45.57% 50.19% 20.96%
Digital evidence - Audio & Video 46.16% 48.71% 4.44%
DNA Casework 55.71% 56.09% 10.38%
DNA Database 48.64% 56.32% 24.19%
Document Examination 45.90% 52.19% 18.09%
Drugs - Controlled Substances 51.19% 47.18% 17.26%
Evidence Screening & Processing 43.63% 43.63%
Explosives 39.68% 34.18% 23.34%
Fingerprints 60.28% 55.97% 17.55%
Fire analysis 51.24% 50.84% 35.61%
Firearms and Ballistics 41.47% 46.20% 17.18%
Forensic Pathology 50.85% 50.85%
Gun Shot Residue (GSR) 55.29% 55.44% 14.64%
Marks and Impressions 48.33% 47.22% 26.09%
Serology/Biology 62.62% 65.82% 12.43%
Toxicology ante mortem (excluding BAC) 57.03% 59.06% 11.58%
Toxicology post mortem (excluding BAC) 57.11% 56.66% 5.39%
Trace Evidence 44.39% 50.30% 25.42%
May 2013
17 | P a g e
Efficiency and Cost Effectiveness of Forensic Science Services FORESIGHT 2011-2012 Benchmark Data
The summary statistics offer a one-dimensional view of performance. In this section,
that view is expanded through a consideration of cost effectiveness and efficiency.
Economic theory indicates that any industry, including forensic science laboratories, will
have average costs (Cost/Case) that decline as caseload is increased until reaching a
point of perfect economies of scale. Thereafter, diseconomies of scale will be realized
and average costs will rise as caseload increases. This behavior is exemplified via U-
shaped average cost curves.
For each investigative area, the industry average cost curve has been estimated by a
second degree polynomial regression. When a laboratory performs on or near the
curve, it is an indication of efficiency for the corresponding caseload. For an efficient
performance that is near the bottom of the U-shaped curve, the laboratory exhibits cost
effective performance as it approaches perfect economies of scale.
In addition to this cross –sectional comparison, average cost and productivity are
illustrated for all past FORESIGHT submissions. Costs have been adjusted for inflation
and converted to the most recent year’s price index.

May 2013
18 | P a g e
Blood Alcohol Analysis
Foresight Project 2011-2012, West Virginia University, Morgantown, WV, USA
$0.00
$100.00
$200.00
$300.00
$400.00
$500.00
$600.00
$700.00
0 5,000 10,000 15,000 20,000 25,000
Co
st/C
ase
Caseload
$0
$50
$100
$150
2004 2005 2006 2007 2008 2009 2010 2011 2012
Lab ABC Cost per Case
0
1,000
2,000
2004 2005 2006 2007 2008 2009 2010 2011 2012
Lab ABC Cases per FTE
May 2013
19 | P a g e
DNA Casework Analysis
Foresight Project 2011-2012, West Virginia University, Morgantown, WV, USA
$0.00
$500.00
$1,000.00
$1,500.00
$2,000.00
$2,500.00
$3,000.00
$3,500.00
$4,000.00
$4,500.00
0 2,000 4,000 6,000 8,000 10,000 12,000 14,000
Co
st/C
ase
Caseload
$0
$500
$1,000
$1,500
2004 2005 2006 2007 2008 2009 2010 2011 2012
Lab ABC Cost per Case
0
100
200
300
2004 2005 2006 2007 2008 2009 2010 2011 2012
Lab ABC Cases per FTE
May 2013
20 | P a g e
DNA Database
Foresight Project 2011-2012, West Virginia University, Morgantown, WV, USA
$0.00
$50.00
$100.00
$150.00
$200.00
$250.00
0 10,000 20,000 30,000 40,000 50,000 60,000 70,000
Co
st/C
ase
Caseload
$0
$50
$100
2005 2006 2007 2008 2009 2010 2011 2012
Lab ABC Cost per Case
0
2,000
4,000
6,000
2005 2006 2007 2008 2009 2010 2011 2012
Lab ABC Cases per FTE

May 2013
21 | P a g e
Document Examination
Foresight Project 2011-2012, West Virginia University, Morgantown, WV, USA
$0
$1,000
$2,000
$3,000
$4,000
$5,000
$6,000
$7,000
$8,000
$9,000
$10,000
0 100 200 300 400 500 600
Co
st/C
ase
Caseload
$0
$1,000
$2,000
$3,000
$4,000
2004 2005 2006 2007 2008 2009 2010 2011 2012
Lab ABC Cost per Case
0
100
200
2004 2005 2006 2007 2008 2009 2010 2011 2012
Lab ABC Cases per FTE
May 2013
22 | P a g e
Drugs—Controlled Substance Analysis
Foresight Project 2011-2012, West Virginia University, Morgantown, WV, USA
$0.00
$100.00
$200.00
$300.00
$400.00
$500.00
$600.00
$700.00
$800.00
$900.00
$1,000.00
0 5000 10000 15000 20000 25000 30000 35000 40000
Co
st/C
ase
Caseload
$0
$100
$200
$300
2004 2005 2006 2007 2008 2009 2010 2011 2012
Lab ABC Cost per Case
0
200
400
600
800
2004 2005 2006 2007 2008 2009 2010 2011 2012
Lab ABC Cases per FTE

May 2013
23 | P a g e
Explosives Analysis
Foresight Project 2011-2012, West Virginia University, Morgantown, WV, USA
$0
$5,000
$10,000
$15,000
$20,000
$25,000
0 20 40 60 80 100 120
Co
st/C
ase
Caseload
May 2013
24 | P a g e
Fingerprint ID
Foresight Project 2011-2012, West Virginia University, Morgantown, WV, USA
$0
$200
$400
$600
$800
$1,000
$1,200
$1,400
$1,600
$1,800
0 2,000 4,000 6,000 8,000 10,000 12,000 14,000
Co
st/C
ase
Caseload
$0
$500
$1,000
$1,500
$2,000
2004 2005 2006 2007 2008 2009 2010 2011 2012
Lab ABC Cost per Case
0
100
200
300
2004 2005 2006 2007 2008 2009 2010 2011 2012
Lab ABC Cases per FTE

May 2013
25 | P a g e
Fire Analysis
Foresight Project 2011-2012, West Virginia University, Morgantown, WV, USA
$0
$2,000
$4,000
$6,000
$8,000
$10,000
$12,000
$14,000
0 100 200 300 400 500 600 700
Co
st/C
ase
Caseload
$0
$500
$1,000
$1,500
2004 2005 2006 2007 2008 2009 2010 2011 2012
Lab ABC Cost per Case
0
100
200
300
2004 2005 2006 2007 2008 2009 2010 2011 2012
Lab ABC Cases per FTE

May 2013
26 | P a g e
Firearms & Ballistics Analysis
Foresight Project 2011-2012, West Virginia University, Morgantown, WV, USA
$0.00
$500.00
$1,000.00
$1,500.00
$2,000.00
$2,500.00
$3,000.00
$3,500.00
0 1,000 2,000 3,000 4,000 5,000 6,000 7,000
Co
st/C
ase
Caseload
$0
$500
$1,000
$1,500
$2,000
2004 2005 2006 2007 2008 2009 2010 2011 2012
Lab ABC Cost per Case
0
200
400
600
2004 2005 2006 2007 2008 2009 2010 2011 2012
Lab ABC Cases per FTE
May 2013
27 | P a g e
Gun Shot Residue Analysis
Foresight Project 2011-2012, West Virginia University, Morgantown, WV, USA
$0
$1,000
$2,000
$3,000
$4,000
$5,000
$6,000
$7,000
0 100 200 300 400 500 600 700 800
Co
st/C
ase
Caseload
$0
$1,000
$2,000
2004 2005 2006 2007 2008 2009 2010 2011 2012
Lab ABC Cost per Case
0
100
200
300
2004 2005 2006 2007 2008 2009 2010 2011 2012
Lab ABC Cases per FTE

May 2013
28 | P a g e
Marks & Impressions Analysis
Foresight Project 2011-2012, West Virginia University, Morgantown, WV, USA
0
5,000
10,000
15,000
20,000
25,000
0 20 40 60 80 100 120 140 160 180 200
Co
st/C
ase
Caseload
$0
$2,000
$4,000
$6,000
2004 2005 2006 2007 2008 2009 2010 2011 2012
Lab ABC Cost per Case
0
50
100
150
2004 2005 2006 2007 2008 2009 2010 2011 2012
Lab ABC Cases per FTE

May 2013
29 | P a g e
Serology/Biology
Foresight Project 2011-2012, West Virginia University, Morgantown, WV, USA
$0
$500
$1,000
$1,500
$2,000
$2,500
$3,000
$3,500
$4,000
0 2,000 4,000 6,000 8,000 10,000 12,000
Co
st/C
ase
Caseload
$0
$500
$1,000
2004 2005 2006 2007 2008 2009 2010 2011 2012
Lab ABC Cost per Case
0
100
200
300
2004 2005 2006 2007 2008 2009 2010 2011 2012
Lab ABC Cases per FTE
May 2013
30 | P a g e
Toxicology Analysis ante mortem
Foresight Project 2011-2012, West Virginia University, Morgantown, WV, USA
$0
$500
$1,000
$1,500
$2,000
$2,500
0 1,000 2,000 3,000 4,000 5,000 6,000 7,000 8,000 9,000 10,000
Co
st/C
ase
Caseload
$340
$360
$380
$400
$420
$440
2004 2005 2006 2007 2008 2009 2010 2011 2012
Lab ABC Cost per Case
0
200
400
600
2004 2005 2006 2007 2008 2009 2010 2011 2012
Lab ABC Cases per FTE

May 2013
31 | P a g e
Toxicology Analysis post mortem
Foresight Project 2011-2012, West Virginia University, Morgantown, WV, USA
$0
$1,000
$2,000
$3,000
$4,000
$5,000
$6,000
0 1,000 2,000 3,000 4,000 5,000 6,000 7,000 8,000 9,000
Co
st/C
ase
Caseload
$0
$200
$400
$600
2004 2005 2006 2007 2008 2009 2010 2011 2012
Lab ABC Cost per Case
0
100
200
300
400
2004 2005 2006 2007 2008 2009 2010 2011 2012
Lab ABC Cases per FTE

May 2013
32 | P a g e
Trace Evidence Analysis
Foresight Project 2011-2012, West Virginia University, Morgantown, WV, USA
$0
$5,000
$10,000
$15,000
$20,000
$25,000
$30,000
$35,000
0 200 400 600 800 1,000 1,200 1,400
Co
st/C
ase
Caseload
$0
$2,000
$4,000
$6,000
2004 2005 2006 2007 2008 2009 2010 2011 2012
Lab ABC per Case
0
20
40
60
2004 2005 2006 2007 2008 2009 2010 2011 2012
Lab ABC Cases per FTE

May 2013
33 | P a g e
For more detail on Project FORESIGHT and its output see:
FORESIGHT: A Business Approach to Improving Forensic Science Services, Forensic Science Policy & Management: An International Journal Volume 1, Issue 2, 2009, Max M. Houck, Richard A. Riley, Paul J. Speaker, & Tom S. Witt, pages 85-95
Abstract: Managers of scientific laboratories see themselves as scientists first and managers second; consequently, they tend to devalue the managerial aspects of their jobs. Forensic laboratory managers are no different, but the stakes may be much higher given the importance of quality science to the criminal justice system. The need for training and support in forensic laboratory management has been recognized for many years, but little has been done to transition the tools of business to the forensic laboratory environment. FORESIGHT is a business-guided self-evaluation of forensic science laboratories across North America. The participating laboratories represent local, regional, state, and national agencies. Economics, accounting, finance, and forensic faculty provide assistance, guidance, and analysis. The process involves standardizing definitions for metrics to evaluate work processes, linking financial information to work tasks, and functions. Laboratory managers can then assess resource allocations, efficiencies, and value of services—the mission is to measure, preserve what works, and change what does not. A project of this magnitude for forensic laboratories has not been carried out anywhere.
Key Performance Indicators and Managerial Analysis for Forensic Laboratories, Forensic Science Policy & Management: An International Journal Volume 1, Issue 1, 2009, Paul J. Speaker, pages 32-42
Abstract: Forensic laboratories generate a great deal of data from casework activities across investigative areas, personnel and budget allocations, and corresponding expenditures. This paper investigates ways in which laboratories can make data-driven managerial decisions through the regular extraction of key performance indicators from commonly available data sources. A laboratory's performance indicators can then be compared to peer laboratory performance to search for best practices, determine in-house trends, manage scarce resources, and provide quantitative support for the
May 2013
34 | P a g e
justification of additional resources.
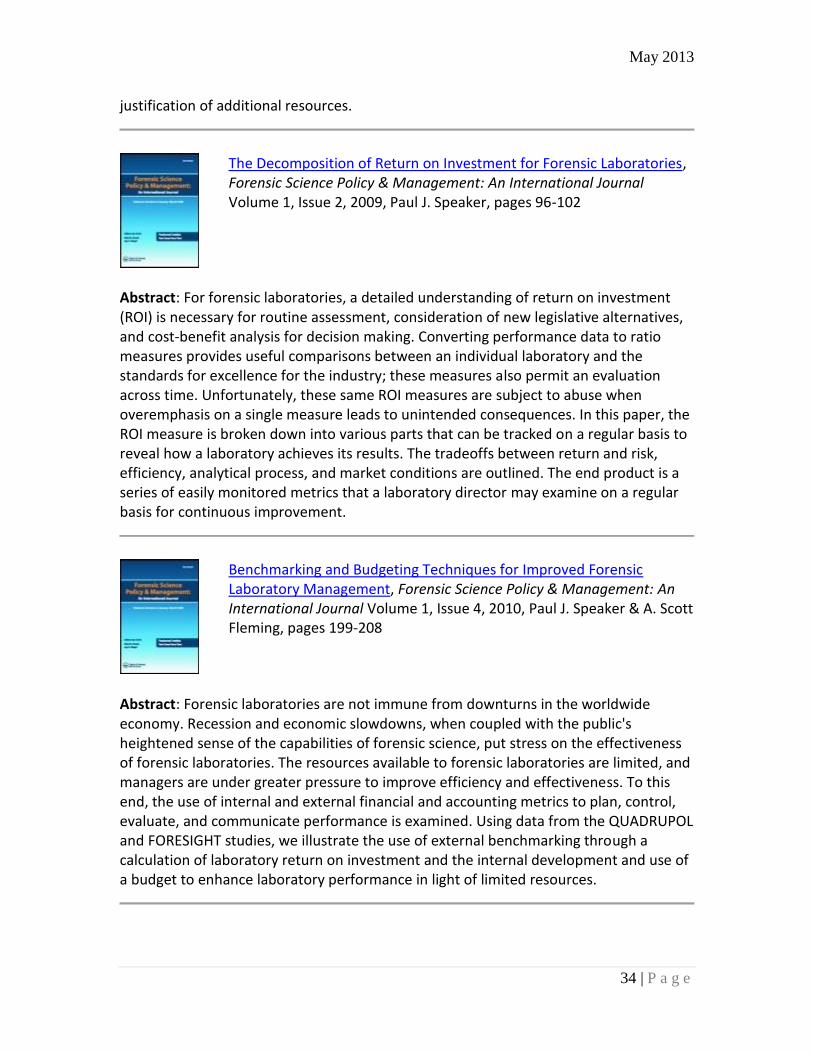
The Decomposition of Return on Investment for Forensic Laboratories, Forensic Science Policy & Management: An International Journal Volume 1, Issue 2, 2009, Paul J. Speaker, pages 96-102
Abstract: For forensic laboratories, a detailed understanding of return on investment (ROI) is necessary for routine assessment, consideration of new legislative alternatives, and cost-benefit analysis for decision making. Converting performance data to ratio measures provides useful comparisons between an individual laboratory and the standards for excellence for the industry; these measures also permit an evaluation across time. Unfortunately, these same ROI measures are subject to abuse when overemphasis on a single measure leads to unintended consequences. In this paper, the ROI measure is broken down into various parts that can be tracked on a regular basis to reveal how a laboratory achieves its results. The tradeoffs between return and risk, efficiency, analytical process, and market conditions are outlined. The end product is a series of easily monitored metrics that a laboratory director may examine on a regular basis for continuous improvement.
Benchmarking and Budgeting Techniques for Improved Forensic Laboratory Management, Forensic Science Policy & Management: An International Journal Volume 1, Issue 4, 2010, Paul J. Speaker & A. Scott Fleming, pages 199-208
Abstract: Forensic laboratories are not immune from downturns in the worldwide economy. Recession and economic slowdowns, when coupled with the public's heightened sense of the capabilities of forensic science, put stress on the effectiveness of forensic laboratories. The resources available to forensic laboratories are limited, and managers are under greater pressure to improve efficiency and effectiveness. To this end, the use of internal and external financial and accounting metrics to plan, control, evaluate, and communicate performance is examined. Using data from the QUADRUPOL and FORESIGHT studies, we illustrate the use of external benchmarking through a calculation of laboratory return on investment and the internal development and use of a budget to enhance laboratory performance in light of limited resources.
May 2013
35 | P a g e
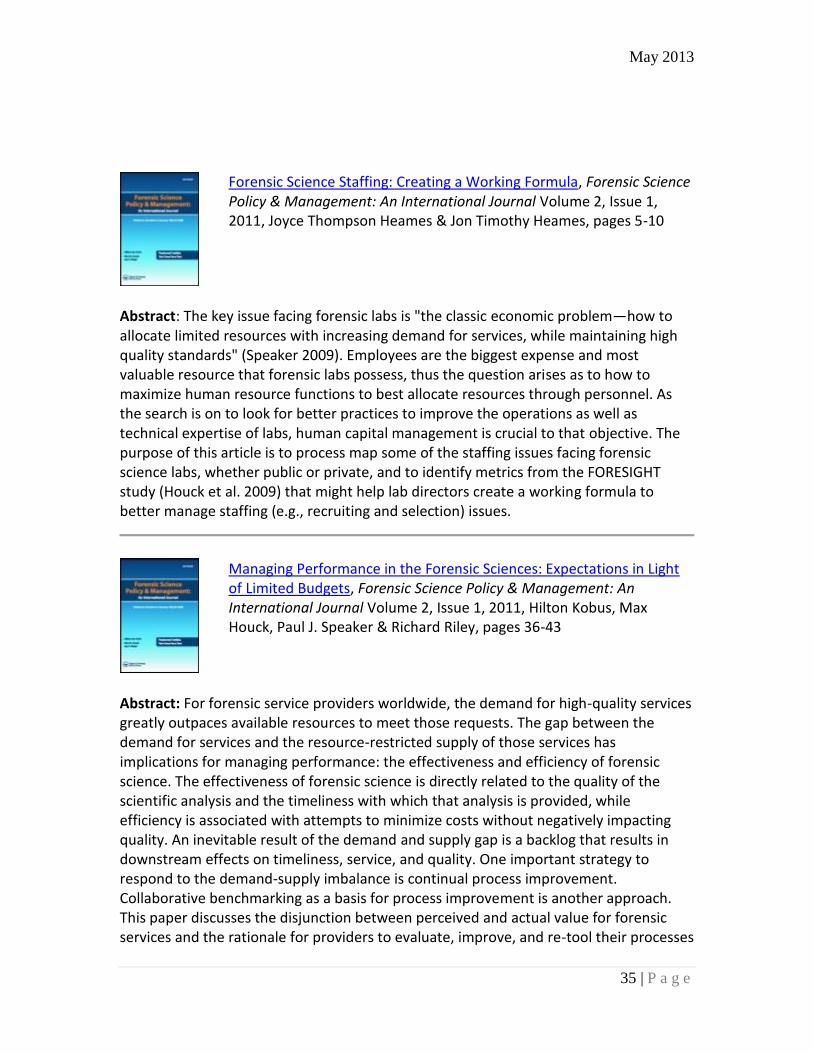
Forensic Science Staffing: Creating a Working Formula, Forensic Science Policy & Management: An International Journal Volume 2, Issue 1, 2011, Joyce Thompson Heames & Jon Timothy Heames, pages 5-10
Abstract: The key issue facing forensic labs is "the classic economic problem—how to allocate limited resources with increasing demand for services, while maintaining high quality standards" (Speaker 2009). Employees are the biggest expense and most valuable resource that forensic labs possess, thus the question arises as to how to maximize human resource functions to best allocate resources through personnel. As the search is on to look for better practices to improve the operations as well as technical expertise of labs, human capital management is crucial to that objective. The purpose of this article is to process map some of the staffing issues facing forensic science labs, whether public or private, and to identify metrics from the FORESIGHT study (Houck et al. 2009) that might help lab directors create a working formula to better manage staffing (e.g., recruiting and selection) issues.
Managing Performance in the Forensic Sciences: Expectations in Light of Limited Budgets, Forensic Science Policy & Management: An International Journal Volume 2, Issue 1, 2011, Hilton Kobus, Max Houck, Paul J. Speaker & Richard Riley, pages 36-43
Abstract: For forensic service providers worldwide, the demand for high-quality services greatly outpaces available resources to meet those requests. The gap between the demand for services and the resource-restricted supply of those services has implications for managing performance: the effectiveness and efficiency of forensic science. The effectiveness of forensic science is directly related to the quality of the scientific analysis and the timeliness with which that analysis is provided, while efficiency is associated with attempts to minimize costs without negatively impacting quality. An inevitable result of the demand and supply gap is a backlog that results in downstream effects on timeliness, service, and quality. One important strategy to respond to the demand-supply imbalance is continual process improvement. Collaborative benchmarking as a basis for process improvement is another approach. This paper discusses the disjunction between perceived and actual value for forensic services and the rationale for providers to evaluate, improve, and re-tool their processes
May 2013
36 | P a g e
toward continual improvement given limited resources.
Strategic Management of Forensic Laboratory Resources: From Project FORESIGHT Metrics to the Development of Action Plans, Forensic Science Policy & Management: An International Journal Volume 2, Issue 4, 2011, Jonathan Newman, David Dawley, & Paul J. Speaker, pages 164-174
Abstract: The project FORESIGHT stated objectives begin with the development of metrics applicable to the activity of forensic science laboratories. These metrics enable a laboratory to assess how they fit within the forensic science industry and offer a glance at the levels of performance that they might be able to achieve. FORESIGHT's mission goes on to state the intent for laboratories to use those measurements to "preserve what works, and change what does not" (Houck et al. 2009, p. 85). This paper addresses the strategic implications of those additional aspects of the FORESIGHT mandate with a view of the strategic planning process for a forensic science laboratory. The keys to the development of an ongoing strategic planning and execution process are outlined, and then the actions of one laboratory, Ontario's Centre of Forensic Sciences, are examined to demonstrate the move from metrics to action. While there cannot yet be made a claim of "best practices," this Canadian example offers some guidance to "better practices" in the quest for continual improvement in the provision of forensic science services.
The Power of Information, Forensic Magazine April 10, 2012, Tom S. Witt & Paul J. Speaker
Abstract: When it comes to cost, the Foresight model was designed to overlook nothing. When we talk about the cost of doing something, we look at everything from equipment, telecommunications, heating, lighting, facility rent … everything. If a participant doesn't have access to the data, we can estimate those costs from other labs in our studies. We come up with an all-inclusive figure that tells participants what it costs to process a case. This leads to informed decisions. Take trace evidence cases, for example. You might find that processing one trace evidence case costs the same as processing two, three, or even four traditional DNA cases. While trace evidence is wonderful and powerful, if DNA alone will get you where you need to be, this cost factor will heavily affect your decision-making process. Foresight is not about cutting where it matters. It's about using resources wisely so that labs can do more and enhance the services they provide. Once you know the key metrics, you can make informed

May 2013
37 | P a g e
decisions.
Is Privatization Inevitable for Forensic Science Laboratories?, Forensic Science Policy & Management: An International Journal Volume 3, Issue 1, 2012, William McAndrew, pages 42-52
Abstract: Given the recent global recession, many national governments have been forced to implement austerity measures, and the forensic science industry has not been immune from such changes. Proposals to privatize some or all aspects of forensic science services have been bantered about for decades, but the recent economic climate has brought this idea back to the forefront of public debates. Although privatization has been shown to have many benefits in the provision of other goods and services, the idea of privatizing forensic services has been harshly criticized by scholars and practitioners. This paper explores some of those criticisms through the lens of economics, and arguments are offered regarding why market approaches in forensic science may be more successful than might have originally been imagined under certain conditions. On the other hand, recognition of those economic forces and reaction by forensic laboratories to address inefficiencies may provide the effective delivery of forensic services that forestalls privatization efforts.
The Balanced Scorecard: Sustainable Performance Assessment for Forensic Laboratories, Science and Justice Volume 52, 2012, Max Houck, Paul J. Speaker, Richard Riley, & A. Scott Fleming, pages 209-216.
Abstract: The purpose of this article is to introduce the concept of the balanced scorecard into the laboratory management environment. The balanced scorecard is a performance measurement matrix designed to capture financial and non-financial metrics that provide insight into the critical success factors for an organization, effectively aligning organization strategy to key performance objectives. The scorecard helps organizational leaders by providing balance from two perspectives. First, it ensures an appropriate mix of performance metrics from across the organization to achieve operational excellence; thereby the balanced scorecard ensures that no single or limited group of metrics dominates the assessment process, possibly leading to long-term inferior performance. Second, the balanced scorecard helps leaders offset short term performance pressures by giving recognition and weight to long-term laboratory
May 2013
38 | P a g e
needs that, if not properly addressed, might jeopardize future laboratory performance.
Efficiency and the Cost Effective Delivery of Forensic Science Services: In-Sourcing, Out-Sourcing, and Privatization, Forensic Science Policy & Management: An International Journal Volume 3, Issue 2, Chris Maguire, Max Houck, Robin Williams, & Paul J. Speaker, pages 62-69
Abstract: Given the recent global recession, many national governments have been forced to implement austerity measures, and the forensic science industry has not been immune from such changes. Proposals to privatize some or all aspects of forensic science services have been bantered about for decades, but the recent economic climate has brought this idea back to the forefront of public debates. Although privatization has been shown to have many benefits in the provision of other goods and services, the idea of privatizing forensic services has been harshly criticized by scholars and practitioners. This paper explores some of those criticisms through the lens of economics, and arguments are offered regarding why market approaches in forensic science may be more successful than might have originally been imagined under certain conditions. On the other hand, recognition of those economic forces and reaction by forensic laboratories to address inefficiencies may provide the effective delivery of forensic services that forestalls privatization efforts.
Enhancing Employee Outcomes in Crime Labs: Test of a Model, Forensic Science Policy and Management: An International Journal Volume 3, Issue 4, 2012, David Dawley.
Abstract: This paper developed and tested a model identifying determinants of employee turnover intentions and desirable performance behaviors, including helping others and engaging in knowledge sharing. Data collected from 798 employees at ten FORESIGHT laboratories suggest that job satisfaction and embeddedness are the primary antecedents of turnover intentions and knowledge sharing, and that embeddedness is a stronger predictor variable of both outcomes. Embeddedness is driven by the employees' understanding of the lab's strategic vision. Moreover, job satisfaction and embeddedness are positively associated with helping behavior. Finally, we identified job autonomy as a primary determinant of job satisfaction. We discuss practical implications of these findings for managers.

May 2013
39 | P a g e
Forensic Science Service Provider Models: Data-Driven Support for Better Delivery Options, Australian Journal of Forensic Sciences Volume 45, Issue 2, 2013, Paul J. Speaker.
Abstract: There are a variety of models for the delivery of forensic science analysis in service to the justice system. In answer to the question as to whether there is a ‘best’ option for the delivery of forensic science services, New Zealand’s Institute of Environmental Science and Research (ESR) has been offered as a model which demonstrates a comparative advantage over the delivery of forensic services in more traditional models. The support for that assertion rests in the ability of the ESR to react at the speed of business and avoid bureaucratic drag found too often in the public sector. This efficiency argument addresses one dimension of the search for ‘best’ delivery. The second dimension involves the discovery of the optimal scale of operation to take efficiency and turn it into cost effectiveness.