project description - deepwater desal
TRANSCRIPT

CENTRAL COAST REGIONAL WATER PROJECT
DeepWater Desal, LLC
Project Description
Prepared For:
The California Public Utilities Commission
May 1, 2013
DeepWater Desal i Response to CPUC May 1, 2013
TABLE OF CONTENTS
1. PROJECT OVERVIEW ..................................................................................................................... 1
2. SITE LOCATION, EXISTING LAND USES, and PROPERTY OWNERSHIP ......................... 4
3. STRUCTURES, FOOTPRINTS, AND SITE ORIENTATION .................................................. 12 3.1 Seawater RO Plant ............................................................................................................................ 12 3.2 Data Center ........................................................................................................................................... 12
4. SEAWATER REVERSE OSMOSIS DESALINATION SYSTEM .............................................. 12 4.1 Process Description Overview .................................................................................................... 12 4.2 DeepWater Ocean-Sited Intake .................................................................................................... 15 4.3 Submerged Intake Pipeline ............................................................................................................. 18 4.4 Onshore Wet Well and Pump Station ....................................................................................... 19 4.5 Source Water Conveyance System ........................................................................................... 23 4.6 Source Water Characterization .................................................................................................... 23 4.7 SWRO Pretreatment System ......................................................................................................... 23 4.8 Cartridge Guard Filters ................................................................................................................... 24 4.9 Reverse Osmosis System .............................................................................................................. 24 4.10 Chemical Storage and Feed Facilities ................................................................................... 27 4.11 Energy Recovery Devices .......................................................................................................... 27 4.12 Permeate Post Treatment ........................................................................................................... 28 4.13 Final Product Water Storage and High Service Pump Station ................................... 28 4.14 Waste Management ....................................................................................................................... 29 4.15 Filter Backwash Disposal ........................................................................................................... 29 4.16 Alternative On-Site Residual's Management System ..................................................... 32 4.17 Concentrate Disposal and Conveyance System .............................................................. 32 4.18 Non-Process Facilities - Electrical Power ........................................................................... 35 4.19 Facility Operation and Maintenance ...................................................................................... 36
5.0 DATA CENTER .......................................................................................................................... 36
6.0 USE OF CO-JOINED TECHNOLOGIES TO MINIMIZE CARBON FOOTPRINT ............ 36
7.0 ONGOING AND PROPOSED STUDIES ................................................................................. 42
8.0 PROJECT SCHEDULE ............................................................................................................... 42
9.0 REGULATORY INFORMATION ............................................................................................. 44 9.1 Lead Agencies .................................................................................................................................... 44 9.2 Agency Review, Permits, and Approvals ................................................................................ 44 9.3 Water Rights ........................................................................................................................................ 44 9.4 Policy Considerations ..................................................................................................................... 45
10.0 OWNERSHIP .......................................................................................................................... 45

DeepWater Desal ii Response to CPUC May 1, 2013
List of Tables
Table 1. CCRWP design flows. .............................................................................................................................................................. 15
Table 2. Source Water Intake Pump Station–Preliminary Design Details. ....................................................................... 19
Table 3. SWRO System–Preliminary Design Details. .................................................................................................................. 25
Table 4. Permeate Post Treatment–Preliminary Design Details. ......................................................................................... 27
Table 5. Energy Recovery–Preliminary Design Details............................................................................................................. 28
Table 6. Product Water Post Treatment, On-Site Storage, and High Service Pump Station– Preliminary Design Details. ............................................................................................................................................. 29
Table 7. Backwash Supply and Concentrate Discharge Basin–Preliminary Design Details. .................................... 32
Table 8. On-site Residual Waste Management System–Preliminary Design Details. .................................................. 32
Table 9. RO System Concentrate Specification–Preliminary Design Details. .................................................................. 33
Table 10a. SWRO plant power consumption estimate–Phase 1 10,000 acre feet per year permeate capacity. ................................................................................................................................................................................... 35
Table 10b. SWRO plant power consumption estimate–Phase 2 (full build-out) 25,000 acre feet per year permeate capacity. .................................................................................................................................................... 36
Table 11. List of agencies expected to use the CCRWP EIR. .................................................................................................... 44
List of Figures
Figure 1. The Monterey Bay submarine canyon near Moss Landing, California. ............................................................. 2
Figure 2a. Location of easement containing the abandoned fuel oil pipeline (cyan lines). The proposed brine discharge pipeline is shown in red and the proposed feedwater intake pipeline is shown in white. ................................................................................................................................................. 7
Figure 2b. Close up of the western border of the easement containing the abandoned fuel oil pipeline. The screened intake and discharge diffuser will be located within this portion. Refer to Figure 2a. ................................................................................................................................................................. 8
Figure 2c. Information regarding the offshore grant boundary and judgment of condemnation for the easement containing the abandoned fuel oil pipeline. ................................................................................... 9

DeepWater Desal iii Response to CPUC May 1, 2013
Figure 2d. Information regarding the judgments of condemnation for the easement containing the abandoned fuel oil pipeline that will contain the proposed feedwater intake and brine discharge pipelines. ............................................................................................................................................................ 10
Figure 3. Aerial view of the Central Coast Regional Water Project feedwater intake and brine discharge piping and footprint of the Tank Farm Parcel that will contain the Saltwater Reverse Osmosis plant and data center. .................................................................................................................... 11
Figure 4. Site footprint showing placement of the SWRO (Desal) and data center campus located on the Tank Farm Parcel. ........................................................................................................................................................ 13
Figure 5. Plan view layout of the SWRO. .......................................................................................................................................... 14
Figure 6. a) Cut out view of a typical cylindrical wedge-wire intake screen showing “V” shaped screen and b) photograph of wedgewire screen. .................................................................................................. 17
Figure 7. Depiction of method proposed for deployment of the intake and discharge pipelines. ......................... 18
Figure 8. Intake pipe segment site plan showing construction methods (Alternative 1). ........................................ 20
Figure 9. Intake pipe segment site plan showing construction methods (Alternative 2). ........................................ 21
Figure 10. Partial plan view of the existing wet well showing source water pump station modifications. ........................................................................................................................................................................ 22
Figure 11. SWRO process flow diagram. ......................................................................................................................................... 26
Figure 12. SWRO backwash reclaim system. ................................................................................................................................. 31
Figure 13. Examples of offshore diffusers. ..................................................................................................................................... 34
Figure 14. Total CCRWP energy consumption in megawatts per hour (MW/hr). ........................................................ 39
Figure 15. Comparison of tons of CO2 generated between normal evaporative cooling vs. and seawater cooling. ................................................................................................................................................................. 40
Figure 16. Example of a high level “co-joined active cooling” engineering concept. ................................................... 41
Figure 17. Preliminary timeline for the Central Coast Regional Water Project–Phase 1. ......................................... 43
DeepWater Desal 1 Response to CPUC May 1, 2013
1. PROJECT OVERVIEW Deepwater Desal LLC ("DWD") is developing the Central Coast Regional Water Project ("CCRWP") at Moss Landing, California. The CCRWP will consist of a number of coastal-dependent industrial uses that will utilize the water of the Monterey submarine canyon at Moss Landing to benefit the regional community. The Monterey submarine canyon at Moss Landing (Figure 1) is one of the deepest and closest to shore submarine canyons in the world. Ecologically sensitive access to deep ocean water from below the euphotic zone will allow consistent quality and temperature, and relatively pure ocean water for various beneficial uses in the CCRWP, including cooling for data centers and source water for desalination. The deep ocean water could also find uses in the production of farmed fish and the cooling of vegetable and fruit packing facilities at Moss Landing. Potable water produced by the seawater reverse osmosis desalination ("SWRO") plant at the CCRWP will be made available to both public water agencies and regulated private water utility companies, including California Water Service Company, serving the Salinas area, and California American Water (CalAm), serving the Monterey area. DWD understands that CalAm presently has an application pending before the CPUC for approval of a relatively small, dedicated desalination plant to be built near the Monterey Peninsula, as an alternative to purchasing potable water from our regional plant. In the event that CalAm is unable to timely proceed with construction of its proposed desalination project to provide replacement water to serve the citizens of the Monterey Peninsula, such replacement water would be available from the CCRWP. The CCRWP has partnered with the City of Salinas to form a municipal power utility that will purchase wholesale electrical power, and re-sell it to the several coastal-dependent businesses at Moss Landing. The power utility will have the flexibility to purchase from any power generator, including power from both traditional and renewable sources; thereby providing a mix of power that will significantly reduce the project's carbon footprint yet provide a reliable uninterrupted power supply. Due to the power demand associated with the new multiple businesses, the combined electrical usage of the multiple entities, especially the data centers, make the formation of the municipal power utility economically attractive. As a result, the desalination component of our project will benefit from the lowest cost for power of any desalination plant in California. The desalination plant component of the CCRWP will be developed in phases to accommodate both immediate and near-term demand for high purity water. The initial Phase 1 is designed at a

DeepWater Desal 2 Response to CPUC May 1, 2013
capacity of 10,000 acre feet per year (AF/Y) with an ultimate build-out capacity of up to 25,000 AF/Y, sufficient to supply potable water to alleviate critical shortages in both Santa Cruz and Monterey counties. Because certain fixed costs will be spread over a larger volume of water, the availability of relatively inexpensive electrical power, and the benefit of heating the SWRO feedwater from data center cooling, the cost of potable water produced from the plant will be significantly lower than the cost of potable water from any smaller dedicated plants such as those proposed in Santa Cruz or Monterey.
Figure 1. The Monterey Bay submarine canyon near Moss Landing, California.
Source: Smith, D.P., R. Kvitek, P.J. Iampietro, and K. Wong. Twenty-nine months of geomorphic change in upper Monterey Canyon (2002–2005). Marine Geology. Volume 236, Issues 1–2, 5 January 2007.
Due to over drafting of the tributary basins draining into Monterey Bay, saltwater intrusion is adversely affecting all the coastal aquifers even as far inland as the wells serving the City of Salinas, which have additional water quality problems associated with high nitrate concentrations in the aquifers. Adding to the looming water crisis on the central coast, the decimation of the ecological productivity and diversity of the riverine species in the coastal tributaries has lead to one order from the State Water Resources Control Board (SWRCB) to stop pumping from the Carmel River Basin by CalAm by 2017 (Order WR 95-10).

DeepWater Desal 3 Response to CPUC May 1, 2013
The CCRWP will intake seawater for the multiple uses from a depth of approximately 100 feet from a screened intake located approximately 1.1 miles offshore at the neck of the Monterey Bay submarine canyon. Detailed studies on the potential effects of the intake on fish larvae (ichthyoplankton) and selected macroinvertebrate larvae are being conducted in partnership with local oceanographic institutions and industrial concerns. These studies include collection of data over an entire year on ichthyoplankton and selected macroinvertebrate abundance and composition, coastal ocean currents, and ocean water quality. DWD has met with Coastal Commission and Central Coast Regional Water Quality Board staff regarding the location and design of the intake, and have solicited their input on the design of these studies and the analysis of the resulting data. The ichthyoplankton and macroinvertebrate study began in March 2012 and will be completed in June 2013. Preliminary results of the studies already show that the ichthyoplankton abundances offshore in Monterey Bay are much lower than the abundances inside Moss Landing Harbor, one of the intake locations considered earlier for a desalination intake. One of the purposes of the studies is to determine whether the location of the intake in deeper water will result in much lower levels of entrainment than an intake in shallower water. The design and location of the intake will represent best technology available for reducing environmental effects, and has a number of benefits over subsurface intake designs. The CCRWP will utilize an existing intake pipeline easement for the Moss Landing Power Plant (MLPP) (Figure 2a-d) for placement of a submerged pipeline from the offshore intake location to an existing onshore wet well located at the MLPP. From the wet well the source water will be pumped to an approximately 110-acre site (referred to as the “Tank Farm Parcel”) located along Dolan Road, east of the MLPP, where the SWRO plant and data centers will be constructed (see Figure 3). Figure 3 also shows an aerial view of the proposed route of the intake pipeline. The discharge pipeline for brine concentrate from the SWRO plant and raw seawater from other uses in the Project, will be routed via a new pipeline from the site to a submerged discharge below the euphotic zone using the same approximate route within the existing easement as the intake pipeline. The brine concentrate will be discharged via diffusers to assure rapid and thorough mixing with ambient seawater. Diffusers are in wide-spread use world-wide for the safe discharge of concentrate from seawater RO desalination plants and are considered to be one of the "best available technologies" for direct undiluted brine discharge into the ocean. Additionally, the concentrate discharge temperature will be warmer than ambient seawater at the discharge site, which will cause the discharged concentrate to rise in the water column, thereby further enhancing rapid mixing.

DeepWater Desal 4 Response to CPUC May 1, 2013
The CCRWP has initiated the EIR process under CEQA with the State Lands Commission. The NEPA lead agency will be selected after the SLC application and project description are submitted to the SLC. DWD will seek input from SLC to identify the NEPA lead agency. A joint EIR/EIS will be produced and certified by both agencies. 2. SITE LOCATION, EXISTING LAND USES, and PROPERTY OWNERSHIP The SWRO plant and data center components of the CCRWP will be constructed on an approximately 110-acre site known as the Tank Farm Parcel (APN 133-171-003), which is located off Dolan Road in Moss Landing east of the MLPP (See Figure 3). The Tank Farm Parcel is presently owned by Dynegy Moss Landing, LLC. DeepWater Desal will acquire fee title to the Tank Farm Parcel. Appendix A provides a copy of the Assessor’s Parcel Maps for the Tank Farm Parcel and the Moss Landing Power Plant (APN 133-181-011). Previously the site was used by MLPP as a tank farm to store fuel oil in five above ground storage tanks. The fuel oil was used as a back-up fuel to natural gas several weeks each year when there was a limited amount of natural gas pipelines coming into California. The fuel oil and natural gas were used in boilers to produce steam to turn steam turbines connected to generators for power production. As more natural gas pipelines were built into California this tank farm was no longer needed. The five above ground storage tanks were removed in 2003. Following demolition of the storage tanks approximately 30,000 tons of tank base gravel was removed. Also, 18,501 cubic yards of non-hazardous sediment from dredging in the Moss Landing Harbor were disposed of in this area which was then graded and hydro-seeded. Today the Tank Farm Parcel is undeveloped except for a small area that contains a 1 million-gallon water tank, small building, and parking lot that is currently occupied by the non-profit Marine Mammal Center and used as a rehabilitation facility. The subsurface feedwater and discharge pipelines will be located in an existing offshore easement owned by Dynegy Moss Landing, LLC. Fee title to most of the nearshore portion of the offshore easement area is owned by the Moss Landing Harbor District. Fee title to the nearshore portion of the offshore easement area that passes over the north jetty of Moss Landing Harbor is owned by the State of California and administered by its State Parks Department. Fee title to the balance of the offshore easement area is owned by the State of California and administered by its State Lands Commission. DeepWater Desal will acquire all of Dynegy Moss Landing, LLC's right, title and interest in and to the offshore easement areas,

DeepWater Desal 5 Response to CPUC May 1, 2013
together with requisite permissions from the Moss Landing Harbor District, the California State Parks Department as well as the California State Lands Commission to replace the existing fuel oil pipeline and anchorage facilities now located in the offshore easement areas with feedwater intake and discharge lines necessary for the operation of the Central Coast Regional Water Project, including requisite permissions to utilize, maintain, and repair those pipelines for project purposes. The onshore feedwater and discharge pipelines outside of the Tank Farm Parcel will be located primarily on land owned by Dynegy Moss Landing, LLC, (collectively, the MLPP parcel). DeepWater Desal will acquire sufficient easement interests from Dynegy Moss Landing, LLC for the installation, use and maintenance of the intake and discharge pipelines over and under the MLPP parcel (Figure 3), including the right to use the existing wet well facility now located on the MLPP parcel. Alternatively, intake and discharge lines could be routed along Dolan Road to California State Highway 1, through public utility easements held by the County of Monterey. A portion of the feedwater and discharge pipelines will pass under California State Highway 1. DeepWater Desal will obtain sufficient permissions from CalTrans to install, use, and maintain these pipelines running under Highway 1. A short section of the onshore feedwater and discharge pipelines will be located in an easement owned by Dynegy Moss Landing, LLC which runs between the Tank Farm Parcel and the MLPP parcel. DeepWater Desal will acquire sufficient rights from Dynegy Moss Landing, LLC to install, use and maintain feedwater and discharge pipelines through this onshore easement area. The portion of the Tank Farm Parcel on which the data center campus and SWRO facilities will be constructed is presently unimproved. The subsurface easement area is presently improved with a fuel oil pipeline which is being maintained in caretaker status under rules promulgated by the United States Coast Guard. DeepWater Desal plans to remove the existing fuel oil pipeline and replace it with the feedwater and discharge pipelines described above. The MLPP parcel is presently used for the purpose of generating electrical power. The short section of the onshore feedwater and discharge pipelines running between the MLPP parcel and the Tank Farm Parcel will be located on an existing pipe rack.

DeepWater Desal 6 Response to CPUC May 1, 2013
Under the terms of the existing MOU between DWD and Dynegy, the parties have identified the Tank Farm Parcel as the suitable location on Dynegy’s property for the desalination plant and other coastal dependent facilities. The parties have also identified easement paths over the MLPP site and other property owned by Dynegy for an intake pipeline, the wet well and a discharge pipeline to transport seawater to and from facilities on the Tank Farm Parcel. Dynegy and DWD are presently in the process of negotiating the terms of an option agreement giving DWD the right to purchase the Tank Farm Parcel together with the associated easements. The site was previously identified by CalAm as the proposed site for its desalination plant and was described in a certified FEIR (CalAm 2009).1
1 California American Water (CalAm). 2009. Coastal Water Project Final Environmental Impact Report. Prepared by ESA. October 2009.

DeepWater Desal 7 Response to CPUC May 1, 2013
Figure 2a. Location of easement containing the abandoned fuel oil pipeline (cyan lines). The proposed brine discharge pipeline is shown in red and the proposed feedwater intake pipeline is shown in white.

DeepWater Desal 8 Response to CPUC May 1, 2013
Figure 2b. Close up of the western border of the easement containing the abandoned fuel oil pipeline. The screened intake and discharge diffuser will be located within this portion. Refer to Figure 2a.

DeepWater Desal 9 Response to CPUC May 1, 2013
Figure 2c. Information regarding the offshore grant boundary and judgment of condemnation for the easement containing the abandoned fuel oil pipeline.

DeepWater Desal 10 Response to CPUC May 1, 2013
Figure 2d. Information regarding the judgments of condemnation for the easement containing the abandoned fuel oil pipeline that will contain the proposed feedwater intake and brine discharge pipelines.

DeepWater Desal 11 Response to CPUC May 1, 2013
Figure 3. Aerial view of the Central Coast Regional Water Project feedwater intake and brine discharge piping and footprint of the Tank Farm Parcel that will contain the Saltwater Reverse Osmosis plant and data center.

DeepWater Desal 12 Response to CPUC May 1, 2013
3. STRUCTURES, FOOTPRINTS, AND SITE ORIENTATION
3.1 Seawater RO Plant The SWRO plant and associated offices and lab facilities will be housed in a new purpose built building located along Dolan Road in the southwestern portion of the tank farm (Figure 4). Pretreatment media filters and product water storage tank will be located adjacent to the building as shown in the attached preliminary layout depicted in Figure 5. The total site including building, parking, tankage, etc. will occupy approximately seven acres. No existing structures will be demolished or removed during construction or operation of the SWRO. Construction will not occur in wetlands.
3.2 Data Center The data center campus will be housed in new purpose built structures constructed adjacent to the SWRO plant as generally shown in Figure 4. The data center campus will occupy approximately 25-acres at full build out. No existing structures will be demolished or removed during construction or operation of the data center campus. Construction will not occur in wetlands. 4. SEAWATER REVERSE OSMOSIS DESALINATION SYSTEM
4.1 Process Description Overview The SWRO plant will be constructed in phases to accommodate both immediate and regional demand. Phase 1 will be sized to produce 10,000 AF/Y (8.9 MGD) of product water. However, the seawater intake, intake pipeline and the concentrate brine discharge pipeline will be sized and constructed to accommodate the full build-out capacity of 25,000 AF/Y (22.3 MGD). The project's design flows are provided in Table 1.

DeepWater Desal 13 Response to CPUC May 1, 2013
Figure 4. Site footprint showing placement of the SWRO (Desal) and data center campus located on the Tank Farm Parcel.

DeepWater Desal 14 Response to CPUC May 1, 2013
Figure 5. Plan view layout of the SWRO.

DeepWater Desal 15 Response to CPUC May 1, 2013
Table 1. CCRWP design flows.
The desalination plant will consist of the following major components:
1. Screened, passive, deep-water intake located below the euphotic zone at a depth of approximately 100 feet,
2. Intake pipeline,
3. Intake pump station to convey seawater to the desalination facility,
4. Pretreatment media filtration system,
5. 10,000 AF/Y capacity (Phase 1), reverse osmosis seawater desalination system (SWRO); with infrastructure in-place to ultimately produce 25,000 AFY,
6. Energy recovery system,
7. Chemical conditioning facilities,
8. Post-treatment facilities,
9. High service product water pump station,
10. Residuals management system – solids settling and filter presses,
11. Electrical power supply, and
12. Concentrate conveyance pipeline and diffuser discharge system.
4.2 DeepWater Ocean-Sited Intake
The deep-water ocean-sited intake consists of a passive seawater withdrawal system containing a 2-mm wedge-wire screened intake, submerged supply pipeline, and an onshore pump station. Source water will be withdrawn at low velocity from a new 54-in. diameter high density polyethylene (HDPE) submerged pipe that will replace an existing carbon steel pipeline previously used by PG&E for offloading fuel oil for the MLPP during the time the MLPP was

DeepWater Desal 16 Response to CPUC May 1, 2013
owned and operated by PG&E. The pipeline will be routed within an existing easement previously granted for the oil supply pipeline (see Figure 2a-d). The intake structure is mounted at the terminus of a newly constructed submerged source water conveyance pipeline located approximately 1.1 miles offshore at a depth of approximately 100 feet, a depth that is below the euphotic zone. The depth is critically important to minimize entrainment of planktonic organisms and to provide high quality, low turbidity water for desalination by reverse osmosis. The euphotic zone is the depth of a water column that is exposed to sufficient sunlight for photosynthesis to occur and extends from the surface to a depth where light intensity is reduced to 1% of the surface intensity. Approximately 90% of all marine life is confined within the euphotic zone which varies in depth from 10 to 250 ft depending upon water quality and location. Therefore, locating the source water intake below the euphotic zone greatly reduces adverse environmental impacts due to both impingement and entrainment of marine organisms. These impacts are further reduced by the design of the intake with respect to both the intake velocity and by incorporated engineered screens into the intake structure. The intake structure is constructed with a pipe riser that will place the intake approximately 30 feet above seabed floor with a large diameter “T” that is capped with cylindrical wedge-wire screens. The screens are designed with "V" shaped wires with 2.0 mm (0.08 in.) slot openings that preclude the entrainment of organisms of a size greater than the 2-mm screen slots. The "T" structure is designed with a cross sectional area that will restrict the intake velocity of seawater to a maximum intake velocity of <0.5 feet per second (fps) to minimize impingement. The maximum intake velocity of <0.5 fps has been validated through numerous studies to be sufficiently low to minimize impingement of marine organisms against the screen, particularly when sited in locations where currents provide ambient cross flow velocities (≥ 1 fps) to continually sweep screens. Figure 6 shows examples of cylindrical wedge-wire screens for seawater intake.

DeepWater Desal 17 Response to CPUC May 1, 2013
a)
b)
Figure 6. a) Cut out view of a typical cylindrical wedge-wire intake screen
showing “V” shaped screen and b) photograph of wedgewire screen.
Source: b) Tenera Environmental, Inc. 2010. Open Ocean Intake Effects Study. Prepared for City of Santa Cruz Water Department & Soquel Creek Water District scwd2 Desalination Program.

DeepWater Desal 18 Response to CPUC May 1, 2013
4.3 Submerged Intake Pipeline A submerged 54-in. intake pipeline will be constructed to convey source water from the offshore intake to the onshore pump station. The pipeline will be constructed from HDPE. Construction of the pipeline will involve developing a detailed pipeline design, including specific deployment planning, and will generally be carried out as follows:
Step 1–HDPE pipe is delivered to the site in 40 ft––55 ft lengths. The pipe lengths are then fused into longer lengths and temporarily stored in a protected area, likely in the Moss Landing Harbor. As the pipe sections are air filled they float on the surface. Next, precast concrete ballast weights are mounted on the pipeline using a floating barge. The weights serve as the primary anchors to stabilize the pipe on the seafloor.
Step 2–When pipe assembly and staging activities are complete, the entire pipeline is towed to the site, aligned and submerged along the pipe path, typically in a single 24-hr. period. The pipeline is deployed and submerged in one continuous operation lasting approximately seven hours once flooding is initiated.
The pipeline is flooded with a nearshore pump system and slowly submerged to the seafloor under controlled conditions. Air is released at the offshore end during submergence. Figure 7 illustrates the shape of the pipe during the submergence process.
Figure 7. Depiction of method proposed for deployment of the intake and discharge pipelines. Source: Illustration provided by Makai Ocean Engineering, Inc. During submergence, an offshore tugboat provides tension to the pipeline to control bending of the pipe as it is submerged and to accurately place the pipeline in position.

DeepWater Desal 19 Response to CPUC May 1, 2013
The pipeline will be anchored in place with concrete saddles. The actual number and placement of the concrete saddles will be determined prior to deployment once site-specific studies relative to wave forces, currents, etc. are completed. Two pipeline routings and construction techniques are being evaluated to connect the offshore pipeline to the wet well (Figures 8 and 9).
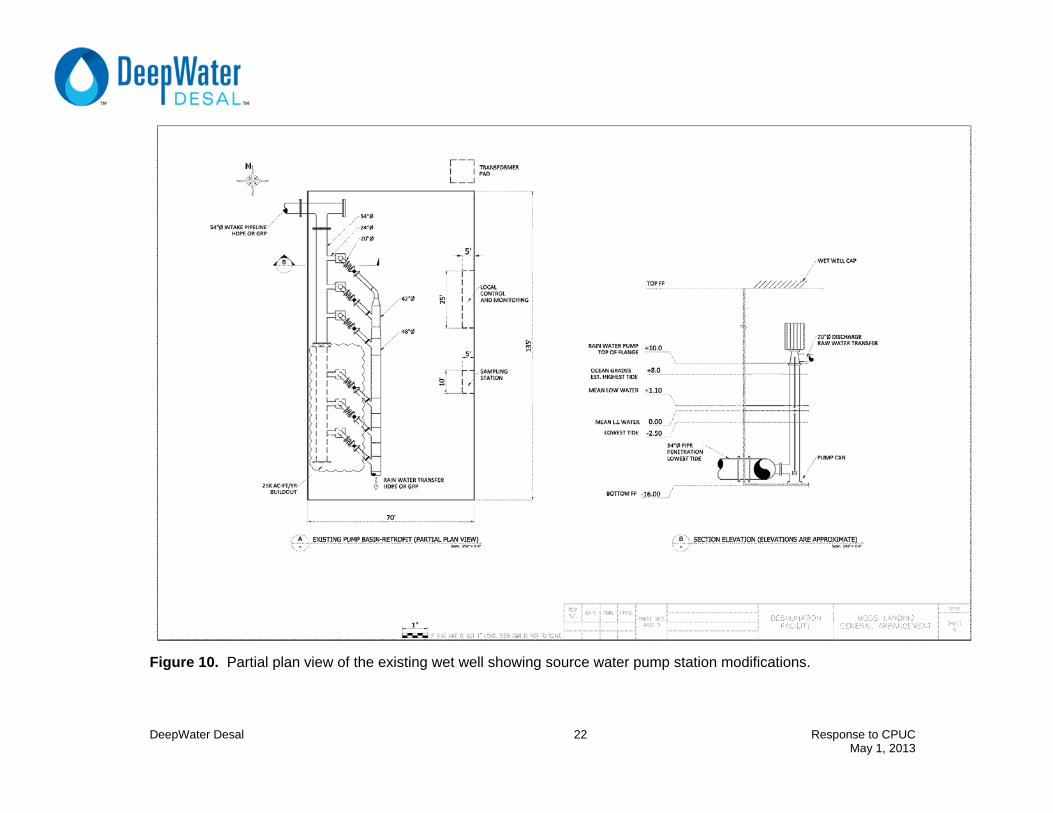
4.4 Onshore Wet Well and Pump Station The onshore source water pump station will be constructed in an existing wet well located at the MLPP, which is no longer in use (see Figure 10). No existing structures will be demolished or removed during construction or operation of the onshore wet well and pump station. The existing wet well will be rebuilt in place. The wet well depth is below sea level and is filled by gravity flow from the passive intake. The pump station will contain three high-service pumps (two operating and one stand-by) each with a rated capacity of 6,870 gpm and with a discharge pressure of 55 psig to forward the source water to the site for data center cooling and desalination. While the intake pipeline will be sized for the total build-out capacity of 25,000 AF/Y (22.3 MGD), the high service pumps will be installed in phases to accommodate the initial Phase 1 demand and the subsequent phased build-out requirements. The preliminary design details for the source water pump station are provided in Table 2.
Table 2. Source Water Intake Pump Station–Preliminary Design Details.

DeepWater Desal 20 Response to CPUC May 1, 2013
Figure 8. Intake pipe segment site plan showing construction methods (Alternative 1).

DeepWater Desal 21 Response to CPUC May 1, 2013
Figure 9. Intake pipe segment site plan showing construction methods (Alternative 2).
DeepWater Desal 22 Response to CPUC May 1, 2013
Figure 10. Partial plan view of the existing wet well showing source water pump station modifications.

DeepWater Desal 23 Response to CPUC May 1, 2013
4.5 Source Water Conveyance System The source water conveyance system includes piping and valves to transport source water from the pump station to the SWRO and data center facilities at the Phase 1 flow of 13,740 gpm. A 48-in. diameter pipe will be constructed from the pump station to the east side of Highway 1, south to Dolan Road and east on Dolan Road to the tank farm property, to convey the source water to the site (Figure 3). The pipe will be buried in a trench on easements provided by the Moss Landing Power Plant until the pipeline is routed north off of Dolan Road where it will be above ground on an existing pipe rack, except where the easement crosses the Granite Rock parcel and the pipe rack is below grade level.
4.6 Source Water Characterization Monitoring equipment was deployed in June 2012 at the approximate location and depth of the proposed intake to continuously monitor critically important water quality data for temperature, conductivity, and turbidity. Grab samples are collected approximately once every three months for full mineral analysis by an EPA certified lab. Ongoing source water characterization will continue through June 2013 to provide a 12-month set of data to enable assessment of seasonal variations, if any. These data are critically important to establish key criteria for the design of the pretreatment and reverse osmosis membrane systems. Accordingly, DWD has high confidence in the accuracy of key water quality parameters on which our designs are predicated. Because DWD has continuous access to source water for monitoring and assessment, the Project's design conditions are based on long-term data and not on assumptions.
4.7 SWRO Pretreatment System High quality, low turbidity source water supplied from the deep-water intake, will be pre-treated with reliable, cost effective granular media filtration, a robust and proven technology to protect the integrity and reliability of the SWRO membrane system. The pretreatment system will consist of single-stage, deep-bed, dual media granular media system with sufficient redundancy to ensure a reliable, sustainable supply to the downstream desalination process. Coagulant and filter aid polymer systems will be integrated to improve the efficiency of the pretreatment system during system operation, if required. The media filters are designed to utilize filtered seawater
DeepWater Desal 24 Response to CPUC May 1, 2013
as a source of backwash water or alternatively, RO concentrate. The filters will be fully automated and monitored to assure trouble-free operation.
4.8 Cartridge Guard Filters
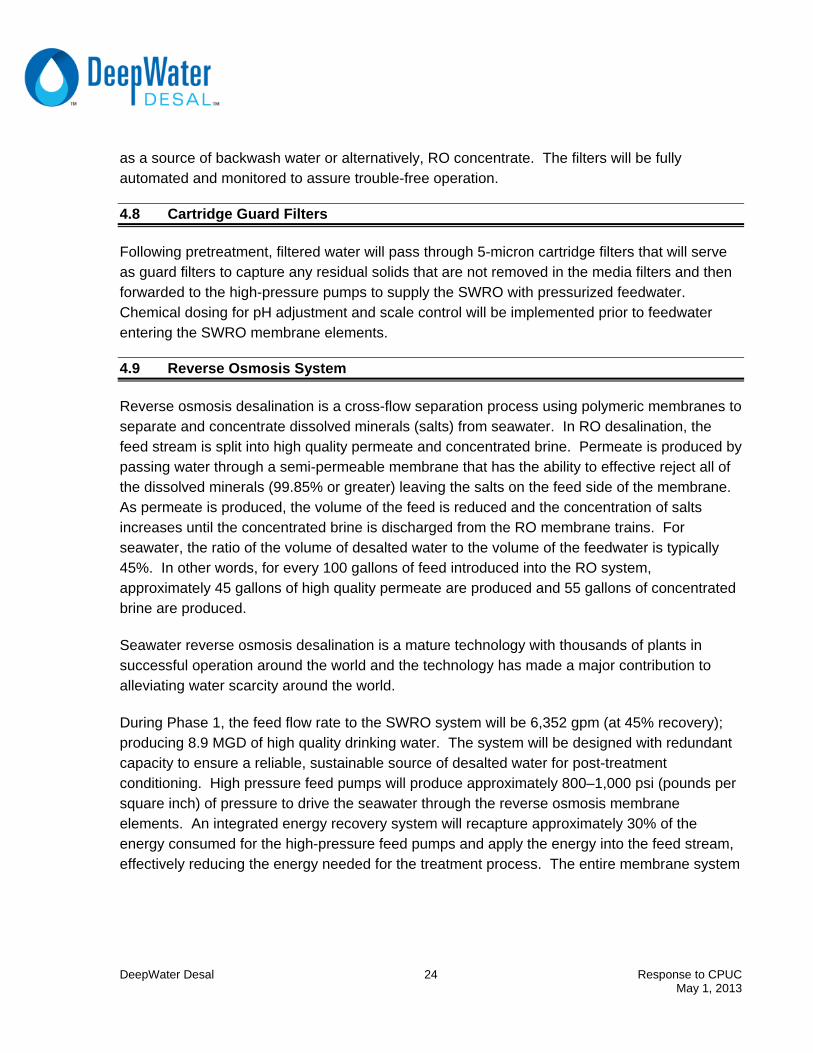
Following pretreatment, filtered water will pass through 5-micron cartridge filters that will serve as guard filters to capture any residual solids that are not removed in the media filters and then forwarded to the high-pressure pumps to supply the SWRO with pressurized feedwater. Chemical dosing for pH adjustment and scale control will be implemented prior to feedwater entering the SWRO membrane elements.
4.9 Reverse Osmosis System
Reverse osmosis desalination is a cross-flow separation process using polymeric membranes to separate and concentrate dissolved minerals (salts) from seawater. In RO desalination, the feed stream is split into high quality permeate and concentrated brine. Permeate is produced by passing water through a semi-permeable membrane that has the ability to effective reject all of the dissolved minerals (99.85% or greater) leaving the salts on the feed side of the membrane. As permeate is produced, the volume of the feed is reduced and the concentration of salts increases until the concentrated brine is discharged from the RO membrane trains. For seawater, the ratio of the volume of desalted water to the volume of the feedwater is typically 45%. In other words, for every 100 gallons of feed introduced into the RO system, approximately 45 gallons of high quality permeate are produced and 55 gallons of concentrated brine are produced. Seawater reverse osmosis desalination is a mature technology with thousands of plants in successful operation around the world and the technology has made a major contribution to alleviating water scarcity around the world. During Phase 1, the feed flow rate to the SWRO system will be 6,352 gpm (at 45% recovery); producing 8.9 MGD of high quality drinking water. The system will be designed with redundant capacity to ensure a reliable, sustainable source of desalted water for post-treatment conditioning. High pressure feed pumps will produce approximately 800–1,000 psi (pounds per square inch) of pressure to drive the seawater through the reverse osmosis membrane elements. An integrated energy recovery system will recapture approximately 30% of the energy consumed for the high-pressure feed pumps and apply the energy into the feed stream, effectively reducing the energy needed for the treatment process. The entire membrane system

DeepWater Desal 25 Response to CPUC May 1, 2013
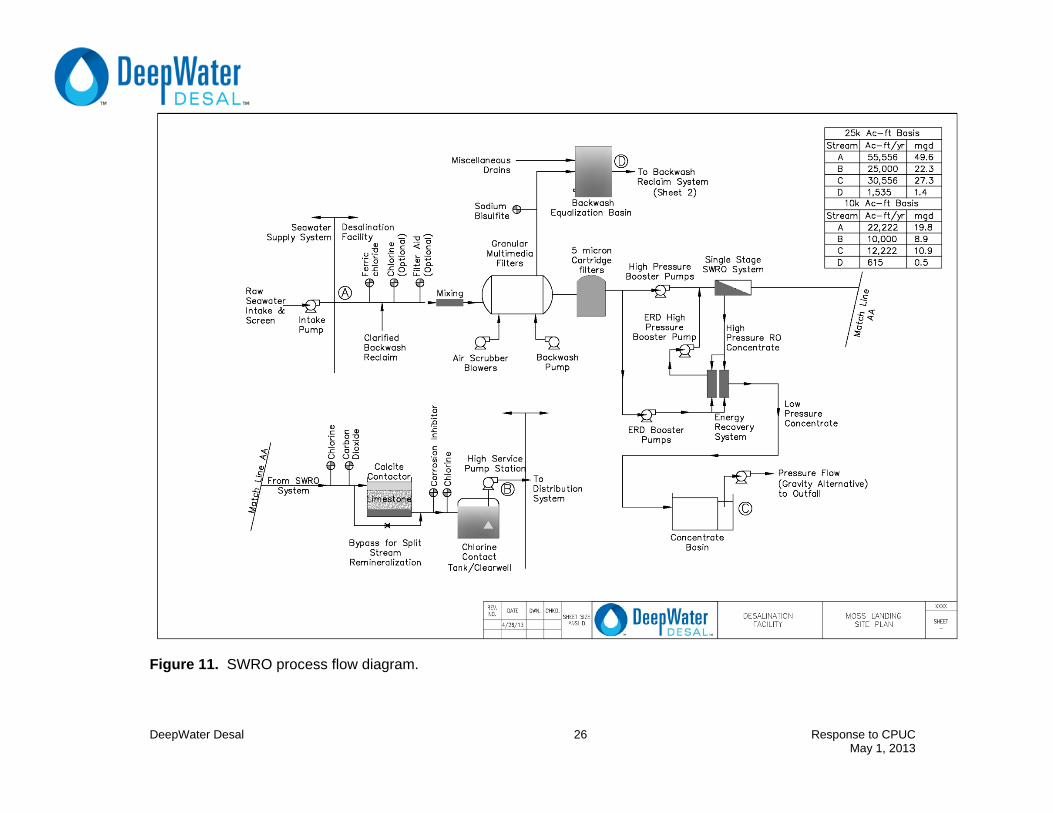
will be automated and continuously monitored using state-of-the-art sensors and computer control systems. Permeate produced by the SWRO will require post-treatment conditioning with lime and/or carbon dioxide for pH adjustment; followed by disinfection and treatment for corrosion control to protect the distribution pipeline. The plant will supply product water of a quality that fully complies with all regulatory requirements of the California Department of Public Health, the Safe Drinking Water Act, and the California Title 22 code for drinking water standards. Product water quality can be achieved to accommodate differing specifications required by different purchasers. The finished product water from the desalination plant will be compatible with the water quality of the other sources of potable water delivered to the same distribution system. Preliminary design details for the SWRO are shown in Table 3 and a process flow diagram is shown in Figure 11. The design projections for the SWRO are provided in Appendix B.
Table 3. SWRO System–Preliminary Design Details.
10,000 ac-ft/yr @ 8.9 mgd
25,000 ac-ft/yr @ 22.3 mgd
UNITS VALUE VALUE NOTES
SEAWATER REVERSE OSMOSIS SYSTEM
TYPE: ONE STAGE, 45% AVERAGE RECOVERY (43-47%) VARIABLE RECOVERY IS CONSERVATIVE AND MOST VERSATILE
PRETREATMENT CARTRIDGE FILTERS (INLINE) NO. 4 X 25% DUTY + 1 SPARE
10 X 10% DUTY + 1 SPARE
PRETREATMENT CARTRIDGE FILTER RATED FLOW (EACH) GPM 3,450 3,446 PRETREATMENT CARTRIDGE FILTER NOMINAL PORE SIZE MICRON 5-20 5-20
SWRO FEED PUMPS NO. 5 (4 DUTY; 1 STANDBY)
11 (10 DUTY; 1 STANDBY)
ALTERNATE - HIGH PRESSURE SWRO PUMP ISLAND WITH MUCH LARGER CAPACITY PUMPS (AND FEWER TOTAL REQUIRED)
SWRO FEED PUMP FLOW (EACH) GPM 1,588 1,588 MGD 2.3 2.3
SWRO FEED BHP (GROSS IN-SERVICE) HP 4,300 10,300 SWRO FEED PUMP PRESSURE PSIG 908 908 LOWEST TEMP, 3 YEAR, 10% SAFETY
SWRO MEMBRANE SKIDS NO. 5 (4 DUTY; 1 STANDBY)
11 (10 DUTY; 1 STANDBY) ONE COMPLETE STANDBY SKID
SWRO SKID PERMEATE DESIGN FLOW (EACH) GPM 1,550 1,550 MGD 2.2 2.2
AVERAGE FLUX AT DESIGN FLOW (1 UNIT OUT OF SERVICE GFD 9.2 9.2
SWRO 8‐INCH DIAMETER PRESSURE VESSELS (EACH SKID NO. 79; 395 79; 869INCLUDES SPARE SKID. 315:0 ARRAY MIN FOR 10k ac-ft and 788:0 ARRAY MIN FOR 25k ac-ft W/OUT SPARE
SWRO MEMBRANE ELEMENTS (EACH PRESSURE VESSEL) NO. 7 7SWRO MEMBRANE ELEMENTS SURFACE AREA (EACH) SF 440 440 OR EQUIVALENT
DESCRIPTION
DeepWater Desal 26 Response to CPUC May 1, 2013
Figure 11. SWRO process flow diagram.

DeepWater Desal 27 Response to CPUC May 1, 2013
4.10 Chemical Storage and Feed Facilities
Chemicals, safe and certified for use in drinking water treatment, will be used in the desalination process to optimize pretreatment filtration, ensure the correct water quality, and maintain the RO membrane elements in a clean condition; and also for stabilization and disinfection of the desalted water for distribution in a regulated potable water supply. The chemicals used will be delivered to the site in bulk quantities and stored in fully contained bulk storage tanks prior to being used in the process. All chemical storage, handling, and feed facilities will be designed, constructed, and maintained in compliance with all applicable governmental codes and regulations, OSHA requirements, and best practices to ensure safe storage and handling. Preliminary design details for permeate post treatment are provided in Table 4.
Table 4. Permeate Post Treatment–Preliminary Design Details.
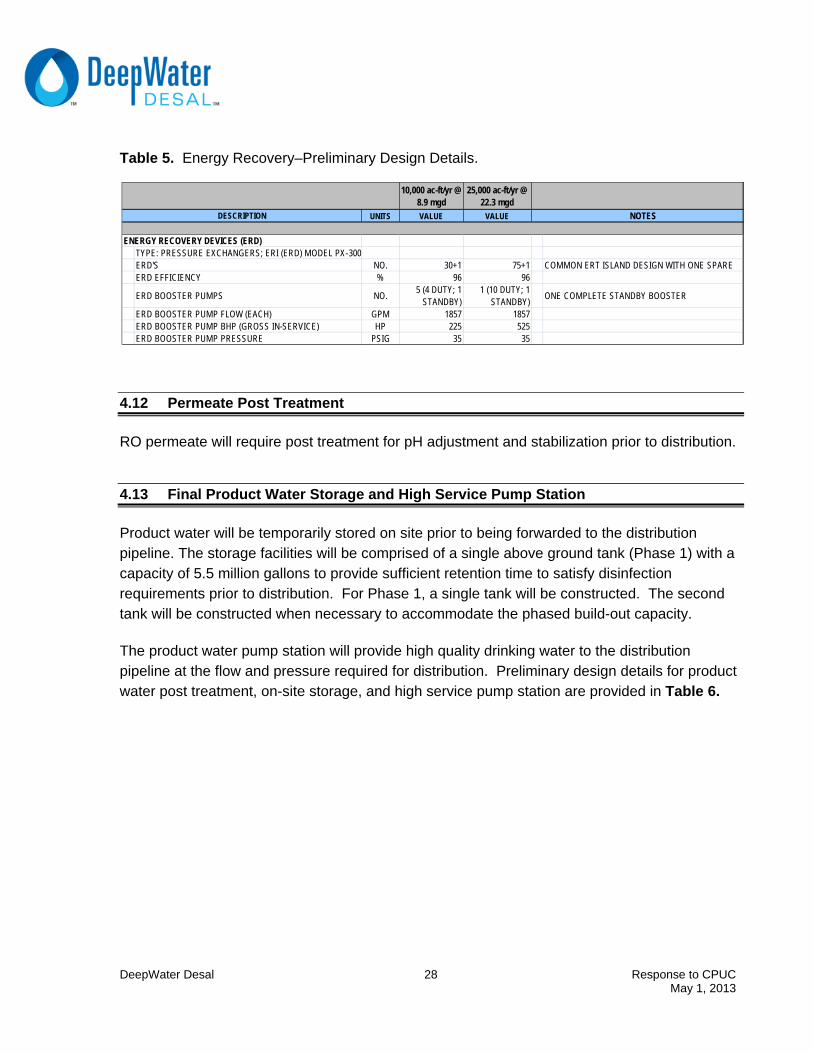
4.11 Energy Recovery Devices Pumped energy will be recovered from the RO system concentrate using pressure exchange type energy recovery devices. The integrated energy recovery system will recapture approximately 30% of the energy consumed by the high-pressure feed pumps and apply the energy into the feed stream, effectively reducing the energy needed for the treatment process. Please refer to the RO system design projections in Appendix B for additional information. Preliminary design details are provided in Table 5.
DeepWater Desal 28 Response to CPUC May 1, 2013
Table 5. Energy Recovery–Preliminary Design Details.
4.12 Permeate Post Treatment RO permeate will require post treatment for pH adjustment and stabilization prior to distribution.
4.13 Final Product Water Storage and High Service Pump Station Product water will be temporarily stored on site prior to being forwarded to the distribution pipeline. The storage facilities will be comprised of a single above ground tank (Phase 1) with a capacity of 5.5 million gallons to provide sufficient retention time to satisfy disinfection requirements prior to distribution. For Phase 1, a single tank will be constructed. The second tank will be constructed when necessary to accommodate the phased build-out capacity. The product water pump station will provide high quality drinking water to the distribution pipeline at the flow and pressure required for distribution. Preliminary design details for product water post treatment, on-site storage, and high service pump station are provided in Table 6.
10,000 ac-ft/yr @ 8.9 mgd
25,000 ac-ft/yr @ 22.3 mgd
UNITS VALUE VALUE NOTES
ENERGY RECOVERY DEVICES (ERD)TYPE: PRESSURE EXCHANGERS; ERI (ERD) MODEL PX‐300ERD'S NO. 30+1 75+1 COMMON ERT ISLAND DESIGN WITH ONE SPAREERD EFFICIENCY % 96 96
ERD BOOSTER PUMPS NO. 5 (4 DUTY; 1 STANDBY)
1 (10 DUTY; 1 STANDBY) ONE COMPLETE STANDBY BOOSTER
ERD BOOSTER PUMP FLOW (EACH) GPM 1857 1857ERD BOOSTER PUMP BHP (GROSS IN-SERVICE) HP 225 525ERD BOOSTER PUMP PRESSURE PSIG 35 35
DESCRIPTION

DeepWater Desal 29 Response to CPUC May 1, 2013
Table 6. Product Water Post Treatment, On-Site Storage, and High Service Pump Station– Preliminary Design Details.
Because the project is designed to support regional needs with multiple purchasers of water, DWD anticipates that each water purchaser will provide its transmission pipeline for connection at the plant site fence line. Therefore, the project does not include construction of conveyance pipelines at this time.
4.14 Waste Management
The desalination plant will generate waste streams consisting of concentrate from the SWRO process, sludge from media filter backwash, sanitary wastewater from bathrooms, spent membrane cleaning solution, solid waste, and surface runoff. The plant will be designed and constructed to handle all waste streams generated in an environmentally sound manner and in compliance with all applicable codes and regulatory requirements.
4.15 Filter Backwash Disposal
Filter backwash will be collected and discharged into the RO concentrate line, or alternatively treated on site via the solids handling system.
DeepWater Desal 30 Response to CPUC May 1, 2013
If filter backwash water is discharged to the concentrate return line, the flow will be regulated so that the suspended solids will mix with and be diluted by the particle free RO concentrate so that the total suspended solids (TSS) in the concentrate stream at the point of discharge will not exceed the TSS of the incoming source water and therefore will not exceed the turbidity of ambient seawater.
“Spent” or used cleaning chemicals will be collected and treated prior to discharge into the brine discharge line or alternatively in the solids handling system as later determined by applicable regulatory authority. Treatment will include pH neutralization. Residual surfactants, if any, will be of low concentration and small volume and it is not anticipated that any further treatment will be required prior to discharge. A flow diagram of backwash reclaim system is provided in Figure 12 and preliminary design details are provided in Table 7.

DeepWater Desal 31 Response to CPUC May 1, 2013
Figure 12. SWRO backwash reclaim system.

DeepWater Desal 32 Response to CPUC May 1, 2013
Table 7. Backwash Supply and Concentrate Discharge Basin–Preliminary Design Details.
4.16 Alternative On-Site Residual's Management System In the event that regulatory authorities will not permit disposal of waste residuals in the concentrate discharge, an on-site residuals management system will be provided to concentrate and dewater residual solids for disposal in a sanitary landfill and recycle the filtered water. Table 8 provides preliminary design details for the on-site residual waste management system, if required.
Table 8. On-site Residual Waste Management System–Preliminary Design Details.
4.17 Concentrate Disposal and Conveyance System
Concentrated brine will be generated by the reverse osmosis desalination process with a flow and composition as shown in Table 9.
DeepWater Desal 33 Response to CPUC May 1, 2013
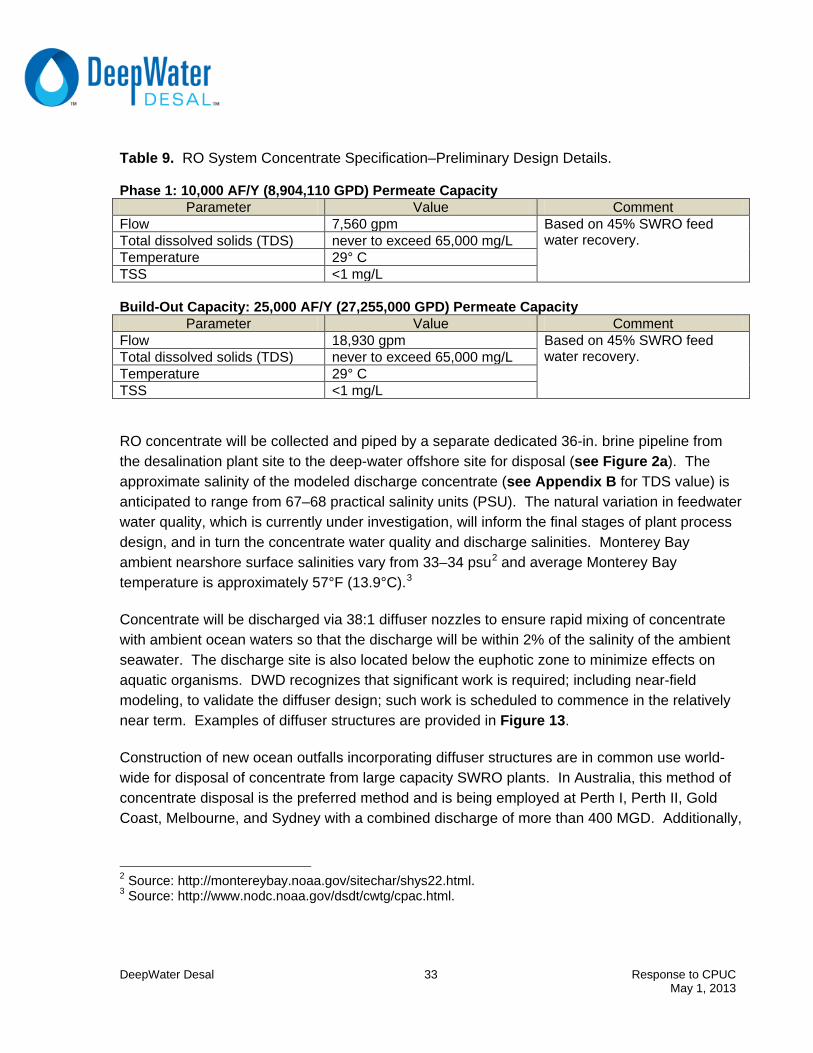
Table 9. RO System Concentrate Specification–Preliminary Design Details.
Phase 1: 10,000 AF/Y (8,904,110 GPD) Permeate Capacity Parameter Value Comment
Flow 7,560 gpm Based on 45% SWRO feed water recovery. Total dissolved solids (TDS) never to exceed 65,000 mg/L
Temperature 29° C TSS <1 mg/L Build-Out Capacity: 25,000 AF/Y (27,255,000 GPD) Permeate Capacity
Parameter Value Comment Flow 18,930 gpm Based on 45% SWRO feed
water recovery. Total dissolved solids (TDS) never to exceed 65,000 mg/L Temperature 29° C TSS <1 mg/L RO concentrate will be collected and piped by a separate dedicated 36-in. brine pipeline from the desalination plant site to the deep-water offshore site for disposal (see Figure 2a). The approximate salinity of the modeled discharge concentrate (see Appendix B for TDS value) is anticipated to range from 67–68 practical salinity units (PSU). The natural variation in feedwater water quality, which is currently under investigation, will inform the final stages of plant process design, and in turn the concentrate water quality and discharge salinities. Monterey Bay ambient nearshore surface salinities vary from 33–34 psu2 and average Monterey Bay temperature is approximately 57°F (13.9°C).3
Concentrate will be discharged via 38:1 diffuser nozzles to ensure rapid mixing of concentrate with ambient ocean waters so that the discharge will be within 2% of the salinity of the ambient seawater. The discharge site is also located below the euphotic zone to minimize effects on aquatic organisms. DWD recognizes that significant work is required; including near-field modeling, to validate the diffuser design; such work is scheduled to commence in the relatively near term. Examples of diffuser structures are provided in Figure 13. Construction of new ocean outfalls incorporating diffuser structures are in common use world-wide for disposal of concentrate from large capacity SWRO plants. In Australia, this method of concentrate disposal is the preferred method and is being employed at Perth I, Perth II, Gold Coast, Melbourne, and Sydney with a combined discharge of more than 400 MGD. Additionally,
2 Source: http://montereybay.noaa.gov/sitechar/shys22.html. 3 Source: http://www.nodc.noaa.gov/dsdt/cwtg/cpac.html.

DeepWater Desal 34 Response to CPUC May 1, 2013
many SWRO plants in Spain, the Caribbean, the Middle East, Africa, and South America use this method of concentrate disposal.
Figure 13. Examples of offshore diffusers.
Source: WaterReuse Association. 2011. Seawater Concentrate Management. White Paper.
DeepWater Desal 35 Response to CPUC May 1, 2013
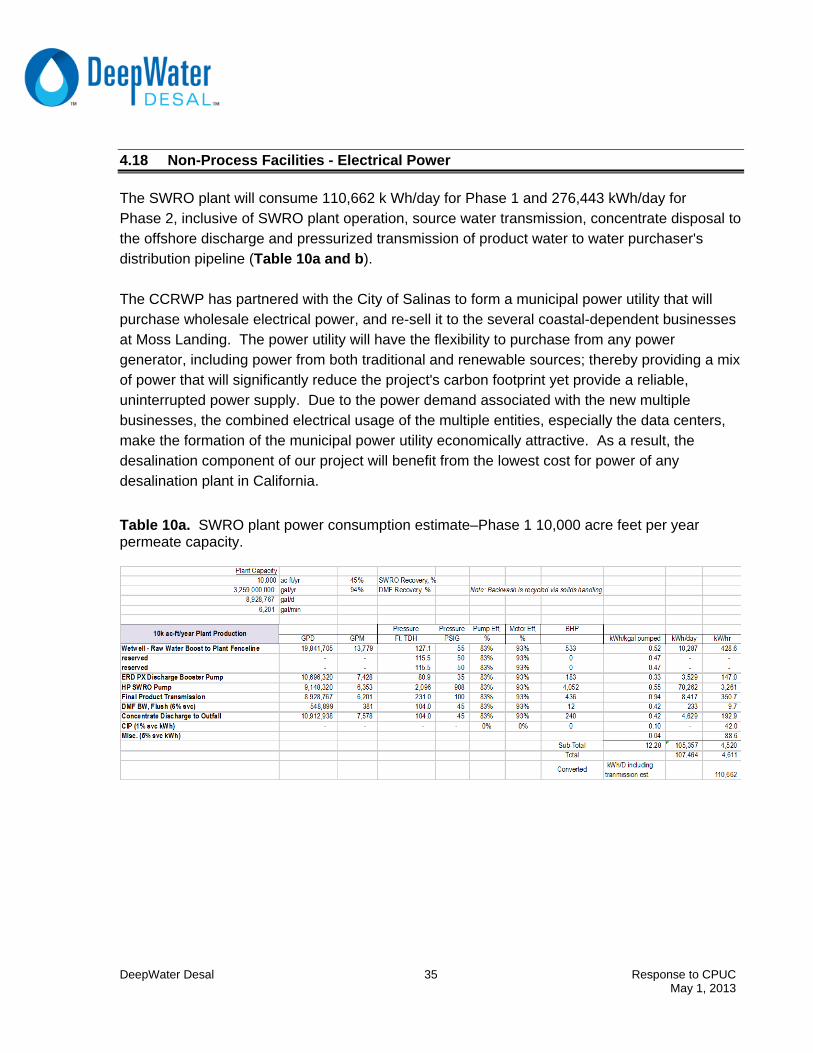
4.18 Non-Process Facilities - Electrical Power
The SWRO plant will consume 110,662 k Wh/day for Phase 1 and 276,443 kWh/day for Phase 2, inclusive of SWRO plant operation, source water transmission, concentrate disposal to the offshore discharge and pressurized transmission of product water to water purchaser's distribution pipeline (Table 10a and b). The CCRWP has partnered with the City of Salinas to form a municipal power utility that will purchase wholesale electrical power, and re-sell it to the several coastal-dependent businesses at Moss Landing. The power utility will have the flexibility to purchase from any power generator, including power from both traditional and renewable sources; thereby providing a mix of power that will significantly reduce the project's carbon footprint yet provide a reliable, uninterrupted power supply. Due to the power demand associated with the new multiple businesses, the combined electrical usage of the multiple entities, especially the data centers, make the formation of the municipal power utility economically attractive. As a result, the desalination component of our project will benefit from the lowest cost for power of any desalination plant in California.
Table 10a. SWRO plant power consumption estimate–Phase 1 10,000 acre feet per year permeate capacity.

DeepWater Desal 36 Response to CPUC May 1, 2013
Table 10b. SWRO plant power consumption estimate–Phase 2 (full build-out) 25,000 acre feet per year permeate capacity.
4.19 Facility Operation and Maintenance
The seawater desalination facility will be designed and constructed for continuous operation (24 hours per day and seven days per week) and will be adequately staffed to support continuous operations in accordance with California and Federal Law. The plant will be fully automated and will have operations and maintenance staff of approximately 12 full-time employees for Phase 1. Additionally, outside services will be required from electrical, equipment, and instrumentation contractors, and the service industry. 5.0 DATA CENTER The Project includes development of a data center campus that will benefit from low cost power and reduced electrical power consumption for cooling as a result of closed-loop cooling from cold seawater. The combined effect will result in the data center being one of the most efficient in the world and with a greatly reduced carbon footprint. The seawater cooling loop will have the added benefit of warming the cold seawater to reduce the power consumption required for reverse osmosis desalination. 6.0 USE OF CO-JOINED TECHNOLOGIES TO MINIMIZE CARBON FOOTPRINT By co-joining DeepWater Desal’s (DWD) technology with Data Center (DC) technology partners on site, the large stand-alone DC heat load normally discharged to the atmosphere will be efficiently captured and used to preheat the cool seawater intake prior to the final desalination

DeepWater Desal 37 Response to CPUC May 1, 2013
SWRO process. The reduction in co-joined baseline energy will result in a World Class CO2 negative footprint when compared to current best in class, stand-alone SWRO and DC installations now in place. This connection concept, with control system theory, has been patented by DWD and licensed to CCRWP for deployment on the Moss Landing site. The concept of using deep source water cooling, below the euphotic zone, has been proven at multiple locations worldwide. Recent relevant examples being the Deep Lake Water Cooling Project, Toronto, Ontario, Canada, the Cornell Lake Source Cooling Project at Lake Cayuga New York, and most closely aligned, by Deepgreen Data Center AG near Lake Walensee Switzerland. All projects use cold freshwater sources for energy efficient cooling, but only in Deepgreen’s case study is the sole purpose for cooling a DC. An ocean water source cooled DC precedent has been built by Google at Hamina, Finland, however, Google keeps the critical technical data details confidential. Further, there are no known projects that co-join ocean source deep water-cooling for both the purposes of providing DC cooling and fulfilling a large region-wide need for potable water via desalination with requirements driven control systems in place to easily adjust to variations in environmental input. The information conveyed by Deepgreen to CCRWP validates the Moss Landing site thermodynamics. Deepgreen has an intake temperature of 6°C (42.8°F) and volume of 27.5K GPM to cool a 50 MW, 15,000 m2 DC providing 3 KW/m2-cooling capacity and output flow temperature at 23°C (73.4°F). Reserved intake flow is used to remix the lake discharge back to 17°C (62.6°F) as required by Swiss regulations for that lake. CCRWP’s optimal water feed temperature for SWRO energy efficiency is 29°C (84.2°F). The Monterey Canyon deep-water temperature varies over a known 12-hour upwelling cycle from 6°C (42.8°F) to 12°C (53.6°F) with a rough average of 9°C (48.2°F). As CCRWP Phase 1 intake volume is 36.2K GPM for desalination, which exceeds the 27.5K GPM planned at Deepgreen DC cooling “as closest comparison”, which implies validation of the CCRWP model. As CCRWP’s desired delta temperature is 6°C (10.8°F) higher out of the DC heat exchanger loop, through optimized heat exchanger design, the required GPM volume can be reduced; if more heat is required to meet optimal SWRO feed, it can be drawn from heat exchangers placed upon both the main seawater and DC feed pumps as well, further reducing flow requirements. Further, to compensate for the intake temperature fluctuations driven by the Monterey Canyon natural cycling, there will be a majority of constant flow pumps that are
DeepWater Desal 38 Response to CPUC May 1, 2013
augmented by a minimal number of variable speed pumps tied to a full active temperature control feedback loop, to ensure steady state system performance. Critical Notes:
1. There is no SWRO output capacity by combining the DC as the heat exchanger design will ensure no mixing of the seawater with the DC’s internal cooling water system.
2. The DC side of the project is expected to be online before the SWRO is functional, requiring
the water intake pipes to be in place and active. When the SWRO is ready to go online, the cross-connected control systems should then make full system activation seamless.
While the modeling boundary numbers submitted here are based upon a 50 MW DC, it easily scales to 150 MW. DC load scaling will further ease the site thermal load balancing through both enhanced active controls and a mix of other advanced DC technologies which are anticipated to be deployed, giving added “Green” benefits to the site. The energy consumed by a SWRO desalination plant sized for 25,000 AF/Y is approximately rated at 12–15 MW. The data center modules consume as much as 150 MW at full build-out. As a result of using a seawater cooling methodology, the power consumption will be reduced dramatically through a heat exchange module. Figure 14 shows total site demand for power by quarter measured in MW. Figure 15 indicates the savings realized in CO2 gas emissions using seawater cooling versus normal evaporative cooling measured in tons CO2 per quarter. A high level “co-joined active cooling” engineering concept is shown in Figure 16. The site layout supporting both SWRO and data centers is shown previously in Figure 4. For DC on-site employment numbers, it is anticipated that a 50 MW DC would employ 80 people for the main shift, with a 45–55 for the off shift in support of 24/7 operations. As the site DC capacity scales to 150 MW, the employee count does not scale in a linear way; for example, at 150 MW the 1st shift on-site personnel could rise to 200, but permanent (not visiting) employees being 150 and somewhat less on 2nd and 3rd shifts.

DeepWater Desal 39 Response to CPUC May 1, 2013
Figure 14. Total CCRWP energy consumption in megawatts per hour (MW/hr).

DeepWater Desal 40 Response to CPUC May 1, 2013
Figure 15. Comparison of tons of CO2 generated between normal evaporative cooling vs. and seawater cooling.

DeepWater Desal 41 Response to CPUC May 1, 2013
Figure 16. Example of a high level “co-joined active cooling” engineering concept.

DeepWater Desal 42 Response to CPUC May 1, 2013
7.0 ONGOING AND PROPOSED STUDIES DWD does not believe that pilot testing is technically required for our project and we do not anticipate conducting pilot testing. The source water is being comprehensively characterized as to its mineral composition, turbidity, and temperature and prior to construction we will have at least 12 months of data, including up to eight sets of full mineral analyses. Therefore, the source water specifications for the RO system design will be developed based on historical data that will account for any seasonal variations. Further, the intake location is completely isolated from contamination from storm water run-off or sanitary outfalls that might otherwise pose a risk of contamination from chemicals or other contaminants that are not present in normal seawater. Stable, high-quality (low turbidity) source water enables the use of conventional media filtration for pretreatment. Given that our project will be designed based on thoroughly characterized seawater using conventional media filtration for pretreatment there is no technical reason to conduct pilot testing. Marine biological sampling designed to assess impacts to larval fishes and macroinvertebrates began in March 2012 and will be completed in June 2013. Data collected during source water sampling from September 1999–May 2000 as part of the MLPP 316(b) study were reanalyzed by Tenera Environmental for DeepWater Desal. The purpose of the assessment was to examine the potential impacts of operating a desalination feedwater intake in Monterey Bay. The report, Preliminary Modeling of Potential Impacts from Operation of a Desalination Facility Ocean Intake, dated August 22, 2012 was provided to the Monterey Bay National Marine Sanctuary and informally reviewed with the California Coastal Commission, the State Lands Commission, and other jurisdictions within Monterey County. A copy of the report is found in Appendix C. Terrestrial plant surveys of the project area were conducted by Denise Duffy and Associates in April 2013. Results of spring surveys are anticipated in May 2013. Additional summer surveys are planned. Cultural resources surveys, geotechnical investigations, power demand estimates, and traffic impact, noise impact, aesthetic impact, and air quality impact analyses will be conducted. 8.0 PROJECT SCHEDULE A copy of DWD’s project schedule is found in Figure 17.
DeepWater Desal 43 Response to CPUC May 1, 2013
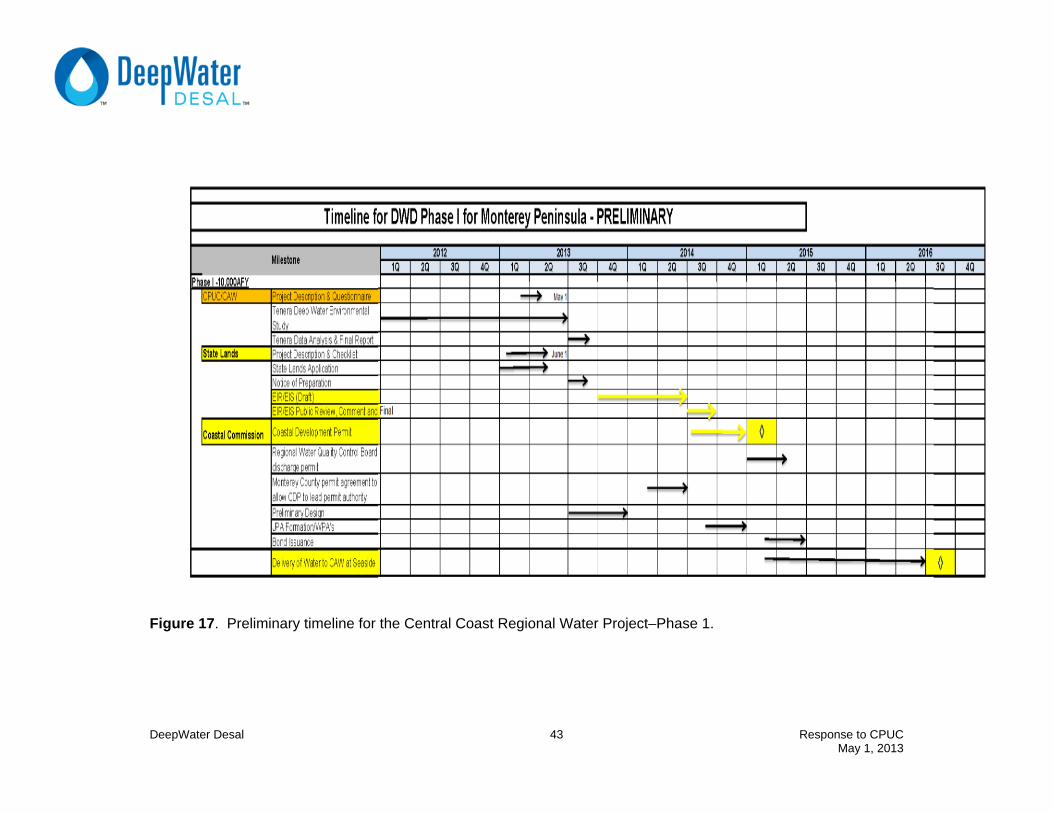
Figure 17. Preliminary timeline for the Central Coast Regional Water Project–Phase 1.
DeepWater Desal 44 Response to CPUC May 1, 2013
9.0 REGULATORY INFORMATION
9.1 Lead Agencies The California State Lands Commission is the Lead Agency for the CCRWP. The NEPA lead agency will be selected after the SLC application and project description are submitted to the SLC. DWD will seek input from SLC to identify the NEPA lead agency.
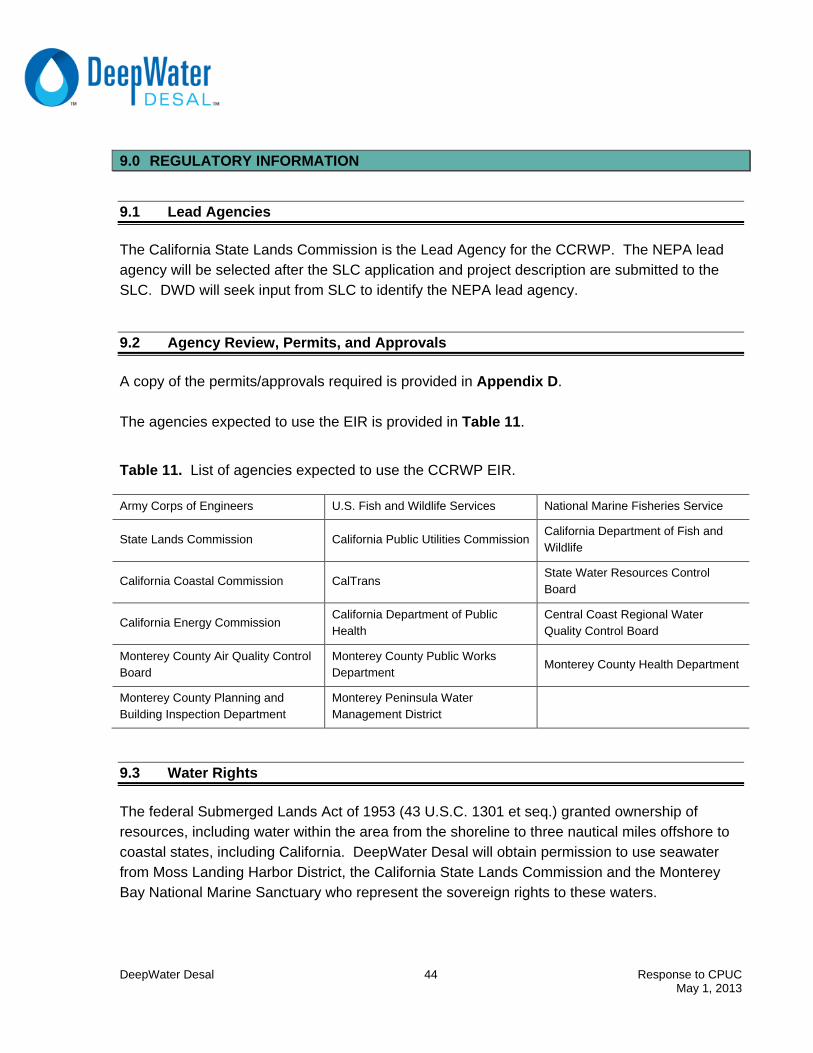
9.2 Agency Review, Permits, and Approvals A copy of the permits/approvals required is provided in Appendix D. The agencies expected to use the EIR is provided in Table 11.
Table 11. List of agencies expected to use the CCRWP EIR.
Army Corps of Engineers U.S. Fish and Wildlife Services National Marine Fisheries Service
State Lands Commission California Public Utilities Commission California Department of Fish and Wildlife
California Coastal Commission CalTrans State Water Resources Control Board
California Energy Commission California Department of Public Health
Central Coast Regional Water Quality Control Board
Monterey County Air Quality Control Board
Monterey County Public Works Department
Monterey County Health Department
Monterey County Planning and Building Inspection Department
Monterey Peninsula Water Management District
9.3 Water Rights The federal Submerged Lands Act of 1953 (43 U.S.C. 1301 et seq.) granted ownership of resources, including water within the area from the shoreline to three nautical miles offshore to coastal states, including California. DeepWater Desal will obtain permission to use seawater from Moss Landing Harbor District, the California State Lands Commission and the Monterey Bay National Marine Sanctuary who represent the sovereign rights to these waters.

DeepWater Desal 45 Response to CPUC May 1, 2013
9.4 Policy Considerations California Coastal Act sections 30230 and 30231 are intended to protect marine life and water quality. As required by these sections of the Coastal Act, the California Coastal Commission will focus much of its attention concerning this project on the issue of entrainment and impingement of marine organisms as well as the effect of brine discharge from the desalination plant on the marine environment. Consistent with the California Coastal Act and the National Oceanic and Atmospheric Administration Guidelines for desalination plants, the DeepWater Desal project has been designed to minimize impingement and entrainment impacts on marine organisms. Likewise, DeepWater Desal will employ measures to minimize the impact of brine discharge from the desalination plant by discharging brine through diffusers at a depth calculated to minimize impacts on marine organisms. Intake and discharge lines for the desalination plant will be located within the Monterey Bay National Marine Sanctuary, the largest of 13 sanctuaries administered by the National Oceanic and Atmospheric Administration. Two of the MBNMS's regulations will affect the DeepWater Desal project. The first regulation, along with State law, will require permission from the Central Coast Regional Water Quality Control Board to discharge brine concentrate from the desalination plant into Monterey Bay. The second regulation, along with State law, will require permission from the California Coastal Commission to install intake and discharge pipelines on or under the seafloor. The sizing of the DeepWater Desal desalination plant is consistent with NOAA policies encouraging a regional approach to desalination facilities. Finally, DeepWater Desal’s proposal to place its seawater intake line and discharge lines in an easement presently occupied by an oil intake line and ship anchorage formerly used to supply fuel oil to the Moss Landing Power Plant will minimize the impact to the seafloor by locating these new pipelines in previously developed seafloor areas. 10.0 OWNERSHIP DeepWater Desal proposes that the desalination plant be owned by a public entity or a publically regulated utility company and operated under the auspices of such owner in compliance with Section 10.72.030.B of the Monterey County Code.