project connect central texas high-capacity …€¦ · project connect central texas high-capacity...
TRANSCRIPT
PROJECT CONNECTCentral Texas High-Capacity
Transit System PlanExecutive Summary
PREPARED FOR:
Capital Area Metropolitan Planning OrganizationCapital Metropolitan Transportation Authority
City of AustinLone Star Rail District
PREPARED By:URS Corporation
In AssOcIAtIOn WIth:Knudson, LP
RifelineCambridge Systematics, Inc.

i
PROJECT CONNECTCentral Texas High-Capacity
Transit System Plan
Executive Summary
PREPARED FOR:
Capital Area Metropolitan Planning OrganizationCapital Metropolitan Transportation Authority
City of AustinLone Star Rail District
PREPARED By:URS Corporation
In AssOcIAtIOn WIth:Knudson, LP
RifelineCambridge Systematics, Inc.
ii
TRaNSiT WORkiNg gROuP
Lee Leffingwell, Mayor, City of Austin (TWG Chair)
John Langmore, Board Vice Chair, Capital Metro (TWG Vice Chair)
Alan McGraw, Mayor, City of Round Rock
Willie Piña, County Commissioner, Bastrop County
Bill Spelman, Council Member, City of Austin
Sarah Eckhardt (replaced by Bruce Todd), County Commissioner,
Travis County
Will Conley, County Commissioner, Hays County
Martha Smiley, Austin Area Research Organization
Sid Covington, Chair, Lone Star Rail District
Aundre Dukes, Portfolio Manager, Texas Facilities Commission
Scott Flack, President, Real Estate Council of Austin
Jesus Garza, Executive Vice President and COO, Seton Family of
Hospitals
Bobby Jenkins, Board Chair, Greater Austin Chamber of Commerce
Johnny Limon, Board Member, Housing Works Austin; Chair, City of
Austin Community Development Commission
Barry McBee, Vice Chancellor, University of Texas
Darrell Pierce, CEO, Snap Management Group
Tom Stacy, Downtown Austin Alliance
CaPiTal METROPOliTaN TRaNSPORTaTiON auTHORiTy
Board of Directors
Mike Martinez, Chair
John Langmore, Vice Chair
Frank Fernandez, Secretary
Norm Chafetz
Chris Riley
Beverly Silas
Ann Stafford
David Siebold
Leadership
Linda Watson, President/CEO
Elaine Timbes, Vice President/COO
CiTy Of auSTiN
City Council
Lee Leffingwell, Mayor
Sheryl Cole, Mayor Pro Tem, Council Member Place 6
Chris Riley, Council Member Place 1
Mike Martinez, Council Member Place 2
Kathie Tovo, Council Member Place 3
Laura Morrison, Council Member Place 4
Bill Spelman, Council Member Place 5
Leadership
Lee Leffingwell, Mayor
Marc Ott, City Manager
Robert Goode, Assistant City Manager
iii
lONE STaR Rail DiSTRiCT
Board of Directors
Sid Covington, Chair, Austin Business Community
Tullos Wells, General Public Representative for San
Antonio, Vice Chair
Sheryl Cole, Mayor Pro Tem, City of Austin
Council Member Patty Eason, City of Georgetown
Council Member Sandy Nolte, City of New Braunfels
Council Member Carlton Soules, City of San Antonio
Carroll Schubert, San Antonio Business Community
Council Member Kim Porterfield, City of San Marcos
Council Member George Antuna, Jr., City of Schertz
Executive Director Dean Danos, AACOG Alamo
Regional Transit (ART)
Commissioner Debbie Ingalsbe, Capital Area Rural
Transportation System (CARTS), Hays County
Board Member John Langmore, Capital Metropolitan
Transportation Authority
Board Member Mary Briseño, VIA Metropolitan Transit
Commissioner Tommy Adkisson, Bexar County
Commissioner Will Conley, Hays County
Commissioner Bruce Todd, Travis County
Judge Dan A. Gattis, Williamson County
Council Member Bill Spelman, City of Austin, Capital
Area MPO (CAMPO)
Council Member Ray Lopez, City of San Antonio, San
Antonio-Bexar County MPO
Mariano Camarillo, General Public Representative for
Austin
Leadership
Ross Milloy, Executive Director
PROJECT CONNECT TEaM
Capital Area Metropolitan Planning Organization
Maureen McCoy
Capital Metropolitan Transportation Authority
Todd Hemingson
City of Austin
Robert Spillar
Lone Star Rail District
Joe Black
URS Corporation
Diane Cowin
Knudson, LP
Joe Lessard
Rifeline
Lynda Rife
Cambridge Systematics, Inc.
Jim Brogan

iv
v
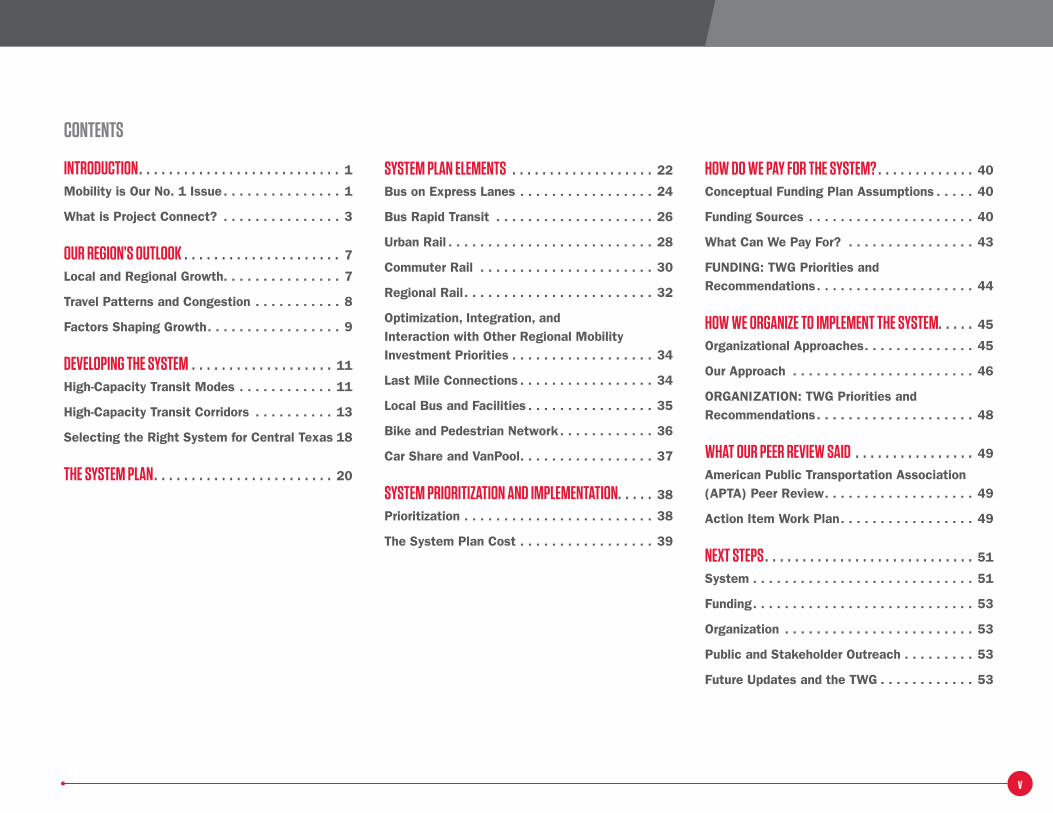
CONTENTS
iNTRODuCTiON 1
Mobility is Our No. 1 Issue . . . . . . . . . . . . . . . 1
What is Project Connect? . . . . . . . . . . . . . . . 3
OuR REgiON’S OuTlOOk 7
Local and Regional Growth. . . . . . . . . . . . . . . 7
Travel Patterns and Congestion . . . . . . . . . . . 8
Factors Shaping Growth . . . . . . . . . . . . . . . . . 9
DEvElOPiNg THE SySTEM 11
High-Capacity Transit Modes . . . . . . . . . . . . 11
High-Capacity Transit Corridors . . . . . . . . . . 13
Selecting the Right System for Central Texas 18
THE SySTEM PlaN 20
SySTEM PlaN ElEMENTS 22
Bus on Express Lanes . . . . . . . . . . . . . . . . . 24
Bus Rapid Transit . . . . . . . . . . . . . . . . . . . . 26
Urban Rail . . . . . . . . . . . . . . . . . . . . . . . . . . 28
Commuter Rail . . . . . . . . . . . . . . . . . . . . . . 30
Regional Rail . . . . . . . . . . . . . . . . . . . . . . . . 32
Optimization, Integration, and Interaction with Other Regional Mobility Investment Priorities . . . . . . . . . . . . . . . . . . 34
Last Mile Connections . . . . . . . . . . . . . . . . . 34
Local Bus and Facilities . . . . . . . . . . . . . . . . 35
Bike and Pedestrian Network . . . . . . . . . . . . 36
Car Share and VanPool . . . . . . . . . . . . . . . . . 37
SySTEM PRiORiTizaTiON aND iMPlEMENTaTiON 38
Prioritization . . . . . . . . . . . . . . . . . . . . . . . . 38
The System Plan Cost . . . . . . . . . . . . . . . . . 39
HOW DO WE Pay fOR THE SySTEM? 40
Conceptual Funding Plan Assumptions . . . . . 40
Funding Sources . . . . . . . . . . . . . . . . . . . . . 40
What Can We Pay For? . . . . . . . . . . . . . . . . 43
FUNDING: TWG Priorities and Recommendations . . . . . . . . . . . . . . . . . . . . 44
HOW WE ORgaNizE TO iMPlEMENT THE SySTEM 45
Organizational Approaches . . . . . . . . . . . . . . 45
Our Approach . . . . . . . . . . . . . . . . . . . . . . . 46
ORGANIZATION: TWG Priorities and Recommendations . . . . . . . . . . . . . . . . . . . . 48
WHaT OuR PEER REviEW SaiD 49
American Public Transportation Association (APTA) Peer Review . . . . . . . . . . . . . . . . . . . 49
Action Item Work Plan . . . . . . . . . . . . . . . . . 49
NExT STEPS 51
System . . . . . . . . . . . . . . . . . . . . . . . . . . . . 51
Funding . . . . . . . . . . . . . . . . . . . . . . . . . . . . 53
Organization . . . . . . . . . . . . . . . . . . . . . . . . 53
Public and Stakeholder Outreach . . . . . . . . . 53
Future Updates and the TWG . . . . . . . . . . . . 53
“ ““ “
““vi
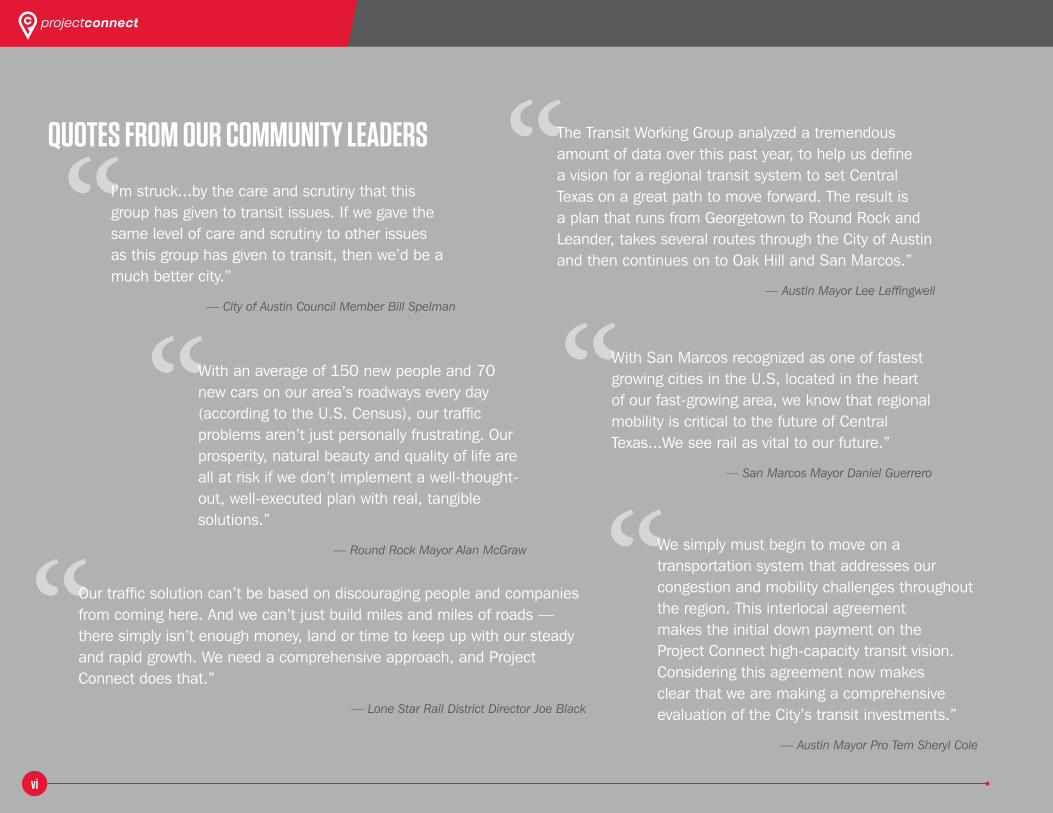
QuOTES fROM OuR COMMuNiTy lEaDERS
I’m struck...by the care and scrutiny that this group has given to transit issues. If we gave the same level of care and scrutiny to other issues as this group has given to transit, then we’d be a much better city.”
— City of Austin Council Member Bill Spelman
Our traffic solution can’t be based on discouraging people and companies from coming here. And we can’t just build miles and miles of roads — there simply isn’t enough money, land or time to keep up with our steady and rapid growth. We need a comprehensive approach, and Project connect does that.”
— Lone Star Rail District Director Joe Black
the transit Working Group analyzed a tremendous amount of data over this past year, to help us define a vision for a regional transit system to set central texas on a great path to move forward. the result is a plan that runs from Georgetown to Round Rock and Leander, takes several routes through the city of Austin and then continues on to Oak hill and san Marcos.”
— Austin Mayor Lee Leffingwell
With an average of 150 new people and 70 new cars on our area’s roadways every day (according to the U.s. census), our traffic problems aren’t just personally frustrating. Our prosperity, natural beauty and quality of life are all at risk if we don’t implement a well-thought-out, well-executed plan with real, tangible solutions.”
— Round Rock Mayor Alan McGraw
With san Marcos recognized as one of fastest growing cities in the U.s, located in the heart of our fast-growing area, we know that regional mobility is critical to the future of central texas...We see rail as vital to our future.”
— San Marcos Mayor Daniel Guerrero
We simply must begin to move on a transportation system that addresses our congestion and mobility challenges throughout the region. this interlocal agreement makes the initial down payment on the Project connect high-capacity transit vision. considering this agreement now makes clear that we are making a comprehensive evaluation of the city’s transit investments.”
— Austin Mayor Pro Tem Sheryl Cole
1
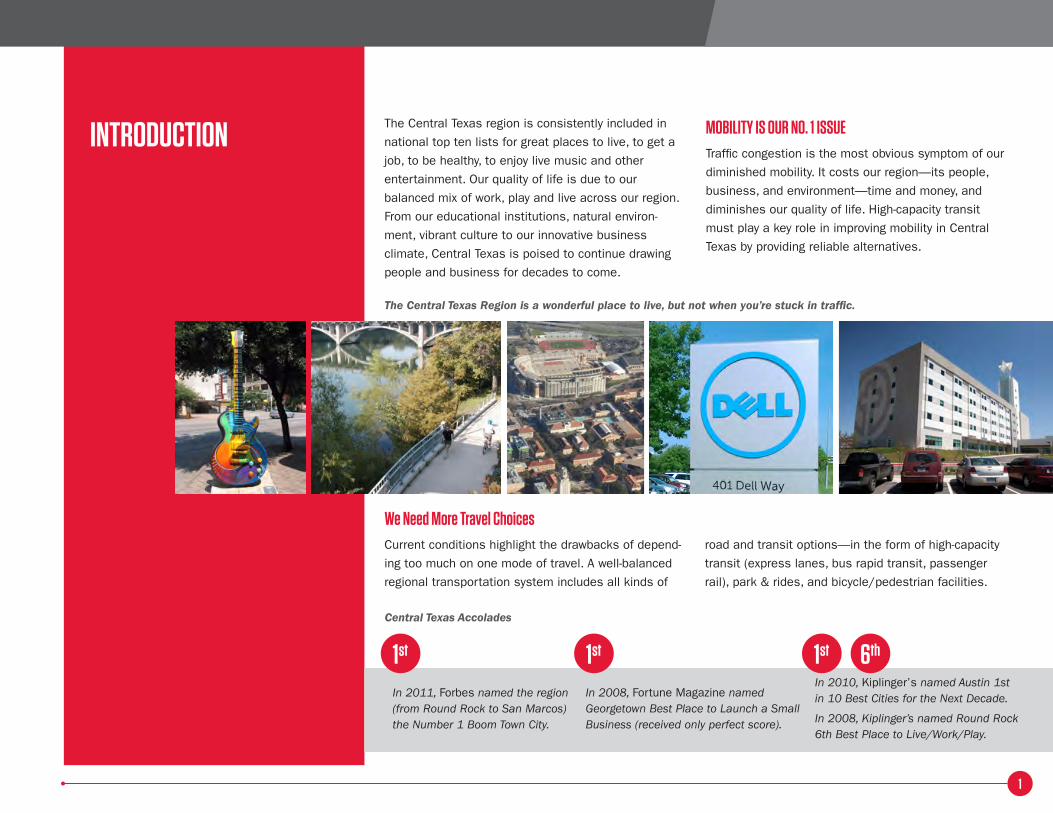
iNTRODuCTiONThe Central Texas region is consistently included in
national top ten lists for great places to live, to get a
job, to be healthy, to enjoy live music and other
entertainment. Our quality of life is due to our
balanced mix of work, play and live across our region.
From our educational institutions, natural environ-
ment, vibrant culture to our innovative business
climate, Central Texas is poised to continue drawing
people and business for decades to come.
MObiliTy iS OuR NO 1 iSSuETraffic congestion is the most obvious symptom of our
diminished mobility. It costs our region—its people,
business, and environment—time and money, and
diminishes our quality of life. High-capacity transit
must play a key role in improving mobility in Central
Texas by providing reliable alternatives.
Central Texas Accolades
In 2008, Fortune Magazine named Georgetown Best Place to Launch a Small Business (received only perfect score).
In 2010, Kiplinger’s named Austin 1st in 10 Best Cities for the Next Decade.
In 2008, Kiplinger’s named Round Rock 6th Best Place to Live/Work/Play.
In 2011, Forbes named the region (from Round Rock to San Marcos) the Number 1 Boom Town City.
The Central Texas Region is a wonderful place to live, but not when you’re stuck in traffic.
We Need More Travel ChoicesCurrent conditions highlight the drawbacks of depend-
ing too much on one mode of travel. A well-balanced
regional transportation system includes all kinds of
road and transit options—in the form of high-capacity
transit (express lanes, bus rapid transit, passenger
rail), park & rides, and bicycle/pedestrian facilities.
1st 1st 1st 6th
2
The Transportation-business linkRetention of existing regional employers is key to our
sustained success as a region, but we also need to
attract new companies to support the surge of people
relocating to our region. A survey conducted by the
Austin Chamber found that 68% of existing companies
in the region cite transportation or access to transit
as a concern. Important relocation criteria for cor-
porations include ample workforce connections and
evidence that cities are doing everything possible to
address congestion. With transportation of concern
to our existing companies and workforce and with ad-
ditional companies moving or expanding in our region
yearly, a focus on transportation is a must.
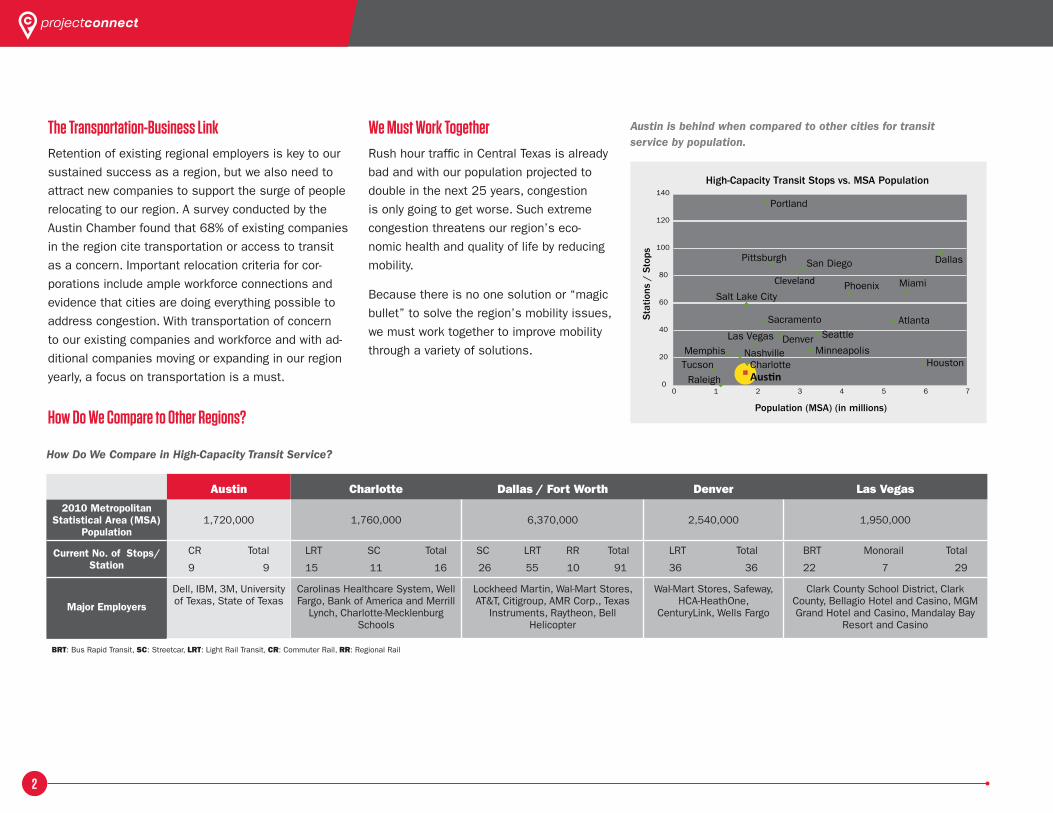
How Do We Compare to Other Regions?
We Must Work TogetherRush hour traffic in Central Texas is already
bad and with our population projected to
double in the next 25 years, congestion
is only going to get worse. Such extreme
congestion threatens our region’s eco-
nomic health and quality of life by reducing
mobility.
Because there is no one solution or “magic
bullet” to solve the region’s mobility issues,
we must work together to improve mobility
through a variety of solutions.
0
20
40
60
80
100
120
140
0 1 2 3 4 5 6 7
Stat
ions
/ S
tops
Population (MSA) (in millions)
High-Capacity Transit Stops vs. MSA Population
Charlotte Houston
Atlanta
Austin
Portland
San DiegoPittsburgh
Cleveland Miami
Dallas
PhoenixSalt Lake City
Sacramento
Denver Seattle
MinneapolisLas Vegas
Memphis NashvilleTucson
Raleigh
Austin is behind when compared to other cities for transit service by population.
Austin Charlotte Dallas / Fort Worth Denver Las Vegas
2010 Metropolitan Statistical Area (MSA)
Population1,720,000 1,760,000 6,370,000 2,540,000 1,950,000
Current No. of Stops/Station
CR Total
9 9
LRT SC Total
15 11 16
SC LRT RR Total
26 55 10 91
LRT Total
36 36
BRT Monorail Total
22 7 29
Major Employers
Dell, IBM, 3M, University of Texas, State of Texas
Carolinas Healthcare System, Well Fargo, Bank of America and Merrill
Lynch, Charlotte-Mecklenburg Schools
Lockheed Martin, Wal-Mart Stores, AT&T, Citigroup, AMR Corp., Texas
Instruments, Raytheon, Bell Helicopter
Wal-Mart Stores, Safeway, HCA-HeathOne,
CenturyLink, Wells Fargo
Clark County School District, Clark County, Bellagio Hotel and Casino, MGM Grand Hotel and Casino, Mandalay Bay
Resort and Casino
BRT: Bus Rapid Transit, SC: Streetcar, LRT: Light Rail Transit, CR: Commuter Rail, RR: Regional Rail
How Do We Compare in High-Capacity Transit Service?
3
WHaT iS PROJECT CONNECT?Project Connect was developed by the project partners
in the Central Texas region to coordinate transporta-
tion options for our growing community.
The Project Connect High-Capacity Transit System
Plan provides a solid framework for moving forward
with high-capacity transit in Central Texas, with the
goal of including the fiscally constrained portions of
the Project Connect System Plan in the Capital Area
Metropolitan Planning Organization’s 2040 Regional
Transportation Plan (CAMPO 2040) and implementing
the components of the plan when fiscally feasible.
Project Connect development was guided by the
Transit Working Group (TWG), which has served as the
project Policy Advisory Group since November 2011.
What are the goals of Project Connect?The purpose of Project Connect was to work with re-
gional stakeholders and the community to define the
first comprehensive high-capacity transit system for
Central Texas. Project Connect is designed to answer
the following three questions:
■ System: How will high-capacity transit
components in the CAMPO 2035 Plan and
subsequent 2040 Plan work as a system?
■ Funding: How will we pay for the system over the
long term?
■ Organization: How will our region organize to
develop and operate the system?
Planning ProcessProject Connect was focused on answering the three
questions on system, organization and funding, with
collaboration and input from the public, TWG and
regional stakeholders. The project team began by
analyzing the existing and projected travel conditions
in the major corridors and evaluating transportation
alternatives that would address the needs of those
corridors. In the next step, conceptual organizational
and financial models were developed. The third step
involved proposing organizational and financial models
tailored to Central Texas. Each step was accompanied
by public and stakeholder involvement.
Central Texans agree that a high-capacity transit system plan is needed for the region…
■ Traffic congestion in Central Texas is a
serious problem and must be addressed
(97% strongly agree or agree).
■ Because of Central Texas’s growth and
constraints to expanding highways,
alternative transportation options should be
explored (81% strongly agree or agree).
■ High-capacity transit can be an effective
part of the solution for improving mobility in
Central Texas (83% strongly agree or agree).
– Project Connect surveys
iNTRODuCTiON
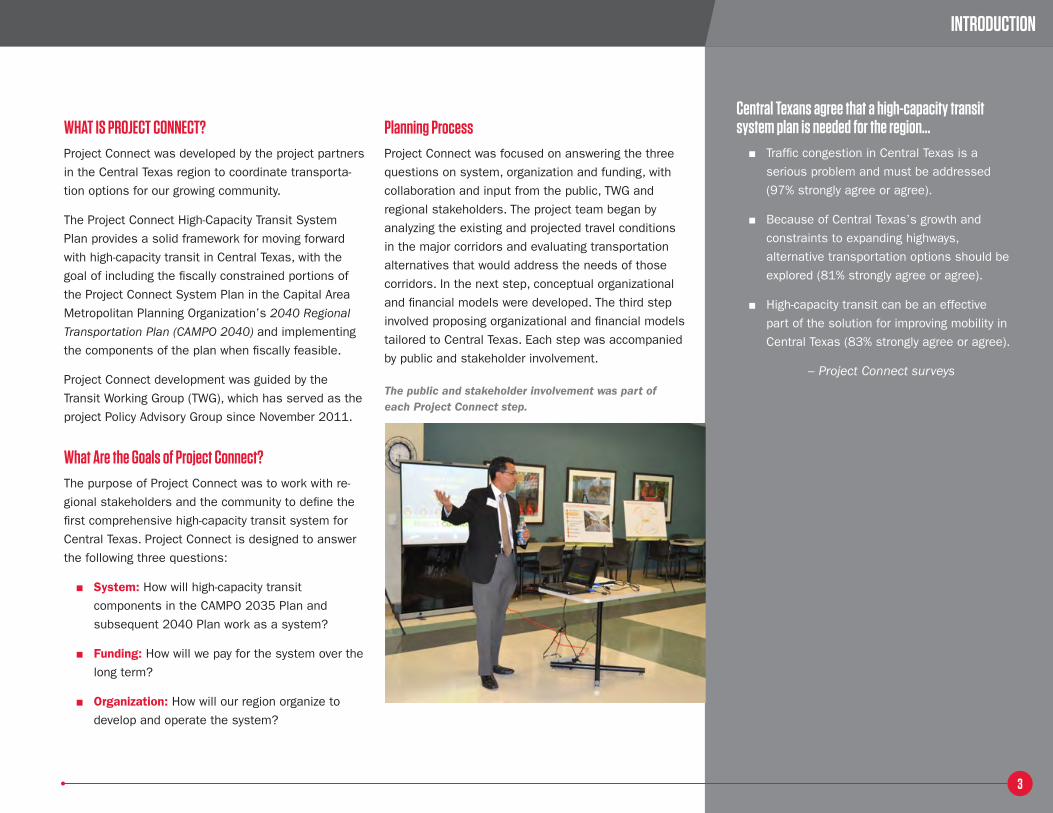
The public and stakeholder involvement was part of each Project Connect step.
4
The partners worked with the stakeholders and com-
munity through the Project Connect process on the
following:
■ Develop an understanding of regional
transportation challenges and opportunities
■ Review the CAMPO 2035 high-capacity transit
projects to optimize the regional transit system
■ Determine an approach to organization for
implementation of the regional high-capacity
transit system
■ Identify and compare the possible funding
sources that would be acceptable for use in
Central Texas
■ Determine possible phasing for the corridors
and associated elements of the high-capacity
transit system
Plan PartnersThe Project Connect partnership includes Capital Area
Metropolitan Planning Organization (CAMPO), Capital
Metropolitan Transportation Authority (Capital Metro),
Lone Star Rail District (LSRD), and the City of Austin.
Each partner is discussed below.
Capital Area Metropolitan Planning Organization (CAMPO)
CAMPO is the Metropolitan Planning Organization for
the Central Texas region. CAMPO was established in
1973 and is governed by the Transportation Policy
Board, comprised of regional and local officials.
CAMPO coordinates regional transportation planning
with counties, cities, Capital Metro, CARTS (Capital
Area Rural Transportation System), the Texas Depart-
ment of Transportation (TxDOT) and other transporta-
tion providers in the region and approves the use of
federal transportation funds.
CAMPO’s planning area covers Bastrop, Caldwell,
Hays, Travis, and Williamson Counties. Both the
CAMPO Transportation Policy Board and Austin City
Council voted in March 2013 to include Burnet County
in CAMPO’s planning area. However, this occurred
after the system plan process. Future updates to this
System Plan will include Burnet County in the planning
process.
Capital Metropolitan Transportation Authority (Capital Metro)
Capital Metro is Austin’s regional public transporta-
tion provider. The agency was established in 1985
by referendum and operates based on state legisla-
tive authority. The Capital Metro service area is 572
square miles and encompasses the cities of Austin,
Leander, Jonestown, Lago Vista, Manor, Point Venture,
San Leanna, Volente, and portions of Travis County,
Hays County, and Williamson County, including the
Anderson Mill area.
Capital Metro fast facts
Capital Metro provides more than 32 million trips per year on a system that includes:
■ 50 Metro routes, one MetroRapid route, eight Express routes and 19 UT shuttle routes
■ 3,000 bus stops
■ MetroRail passenger rail service between the City of Leander and downtown Austin
■ Nine MetroRail stations located along a 32-mile line
■ MetroAccess service for passengers with disabilities
■ Van and carpool coordination
■ Freight rail service
■ MetroBike shelters at major passenger facilities
■ Cycling partnership programs
■ Mobile ticketing app
CaMPO fast facts ■ The Metropolitan Planning Organization
for our region
■ Includes Bastrop, Burnet, Caldwell, Hays, Travis, and Williamson Counties
■ Governed by the Transportation Policy Board comprised of regional and local officials
5
City of Austin
Austin is a city of approximately 270 square miles
with about 800,000 residents. It is the core city in
the Austin–Round Rock–San Marcos Metropolitan
Statistical Area (MSA). The City of Austin’s jurisdiction
is mainly within Travis and Williamson Counties with a
small portion in Hays County.
Lone Star Rail District (LSRD)
LSRD is an independent public agency authorized by
the Texas Legislature in 1997 and created in 2002.
Its primary purpose is to establish the LSTAR, which
will be a 118-mile passenger rail service between
Georgetown and San Antonio. LSRD is governed by
a board of directors made up of representatives of
member cities and counties, various planning and
transit agencies, the business community, and gen-
eral public. Its planning area covers Williamson, Travis,
Hays, Comal, and Bexar Counties.
Other Partners
Texas Department of Transportation (TxDOT)
The TxDOT Austin District is located in the City of Aus-
tin, and its jurisdiction includes the following counties:
Bastrop, Blanco, Burnet, Caldwell, Gillespie, Hays,
Lee, Llano, Mason, Travis and Williamson. TxDOT
made a presentation to the TWG as part of the Project
Connect process on January 13, 2012 regarding their
current and future projects and funding outlook. Ad-
ditionally, the project partners have coordinated with
the TxDOT Rail Division on existing and proposed rail
projects including the MetroRail Red Line, LSTAR, and
Urban Rail.
The Central Texas Regional Mobility Authority (CTRMA)
CTRMA is an independent government agency created
in 2002 to improve the transportation system in
Williamson and Travis counties. Its mission is to
implement innovative, multimodal transportation
solutions that reduce congestion and create trans-
portation choices that enhance quality of life and
economic vitality. CTRMA made a presentation to the
TWG as part of the Project Connect process on
February 24, 2012 regarding the MoPac Improvement
Project, a managed lane project on MoPac Express-
way, with potential to implement express bus service.
City of austin fast facts
■ Population estimate for 2012 was
over 800,000
■ The land area is approximately 270
square miles
■ 13th largest city in the U.S.
■ Led the top 30 U.S. metropolitan
areas in population growth from
2010-2011
■ 1 in 4 work trips in region are headed
to the downtown
Austin core
lone Star Rail District fast facts
■ Authorized by Texas Legislature in
1997 and created in 2002
■ Governed by a 20 member board
comprised of regional and local
officials and leaders
■ Established to develop passenger rail
service
■ Includes Bexar, Comal, Hays, Travis,
and Williamson Counties
iNTRODuCTiON
0
20
40
60
80
100
120
140
160
0.00 M 0.50 M 1.00 M 1.50 M 2.00 M 2.50 M 3.00 M 3.50 M
San Diego
Dallas
Portland
Pittsburgh Cleveland
Charlotte
Phoenix
Minneapolis
Las Vegas
Salt Lake City
Austin
Miami
Seattle
Tucson
Denver
6
Ensuring TransparencyTransit Working Group (TWG)
As a committee of CAMPO, the TWG was charged with
evaluating and providing input on the regional high-
capacity transit plan for Central Texas, as well as ex-
ploring how the plan’s various components work as a
system to fulfill the region’s transportation and future
growth needs. Based on this charge, the TWG guided
the development of Project Connect and provided
recommendations on the three Project Connect goals:
system, funding, and organization. The TWG is an ap-
pointed advisory body to CAMPO with 18 members.
Public and Stakeholder Outreach
The opinions and ideas of residents and stakeholders
were an important source of input for Project Con-
nect. For this reason, public and stakeholder outreach
were carefully planned and executed to maximize the
participation of individuals and organizations in the
Central Texas region. Public outreach included open
house meetings, media briefings, road shows (presen-
tations to local organizations and interest groups),
social media dialogues (on Facebook and Twitter), a
webinar, a Regional Stakeholder meeting, a newslet-
ter, a website that provided information and a video
and PowerPoint presentation for each TWG meeting.
Additionally, over 55 briefings were held with various
organizations throughout the region during the project.
TWg guiding Principles for System:
■ Reliability/“Congestion proof”: transit
should run on time, no matter what time
of day.
■ Connections between centers/regional
connectivity: transit should connect
activity centers.
■ Economic development: the proposed
system should create favorable
economic development.
■ Travel demand: there should be
sufficient demand for the proposed
system.
■ Convenience/“True alternative”: transit
should run at a convenient time for
travelers. Stops should be located
in reasonable proximity to travelers’
destinations, and transit should be as
convenient as or more convenient than
driving a car.
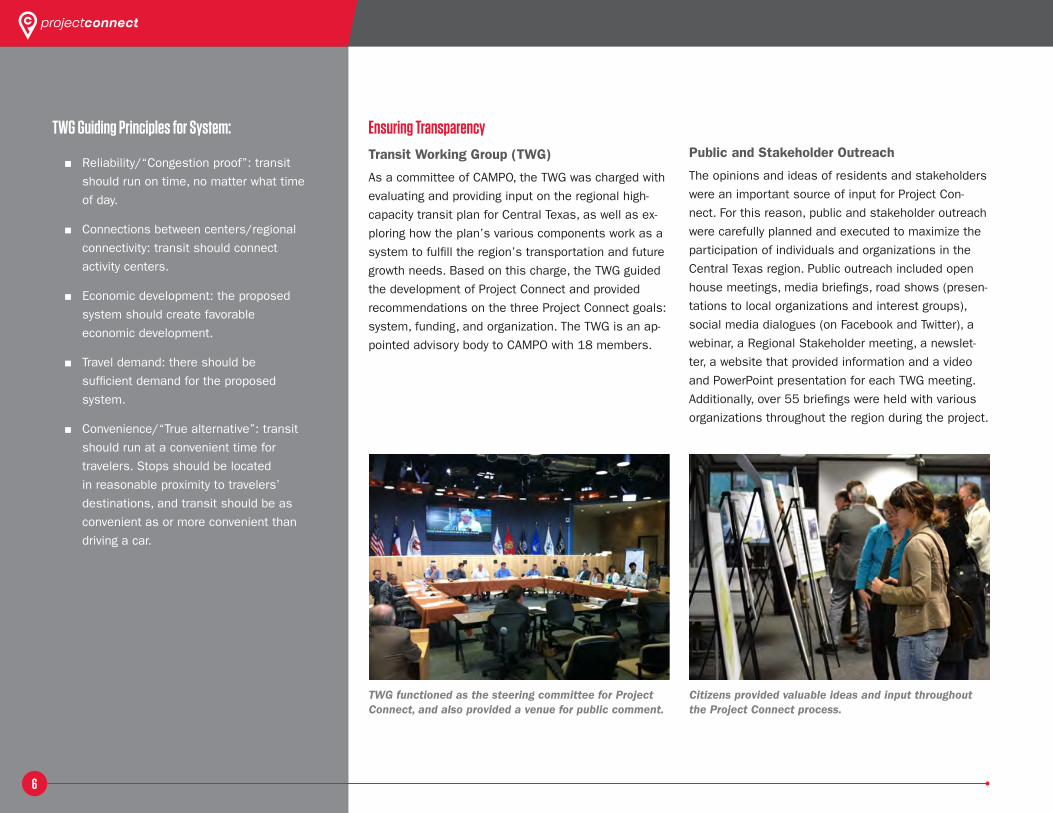
TWG functioned as the steering committee for Project Connect, and also provided a venue for public comment.
Citizens provided valuable ideas and input throughout the Project Connect process.
OuR REgiON’S OuTlOOk
0
20
40
60
80
100
120
140
160
0.00 M 0.50 M 1.00 M 1.50 M 2.00 M 2.50 M 3.00 M 3.50 M
San Diego
Dallas
Portland
Pittsburgh Cleveland
Charlotte
Phoenix
Minneapolis
Las Vegas
Salt Lake City
Austin
Miami
Seattle
Tucson
Denver
7
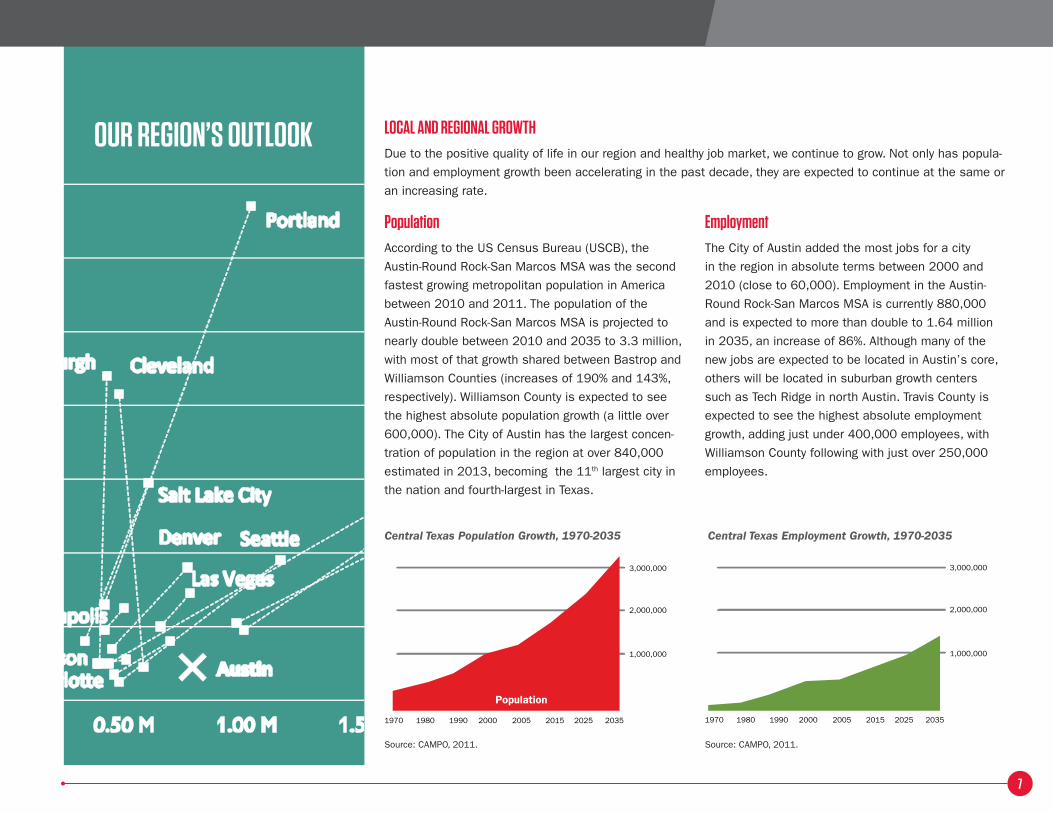
PopulationAccording to the US Census Bureau (USCB), the
Austin-Round Rock-San Marcos MSA was the second
fastest growing metropolitan population in America
between 2010 and 2011. The population of the
Austin-Round Rock-San Marcos MSA is projected to
nearly double between 2010 and 2035 to 3.3 million,
with most of that growth shared between Bastrop and
Williamson Counties (increases of 190% and 143%,
respectively). Williamson County is expected to see
the highest absolute population growth (a little over
600,000). The City of Austin has the largest concen-
tration of population in the region at over 840,000
estimated in 2013, becoming the 11th largest city in
the nation and fourth-largest in Texas.
EmploymentThe City of Austin added the most jobs for a city
in the region in absolute terms between 2000 and
2010 (close to 60,000). Employment in the Austin-
Round Rock-San Marcos MSA is currently 880,000
and is expected to more than double to 1.64 million
in 2035, an increase of 86%. Although many of the
new jobs are expected to be located in Austin’s core,
others will be located in suburban growth centers
such as Tech Ridge in north Austin. Travis County is
expected to see the highest absolute employment
growth, adding just under 400,000 employees, with
Williamson County following with just over 250,000
employees.
1970 1980 1990 2000 2005 2015 2025 2035
3,000,000
2,000,000
1,000,000
1970 1980 1990 2000 2005 2015 2025 2035
3,000,000
2,000,000
1,000,000
Population
Central Texas Population Growth, 1970-2035 Central Texas Employment Growth, 1970-2035
Source: CAMPO, 2011.Source: CAMPO, 2011.
lOCal aND REgiONal gROWTHDue to the positive quality of life in our region and healthy job market, we continue to grow. Not only has popula-
tion and employment growth been accelerating in the past decade, they are expected to continue at the same or
an increasing rate.
8
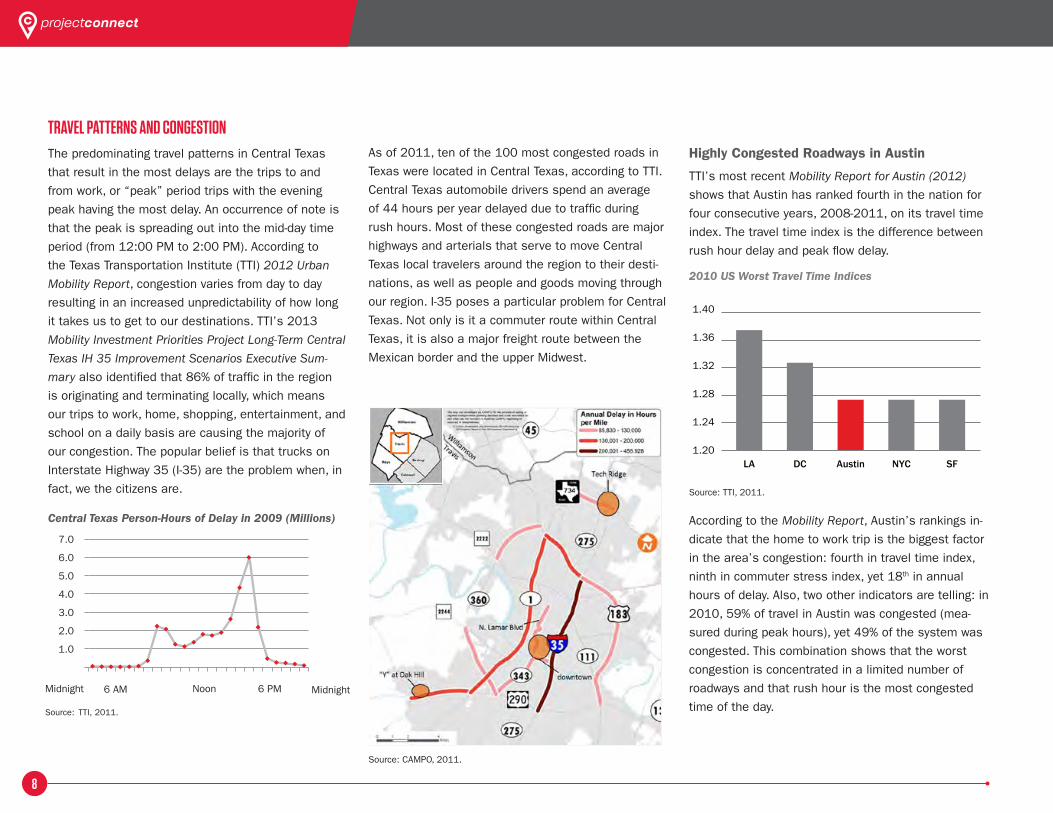
TRavEl PaTTERNS aND CONgESTiONThe predominating travel patterns in Central Texas
that result in the most delays are the trips to and
from work, or “peak” period trips with the evening
peak having the most delay. An occurrence of note is
that the peak is spreading out into the mid-day time
period (from 12:00 PM to 2:00 PM). According to
the Texas Transportation Institute (TTI) 2012 Urban
Mobility Report, congestion varies from day to day
resulting in an increased unpredictability of how long
it takes us to get to our destinations. TTI’s 2013
Mobility Investment Priorities Project Long-Term Central
Texas IH 35 Improvement Scenarios Executive Sum-
mary also identified that 86% of traffic in the region
is originating and terminating locally, which means
our trips to work, home, shopping, entertainment, and
school on a daily basis are causing the majority of
our congestion. The popular belief is that trucks on
Interstate Highway 35 (I-35) are the problem when, in
fact, we the citizens are.
Central Texas Person-Hours of Delay in 2009 (Millions)
Source: TTI, 2011.
1.0
2.0
3.0
4.0
5.0
6.0
7.0
Midnight Noon 6 AM 6 PM Midnight
As of 2011, ten of the 100 most congested roads in
Texas were located in Central Texas, according to TTI.
Central Texas automobile drivers spend an average
of 44 hours per year delayed due to traffic during
rush hours. Most of these congested roads are major
highways and arterials that serve to move Central
Texas local travelers around the region to their desti-
nations, as well as people and goods moving through
our region. I-35 poses a particular problem for Central
Texas. Not only is it a commuter route within Central
Texas, it is also a major freight route between the
Mexican border and the upper Midwest.
Highly Congested Roadways in Austin
TTI’s most recent Mobility Report for Austin (2012)
shows that Austin has ranked fourth in the nation for
four consecutive years, 2008-2011, on its travel time
index. The travel time index is the difference between
rush hour delay and peak flow delay.
2010 US Worst Travel Time Indices
LA DC Austin NYC SF
1.40
1.36
1.32
1.28
1.24
1.20
Source: TTI, 2011.
According to the Mobility Report, Austin’s rankings in-
dicate that the home to work trip is the biggest factor
in the area’s congestion: fourth in travel time index,
ninth in commuter stress index, yet 18th in annual
hours of delay. Also, two other indicators are telling: in
2010, 59% of travel in Austin was congested (mea-
sured during peak hours), yet 49% of the system was
congested. This combination shows that the worst
congestion is concentrated in a limited number of
roadways and that rush hour is the most congested
time of the day.
Source: CAMPO, 2011.
9
faCTORS SHaPiNg gROWTHWith the explosive growth in both population and
employment for our region and the existing and pro-
jected mobility challenges, CAMPO and the region’s
counties and cities have established various plans to
help shape growth for our continued prosperity. Land
use, development, and transportation are inextricably
linked, and planning for all is best done together.
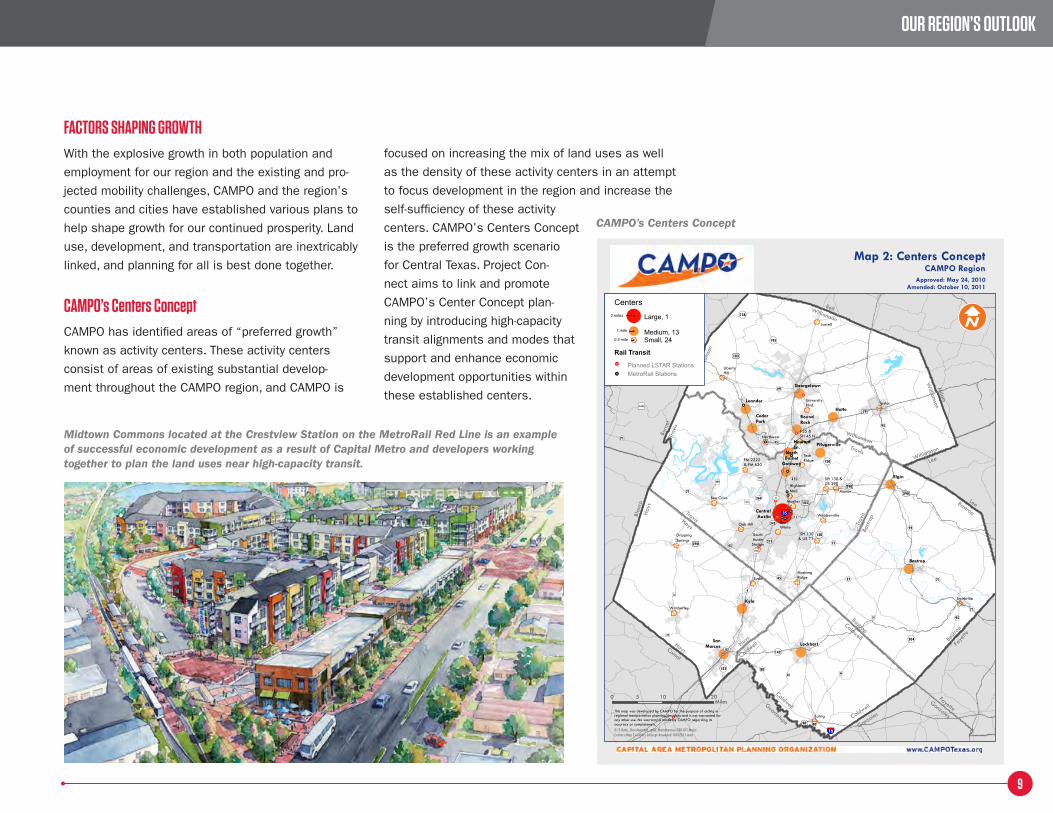
CaMPO’s Centers ConceptCAMPO has identified areas of “preferred growth”
known as activity centers. These activity centers
consist of areas of existing substantial develop-
ment throughout the CAMPO region, and CAMPO is
focused on increasing the mix of land uses as well
as the density of these activity centers in an attempt
to focus development in the region and increase the
self-sufficiency of these activity
centers. CAMPO’s Centers Concept
is the preferred growth scenario
for Central Texas. Project Con-
nect aims to link and promote
CAMPO’s Center Concept plan-
ning by introducing high-capacity
transit alignments and modes that
support and enhance economic
development opportunities within
these established centers.
OuR REgiON’S OuTlOOk
!R(
!R(
!R(
!R(
!R(
!R(
!R(
!R(
!R(
!R(
!R(
!R(
!R(
!R(
!R(
!R(
!R(
!R(
!R(
!R(
!R(
!R(
!R(
!R(
§̈¦35
§̈¦10
¬«95
¬«71¬«45
¬«80
¬«71
¬«138
¬«21
¬«123
¬«304
¬«80
¬«95
¬«71
¬«29
¬«142
¬«95
¬«195
¬«71
£¤183
£¤90
£¤290
£¤79
£¤290
UV4
UV82
UV275
UV275
UV111
UV343
UV360 UV1
")2304
")2244
")2222
")971
")12
")32
")20
")20 ")86
¬«130
¬«45
£¤183
¬«45
£¤290
¬«130
")620
¬«29
£¤281
£¤183
")1431
¬«71
BellWilliamson
Milam
William
son
Burn
etW
illia
mso
n
Burn
etTr
avis
WilliamsonTravis
Williamson
Lee
Trav
isBa
strop
TravisHays
LeeBastropBlan
coHa
ys
Bastr
opFa
yette
BastropCaldwell
Hays
CaldwellHaysComal
FayetteGonzales
Gonzales
GuadalupeCaldwell
Caldwell
Lockhart
CedarPark
RoundRock
Georgetown
Kyle
NorthBurnet
Gateway
Bastrop
CentralAustin
SanMarcos
PflugervilleHowardLn.
Elgin
Hutto
Leander Taylor
Northwest
FM 2222& FM 620
Smithville
TechRidge
HighlandMall
LibertyHill
I-35 &SH 45 N
Mueller
Jarrell
SH 130& US 71
Oak Hill
Luling
SouthAustinStation
MustangRidge
SH 130 &US 290
Manor
BenWhite
Bee Cave
DrippingSprings
Buda
UniversityBlvd.
Webberville
Wimberley
Map 2: Centers ConceptCAMPO Region
Approved: May 24, 2010Amended: October 10, 2011
G:\2-Data_Development_and_Maintenance\200-GIS\Maps\Centers\Map 2 Centers Concept Amended 10102011.mxd
Centers
Large, 1
Medium, 13Small, 24
2 miles
1 mile
0.5 mile
Planned LSTAR Stations!R
MetroRail Stations!R
Rail Transit
I
0 10 205Miles
This map was developed by CAMPO for the purpose of aiding inregional transportation planning decisions and is not warranted forany other use. No warranty is made by CAMPO regarding itsaccuracy or completeness.
Midtown Commons located at the Crestview Station on the MetroRail Red Line is an example of successful economic development as a result of Capital Metro and developers working together to plan the land uses near high-capacity transit.
CAMPO’s Centers Concept
10
local and Regional Plans ConsideredProject Connect also aims to support and enhance
the existing land use plans from the various cit-
ies within the region that include “transit-friendly”
development (i.e. higher-density, higher-intensity, and/
or mixed-use development). Recognizing the inter-
relationship between any proposed transit alignments
and these transit-friendly land use plans creates
synergy between the two which ultimately leads to an
increased potential for success of both the transit
facility and the various regional land use plans.
The existing and projected growth and mobility issues
combined with the region’s various land use and
transportation plans for addressing these opportu-
nities and constraints is the base for the develop-
ment of a full scale and inclusive solution, of which
high-capacity transit is a part. Combined with road
improvements, local bus, pedestrian and bike facili-
ties, park-and-rides, car share programs, development
patterns, and more, we can ensure that the future of
region remains as bright and vibrant as the past.
local and Regional Plans Considered:
Land Use Plans
■ Envision Central Texas
■ Bastrop County Comprehensive
Transportation Plan
■ Caldwell County Transportation Plan
■ Hays County Transportation Plan
■ Williamson County Transportation Plan Update
■ Imagine Austin Comprehensive Plan
■ Downtown Austin Plan
■ Elgin Comprehensive Plan
■ Georgetown 2030 Comprehensive Plan
■ Round Rock Places & Spaces: General Plan
2020
■ University of Texas Campus Master Plan Update
■ State of Texas Capitol Complex Master Plan
Transportation Plans
■ CAMPO 2035 Regional Transportation Plan
■ Capital Metro All Systems Go!
■ Capital Metro Future Connections Study
■ Capital Metro ServicePlan2020
■ Central Austin Transit Study
■ Downtown Austin Plan Urban Rail
Connections Study
■ Austin-San Antonio Commuter Rail Project:
2004 Feasibility Study
“Austin’s traffic crisis isn’t just an annoyance.
It’s a deadly serious threat to our quality of
life in a dozen different ways. It threatens
our economy, our environment, our safety,
and the livability of our city and our region…
It demands our most creative solutions…
There are over $500 million in dedicated
funds for roadway projects in Travis County
and plans for over $3 billion worth of proj-
ects… All of our investments in roads alone
won’t fix the problem… To address traffic
congestion, we must invest in a robust,
truly multi-modal transportation system…
Project Connect has community leaders
from throughout the region working with the
City of Austin and Capital Metro, Lone Star
Rail, and CAMPO to create a high-capacity
transit plan that encom passes an area
from Georgetown, Round Rock and Leander
to Oak Hill, Kyle and Buda… Our region is
working together like never before, and we’re
making real progress. From Express Lanes
on MoPac to Rapid Transit Service, we are
moving forward.”
Mayor Leffingwell’s 2013 Mayor’s State of the City Address, February 5, 2013
DEvElOPiNg THE SySTEM
11
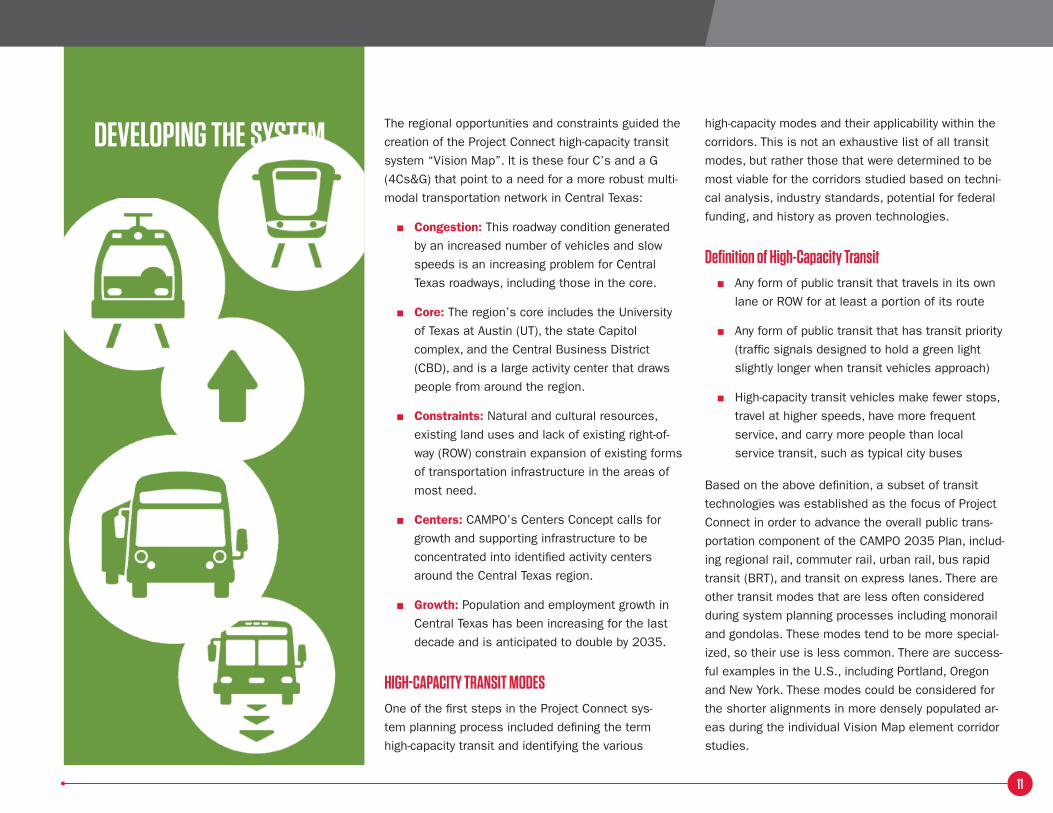
The regional opportunities and constraints guided the
creation of the Project Connect high-capacity transit
system “Vision Map”. It is these four C’s and a G
(4Cs&G) that point to a need for a more robust multi-
modal transportation network in Central Texas:
■ Congestion: This roadway condition generated
by an increased number of vehicles and slow
speeds is an increasing problem for Central
Texas roadways, including those in the core.
■ Core: The region’s core includes the University
of Texas at Austin (UT), the state Capitol
complex, and the Central Business District
(CBD), and is a large activity center that draws
people from around the region.
■ Constraints: Natural and cultural resources,
existing land uses and lack of existing right-of-
way (ROW) constrain expansion of existing forms
of transportation infrastructure in the areas of
most need.
■ Centers: CAMPO’s Centers Concept calls for
growth and supporting infrastructure to be
concentrated into identified activity centers
around the Central Texas region.
■ Growth: Population and employment growth in
Central Texas has been increasing for the last
decade and is anticipated to double by 2035.
HigH-CaPaCiTy TRaNSiT MODESOne of the first steps in the Project Connect sys-
tem planning process included defining the term
high-capacity transit and identifying the various
high-capacity modes and their applicability within the
corridors. This is not an exhaustive list of all transit
modes, but rather those that were determined to be
most viable for the corridors studied based on techni-
cal analysis, industry standards, potential for federal
funding, and history as proven technologies.
Definition of High-Capacity Transit ■ Any form of public transit that travels in its own
lane or ROW for at least a portion of its route
■ Any form of public transit that has transit priority
(traffic signals designed to hold a green light
slightly longer when transit vehicles approach)
■ High-capacity transit vehicles make fewer stops,
travel at higher speeds, have more frequent
service, and carry more people than local
service transit, such as typical city buses
Based on the above definition, a subset of transit
technologies was established as the focus of Project
Connect in order to advance the overall public trans-
portation component of the CAMPO 2035 Plan, includ-
ing regional rail, commuter rail, urban rail, bus rapid
transit (BRT), and transit on express lanes. There are
other transit modes that are less often considered
during system planning processes including monorail
and gondolas. These modes tend to be more special-
ized, so their use is less common. There are success-
ful examples in the U.S., including Portland, Oregon
and New York. These modes could be considered for
the shorter alignments in more densely populated ar-
eas during the individual Vision Map element corridor
studies.
12
What are our high-capacity
options for transit?
What is it, where does it go, and when do i use it?
How many people can it carry per
hour during rush hour?*
How fast does it go on average?
How often does it stop?
When can I get on? Real World Example
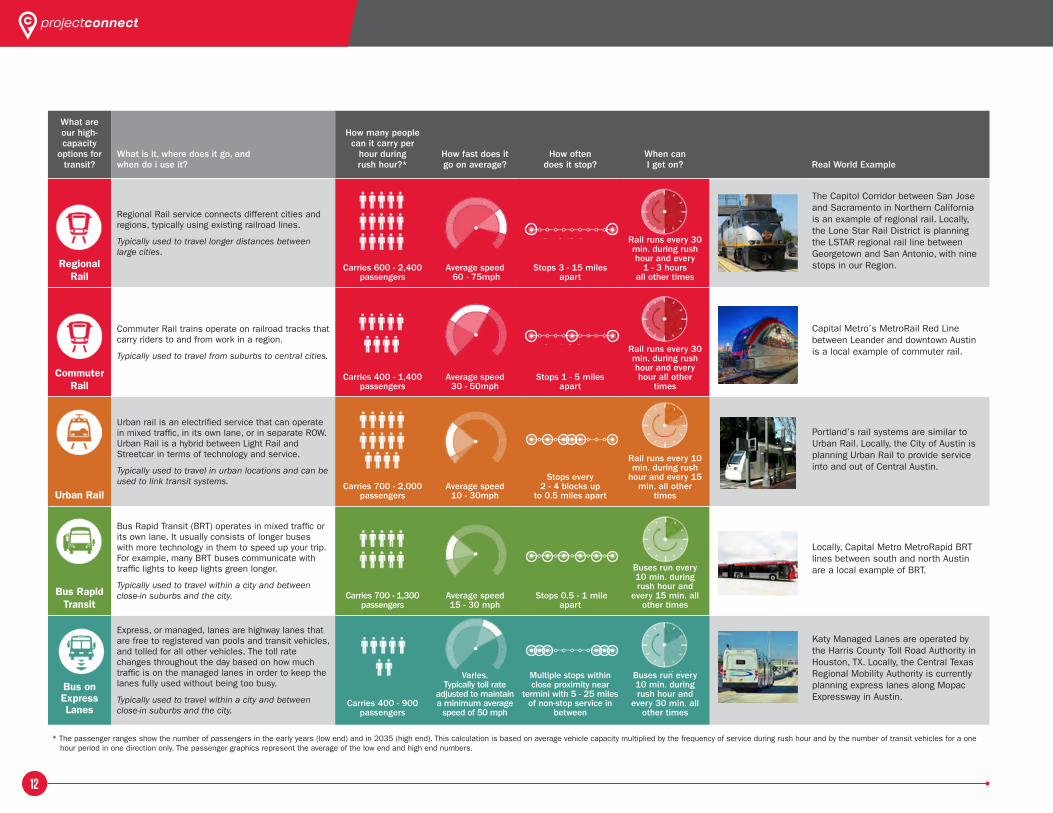
Regional Rail
Regional Rail service connects different cities and regions, typically using existing railroad lines.
Typically used to travel longer distances between large cities.
Carries 600 - 2,400 passengers
Average speed 60 - 75mph
Stops 3 - 15 miles apart
Rail runs every 30 min. during rush hour and every
1 - 3 hours all other times
The Capitol Corridor between San Jose and Sacramento in Northern California is an example of regional rail. Locally, the Lone Star Rail District is planning the LSTAR regional rail line between Georgetown and San Antonio, with nine stops in our Region.
Commuter Rail
Commuter Rail trains operate on railroad tracks that carry riders to and from work in a region.
Typically used to travel from suburbs to central cities.
Carries 400 - 1,400 passengers
Average speed 30 - 50mph
Stops 1 - 5 miles apart
Rail runs every 30 min. during rush hour and every hour all other
times
Capital Metro’s MetroRail Red Line between Leander and downtown Austin is a local example of commuter rail.
Urban Rail
Urban rail is an electrified service that can operate in mixed traffic, in its own lane, or in separate ROW. Urban Rail is a hybrid between Light Rail and Streetcar in terms of technology and service.
Typically used to travel in urban locations and can be used to link transit systems. Carries 700 - 2,000
passengersAverage speed
10 - 30mph
Stops every 2 - 4 blocks up
to 0.5 miles apart
Rail runs every 10 min. during rush
hour and every 15 min. all other
times
Portland’s rail systems are similar to Urban Rail. Locally, the City of Austin is planning Urban Rail to provide service into and out of Central Austin.
Bus Rapid Transit
Bus Rapid Transit (BRT) operates in mixed traffic or its own lane. It usually consists of longer buses with more technology in them to speed up your trip. For example, many BRT buses communicate with traffic lights to keep lights green longer.
Typically used to travel within a city and between close-in suburbs and the city. Carries 700 - 1,300
passengersAverage speed 15 - 30 mph
Stops 0.5 - 1 mile apart
Buses run every 10 min. during rush hour and
every 15 min. all other times
Locally, Capital Metro MetroRapid BRT lines between south and north Austin are a local example of BRT.
Bus on Express Lanes
Express, or managed, lanes are highway lanes that are free to registered van pools and transit vehicles, and tolled for all other vehicles. The toll rate changes throughout the day based on how much traffic is on the managed lanes in order to keep the lanes fully used without being too busy.
Typically used to travel within a city and between close-in suburbs and the city.
Carries 400 - 900 passengers
Varies. Typically toll rate
adjusted to maintain a minimum average
speed of 50 mph
Multiple stops within close proximity near
termini with 5 - 25 miles of non-stop service in
between
Buses run every 10 min. during rush hour and
every 30 min. all other times
Katy Managed Lanes are operated by the Harris County Toll Road Authority in Houston, TX. Locally, the Central Texas Regional Mobility Authority is currently planning express lanes along Mopac Expressway in Austin.
* The passenger ranges show the number of passengers in the early years (low end) and in 2035 (high end). This calculation is based on average vehicle capacity multiplied by the frequency of service during rush hour and by the number of transit vehicles for a one hour period in one direction only. The passenger graphics represent the average of the low end and high end numbers.
13
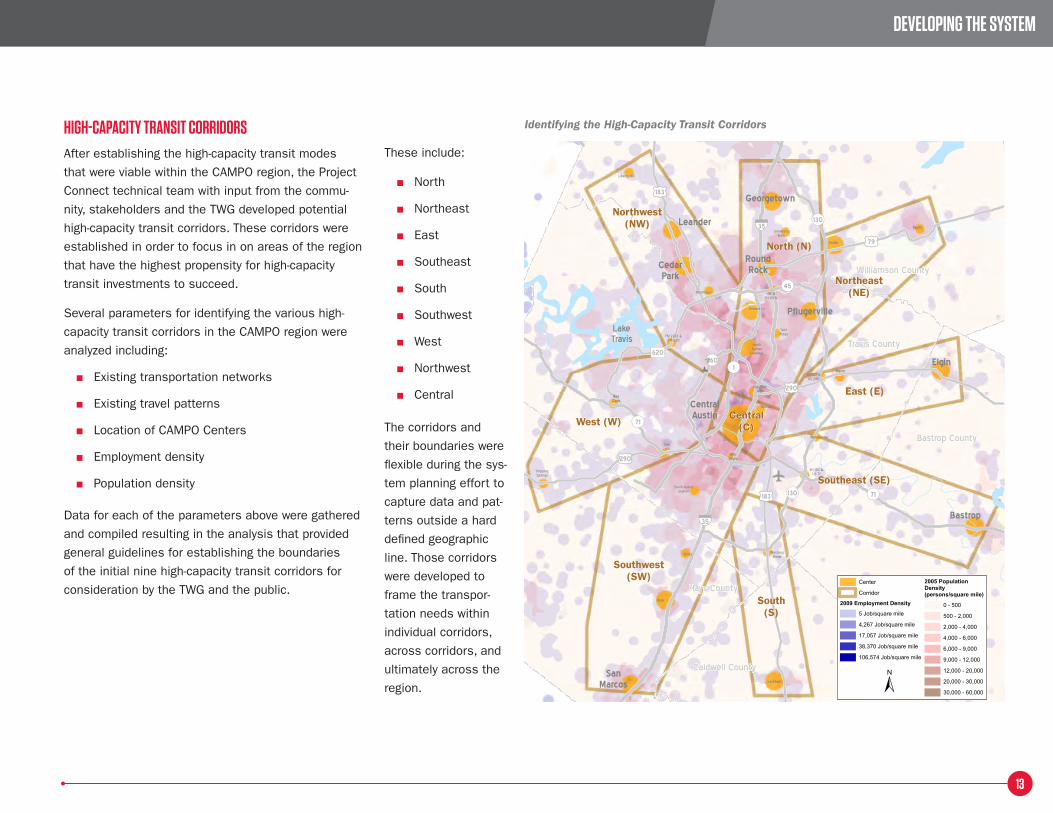
HigH-CaPaCiTy TRaNSiT CORRiDORSAfter establishing the high-capacity transit modes
that were viable within the CAMPO region, the Project
Connect technical team with input from the commu-
nity, stakeholders and the TWG developed potential
high-capacity transit corridors. These corridors were
established in order to focus in on areas of the region
that have the highest propensity for high-capacity
transit investments to succeed.
Several parameters for identifying the various high-
capacity transit corridors in the CAMPO region were
analyzed including:
■ Existing transportation networks
■ Existing travel patterns
■ Location of CAMPO Centers
■ Employment density
■ Population density
Data for each of the parameters above were gathered
and compiled resulting in the analysis that provided
general guidelines for establishing the boundaries
of the initial nine high-capacity transit corridors for
consideration by the TWG and the public.
These include:
■ North
■ Northeast
■ East
■ Southeast
■ South
■ Southwest
■ West
■ Northwest
■ Central
The corridors and
their boundaries were
flexible during the sys-
tem planning effort to
capture data and pat-
terns outside a hard
defined geographic
line. Those corridors
were developed to
frame the transpor-
tation needs within
individual corridors,
across corridors, and
ultimately across the
region.
DEvElOPiNg THE SySTEM
Identifying the High-Capacity Transit Corridors
o
§̈¦35
£¤183
£¤290
£¤79
£¤290
OP130
OP45
OP71
OP1
OP130
£¤183
§̈¦35
OP71
OP360620
Williamson County
Bastrop County
Hays County
Travis County
Caldwell County
CentralAustin
Kyle
Elgin
Hutto
Leander
Lockhart
CedarPark
Howard Ln. Pflugerville
SanMarcos
RoundRock
Georgetown
Buda
NorthBurnet
Gateway
Taylor
Manor
Mueller
OakHill
BenWhite
Northwest
TechRidge
Webberville
Liberty Hill
MustangRidge
I-35 &SH 45 N
SH 130 &US 71
UniversityBlvd.
SH 130 &US 290
South AustinStation
BeeCave
HighlandMall
FM 2222 &FM 620
Bastrop
DrippingSprings
LakeTravis
Center
Corridor
2009 Employment Density
5 Job/square mile
4,267 Job/square mile
17,057 Job/square mile
38,370 Job/square mile
106,574 Job/square mile
2005 PopulationDensity(persons/square mile)
0 - 500
500 - 2,000
2,000 - 4,000
4,000 - 6,000
6,000 - 9,000
9,000 - 12,000
12,000 - 20,000
20,000 - 30,000
30,000 - 60,000±
North (N)
Northeast (NE)
Northwest (NW)
West (W)
East (E)
Southeast (SE)
South (S)
Central (C)
Southwest(SW)
14
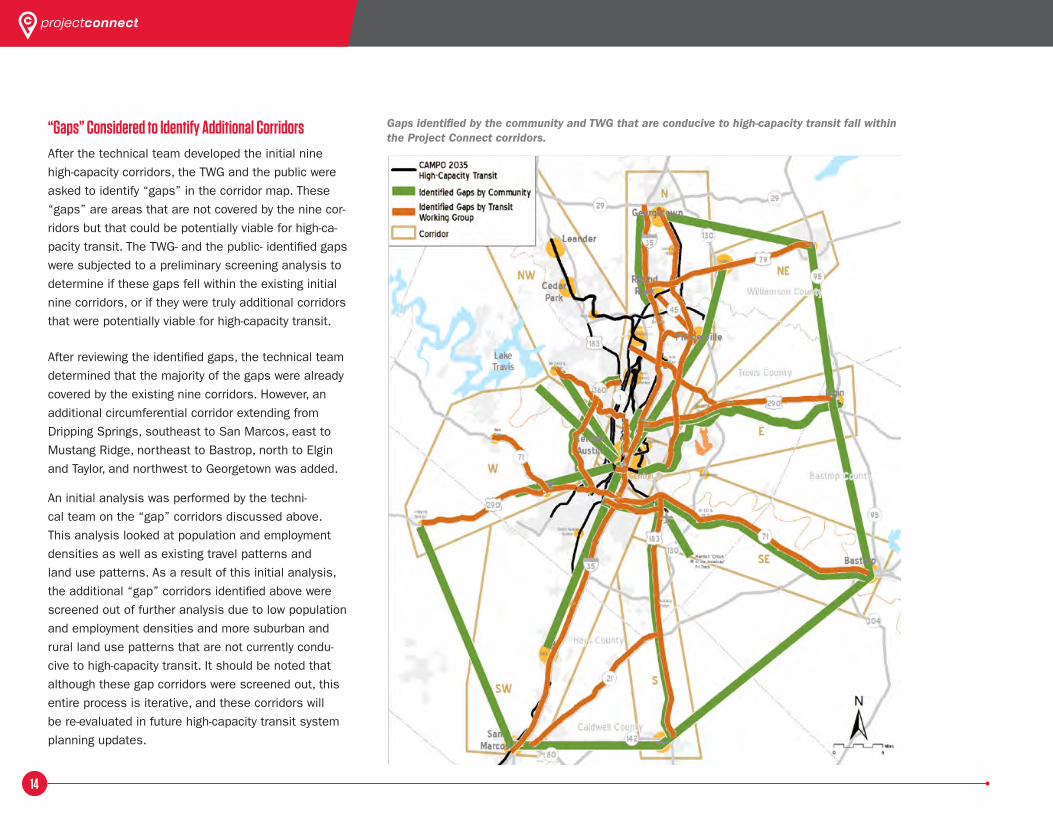
“gaps” Considered to identify additional CorridorsAfter the technical team developed the initial nine
high-capacity corridors, the TWG and the public were
asked to identify “gaps” in the corridor map. These
“gaps” are areas that are not covered by the nine cor-
ridors but that could be potentially viable for high-ca-
pacity transit. The TWG- and the public- identified gaps
were subjected to a preliminary screening analysis to
determine if these gaps fell within the existing initial
nine corridors, or if they were truly additional corridors
that were potentially viable for high-capacity transit.
After reviewing the identified gaps, the technical team
determined that the majority of the gaps were already
covered by the existing nine corridors. However, an
additional circumferential corridor extending from
Dripping Springs, southeast to San Marcos, east to
Mustang Ridge, northeast to Bastrop, north to Elgin
and Taylor, and northwest to Georgetown was added.
An initial analysis was performed by the techni-
cal team on the “gap” corridors discussed above.
This analysis looked at population and employment
densities as well as existing travel patterns and
land use patterns. As a result of this initial analysis,
the additional “gap” corridors identified above were
screened out of further analysis due to low population
and employment densities and more suburban and
rural land use patterns that are not currently condu-
cive to high-capacity transit. It should be noted that
although these gap corridors were screened out, this
entire process is iterative, and these corridors will
be re-evaluated in future high-capacity transit system
planning updates.
Gaps identified by the community and TWG that are conducive to high-capacity transit fall within the Project Connect corridors.
15
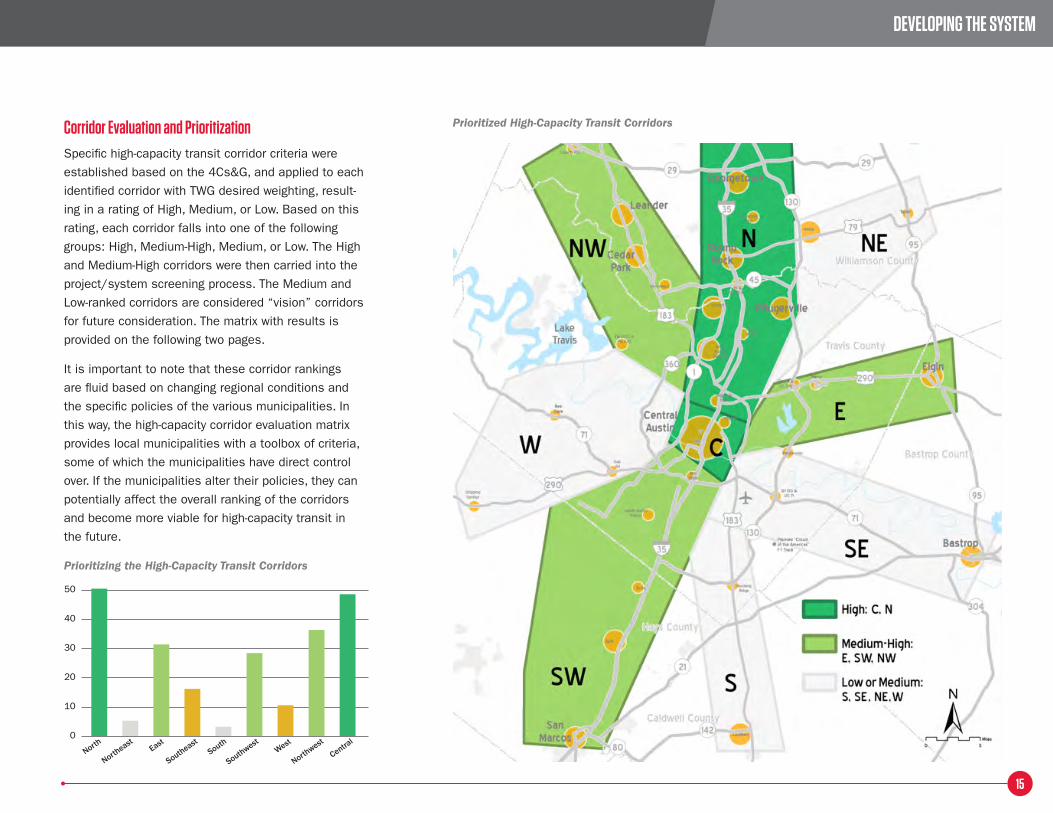
Corridor Evaluation and PrioritizationSpecific high-capacity transit corridor criteria were
established based on the 4Cs&G, and applied to each
identified corridor with TWG desired weighting, result-
ing in a rating of High, Medium, or Low. Based on this
rating, each corridor falls into one of the following
groups: High, Medium-High, Medium, or Low. The High
and Medium-High corridors were then carried into the
project/system screening process. The Medium and
Low-ranked corridors are considered “vision” corridors
for future consideration. The matrix with results is
provided on the following two pages.
It is important to note that these corridor rankings
are fluid based on changing regional conditions and
the specific policies of the various municipalities. In
this way, the high-capacity corridor evaluation matrix
provides local municipalities with a toolbox of criteria,
some of which the municipalities have direct control
over. If the municipalities alter their policies, they can
potentially affect the overall ranking of the corridors
and become more viable for high-capacity transit in
the future.
Prioritized High-Capacity Transit Corridors
Prioritizing the High-Capacity Transit Corridors
DEvElOPiNg THE SySTEM
50
40
30
20
10
0
North
Northea
stEast
West
Southea
stSou
th
Southwes
t
Northwes
t
Centra
l
16
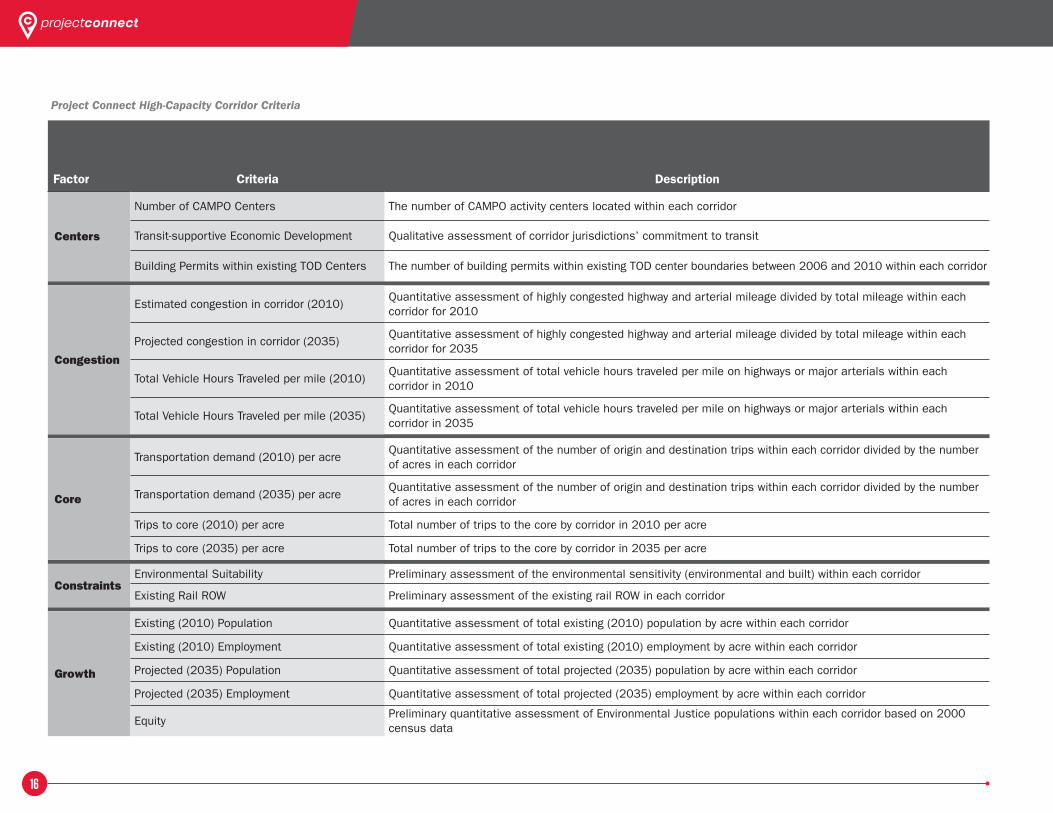
Factor Criteria Description
Centers
Number of CAMPO Centers The number of CAMPO activity centers located within each corridor
Transit-supportive Economic Development Qualitative assessment of corridor jurisdictions’ commitment to transit
Building Permits within existing TOD Centers The number of building permits within existing TOD center boundaries between 2006 and 2010 within each corridor
Congestion
Estimated congestion in corridor (2010)Quantitative assessment of highly congested highway and arterial mileage divided by total mileage within each corridor for 2010
Projected congestion in corridor (2035)Quantitative assessment of highly congested highway and arterial mileage divided by total mileage within each corridor for 2035
Total Vehicle Hours Traveled per mile (2010)Quantitative assessment of total vehicle hours traveled per mile on highways or major arterials within each corridor in 2010
Total Vehicle Hours Traveled per mile (2035)Quantitative assessment of total vehicle hours traveled per mile on highways or major arterials within each corridor in 2035
Core
Transportation demand (2010) per acreQuantitative assessment of the number of origin and destination trips within each corridor divided by the number of acres in each corridor
Transportation demand (2035) per acreQuantitative assessment of the number of origin and destination trips within each corridor divided by the number of acres in each corridor
Trips to core (2010) per acre Total number of trips to the core by corridor in 2010 per acre
Trips to core (2035) per acre Total number of trips to the core by corridor in 2035 per acre
ConstraintsEnvironmental Suitability Preliminary assessment of the environmental sensitivity (environmental and built) within each corridor
Existing Rail ROW Preliminary assessment of the existing rail ROW in each corridor
Growth
Existing (2010) Population Quantitative assessment of total existing (2010) population by acre within each corridor
Existing (2010) Employment Quantitative assessment of total existing (2010) employment by acre within each corridor
Projected (2035) Population Quantitative assessment of total projected (2035) population by acre within each corridor
Projected (2035) Employment Quantitative assessment of total projected (2035) employment by acre within each corridor
EquityPreliminary quantitative assessment of Environmental Justice populations within each corridor based on 2000 census data
Project Connect High-Capacity Corridor Criteria
17
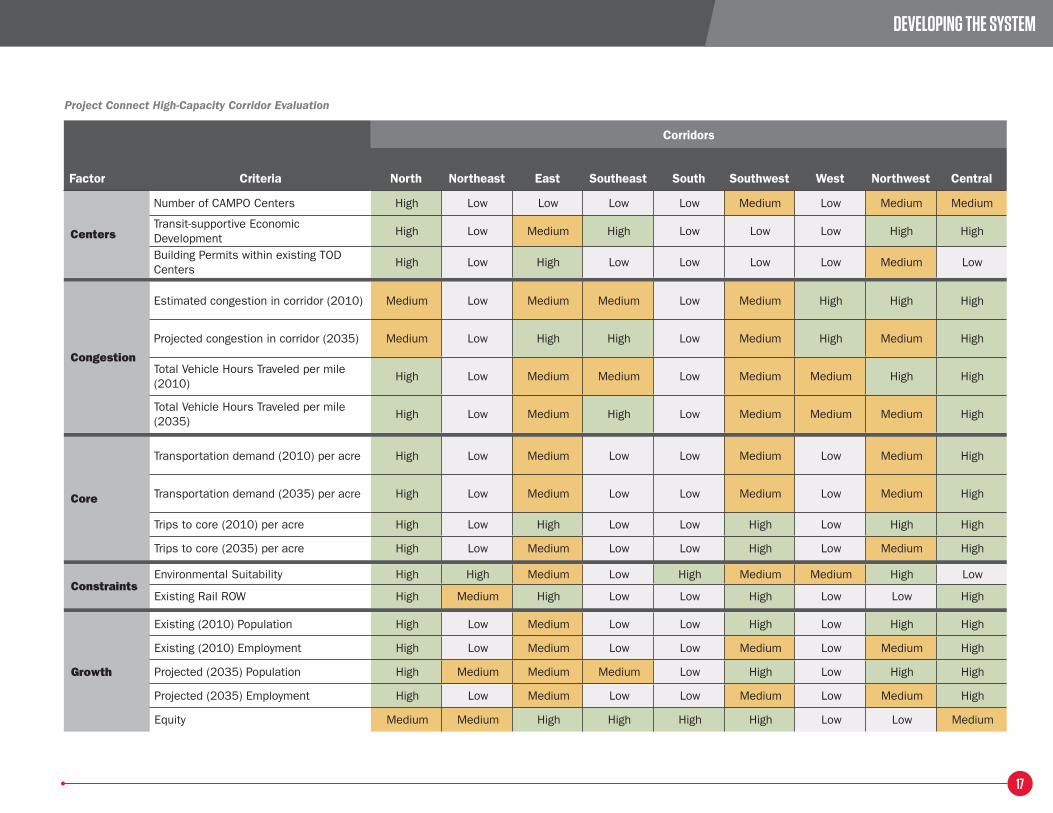
DEvElOPiNg THE SySTEM
Corridors
Factor Criteria North Northeast East Southeast South Southwest West Northwest Central
Centers
Number of CAMPO Centers High Low Low Low Low Medium Low Medium Medium
Transit-supportive Economic Development
High Low Medium High Low Low Low High High
Building Permits within existing TOD Centers
High Low High Low Low Low Low Medium Low
Congestion
Estimated congestion in corridor (2010) Medium Low Medium Medium Low Medium High High High
Projected congestion in corridor (2035) Medium Low High High Low Medium High Medium High
Total Vehicle Hours Traveled per mile (2010)
High Low Medium Medium Low Medium Medium High High
Total Vehicle Hours Traveled per mile (2035)
High Low Medium High Low Medium Medium Medium High
Core
Transportation demand (2010) per acre High Low Medium Low Low Medium Low Medium High
Transportation demand (2035) per acre High Low Medium Low Low Medium Low Medium High
Trips to core (2010) per acre High Low High Low Low High Low High High
Trips to core (2035) per acre High Low Medium Low Low High Low Medium High
ConstraintsEnvironmental Suitability High High Medium Low High Medium Medium High Low
Existing Rail ROW High Medium High Low Low High Low Low High
Growth
Existing (2010) Population High Low Medium Low Low High Low High High
Existing (2010) Employment High Low Medium Low Low Medium Low Medium High
Projected (2035) Population High Medium Medium Medium Low High Low High High
Projected (2035) Employment High Low Medium Low Low Medium Low Medium High
Equity Medium Medium High High High High Low Low Medium
Project Connect High-Capacity Corridor Evaluation
18
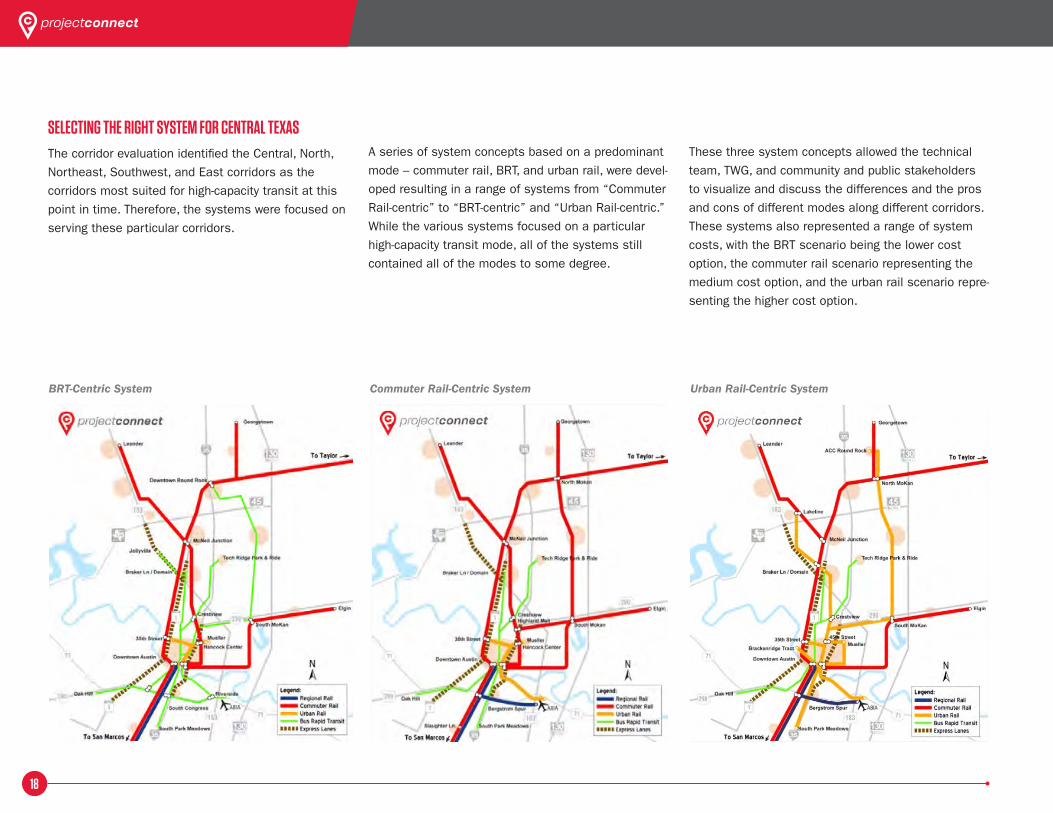
SElECTiNg THE RigHT SySTEM fOR CENTRal TExaSThe corridor evaluation identified the Central, North,
Northeast, Southwest, and East corridors as the
corridors most suited for high-capacity transit at this
point in time. Therefore, the systems were focused on
serving these particular corridors.
A series of system concepts based on a predominant
mode – commuter rail, BRT, and urban rail, were devel-
oped resulting in a range of systems from “Commuter
Rail-centric” to “BRT-centric” and “Urban Rail-centric.”
While the various systems focused on a particular
high-capacity transit mode, all of the systems still
contained all of the modes to some degree.
These three system concepts allowed the technical
team, TWG, and community and public stakeholders
to visualize and discuss the differences and the pros
and cons of different modes along different corridors.
These systems also represented a range of system
costs, with the BRT scenario being the lower cost
option, the commuter rail scenario representing the
medium cost option, and the urban rail scenario repre-
senting the higher cost option.
BRT-Centric System Commuter Rail-Centric System Urban Rail-Centric System
19
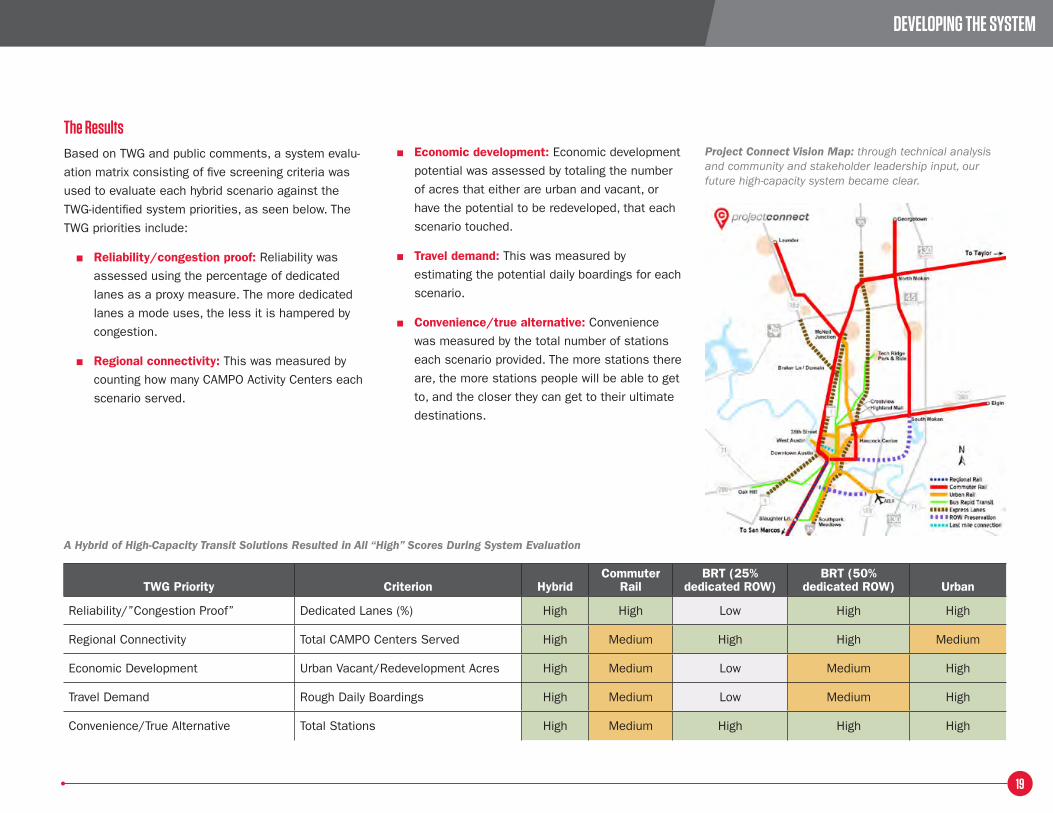
The ResultsBased on TWG and public comments, a system evalu-
ation matrix consisting of five screening criteria was
used to evaluate each hybrid scenario against the
TWG-identified system priorities, as seen below. The
TWG priorities include:
■ Reliability/congestion proof: Reliability was
assessed using the percentage of dedicated
lanes as a proxy measure. The more dedicated
lanes a mode uses, the less it is hampered by
congestion.
■ Regional connectivity: This was measured by
counting how many CAMPO Activity Centers each
scenario served.
■ Economic development: Economic development
potential was assessed by totaling the number
of acres that either are urban and vacant, or
have the potential to be redeveloped, that each
scenario touched.
■ Travel demand: This was measured by
estimating the potential daily boardings for each
scenario.
■ Convenience/true alternative: Convenience
was measured by the total number of stations
each scenario provided. The more stations there
are, the more stations people will be able to get
to, and the closer they can get to their ultimate
destinations.
Project Connect Vision Map: through technical analysis and community and stakeholder leadership input, our future high-capacity system became clear.
A Hybrid of High-Capacity Transit Solutions Resulted in All “High” Scores During System Evaluation
TWG Priority Criterion HybridCommuter
RailBRT (25%
dedicated ROW)BRT (50%
dedicated ROW) Urban
Reliability/”Congestion Proof” Dedicated Lanes (%) High High Low High High
Regional Connectivity Total CAMPO Centers Served High Medium High High Medium
Economic Development Urban Vacant/Redevelopment Acres High Medium Low Medium High
Travel Demand Rough Daily Boardings High Medium Low Medium High
Convenience/True Alternative Total Stations High Medium High High High
DEvElOPiNg THE SySTEM
WHEREAS, the Transit Working Group (TWG), a subcommittee of the Capital Area Metropolitan Planning Organization (CAMPO), has deliberated for nearly 18 months on issues of regional mobility and connectivity; and
WHEREAS, the Transit Working Group has been supported in its deliberations by the Project Connect collaborative planning effort for high-capacity transit initiated by the Capital Metropolitan Transportation Authority, City of Austin, Lone Star Rail District and CAMPO; and
WHEREAS, central Texas’ regional population is projected to double in the next 25 years and
WHEREAS, the TWG and the public agree that traffic congestion is a serious problem that threatens our regionrs economic health and quality of life and needs to be addressed; and
WHEREAS, high-capacity transit is an important part of the solution for improving mobility in Central Texas and will also provide new travel options between Central Texas and the San Antonio metropolitan area; and
WHEREAS, high-capacity transit includes modes such as Transit on ExpressLanes, Bus Rapid Transit, Commuter/ Regional Rail and Urban Rail; and
WHEREAS, the TWG members have determined that the North and Central corridors are the highest priority for regional high-capacity transit based on travel
THE SySTEM PlaN
130
612N
GX
COLORADO RIVER
CO
LO
RA
DO
RIV
ER
GUADALUPE COUNTY
BEXAR COUNTY
COMAL COUNTY
BEXAR COUNTY
CALDWELL COUNTY
GUADALUPE COUNTY
TRAVIS COUNTY
BASTROP COUNTYHAYS COUNTY
CAMPOplanning
areaSA-BC MPO
planningarea
COMAL COUNTY
HAYS COUNTY
TRAVIS COUNTY
WILSON COUNTYGUADALUPE COUNTY
WILLIAMSON COUNTY
TRAVIS COUNTY
WILLIAMSON COUNTY
TRAVIS COUNTY
BA
STR
OP
CO
UN
TY
TRAV
IS C
OU
NTY
UT/Dean Keeton
W 38th
Rosedale
North Loop
Koenig West
HydePark
SoCo
Oltorf
Little TexasPleasant Hill
SouthparkMeadows
St Edward’s
South Congress
Transit Center
Triangle
Sunshine
Justin
Northcross
Ohlen
Research
Pickle
Domain
Koenig
Crestview
Hancock
Martin Luther King Jr
PlazaSaltillo
Downtown
Highland/ACC
North LamarTransit Center
Rundberg
Masterson
Chinatown
Tech Ridge
UT/West MallMuseumCapitol
Wooldridge SquareRepublic Square
Austin/Seaholm
Slaughter Ln
Kyle/Buda
San Marcos/Texas State University
New Braunfels
Schertz
Loop 1604
Loop 410/Airport
San Antonio/UTSA
Port San Antonio
City South/TAMUSA
AuditoriumShores
Barton SpringsLamar Square
Oltorf WestBluebonnet
Brodie OaksOak Hill
Westgate
Braker Ln/Domain
35th/MOPAC
McNeil Junction
Howard
Kramer
Georgetown
DowntownRound Rock
Palm Valley
Hutto
Manor
Norwood
JohnnyMorris
Elgin
Taylor
Lakeline
Leander
EllisAlleyAlamo
South TexasMedical Center
UTSA
ROUNDROCK
CEDARPARK
LEANDER
MANOR
PFLUGERVILLE
ELGIN
BASTROP
LOCKHART
SEGUIN
DRIPPINGSPRINGS
AU S T I N
S A N A N TO N I O
GEORGETOWN
Dell Children’sMedical Center
SetonMedicalCenter
ACCRio Grande
Capitol Complex
Universityof Texas
PickleResearchCenter
Domain
ACCNorthridge
St Edward’sUniversity
ACC Riverside
Texas StateUniversity
Austin-BergstromInternational Airport
StDavid’s
Regional Rail, Commuter RailMetroRail (opened 2011), LSTAR (planned)
Bus Rapid TransitMetroRapid (coming 2014)
Urban Rail(Planned)
Transit on Express LanesMOPAC (coming 2015)
Right-of-Way PreservationFor future transportation corridors
Planned corridors, stations, routes and modesof transit for planned lines are conceptual only.
ADOPTED JUNE 2012 Map Revised June 2013schematic mapnot to scale
Park & Ride
Transit Stations
OPE
RATI
NG
PLA
NN
ED
UN
DER
CO
NST
RUC
TIO
N
35
35
35
35
35
35
10
10
37
410
410
410
79
183
183
183
183
290
290
90
281
1604
1
1
1
45
45
130
71
71
130
130
151
290
FREDERICKSBURG RDVIA Primo - not all stops shown
SOU
TH C
ON
GRE
SSBU
RNETM
OPA
C
W 5TH / W 6THCESAR CHAVEZ
NO
RTH
LAM
AR
SOU
TH L
AMAR
MO
PAC
MO
KA
N
20
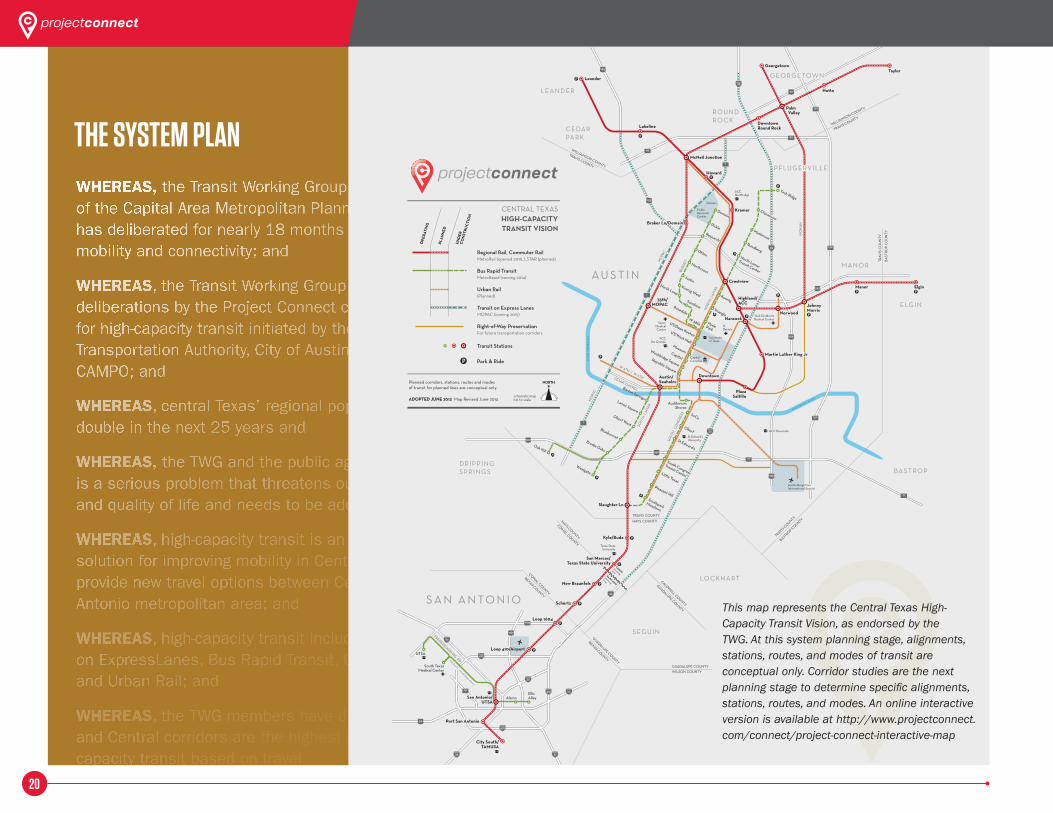
This map represents the Central Texas High-Capacity Transit Vision, as endorsed by the TWG. At this system planning stage, alignments, stations, routes, and modes of transit are conceptual only. Corridor studies are the next planning stage to determine specific alignments, stations, routes, and modes. An online interactive version is available at http://www.projectconnect.com/connect/project-connect-interactive-map
21
SySTEM: TWg Priorities and Recommendations
1. High-capacity transit projects should increase the people-moving capacity of the transportation network.
2. High-capacity transit should use existing ROW as effectively as possible.
3. System plan phasing should prioritize areas of heavy congestion and where data support high ridership based on land use, economic development, employment, and travel patterns.
4. High-capacity transit projects should maximize dedicated ROW where financially and physically reasonable.
5. Future corridor studies should strive for a “true alternative” to driving:
■ Quality competitive trips between and within activity centers
■ Seamless connectivity between high-capacity transit components
6. All of the following high-capacity transit modes should be considered as components of the transportation network for our region:
■ Transit on Express Lanes
■ Bus Rapid Transit (BRT)
■ Commuter/Regional Rail
■ Urban Rail
7. System Map
■ Recommend park-and-rides with safe places to park
■ Dedicated ROW must include a discussion on the feasibility of each street to
support it
■ Use a data-driven approach to evaluate different dedicated ROW scenarios
■ Look at the benefits and possibility of converting BRT corridors to rail in the
future
Project Connect approvals and letters of Support
TWG
■ Approval Project Connect Vision Map, June 22, 2012
■ Approval Project Connect System Financial Plan, April 12, 2013
■ Approval Project Connect Conceptual Organizational Approach,
May 10, 2013
■ Resolution Project Connect System – System, Funding, and
Organization, June 7, 2013
Project Connect Partners
■ Austin City Council – Resolution, August 29, 2013
■ Capital Metro Board – Resolution, June 21, 2013
■ Lone Star Rail District – Resolution, October 4, 2013
Resolutions/ Letters of Support
■ Austin Area Research Organization, September 4, 2013
■ Congress for the New Urbanism—Central Texas Chapter,
June 3, 2013
■ Downtown Austin Neighborhood Association, June 5, 2013
■ Greater Austin Chamber of Commerce, March 28, 2013
■ Hutto, December 5, 2013
■ Movability Austin, May 26, 2013
■ Round Rock, December 5, 2013
■ San Marcos, August 20, 2013
■ University of Texas Student Government, April 24, 2013
■ Georgetown, January 28, 2014
SySTEM PlaN ElEMENTS
22
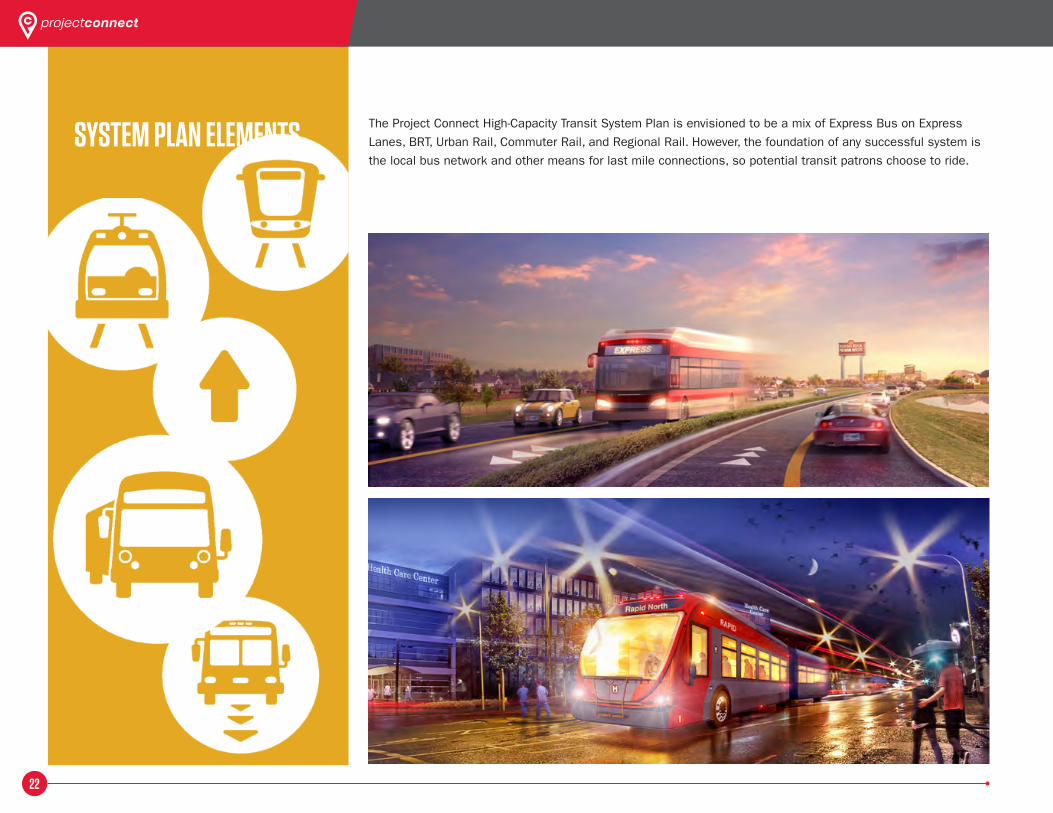
The Project Connect High-Capacity Transit System Plan is envisioned to be a mix of Express Bus on Express
Lanes, BRT, Urban Rail, Commuter Rail, and Regional Rail. However, the foundation of any successful system is
the local bus network and other means for last mile connections, so potential transit patrons choose to ride.
“
23
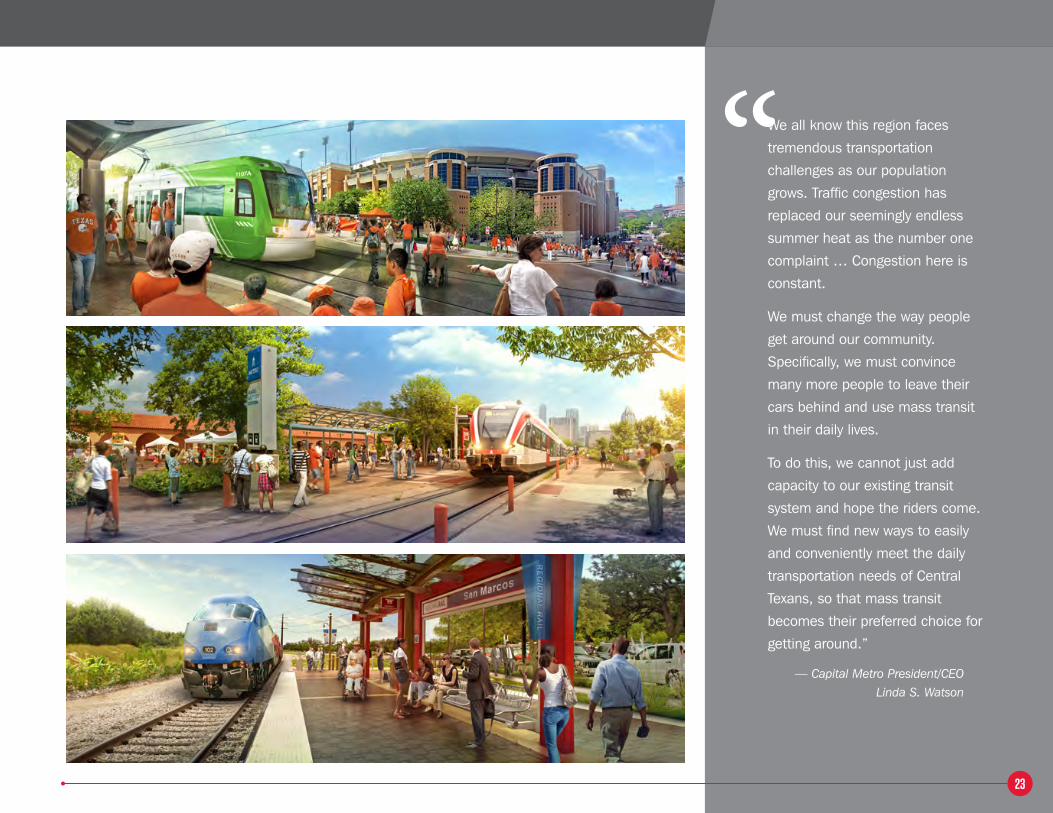
We all know this region faces
tremendous transportation
challenges as our population
grows. traffic congestion has
replaced our seemingly endless
summer heat as the number one
complaint … congestion here is
constant.
We must change the way people
get around our community.
specifically, we must convince
many more people to leave their
cars behind and use mass transit
in their daily lives.
to do this, we cannot just add
capacity to our existing transit
system and hope the riders come.
We must find new ways to easily
and conveniently meet the daily
transportation needs of central
texans, so that mass transit
becomes their preferred choice for
getting around.”
— Capital Metro President/CEO Linda S. Watson
24
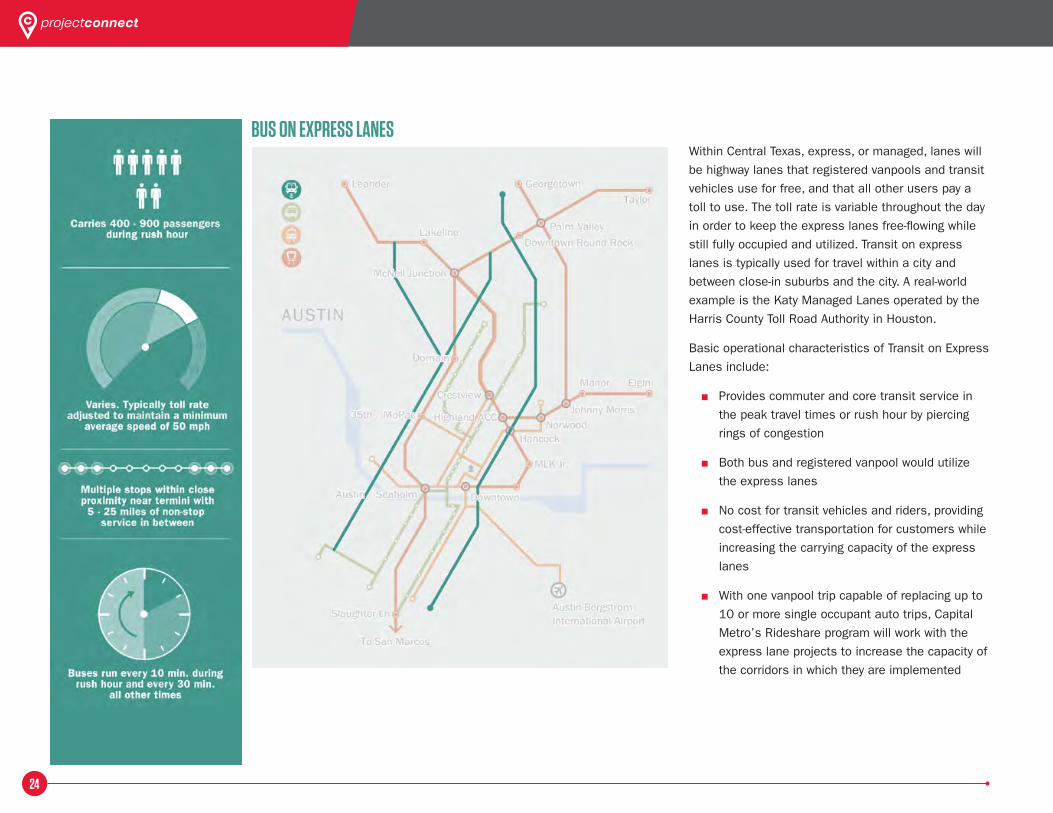
buS ON ExPRESS laNESWithin Central Texas, express, or managed, lanes will
be highway lanes that registered vanpools and transit
vehicles use for free, and that all other users pay a
toll to use. The toll rate is variable throughout the day
in order to keep the express lanes free-flowing while
still fully occupied and utilized. Transit on express
lanes is typically used for travel within a city and
between close-in suburbs and the city. A real-world
example is the Katy Managed Lanes operated by the
Harris County Toll Road Authority in Houston.
Basic operational characteristics of Transit on Express
Lanes include:
■ Provides commuter and core transit service in
the peak travel times or rush hour by piercing
rings of congestion
■ Both bus and registered vanpool would utilize
the express lanes
■ No cost for transit vehicles and riders, providing
cost-effective transportation for customers while
increasing the carrying capacity of the express
lanes
■ With one vanpool trip capable of replacing up to
10 or more single occupant auto trips, Capital
Metro’s Rideshare program will work with the
express lane projects to increase the capacity of
the corridors in which they are implemented
25
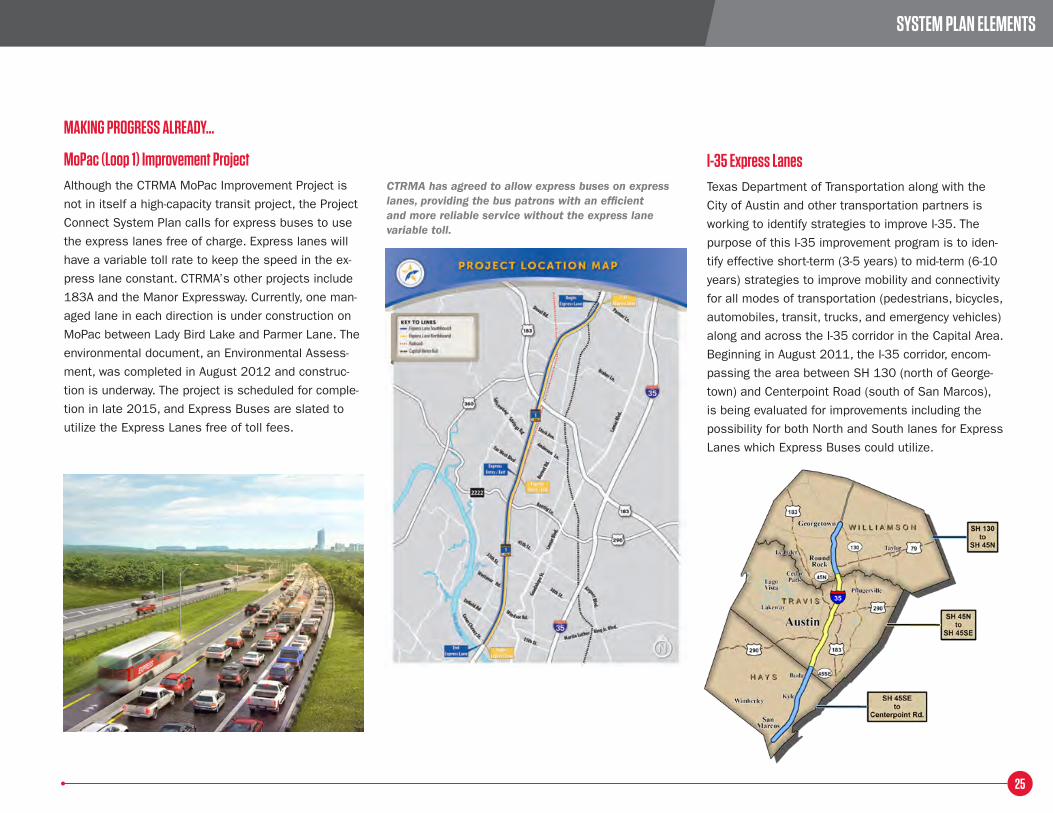
MakiNg PROgRESS alREaDy…
MoPac (loop 1) improvement ProjectAlthough the CTRMA MoPac Improvement Project is
not in itself a high-capacity transit project, the Project
Connect System Plan calls for express buses to use
the express lanes free of charge. Express lanes will
have a variable toll rate to keep the speed in the ex-
press lane constant. CTRMA’s other projects include
183A and the Manor Expressway. Currently, one man-
aged lane in each direction is under construction on
MoPac between Lady Bird Lake and Parmer Lane. The
environmental document, an Environmental Assess-
ment, was completed in August 2012 and construc-
tion is underway. The project is scheduled for comple-
tion in late 2015, and Express Buses are slated to
utilize the Express Lanes free of toll fees.
i-35 Express lanesTexas Department of Transportation along with the
City of Austin and other transportation partners is
working to identify strategies to improve I-35. The
purpose of this I-35 improvement program is to iden-
tify effective short-term (3-5 years) to mid-term (6-10
years) strategies to improve mobility and connectivity
for all modes of transportation (pedestrians, bicycles,
automobiles, transit, trucks, and emergency vehicles)
along and across the I-35 corridor in the Capital Area.
Beginning in August 2011, the I-35 corridor, encom-
passing the area between SH 130 (north of George-
town) and Centerpoint Road (south of San Marcos),
is being evaluated for improvements including the
possibility for both North and South lanes for Express
Lanes which Express Buses could utilize.
SySTEM PlaN ElEMENTS
CTRMA has agreed to allow express buses on express lanes, providing the bus patrons with an efficient and more reliable service without the express lane variable toll.
26
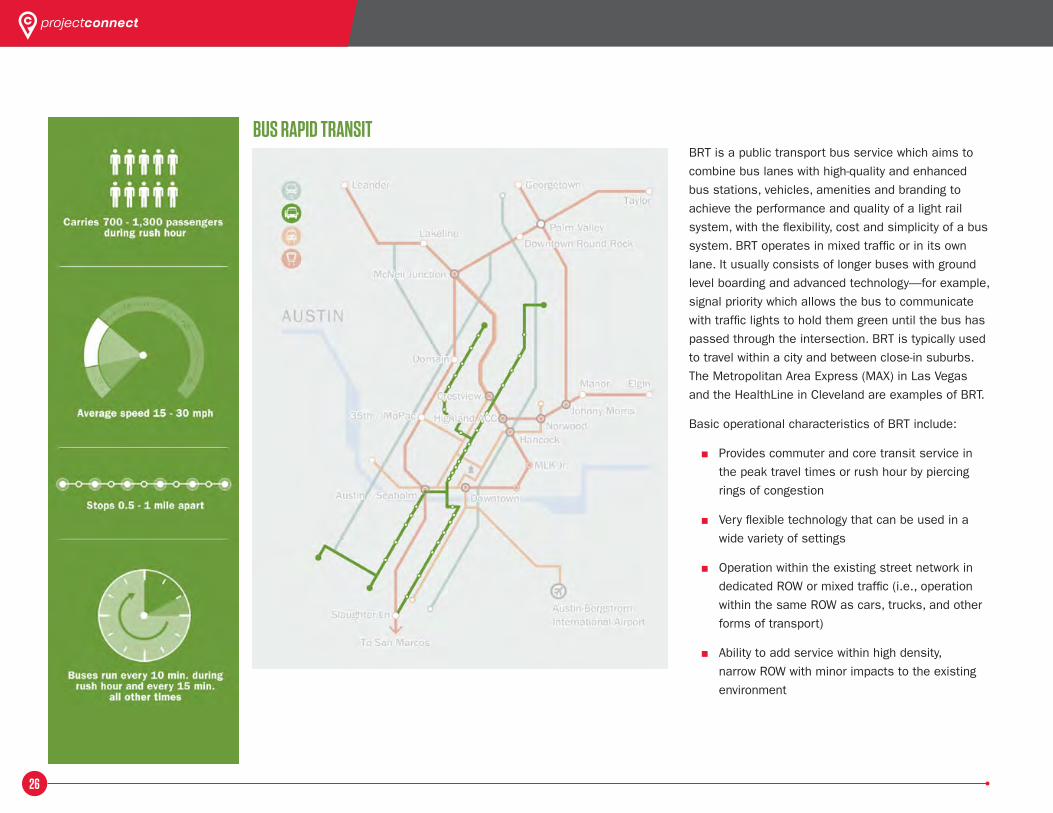
buS RaPiD TRaNSiTBRT is a public transport bus service which aims to
combine bus lanes with high-quality and enhanced
bus stations, vehicles, amenities and branding to
achieve the performance and quality of a light rail
system, with the flexibility, cost and simplicity of a bus
system. BRT operates in mixed traffic or in its own
lane. It usually consists of longer buses with ground
level boarding and advanced technology—for example,
signal priority which allows the bus to communicate
with traffic lights to hold them green until the bus has
passed through the intersection. BRT is typically used
to travel within a city and between close-in suburbs.
The Metropolitan Area Express (MAX) in Las Vegas
and the HealthLine in Cleveland are examples of BRT.
Basic operational characteristics of BRT include:
■ Provides commuter and core transit service in
the peak travel times or rush hour by piercing
rings of congestion
■ Very flexible technology that can be used in a
wide variety of settings
■ Operation within the existing street network in
dedicated ROW or mixed traffic (i.e., operation
within the same ROW as cars, trucks, and other
forms of transport)
■ Ability to add service within high density,
narrow ROW with minor impacts to the existing
environment
27
MakiNg PROgRESS alREaDy…
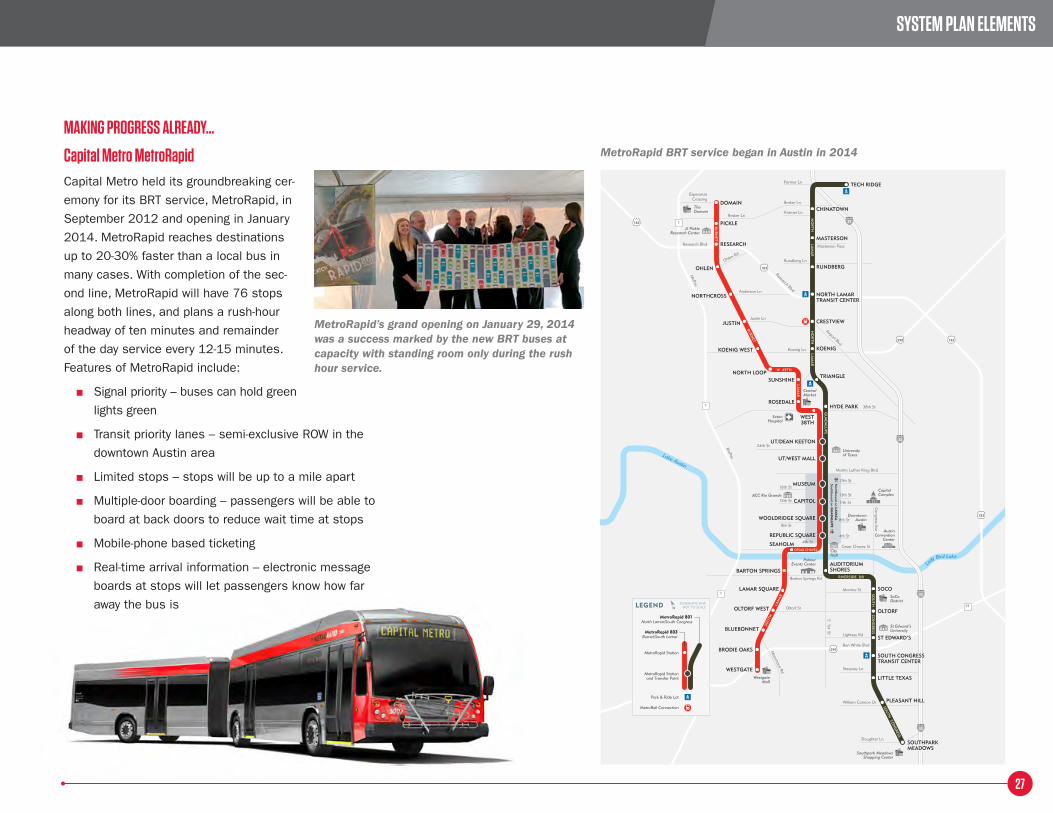
Capital Metro MetroRapidCapital Metro held its groundbreaking cer-
emony for its BRT service, MetroRapid, in
September 2012 and opening in January
2014. MetroRapid reaches destinations
up to 20-30% faster than a local bus in
many cases. With completion of the sec-
ond line, MetroRapid will have 76 stops
along both lines, and plans a rush-hour
headway of ten minutes and remainder
of the day service every 12-15 minutes.
Features of MetroRapid include:
■ Signal priority – buses can hold green
lights green
■ Transit priority lanes – semi-exclusive ROW in the
downtown Austin area
■ Limited stops – stops will be up to a mile apart
■ Multiple-door boarding – passengers will be able to
board at back doors to reduce wait time at stops
■ Mobile-phone based ticketing
■ Real-time arrival information – electronic message
boards at stops will let passengers know how far
away the bus is
SySTEM PlaN ElEMENTS
Lake Austin
Lady Bird Lake
TECH RIDGE
CHINATOWN
RUNDBERG
DOMAIN
PICKLE
RESEARCH
OHLEN
NORTHCROSS
JUSTIN
KOENIG WEST
NORTH LOOP
ROSEDALE
SUNSHINE
BARTON SPRINGS
LAMAR SQUARE
OLTORF WEST
BLUEBONNET
BRODIE OAKS
WESTGATE
SEAHOLM
WEST38TH
MASTERSON
NORTH LAMARTRANSIT CENTER
CRESTVIEW
KOENIG
TRIANGLE
HYDE PARK
AUDITORIUMSHORES
SOCO
OLTORF
ST EDWARD’S
LITTLE TEXAS
PLEASANT HILL
SOUTHPARKMEADOWS
SOUTH CONGRESSTRANSIT CENTER
CAPITOL
MUSEUM
UT/DEAN KEETON
UT/WEST MALL
WOOLDRIDGE SQUARE
REPUBLIC SQUARE
LAM
AR
W 49TH
SOU
TH
LAM
AR
BURN
ET
BU
RN
ET
CESAR CHAVEZ
35
35
35
35
183
183
183
183290
290
290
1
1
1
71
Congress A
ve
MoPac
MoPac
Martin Luther King Blvd
16th St
12th St13th St
11th St
17th St
8th St8th St
4th St4th St
Koenig Ln
Airport Blvd
38th St
24th St
Cesar Chavez St
Lightsey Rd
Stassney Ln
William Cannon Dr
Slaughter Ln
Ben White Blvd
Oltorf St
Barton Springs Rd
Monroe St
S 1st St
Braker Ln
Braker Ln
Research Blvd
Research Blvd
Kramer Ln
Parmer Ln
Rundberg Ln
EsperanzaCrossing
Masterson Pass
Justin Ln
Anderson Ln
Ohlen Rd
RIVERSIDE DR
Manchaca Rd
CO
NG
RESS
SOU
TH
SOU
TH CO
NG
RESS
GU
AD
ALU
PE
NO
RT
HLA
MA
RN
OR
TH
LAM
AR
Northbound on LA
VAC
ASouthbound on G
UA
DA
LUPE
TheDomain
JJ PickleResearch Center
ACC Rio Grande
CityHall
SetonHospital
CentralMarket
DowntownAustin
AustinConvention
Center
PalmerEvents Center
WestgateMall
Southpark MeadowsShopping Center
St Edward’sUniversity
SoCoDistrict
CapitolComplex
Universityof Texas
1312
05
ng
x
MetroRapid Station
MetroRapid 801North Lamar/South Congress
MetroRapid Stationand Transfer Point
Park & Ride Lot
MetroRail Connection
MetroRapid 803Burnet/South Lamar
SCHEMATIC MAPNOT TO SCALELEGEND
MetroRapid BRT service began in Austin in 2014
MetroRapid’s grand opening on January 29, 2014 was a success marked by the new BRT buses at capacity with standing room only during the rush hour service.
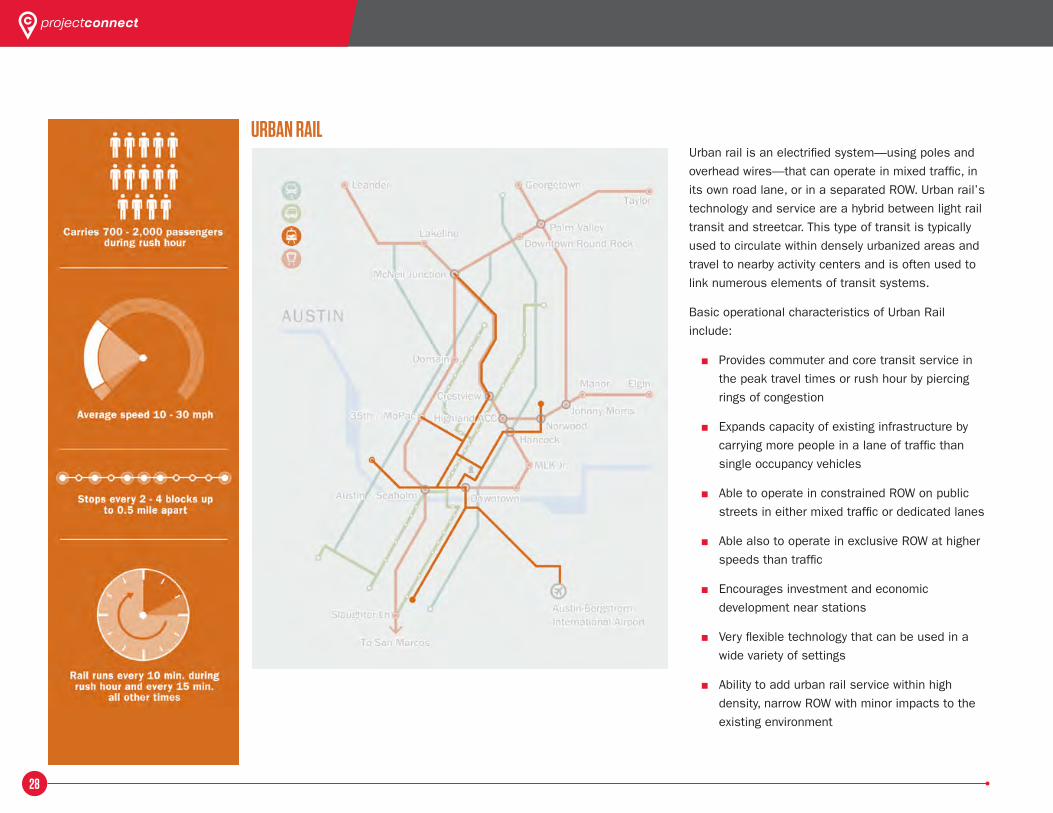
28
uRbaN RailUrban rail is an electrified system—using poles and
overhead wires—that can operate in mixed traffic, in
its own road lane, or in a separated ROW. Urban rail’s
technology and service are a hybrid between light rail
transit and streetcar. This type of transit is typically
used to circulate within densely urbanized areas and
travel to nearby activity centers and is often used to
link numerous elements of transit systems.
Basic operational characteristics of Urban Rail
include:
■ Provides commuter and core transit service in
the peak travel times or rush hour by piercing
rings of congestion
■ Expands capacity of existing infrastructure by
carrying more people in a lane of traffic than
single occupancy vehicles
■ Able to operate in constrained ROW on public
streets in either mixed traffic or dedicated lanes
■ Able also to operate in exclusive ROW at higher
speeds than traffic
■ Encourages investment and economic
development near stations
■ Very flexible technology that can be used in a
wide variety of settings
■ Ability to add urban rail service within high
density, narrow ROW with minor impacts to the
existing environment
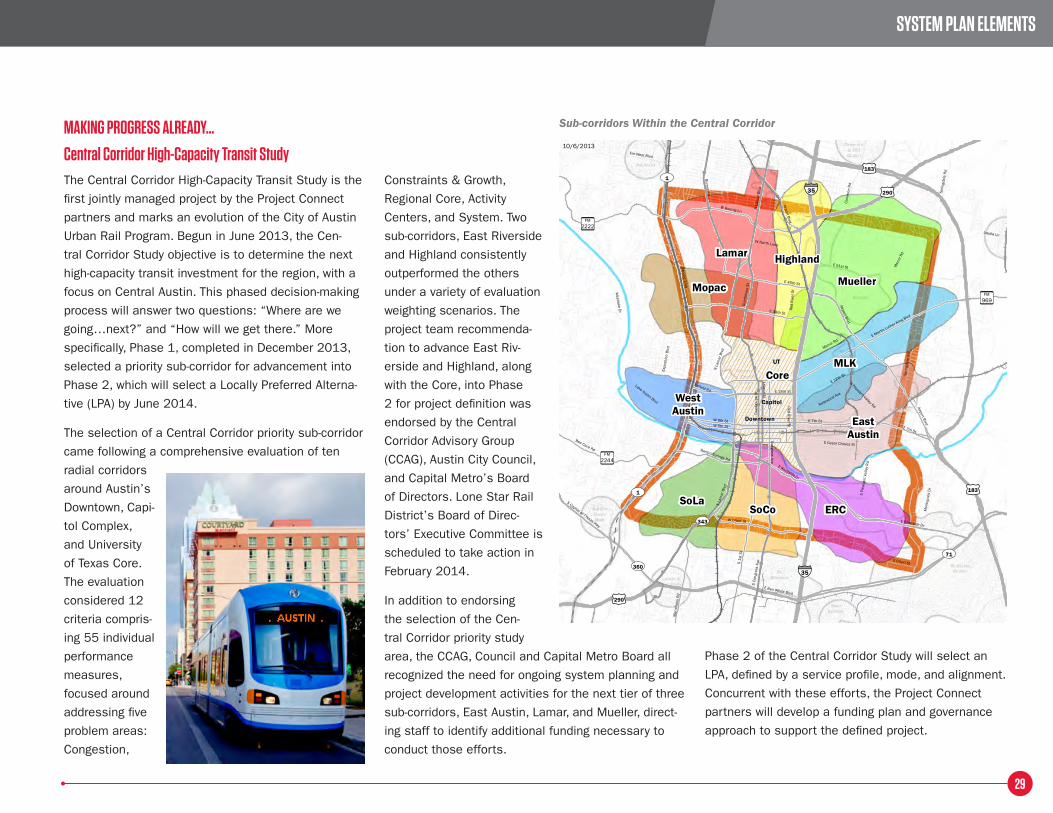
29
MakiNg PROgRESS alREaDy…
Central Corridor High-Capacity Transit StudyThe Central Corridor High-Capacity Transit Study is the
first jointly managed project by the Project Connect
partners and marks an evolution of the City of Austin
Urban Rail Program. Begun in June 2013, the Cen-
tral Corridor Study objective is to determine the next
high-capacity transit investment for the region, with a
focus on Central Austin. This phased decision-making
process will answer two questions: “Where are we
going…next?” and “How will we get there.” More
specifically, Phase 1, completed in December 2013,
selected a priority sub-corridor for advancement into
Phase 2, which will select a Locally Preferred Alterna-
tive (LPA) by June 2014.
The selection of a Central Corridor priority sub-corridor
came following a comprehensive evaluation of ten
radial corridors
around Austin’s
Downtown, Capi-
tol Complex,
and University
of Texas Core.
The evaluation
considered 12
criteria compris-
ing 55 individual
performance
measures,
focused around
addressing five
problem areas:
Congestion,
Constraints & Growth,
Regional Core, Activity
Centers, and System. Two
sub-corridors, East Riverside
and Highland consistently
outperformed the others
under a variety of evaluation
weighting scenarios. The
project team recommenda-
tion to advance East Riv-
erside and Highland, along
with the Core, into Phase
2 for project definition was
endorsed by the Central
Corridor Advisory Group
(CCAG), Austin City Council,
and Capital Metro’s Board
of Directors. Lone Star Rail
District’s Board of Direc-
tors’ Executive Committee is
scheduled to take action in
February 2014.
In addition to endorsing
the selection of the Cen-
tral Corridor priority study
area, the CCAG, Council and Capital Metro Board all
recognized the need for ongoing system planning and
project development activities for the next tier of three
sub-corridors, East Austin, Lamar, and Mueller, direct-
ing staff to identify additional funding necessary to
conduct those efforts.
Phase 2 of the Central Corridor Study will select an
LPA, defined by a service profile, mode, and alignment.
Concurrent with these efforts, the Project Connect
partners will develop a funding plan and governance
approach to support the defined project.
SySTEM PlaN ElEMENTS
")
")
")
")
")
")
")
")
")
")
")
")
")
")
")
")
")
")
")
")
")
")
")
")")
")
")
")
")
")
")
")
")
")
")
")
")
")
")
")
")
")
") ")
")
")
")
")
")
")
E 7th StW 5th St
W Oltorf St
Man
or R
d
Enfield Rd
W 6th St
E 45th St
Mopac Expy
E 15th St
Sprin
gdal
e Rd
Man
chac
a Rd
Rosewood Ave
E 38th St
Bee Cave Rd
Guad
alup
e St
W Koenig Ln
E Cesar Chavez St
E Riverside Dr
Lake Austin Blvd
E Oltorf St
Cam
eron
Rd
W North Loop
E 51st St
Barton Springs Rd
Burnet Rd
Loyola Ln
N La
mar
Blv
d
S Co
ngre
ss A
ve
S Capital of TYexas Hwy
E Martin Luther King Blvd
Airport Blvd
N La
mar
Blv
d
Sprin
gdal
e Rd
Manor Rd
Airport Blvd
S 1s
t St
Expo
sitio
n Bl
vd
Airport Blvd
Westlake Dr
E 12th St
E 7th St
Far West Blvd
S La
mar
Blv
d
E Ben White Blvd
E Riverside Dr
Red River St
Congress Ave
Lavaca St
Gua
dalu
pe S
t
Mon
topo
lis D
r
S Pl
easa
nt V
alle
y Rd
N Pleasant Valley Rd
Red
Riv
er S
t
§̈¦35
§̈¦35
£¤183
£¤183
£¤290
£¤290
UV1
UV1
UV71
UV360
UV343
ÆÿFM2244
ÆÿFM2222
ÆÿFM969
UT
Capitol
Downtown
Core
Mueller
MLK
EastAustin
ERCSoCoSoLa
WestAustin
Mopac
Lamar Highland
10/6/2013
Sub-corridors Within the Central Corridor
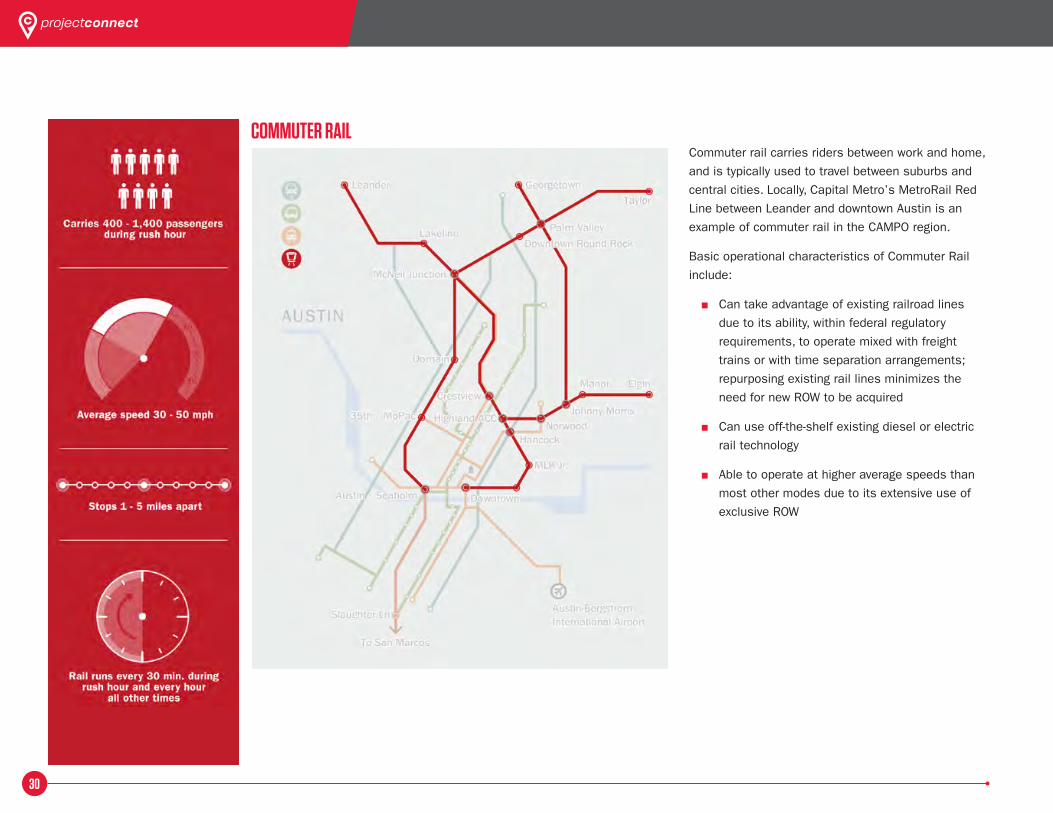
30
COMMuTER RailCommuter rail carries riders between work and home,
and is typically used to travel between suburbs and
central cities. Locally, Capital Metro’s MetroRail Red
Line between Leander and downtown Austin is an
example of commuter rail in the CAMPO region.
Basic operational characteristics of Commuter Rail
include:
■ Can take advantage of existing railroad lines
due to its ability, within federal regulatory
requirements, to operate mixed with freight
trains or with time separation arrangements;
repurposing existing rail lines minimizes the
need for new ROW to be acquired
■ Can use off-the-shelf existing diesel or electric
rail technology
■ Able to operate at higher average speeds than
most other modes due to its extensive use of
exclusive ROW
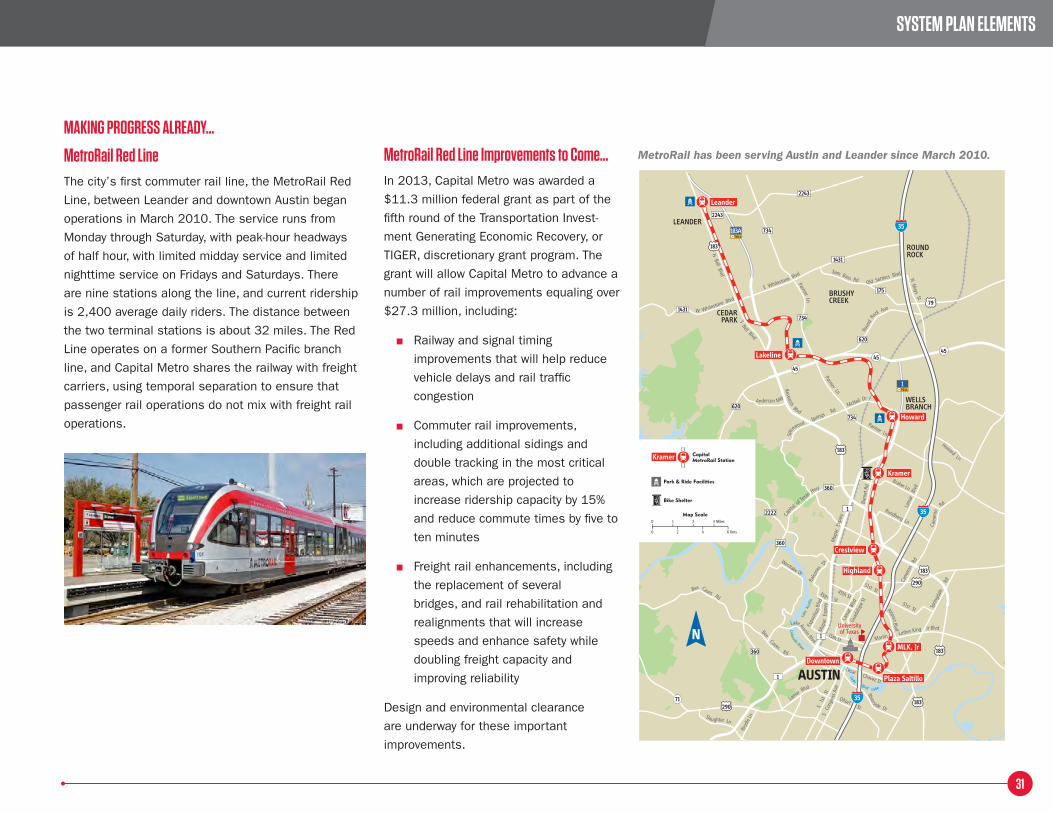
31
MakiNg PROgRESS alREaDy…
MetroRail Red lineThe city’s first commuter rail line, the MetroRail Red
Line, between Leander and downtown Austin began
operations in March 2010. The service runs from
Monday through Saturday, with peak-hour headways
of half hour, with limited midday service and limited
nighttime service on Fridays and Saturdays. There
are nine stations along the line, and current ridership
is 2,400 average daily riders. The distance between
the two terminal stations is about 32 miles. The Red
Line operates on a former Southern Pacific branch
line, and Capital Metro shares the railway with freight
carriers, using temporal separation to ensure that
passenger rail operations do not mix with freight rail
operations.
MetroRail Red line improvements to Come…In 2013, Capital Metro was awarded a
$11.3 million federal grant as part of the
fifth round of the Transportation Invest-
ment Generating Economic Recovery, or
TIGER, discretionary grant program. The
grant will allow Capital Metro to advance a
number of rail improvements equaling over
$27.3 million, including:
■ Railway and signal timing
improvements that will help reduce
vehicle delays and rail traffic
congestion
■ Commuter rail improvements,
including additional sidings and
double tracking in the most critical
areas, which are projected to
increase ridership capacity by 15%
and reduce commute times by five to
ten minutes
■ Freight rail enhancements, including
the replacement of several
bridges, and rail rehabilitation and
realignments that will increase
speeds and enhance safety while
doubling freight capacity and
improving reliability
Design and environmental clearance
are underway for these important
improvements.
SySTEM PlaN ElEMENTS
Old Settlers Blvd
Anderson Mill
Leander
Lakeline
Howard
Kramer
Crestview
Downtown
MLK, Jr
Plaza Saltillo
Highland
N Bell Blvd
W Whitestone Blvd
Parmer Ln
S Bell Blvd
Roun
d Ro
ck Ave
Sam Bass Rd N M
ays St
McNeil Dr
Spice
wood Springs
Rd
Cam
eron
Rd
Braker Ln
Rundberg Ln
Lam
ar
Blvd
45th St
Burn
et R
d
Martin Luther King Jr Blvd
Airport Blvd
Cesar Chavez St
Lake Austin Blvd
Sprin
gdale
Rd
51st St
51st St
Lamar
Blvd
15th St
Expo
sitio
n Blv
d
Brod
ie LnSlaughter Ln
Westlake Dr
Bee Caves Rd
Bee Caves Rd 35th St
Balco
ne
s Dr
Lam
ar B
lvdGu
adalu
pe St
S 1
st S
tS
Con
gres
s Ave
Oltorf St
Riverside Dr
Research Blvd
E Whitestone Blvd
Parmer Ln
Parmer Ln
Cam
eron
Rd
Howard Ln
Ca
pital
of Te
xas Hwy
Mop
ac E
xpw
y
Mop
ac E
xpw
y
45
4545
183
183
79
35
35
35
2243
2243
1431
1431
734
734
1
1
1
734
175
620
620
620
183AT O L L
1T O L L
360
360
360
2222
183
290
183
183
29071
LakeTravis
Lady Bird Lake
Colorado River
Lake
Aus
tin
ROUNDROCK
WELLSBRANCH
BRUSHYCREEK
AUSTIN
CEDARPARK
LEANDER
Universityof Texas
CapitalMetroRail Station
Park & Ride Facilities
Bike Shelter
Map Scale0 1 2 3 Miles
0 2 4 6 Kms
Kramer
MetroRail has been serving Austin and Leander since March 2010.
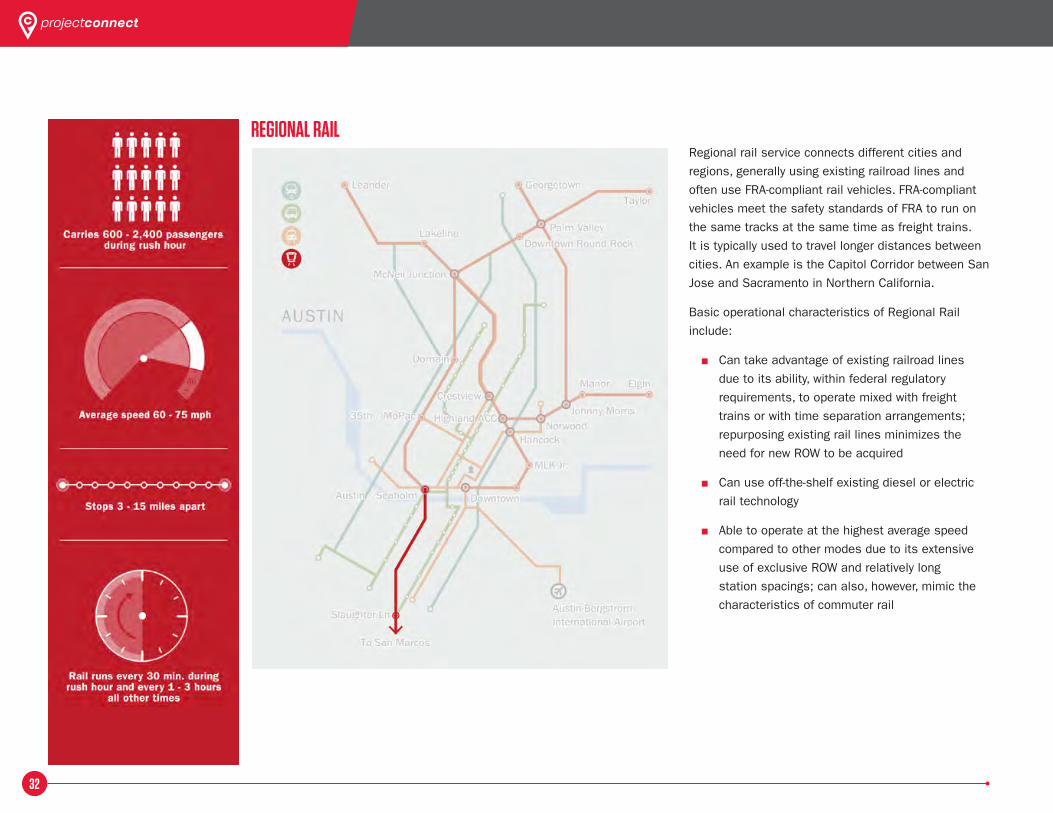
32
Regional rail service connects different cities and
regions, generally using existing railroad lines and
often use FRA-compliant rail vehicles. FRA-compliant
vehicles meet the safety standards of FRA to run on
the same tracks at the same time as freight trains.
It is typically used to travel longer distances between
cities. An example is the Capitol Corridor between San
Jose and Sacramento in Northern California.
Basic operational characteristics of Regional Rail
include:
■ Can take advantage of existing railroad lines
due to its ability, within federal regulatory
requirements, to operate mixed with freight
trains or with time separation arrangements;
repurposing existing rail lines minimizes the
need for new ROW to be acquired
■ Can use off-the-shelf existing diesel or electric
rail technology
■ Able to operate at the highest average speed
compared to other modes due to its extensive
use of exclusive ROW and relatively long
station spacings; can also, however, mimic the
characteristics of commuter rail
REgiONal Rail
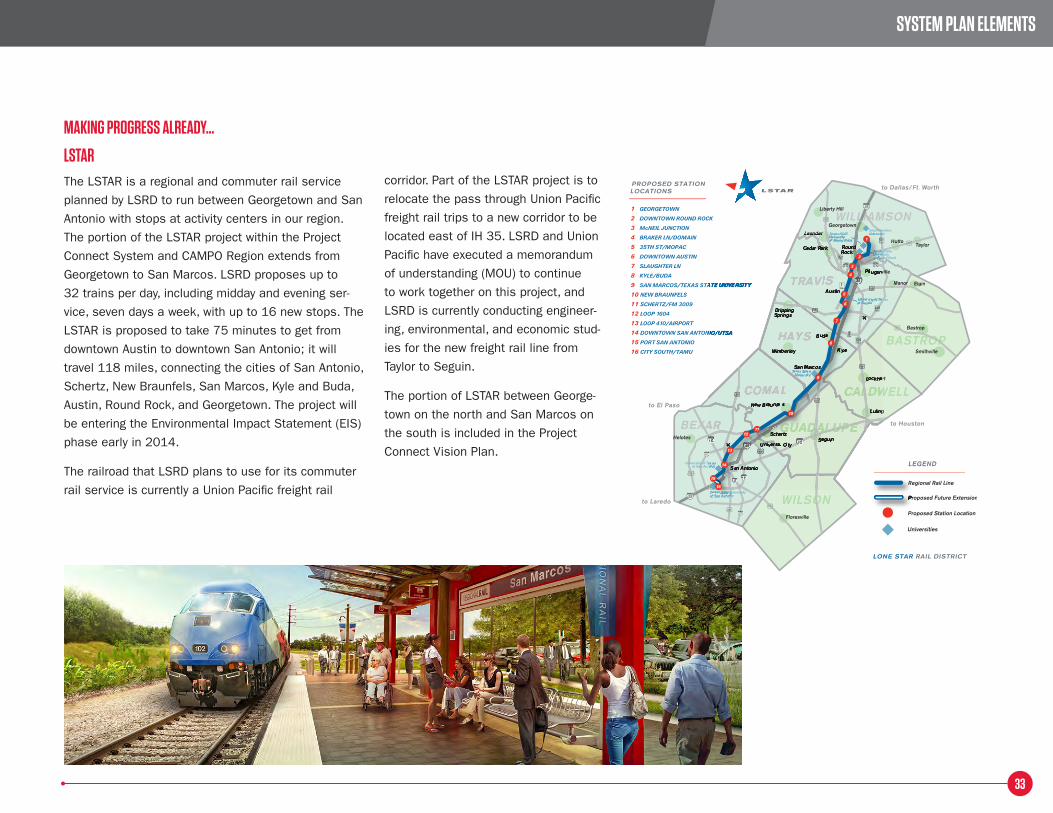
33
MakiNg PROgRESS alREaDy…
lSTaRThe LSTAR is a regional and commuter rail service
planned by LSRD to run between Georgetown and San
Antonio with stops at activity centers in our region.
The portion of the LSTAR project within the Project
Connect System and CAMPO Region extends from
Georgetown to San Marcos. LSRD proposes up to
32 trains per day, including midday and evening ser-
vice, seven days a week, with up to 16 new stops. The
LSTAR is proposed to take 75 minutes to get from
downtown Austin to downtown San Antonio; it will
travel 118 miles, connecting the cities of San Antonio,
Schertz, New Braunfels, San Marcos, Kyle and Buda,
Austin, Round Rock, and Georgetown. The project will
be entering the Environmental Impact Statement (EIS)
phase early in 2014.
The railroad that LSRD plans to use for its commuter
rail service is currently a Union Pacific freight rail
corridor. Part of the LSTAR project is to
relocate the pass through Union Pacific
freight rail trips to a new corridor to be
located east of IH 35. LSRD and Union
Pacific have executed a memorandum
of understanding (MOU) to continue
to work together on this project, and
LSRD is currently conducting engineer-
ing, environmental, and economic stud-
ies for the new freight rail line from
Taylor to Seguin.
The portion of LSTAR between George-
town on the north and San Marcos on
the south is included in the Project
Connect Vision Plan.
SySTEM PlaN ElEMENTS
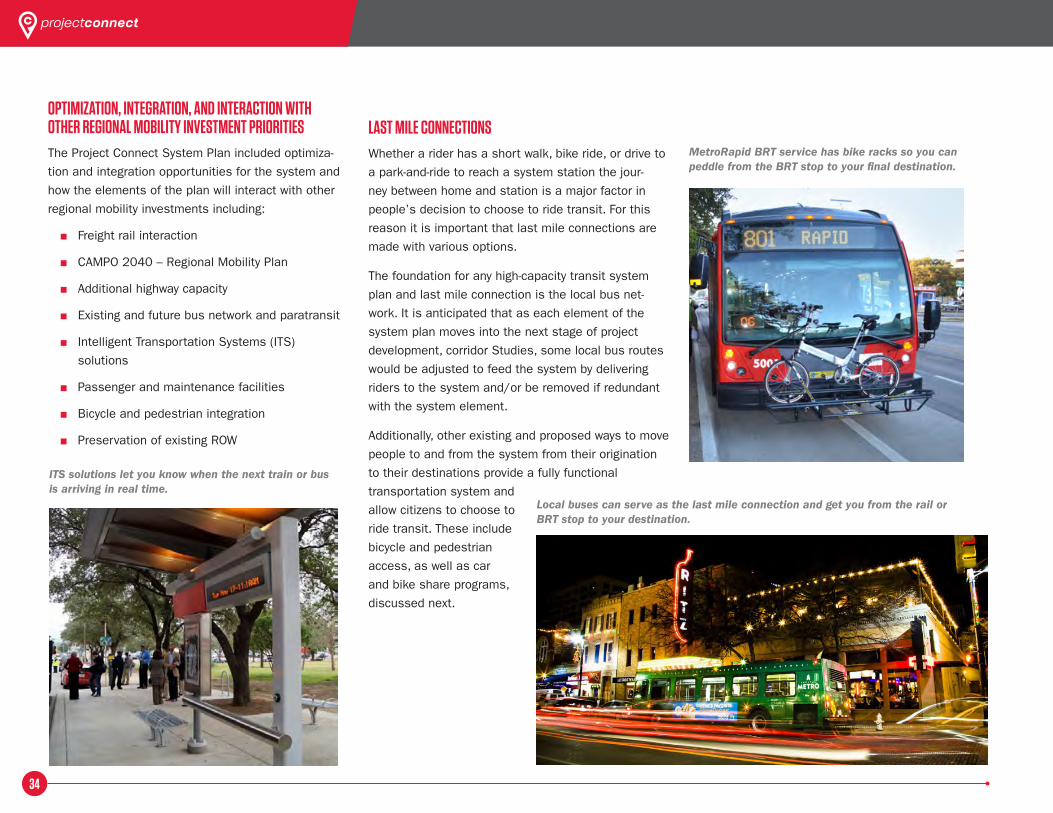
34
OPTiMizaTiON, iNTEgRaTiON, aND iNTERaCTiON WiTH OTHER REgiONal MObiliTy iNvESTMENT PRiORiTiESThe Project Connect System Plan included optimiza-
tion and integration opportunities for the system and
how the elements of the plan will interact with other
regional mobility investments including:
■ Freight rail interaction
■ CAMPO 2040 – Regional Mobility Plan
■ Additional highway capacity
■ Existing and future bus network and paratransit
■ Intelligent Transportation Systems (ITS)
solutions
■ Passenger and maintenance facilities
■ Bicycle and pedestrian integration
■ Preservation of existing ROW
laST MilE CONNECTiONSWhether a rider has a short walk, bike ride, or drive to
a park-and-ride to reach a system station the jour-
ney between home and station is a major factor in
people’s decision to choose to ride transit. For this
reason it is important that last mile connections are
made with various options.
The foundation for any high-capacity transit system
plan and last mile connection is the local bus net-
work. It is anticipated that as each element of the
system plan moves into the next stage of project
development, corridor Studies, some local bus routes
would be adjusted to feed the system by delivering
riders to the system and/or be removed if redundant
with the system element.
Additionally, other existing and proposed ways to move
people to and from the system from their origination
to their destinations provide a fully functional
transportation system and
allow citizens to choose to
ride transit. These include
bicycle and pedestrian
access, as well as car
and bike share programs,
discussed next.
Local buses can serve as the last mile connection and get you from the rail or BRT stop to your destination.
MetroRapid BRT service has bike racks so you can peddle from the BRT stop to your final destination.
ITS solutions let you know when the next train or bus is arriving in real time.
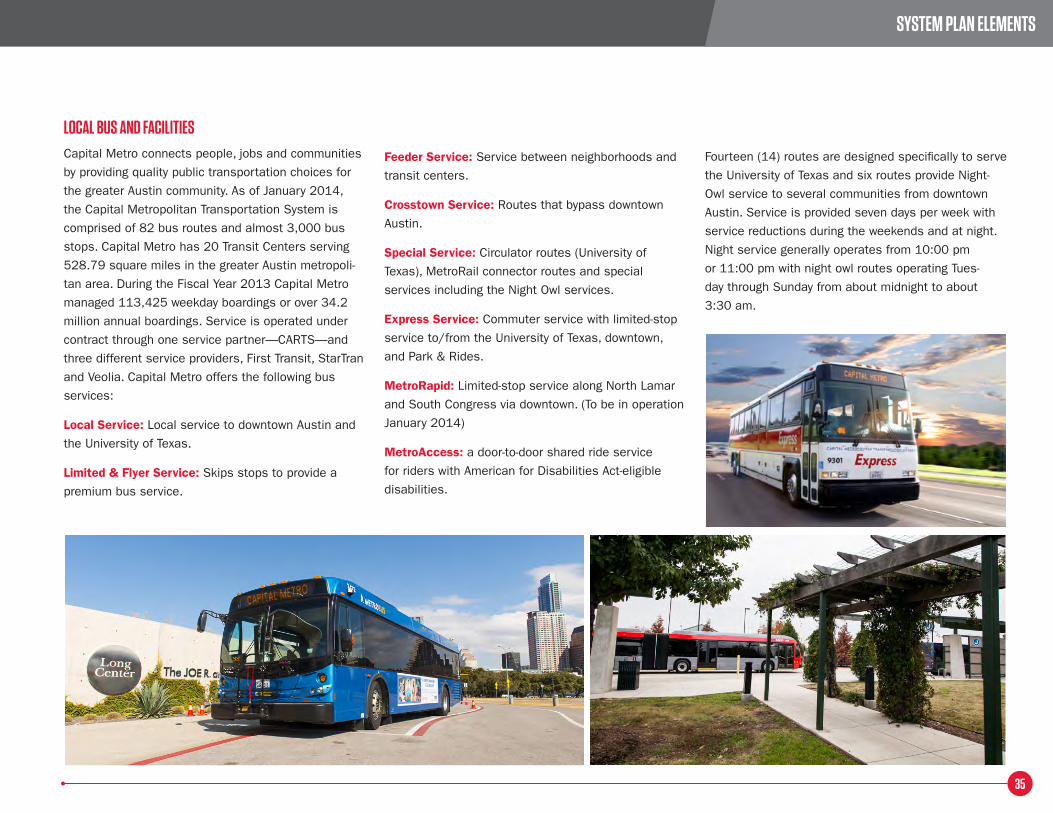
35
lOCal buS aND faCiliTiESCapital Metro connects people, jobs and communities
by providing quality public transportation choices for
the greater Austin community. As of January 2014,
the Capital Metropolitan Transportation System is
comprised of 82 bus routes and almost 3,000 bus
stops. Capital Metro has 20 Transit Centers serving
528.79 square miles in the greater Austin metropoli-
tan area. During the Fiscal Year 2013 Capital Metro
managed 113,425 weekday boardings or over 34.2
million annual boardings. Service is operated under
contract through one service partner—CARTS—and
three different service providers, First Transit, StarTran
and Veolia. Capital Metro offers the following bus
services:
Local Service: Local service to downtown Austin and
the University of Texas.
Limited & Flyer Service: Skips stops to provide a
premium bus service.
Feeder Service: Service between neighborhoods and
transit centers.
Crosstown Service: Routes that bypass downtown
Austin.
Special Service: Circulator routes (University of
Texas), MetroRail connector routes and special
services including the Night Owl services.
Express Service: Commuter service with limited-stop
service to/from the University of Texas, downtown,
and Park & Rides.
MetroRapid: Limited-stop service along North Lamar
and South Congress via downtown. (To be in operation
January 2014)
MetroAccess: a door-to-door shared ride service
for riders with American for Disabilities Act-eligible
disabilities.
Fourteen (14) routes are designed specifically to serve
the University of Texas and six routes provide Night-
Owl service to several communities from downtown
Austin. Service is provided seven days per week with
service reductions during the weekends and at night.
Night service generally operates from 10:00 pm
or 11:00 pm with night owl routes operating Tues-
day through Sunday from about midnight to about
3:30 am.
SySTEM PlaN ElEMENTS
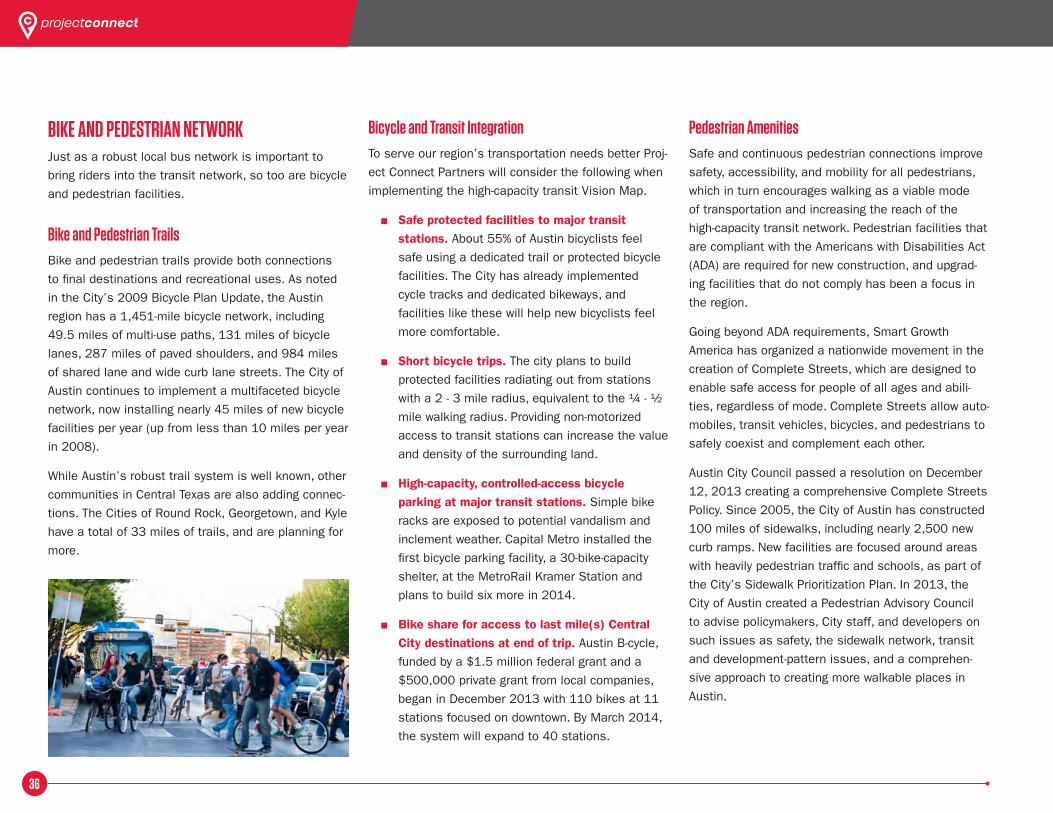
36
bikE aND PEDESTRiaN NETWORkJust as a robust local bus network is important to
bring riders into the transit network, so too are bicycle
and pedestrian facilities.
bike and Pedestrian TrailsBike and pedestrian trails provide both connections
to final destinations and recreational uses. As noted
in the City’s 2009 Bicycle Plan Update, the Austin
region has a 1,451-mile bicycle network, including
49.5 miles of multi-use paths, 131 miles of bicycle
lanes, 287 miles of paved shoulders, and 984 miles
of shared lane and wide curb lane streets. The City of
Austin continues to implement a multifaceted bicycle
network, now installing nearly 45 miles of new bicycle
facilities per year (up from less than 10 miles per year
in 2008).
While Austin’s robust trail system is well known, other
communities in Central Texas are also adding connec-
tions. The Cities of Round Rock, Georgetown, and Kyle
have a total of 33 miles of trails, and are planning for
more.
bicycle and Transit integrationTo serve our region’s transportation needs better Proj-
ect Connect Partners will consider the following when
implementing the high-capacity transit Vision Map.
■ Safe protected facilities to major transit stations. About 55% of Austin bicyclists feel
safe using a dedicated trail or protected bicycle
facilities. The City has already implemented
cycle tracks and dedicated bikeways, and
facilities like these will help new bicyclists feel
more comfortable.
■ Short bicycle trips. The city plans to build
protected facilities radiating out from stations
with a 2 - 3 mile radius, equivalent to the ¼ - ½
mile walking radius. Providing non-motorized
access to transit stations can increase the value
and density of the surrounding land.
■ High-capacity, controlled-access bicycle parking at major transit stations. Simple bike
racks are exposed to potential vandalism and
inclement weather. Capital Metro installed the
first bicycle parking facility, a 30-bike-capacity
shelter, at the MetroRail Kramer Station and
plans to build six more in 2014.
■ Bike share for access to last mile(s) Central City destinations at end of trip. Austin B-cycle,
funded by a $1.5 million federal grant and a
$500,000 private grant from local companies,
began in December 2013 with 110 bikes at 11
stations focused on downtown. By March 2014,
the system will expand to 40 stations.
Pedestrian amenitiesSafe and continuous pedestrian connections improve
safety, accessibility, and mobility for all pedestrians,
which in turn encourages walking as a viable mode
of transportation and increasing the reach of the
high-capacity transit network. Pedestrian facilities that
are compliant with the Americans with Disabilities Act
(ADA) are required for new construction, and upgrad-
ing facilities that do not comply has been a focus in
the region.
Going beyond ADA requirements, Smart Growth
America has organized a nationwide movement in the
creation of Complete Streets, which are designed to
enable safe access for people of all ages and abili-
ties, regardless of mode. Complete Streets allow auto-
mobiles, transit vehicles, bicycles, and pedestrians to
safely coexist and complement each other.
Austin City Council passed a resolution on December
12, 2013 creating a comprehensive Complete Streets
Policy. Since 2005, the City of Austin has constructed
100 miles of sidewalks, including nearly 2,500 new
curb ramps. New facilities are focused around areas
with heavily pedestrian traffic and schools, as part of
the City’s Sidewalk Prioritization Plan. In 2013, the
City of Austin created a Pedestrian Advisory Council
to advise policymakers, City staff, and developers on
such issues as safety, the sidewalk network, transit
and development-pattern issues, and a comprehen-
sive approach to creating more walkable places in
Austin.
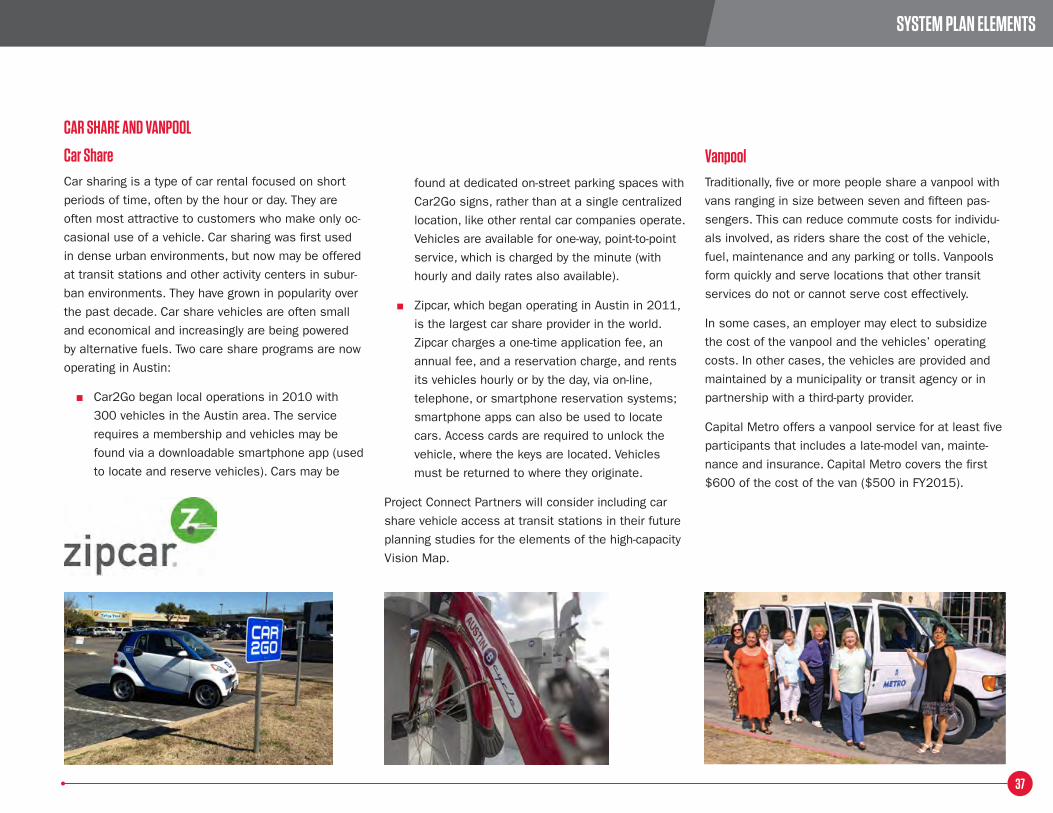
37
CaR SHaRE aND vaNPOOl
Car ShareCar sharing is a type of car rental focused on short
periods of time, often by the hour or day. They are
often most attractive to customers who make only oc-
casional use of a vehicle. Car sharing was first used
in dense urban environments, but now may be offered
at transit stations and other activity centers in subur-
ban environments. They have grown in popularity over
the past decade. Car share vehicles are often small
and economical and increasingly are being powered
by alternative fuels. Two care share programs are now
operating in Austin:
■ Car2Go began local operations in 2010 with
300 vehicles in the Austin area. The service
requires a membership and vehicles may be
found via a downloadable smartphone app (used
to locate and reserve vehicles). Cars may be
found at dedicated on-street parking spaces with
Car2Go signs, rather than at a single centralized
location, like other rental car companies operate.
Vehicles are available for one-way, point-to-point
service, which is charged by the minute (with
hourly and daily rates also available).
■ Zipcar, which began operating in Austin in 2011,
is the largest car share provider in the world.
Zipcar charges a one-time application fee, an
annual fee, and a reservation charge, and rents
its vehicles hourly or by the day, via on-line,
telephone, or smartphone reservation systems;
smartphone apps can also be used to locate
cars. Access cards are required to unlock the
vehicle, where the keys are located. Vehicles
must be returned to where they originate.
Project Connect Partners will consider including car
share vehicle access at transit stations in their future
planning studies for the elements of the high-capacity
Vision Map.
vanpoolTraditionally, five or more people share a vanpool with
vans ranging in size between seven and fifteen pas-
sengers. This can reduce commute costs for individu-
als involved, as riders share the cost of the vehicle,
fuel, maintenance and any parking or tolls. Vanpools
form quickly and serve locations that other transit
services do not or cannot serve cost effectively.
In some cases, an employer may elect to subsidize
the cost of the vanpool and the vehicles’ operating
costs. In other cases, the vehicles are provided and
maintained by a municipality or transit agency or in
partnership with a third-party provider.
Capital Metro offers a vanpool service for at least five
participants that includes a late-model van, mainte-
nance and insurance. Capital Metro covers the first
$600 of the cost of the van ($500 in FY2015).
SySTEM PlaN ElEMENTS
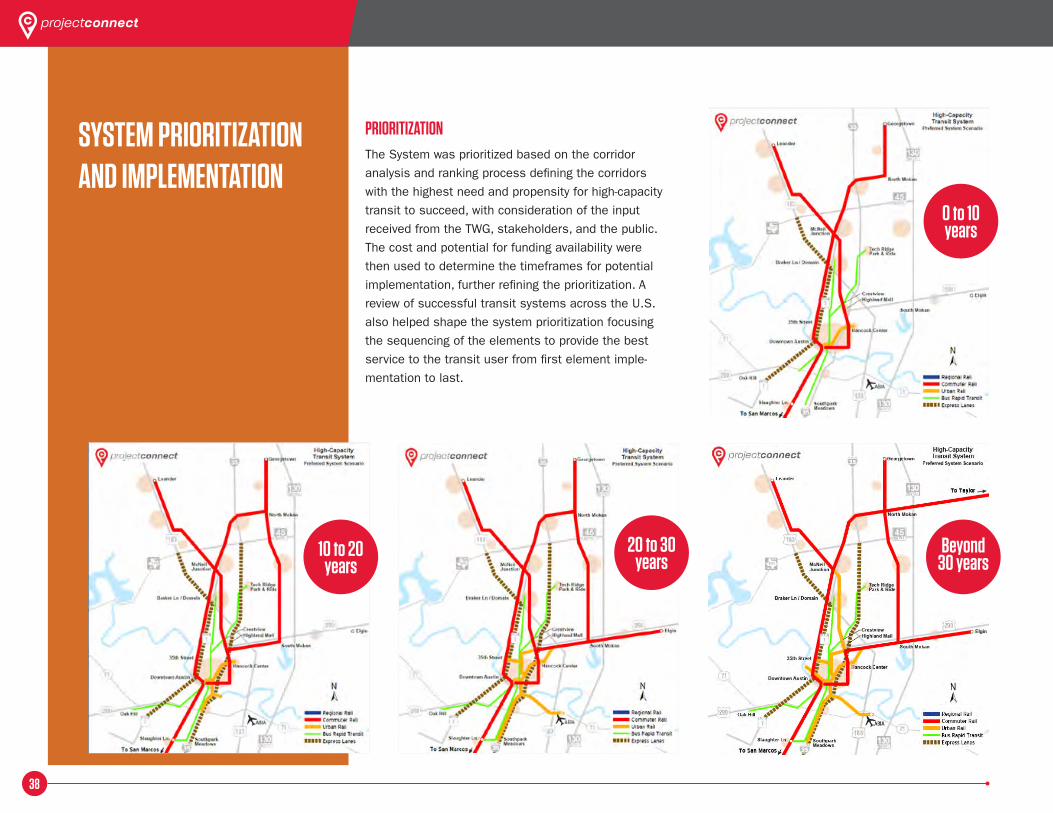
38
PRiORiTizaTiONThe System was prioritized based on the corridor
analysis and ranking process defining the corridors
with the highest need and propensity for high-capacity
transit to succeed, with consideration of the input
received from the TWG, stakeholders, and the public.
The cost and potential for funding availability were
then used to determine the timeframes for potential
implementation, further refining the prioritization. A
review of successful transit systems across the U.S.
also helped shape the system prioritization focusing
the sequencing of the elements to provide the best
service to the transit user from first element imple-
mentation to last.
SySTEM PRiORiTizaTiON aND iMPlEMENTaTiON
0 to 10 years
10 to 20 years
beyond 30 years
20 to 30 years
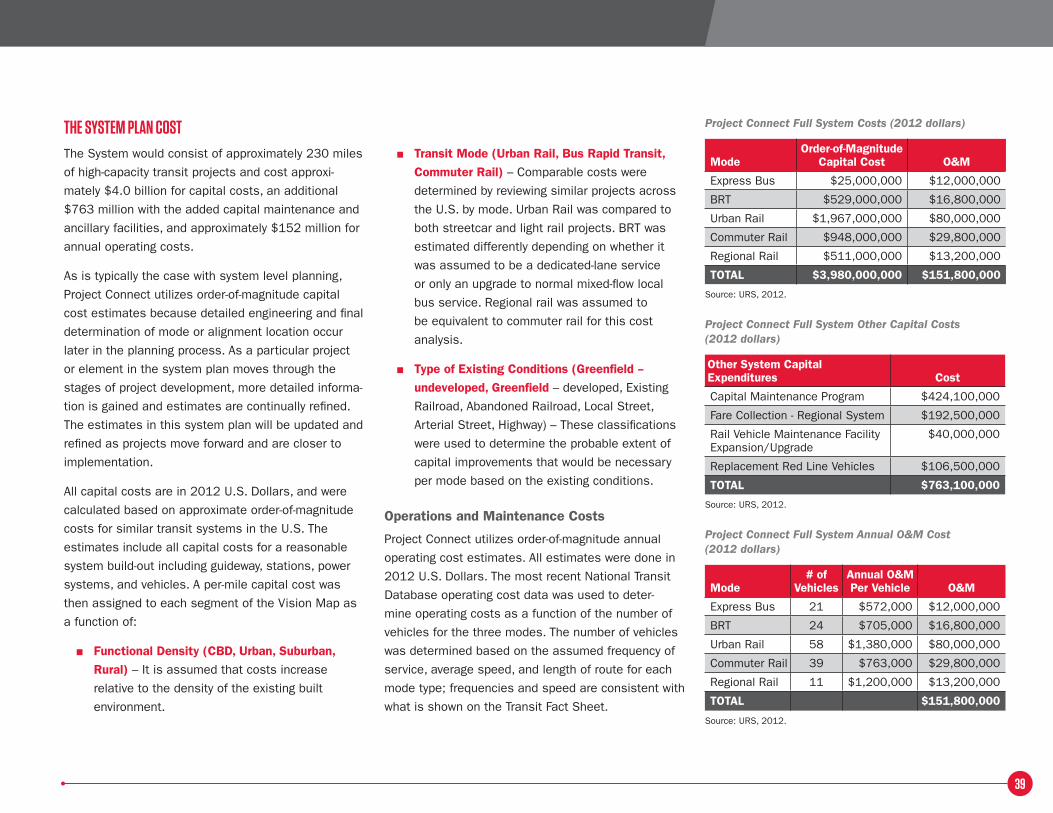
39
THE SySTEM PlaN COSTThe System would consist of approximately 230 miles
of high-capacity transit projects and cost approxi-
mately $4.0 billion for capital costs, an additional
$763 million with the added capital maintenance and
ancillary facilities, and approximately $152 million for
annual operating costs.
As is typically the case with system level planning,
Project Connect utilizes order-of-magnitude capital
cost estimates because detailed engineering and final
determination of mode or alignment location occur
later in the planning process. As a particular project
or element in the system plan moves through the
stages of project development, more detailed informa-
tion is gained and estimates are continually refined.
The estimates in this system plan will be updated and
refined as projects move forward and are closer to
implementation.
All capital costs are in 2012 U.S. Dollars, and were
calculated based on approximate order-of-magnitude
costs for similar transit systems in the U.S. The
estimates include all capital costs for a reasonable
system build-out including guideway, stations, power
systems, and vehicles. A per-mile capital cost was
then assigned to each segment of the Vision Map as
a function of:
■ Functional Density (CBD, Urban, Suburban, Rural) – It is assumed that costs increase
relative to the density of the existing built
environment.
■ Transit Mode (Urban Rail, Bus Rapid Transit, Commuter Rail) – Comparable costs were
determined by reviewing similar projects across
the U.S. by mode. Urban Rail was compared to
both streetcar and light rail projects. BRT was
estimated differently depending on whether it
was assumed to be a dedicated-lane service
or only an upgrade to normal mixed-flow local
bus service. Regional rail was assumed to
be equivalent to commuter rail for this cost
analysis.
■ Type of Existing Conditions (Greenfield – undeveloped, Greenfield – developed, Existing
Railroad, Abandoned Railroad, Local Street,
Arterial Street, Highway) – These classifications
were used to determine the probable extent of
capital improvements that would be necessary
per mode based on the existing conditions.
Operations and Maintenance Costs
Project Connect utilizes order-of-magnitude annual
operating cost estimates. All estimates were done in
2012 U.S. Dollars. The most recent National Transit
Database operating cost data was used to deter-
mine operating costs as a function of the number of
vehicles for the three modes. The number of vehicles
was determined based on the assumed frequency of
service, average speed, and length of route for each
mode type; frequencies and speed are consistent with
what is shown on the Transit Fact Sheet.
Project Connect Full System Costs (2012 dollars)
ModeOrder-of-Magnitude
Capital Cost O&M
Express Bus $25,000,000 $12,000,000
BRT $529,000,000 $16,800,000
Urban Rail $1,967,000,000 $80,000,000
Commuter Rail $948,000,000 $29,800,000
Regional Rail $511,000,000 $13,200,000
TOTAL $3,980,000,000 $151,800,000
Source: URS, 2012.
Project Connect Full System Other Capital Costs (2012 dollars)
Other System Capital Expenditures Cost
Capital Maintenance Program $424,100,000
Fare Collection - Regional System $192,500,000
Rail Vehicle Maintenance Facility Expansion/Upgrade
$40,000,000
Replacement Red Line Vehicles $106,500,000
TOTAL $763,100,000
Source: URS, 2012.
Project Connect Full System Annual O&M Cost (2012 dollars)
Mode# of
VehiclesAnnual O&M Per Vehicle O&M
Express Bus 21 $572,000 $12,000,000
BRT 24 $705,000 $16,800,000
Urban Rail 58 $1,380,000 $80,000,000
Commuter Rail 39 $763,000 $29,800,000
Regional Rail 11 $1,200,000 $13,200,000
TOTAL $151,800,000
Source: URS, 2012.
40
Typically when developing a financial plan for a long
range regional system plan, a broad-brush method is
employed due to the lack of detailed engineering and
final determination of mode or alignment location.
As a particular project or element in the system plan
moves through the stages of project development,
more detailed information is gained and estimates
are continually refined. The estimates in this system
plan are considered to represent the “envelope of
affordability” for the implementation of high-capacity
transit in our region.
The identification of funds continues as Corridor Stud-
ies are undertaken and/or as regional municipalities
provide feedback or support on funding sources.
CONCEPTual fuNDiNg PlaN aSSuMPTiONSDozens of funding plan iterations were tested and
were comprised of multiple combinations of bonds/
grants, project schedules and funding implementa-
tion to find an “envelope of affordability” that was
accepted by the TWG and partnering agencies.
fuNDiNg SOuRCES
Capital Metro’s Existing fundingPrior to investigating new sources of revenue, it is
helpful to understand Capital Metro’s existing revenue
stream. Similar to other transit agencies across the
country, sales taxes represent the largest component
of Capital Metro’s revenue, contributing approximately
80% of the revenue budget. Presently, this revenue is
limited by a statewide 2% limit on local option
sales taxes.
HOW DO WE Pay fOR THE SySTEM?
TWg guiding Principles for funding: ■ Communities that benefit from service should
participate financially – pay to play.
■ Financial contributions from benefiting
participants should be equitable – fair share/
equal effort.
■ Focus should be on revenue sources that
grow over time – pay as you grow.
■ FTA New Starts funding is awarded based on
a very competitive basis. It is assumed that
some transit investments will receive some
level of federal participation. For the purposes
of the Project Connect funding plan, it was
assumed that on average 25% of project
capital costs would be covered by federal
funding sources.
■ Utilizes authorized and enabled funding
sources prior to introducing new revenue
sources that require legislative action.
■ Integrated system implementation rather than
sequenced individual subsystems/modes.
■ Maintain and account for growth in the
existing Capital Metro System.
■ Farebox recovery based on industry standards
for each individual mode of service.
■ Cost assumptions incorporate an annual
capital maintenance program and the
implementation of transit system support
facilities and programs including: regional fare
structure system components, bus and rail
maintenance facilities, etc.
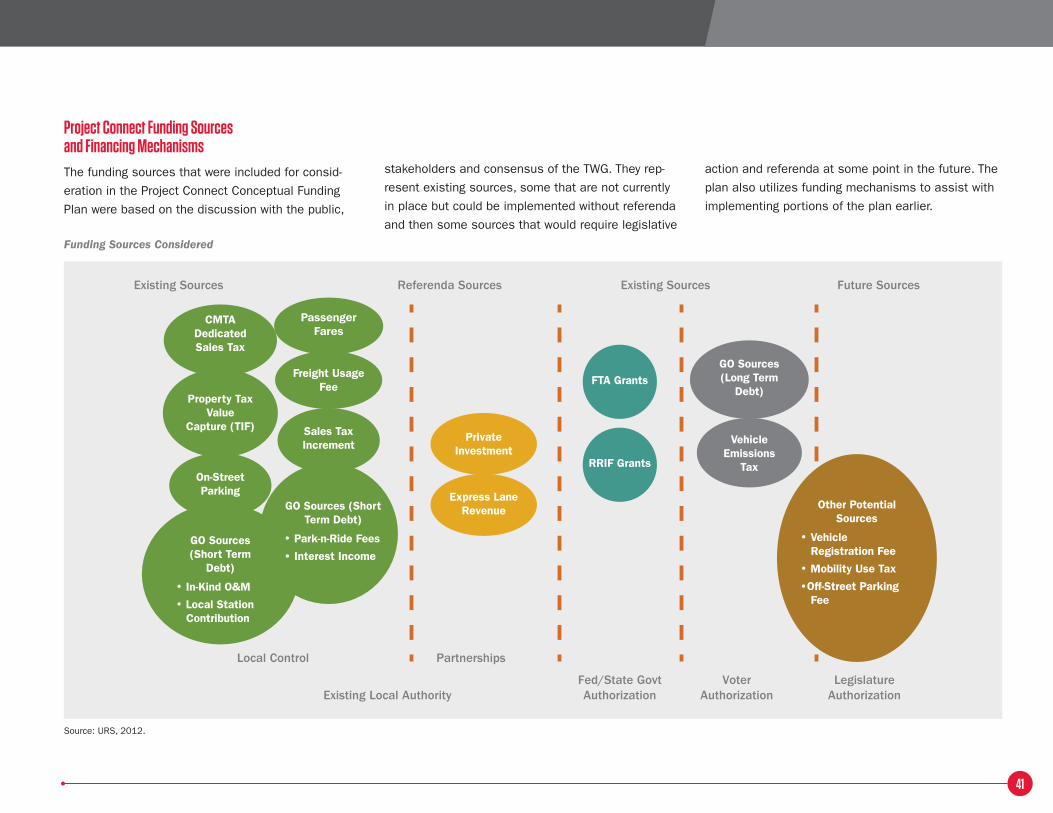
41
CMTA Dedicated Sales Tax
Property Tax Value
Capture (TIF)
GO Sources (Long Term
Debt)
GO Sources (Short Term
Debt)
• In-Kind O&M
• Local Station Contribution
Other Potential Sources
• Vehicle Registration Fee
• Mobility Use Tax
•Off-Street Parking Fee
GO Sources (Short Term Debt)
• Park-n-Ride Fees
• Interest Income
Vehicle Emissions
Tax
PassengerFares
On-StreetParking
Freight Usage Fee
Sales Tax Increment
Private Investment
FTA Grants
RRIF Grants
Express Lane Revenue
Existing Sources
Local Control Partnerships
Existing Local AuthorityFed/State GovtAuthorization
VoterAuthorization
LegislatureAuthorization
Referenda Sources Existing Sources Future Sources
Project Connect funding Sources and financing MechanismsThe funding sources that were included for consid-
eration in the Project Connect Conceptual Funding
Plan were based on the discussion with the public,
stakeholders and consensus of the TWG. They rep-
resent existing sources, some that are not currently
in place but could be implemented without referenda
and then some sources that would require legislative
action and referenda at some point in the future. The
plan also utilizes funding mechanisms to assist with
implementing portions of the plan earlier.
Funding Sources Considered
Source: URS, 2012.
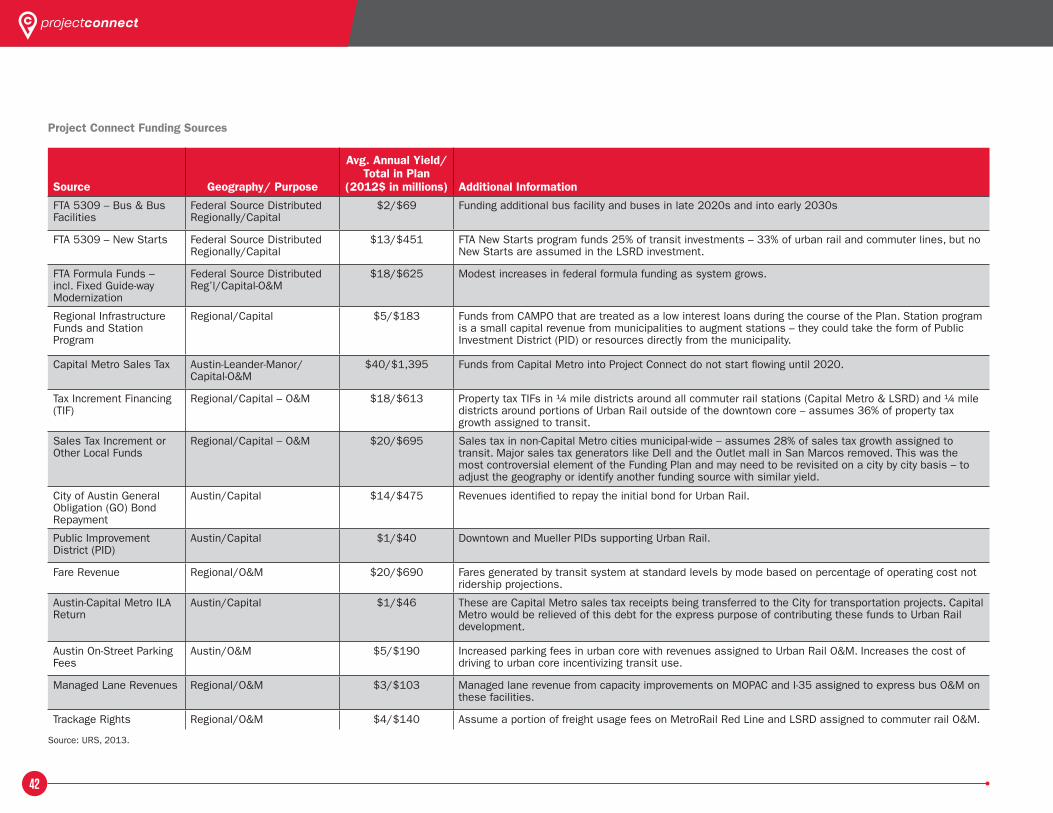
42
Project Connect Funding Sources
Source Geography/ Purpose
Avg. Annual Yield/ Total in Plan
(2012$ in millions) Additional Information
FTA 5309 – Bus & Bus Facilities
Federal Source Distributed Regionally/Capital
$2/$69 Funding additional bus facility and buses in late 2020s and into early 2030s
FTA 5309 – New Starts Federal Source Distributed Regionally/Capital
$13/$451 FTA New Starts program funds 25% of transit investments – 33% of urban rail and commuter lines, but no New Starts are assumed in the LSRD investment.
FTA Formula Funds – incl. Fixed Guide-way Modernization
Federal Source Distributed Reg’l/Capital-O&M
$18/$625 Modest increases in federal formula funding as system grows.
Regional Infrastructure Funds and Station Program
Regional/Capital $5/$183 Funds from CAMPO that are treated as a low interest loans during the course of the Plan. Station program is a small capital revenue from municipalities to augment stations – they could take the form of Public Investment District (PID) or resources directly from the municipality.
Capital Metro Sales Tax Austin-Leander-Manor/Capital-O&M
$40/$1,395 Funds from Capital Metro into Project Connect do not start flowing until 2020.
Tax Increment Financing (TIF)
Regional/Capital – O&M $18/$613 Property tax TIFs in ¼ mile districts around all commuter rail stations (Capital Metro & LSRD) and ¼ mile districts around portions of Urban Rail outside of the downtown core – assumes 36% of property tax growth assigned to transit.
Sales Tax Increment or Other Local Funds
Regional/Capital – O&M $20/$695 Sales tax in non-Capital Metro cities municipal-wide – assumes 28% of sales tax growth assigned to transit. Major sales tax generators like Dell and the Outlet mall in San Marcos removed. This was the most controversial element of the Funding Plan and may need to be revisited on a city by city basis – to adjust the geography or identify another funding source with similar yield.
City of Austin General Obligation (GO) Bond Repayment
Austin/Capital $14/$475 Revenues identified to repay the initial bond for Urban Rail.
Public Improvement District (PID)
Austin/Capital $1/$40 Downtown and Mueller PIDs supporting Urban Rail.
Fare Revenue Regional/O&M $20/$690 Fares generated by transit system at standard levels by mode based on percentage of operating cost not ridership projections.
Austin-Capital Metro ILA Return
Austin/Capital $1/$46 These are Capital Metro sales tax receipts being transferred to the City for transportation projects. Capital Metro would be relieved of this debt for the express purpose of contributing these funds to Urban Rail development.
Austin On-Street Parking Fees
Austin/O&M $5/$190 Increased parking fees in urban core with revenues assigned to Urban Rail O&M. Increases the cost of driving to urban core incentivizing transit use.
Managed Lane Revenues Regional/O&M $3/$103 Managed lane revenue from capacity improvements on MOPAC and I-35 assigned to express bus O&M on these facilities.
Trackage Rights Regional/O&M $4/$140 Assume a portion of freight usage fees on MetroRail Red Line and LSRD assigned to commuter rail O&M.
Source: URS, 2013.
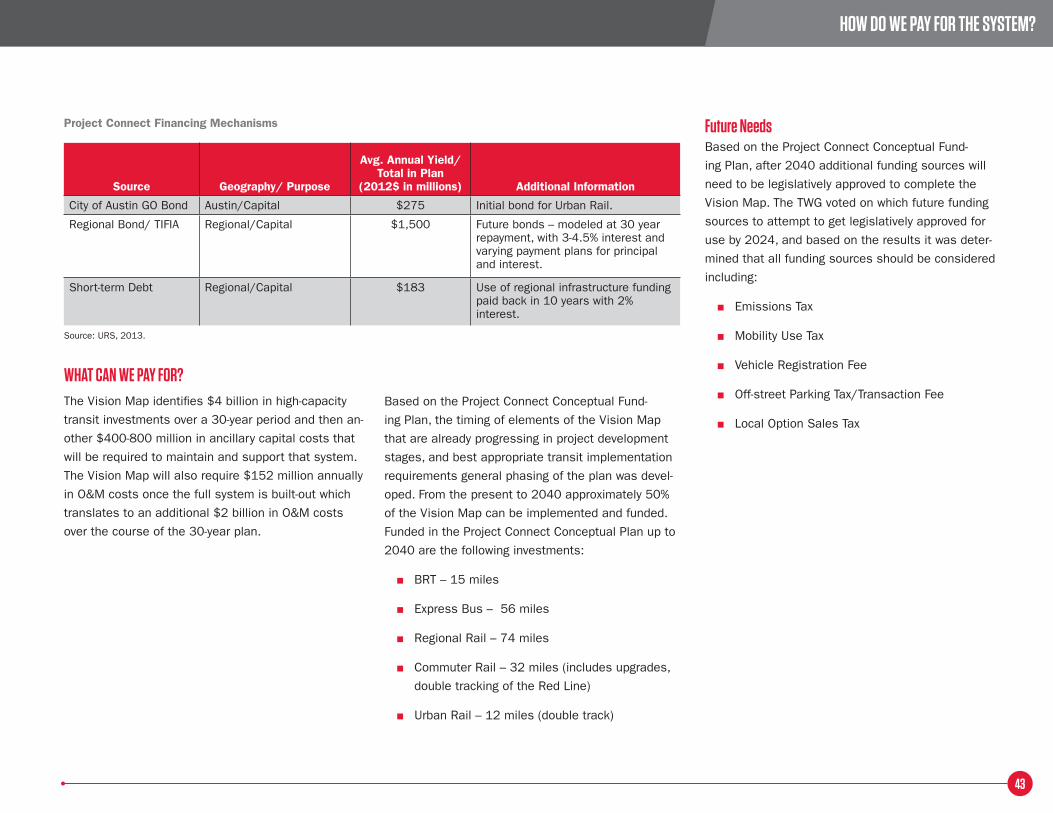
43
Project Connect Financing Mechanisms
Source Geography/ Purpose
Avg. Annual Yield/ Total in Plan
(2012$ in millions) Additional Information
City of Austin GO Bond Austin/Capital $275 Initial bond for Urban Rail.
Regional Bond/ TIFIA Regional/Capital $1,500 Future bonds – modeled at 30 year repayment, with 3-4.5% interest and varying payment plans for principal and interest.
Short-term Debt Regional/Capital $183 Use of regional infrastructure funding paid back in 10 years with 2% interest.
Source: URS, 2013.
WHaT CaN WE Pay fOR?The Vision Map identifies $4 billion in high-capacity
transit investments over a 30-year period and then an-
other $400-800 million in ancillary capital costs that
will be required to maintain and support that system.
The Vision Map will also require $152 million annually
in O&M costs once the full system is built-out which
translates to an additional $2 billion in O&M costs
over the course of the 30-year plan.
Based on the Project Connect Conceptual Fund-
ing Plan, the timing of elements of the Vision Map
that are already progressing in project development
stages, and best appropriate transit implementation
requirements general phasing of the plan was devel-
oped. From the present to 2040 approximately 50%
of the Vision Map can be implemented and funded.
Funded in the Project Connect Conceptual Plan up to
2040 are the following investments:
■ BRT – 15 miles
■ Express Bus – 56 miles
■ Regional Rail – 74 miles
■ Commuter Rail – 32 miles (includes upgrades,
double tracking of the Red Line)
■ Urban Rail – 12 miles (double track)
future NeedsBased on the Project Connect Conceptual Fund-
ing Plan, after 2040 additional funding sources will
need to be legislatively approved to complete the
Vision Map. The TWG voted on which future funding
sources to attempt to get legislatively approved for
use by 2024, and based on the results it was deter-
mined that all funding sources should be considered
including:
■ Emissions Tax
■ Mobility Use Tax
■ Vehicle Registration Fee
■ Off-street Parking Tax/Transaction Fee
■ Local Option Sales Tax
HOW DO WE Pay fOR THE SySTEM?
44
fuNDiNg: TWg PRiORiTiES aND RECOMMENDaTiONS1. Partners in the region should be required to participate financially if they will
benefit from the system (“pay to play”).
2. Contributions from participating communities should be equitable (each pay a “fair share” or make an “equal effort” in funding).
3. Revenue sources used should grow with the community’s growth (“pay as you grow”).
4. PROPERTY TAX VALUE CAPTURE DISTRICTS [i.e., tax increment financing (TIF) districts such as Tax Increment Reinvestment Zones (TIRZ) or Transportation Infrastructure Zones (TIZ)] at rail stations are a regionally acceptable local funding source for vision.
5. SALES TAX INCREMENT ALLOCATION is a regionally acceptable local funding source for vision.
6. PRIVATE INVESTMENT is a regionally acceptable local funding source for vision.
7. ON-STREET PARKING is a regionally acceptable local funding source for vision.
8. New funding sources should be considered in the future as identified below (these may require legislative approval/change):
■ Emissions Tax
■ Vehicle Registration Fee
■ Local Option Sales Tax
■ Mobility Use Tax
■ Off-street Parking Tax/Transaction Fee
9. Seeking new revenue sources for use by 2024 is a reasonable approach.
10. The conceptual system funding plan is viable and reasonable.
11. Funding sources in the conceptual plan include:
■ Federal New/Small Starts (25% of capital costs on average)
■ Passenger Fares
■ Freight Usage Fees
■ Value Capture – Tax Increment Financing (TIF) districts such as Tax Increment Reinvestment Zones (TIRZ) or Transportation Infrastructure Zones (TIZ), Public Improvement District (PID), Municipal Management District (MMD)
■ Sales Tax Increment Allocation – Sets level of participation from jurisdiction but each jurisdiction could use other funding source if desired to meet set level
■ On Street Parking Fees
■ Capital Metro Sales Tax
■ City of Austin General Obligation (GO) Bonds Funding
■ Private Investment (Public Improvement Districts/Municipal Management Districts)
■ Express Lane Revenues
■ Regional Infrastructure Funding (CAMPO)
12. Financial Capacity
■ Identified sources within existing jurisdictional legal authority
■ Funds approximately 49% of the Vision Map
■ Components:
– BRT – 15 miles
– Express Bus – 56 miles
– Regional Rail – 74 miles
– Commuter Rail – 32 miles (upgrades, double tracking)
– Urban Rail – 12 miles (double track)
– Maintenance facilities, fare collection, replacement vehicles
■ Funding from Capital Metro for new high-capacity transit projects is
contingent on current local bus and MetroRail Red Line services being fully
funded.
■ Utilizes bonds (would require referendum) and federal Transportation
Infrastructure Finance and Innovation Act (TIFIA) loans to establish
financial capacity for major expenditures
■ Adding an additional new funding source in 2024 potentially extends
financial capacity to 60% of the investments outlined in the Vision Map,
along with additional operating funds
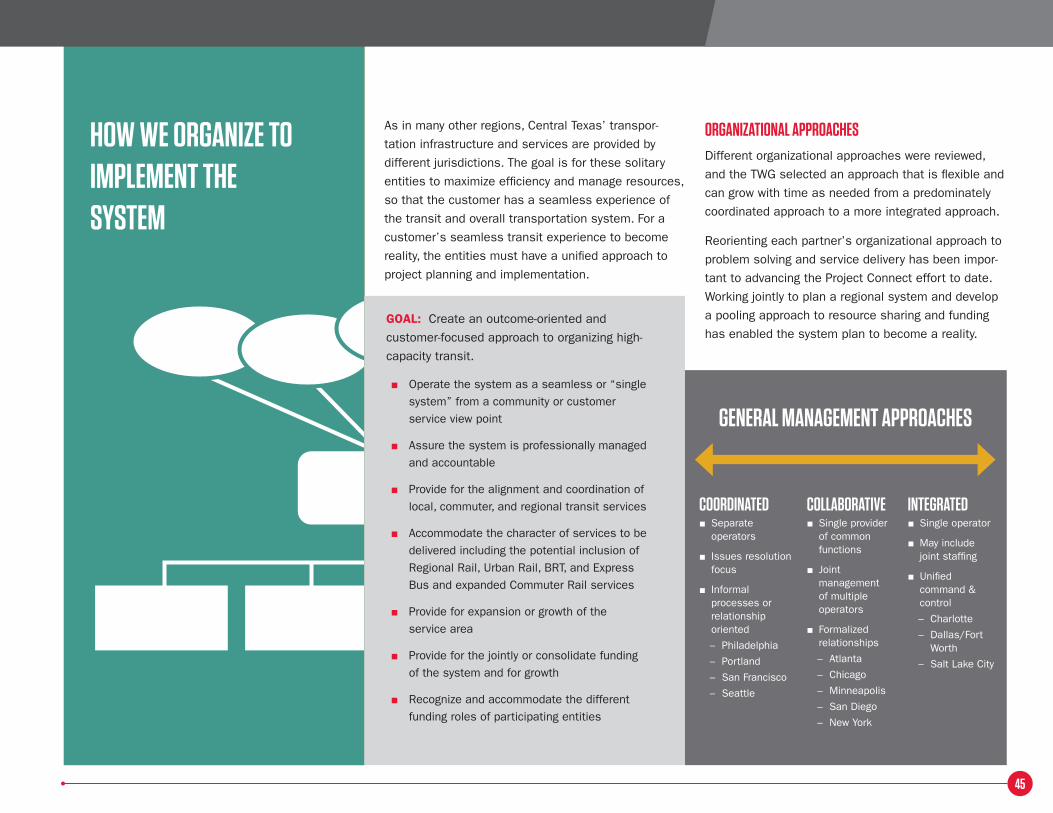
HOW WE ORgaNizE TO iMPlEMENT THE SySTEM
45
As in many other regions, Central Texas’ transpor-
tation infrastructure and services are provided by
different jurisdictions. The goal is for these solitary
entities to maximize efficiency and manage resources,
so that the customer has a seamless experience of
the transit and overall transportation system. For a
customer’s seamless transit experience to become
reality, the entities must have a unified approach to
project planning and implementation.
ORgaNizaTiONal aPPROaCHESDifferent organizational approaches were reviewed,
and the TWG selected an approach that is flexible and
can grow with time as needed from a predominately
coordinated approach to a more integrated approach.
Reorienting each partner’s organizational approach to
problem solving and service delivery has been impor-
tant to advancing the Project Connect effort to date.
Working jointly to plan a regional system and develop
a pooling approach to resource sharing and funding
has enabled the system plan to become a reality. GOAL: Create an outcome-oriented and
customer-focused approach to organizing high-
capacity transit.
■ Operate the system as a seamless or “single system” from a community or customer service view point
■ Assure the system is professionally managed and accountable
■ Provide for the alignment and coordination of local, commuter, and regional transit services
■ Accommodate the character of services to be delivered including the potential inclusion of Regional Rail, Urban Rail, BRT, and Express Bus and expanded Commuter Rail services
■ Provide for expansion or growth of the service area
■ Provide for the jointly or consolidate funding of the system and for growth
■ Recognize and accommodate the different funding roles of participating entities
COORDiNaTED ■ Separate operators
■ Issues resolution focus
■ Informal processes or relationship oriented
– Philadelphia
– Portland
– San Francisco
– Seattle
COllabORaTivE ■ Single provider of common functions
■ Joint management of multiple operators
■ Formalized relationships
– Atlanta
– Chicago
– Minneapolis
– San Diego
– New York
iNTEgRaTED ■ Single operator
■ May include joint staffing
■ Unified command & control
– Charlotte
– Dallas/Fort Worth
– Salt Lake City
gENERal MaNagEMENT aPPROaCHES
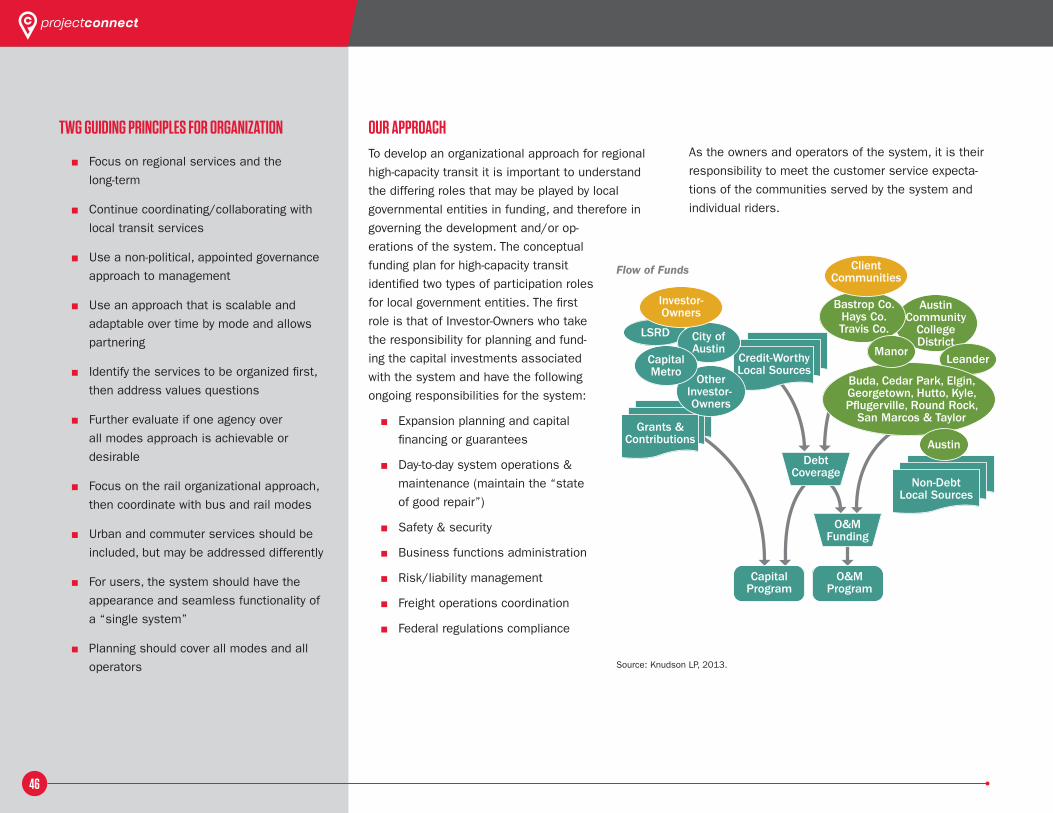
46
OuR aPPROaCHTo develop an organizational approach for regional
high-capacity transit it is important to understand
the differing roles that may be played by local
governmental entities in funding, and therefore in
governing the development and/or op-
erations of the system. The conceptual
funding plan for high-capacity transit
identified two types of participation roles
for local government entities. The first
role is that of Investor-Owners who take
the responsibility for planning and fund-
ing the capital investments associated
with the system and have the following
ongoing responsibilities for the system:
■ Expansion planning and capital
financing or guarantees
■ Day-to-day system operations &
maintenance (maintain the “state
of good repair”)
■ Safety & security
■ Business functions administration
■ Risk/liability management
■ Freight operations coordination
■ Federal regulations compliance
As the owners and operators of the system, it is their
responsibility to meet the customer service expecta-
tions of the communities served by the system and
individual riders.
TWg guiDiNg PRiNCiPlES fOR ORgaNizaTiON
■ Focus on regional services and the
long-term
■ Continue coordinating/collaborating with
local transit services
■ Use a non-political, appointed governance
approach to management
■ Use an approach that is scalable and
adaptable over time by mode and allows
partnering
■ Identify the services to be organized first,
then address values questions
■ Further evaluate if one agency over
all modes approach is achievable or
desirable
■ Focus on the rail organizational approach,
then coordinate with bus and rail modes
■ Urban and commuter services should be
included, but may be addressed differently
■ For users, the system should have the
appearance and seamless functionality of
a “single system”
■ Planning should cover all modes and all
operators
Credit-Worthy Local Sources
Grants & Contributions
Capital Program
O&MProgram
O&MFunding
Debt Coverage
Non-Debt Local Sources
LSRD
Other Investor-Owners
City of Austin
Capital Metro
Investor- Owners
Austin Community
College District
Leander
Bastrop Co.Hays Co.Travis Co.
Buda, Cedar Park, Elgin, Georgetown, Hutto, Kyle, Pflugerville, Round Rock,
San Marcos & Taylor
Client Communities
Manor
Austin
Flow of Funds
Source: Knudson LP, 2013.
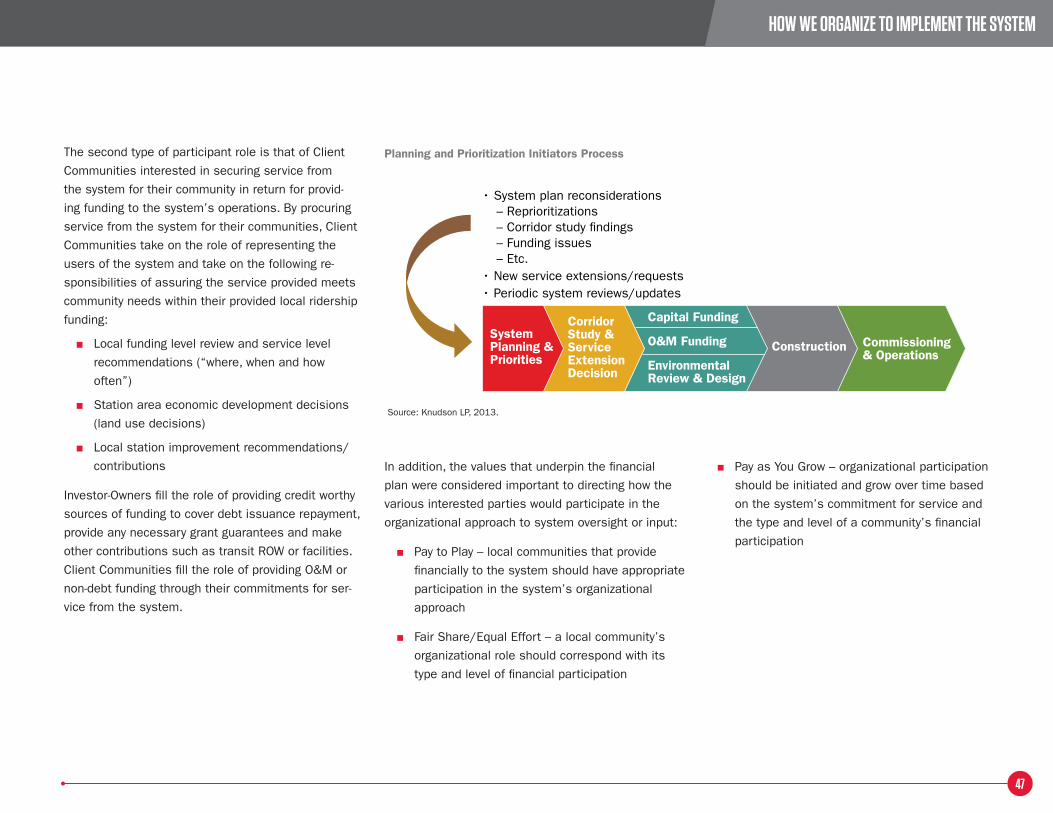
47
The second type of participant role is that of Client
Communities interested in securing service from
the system for their community in return for provid-
ing funding to the system’s operations. By procuring
service from the system for their communities, Client
Communities take on the role of representing the
users of the system and take on the following re-
sponsibilities of assuring the service provided meets
community needs within their provided local ridership
funding:
■ Local funding level review and service level
recommendations (“where, when and how
often”)
■ Station area economic development decisions
(land use decisions)
■ Local station improvement recommendations/
contributions
Investor-Owners fill the role of providing credit worthy
sources of funding to cover debt issuance repayment,
provide any necessary grant guarantees and make
other contributions such as transit ROW or facilities.
Client Communities fill the role of providing O&M or
non-debt funding through their commitments for ser-
vice from the system.
In addition, the values that underpin the financial
plan were considered important to directing how the
various interested parties would participate in the
organizational approach to system oversight or input:
■ Pay to Play – local communities that provide
financially to the system should have appropriate
participation in the system’s organizational
approach
■ Fair Share/Equal Effort – a local community’s
organizational role should correspond with its
type and level of financial participation
■ Pay as You Grow – organizational participation
should be initiated and grow over time based
on the system’s commitment for service and
the type and level of a community’s financial
participation
System Planning & Priorities
Corridor Study & Service Extension Decision
Commissioning & Operations
Capital Funding
O&M Funding
Environmental Review & Design
Construction
• System plan reconsiderations – Reprioritizations – Corridor study findings – Funding issues – Etc.• New service extensions/requests• Periodic system reviews/updates
HOW WE ORgaNizE TO iMPlEMENT THE SySTEM
Source: Knudson LP, 2013.
Planning and Prioritization Initiators Process
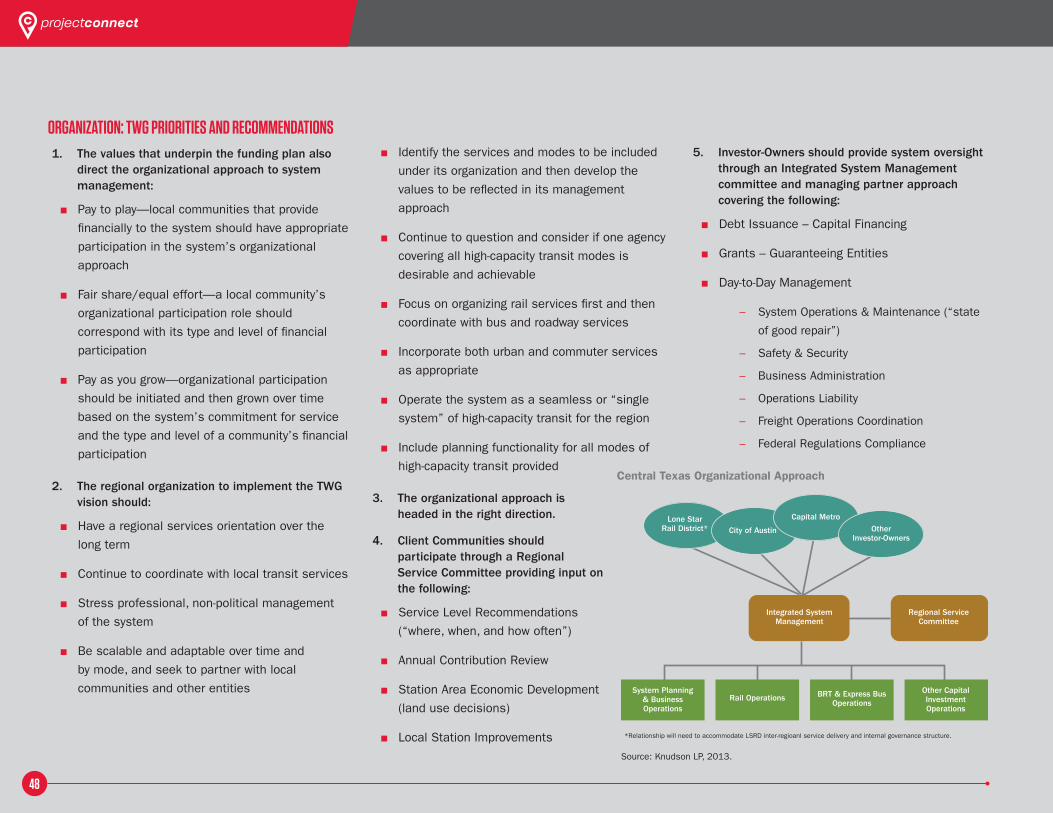
48
ORgaNizaTiON: TWg PRiORiTiES aND RECOMMENDaTiONS1. The values that underpin the funding plan also
direct the organizational approach to system management:
■ Pay to play—local communities that provide
financially to the system should have appropriate
participation in the system’s organizational
approach
■ Fair share/equal effort—a local community’s
organizational participation role should
correspond with its type and level of financial
participation
■ Pay as you grow—organizational participation
should be initiated and then grown over time
based on the system’s commitment for service
and the type and level of a community’s financial
participation
2. The regional organization to implement the TWG vision should:
■ Have a regional services orientation over the
long term
■ Continue to coordinate with local transit services
■ Stress professional, non-political management
of the system
■ Be scalable and adaptable over time and
by mode, and seek to partner with local
communities and other entities
■ Identify the services and modes to be included
under its organization and then develop the
values to be reflected in its management
approach
■ Continue to question and consider if one agency
covering all high-capacity transit modes is
desirable and achievable
■ Focus on organizing rail services first and then
coordinate with bus and roadway services
■ Incorporate both urban and commuter services
as appropriate
■ Operate the system as a seamless or “single
system” of high-capacity transit for the region
■ Include planning functionality for all modes of
high-capacity transit provided
3. The organizational approach is headed in the right direction.
4. Client Communities should participate through a Regional Service Committee providing input on the following:
■ Service Level Recommendations
(“where, when, and how often”)
■ Annual Contribution Review
■ Station Area Economic Development
(land use decisions)
■ Local Station Improvements
5. Investor-Owners should provide system oversight through an Integrated System Management committee and managing partner approach covering the following:
■ Debt Issuance – Capital Financing
■ Grants – Guaranteeing Entities
■ Day-to-Day Management
– System Operations & Maintenance (“state
of good repair”)
– Safety & Security
– Business Administration
– Operations Liability
– Freight Operations Coordination
– Federal Regulations Compliance
Lone Star Rail District* City of Austin
Capital MetroOther
Investor-Owners
Regional Service Committee
Integrated System Management
System Planning & Business Operations
BRT & Express Bus Operations
Other Capital Investment Operations
Rail Operations
*Relationship will need to accommodate LSRD inter-regioanl service delivery and internal governance structure.
Source: Knudson LP, 2013.
Central Texas Organizational Approach
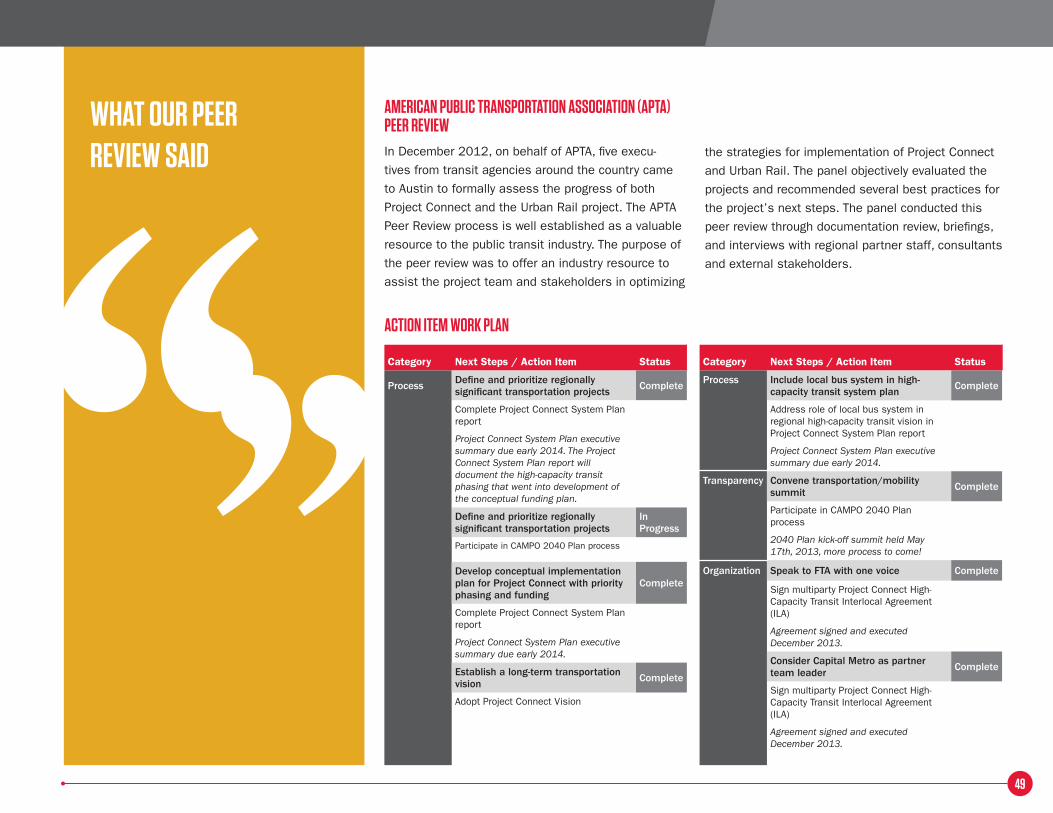
49
aMERiCaN PubliC TRaNSPORTaTiON aSSOCiaTiON (aPTa) PEER REviEWIn December 2012, on behalf of APTA, five execu-
tives from transit agencies around the country came
to Austin to formally assess the progress of both
Project Connect and the Urban Rail project. The APTA
Peer Review process is well established as a valuable
resource to the public transit industry. The purpose of
the peer review was to offer an industry resource to
assist the project team and stakeholders in optimizing
the strategies for implementation of Project Connect
and Urban Rail. The panel objectively evaluated the
projects and recommended several best practices for
the project’s next steps. The panel conducted this
peer review through documentation review, briefings,
and interviews with regional partner staff, consultants
and external stakeholders.
WHaT OuR PEER REviEW SaiD
aCTiON iTEM WORk PlaN
Category Next Steps / Action Item Status
Process Define and prioritize regionally significant transportation projects Complete
Complete Project Connect System Plan report
Project Connect System Plan executive summary due early 2014. The Project Connect System Plan report will document the high-capacity transit phasing that went into development of the conceptual funding plan.
Define and prioritize regionally significant transportation projects
In Progress
Participate in CAMPO 2040 Plan process
Develop conceptual implementation plan for Project Connect with priority phasing and funding
Complete
Complete Project Connect System Plan report
Project Connect System Plan executive summary due early 2014.
Establish a long-term transportation vision Complete
Adopt Project Connect Vision
Category Next Steps / Action Item Status
Process Include local bus system in high-capacity transit system plan Complete
Address role of local bus system in regional high-capacity transit vision in Project Connect System Plan report
Project Connect System Plan executive summary due early 2014.
Transparency Convene transportation/mobility summit Complete
Participate in CAMPO 2040 Plan process
2040 Plan kick-off summit held May 17th, 2013, more process to come!
Organization Speak to FTA with one voice Complete
Sign multiparty Project Connect High-Capacity Transit Interlocal Agreement (ILA)
Agreement signed and executed December 2013.
Consider Capital Metro as partner team leader Complete
Sign multiparty Project Connect High-Capacity Transit Interlocal Agreement (ILA)
Agreement signed and executed December 2013.
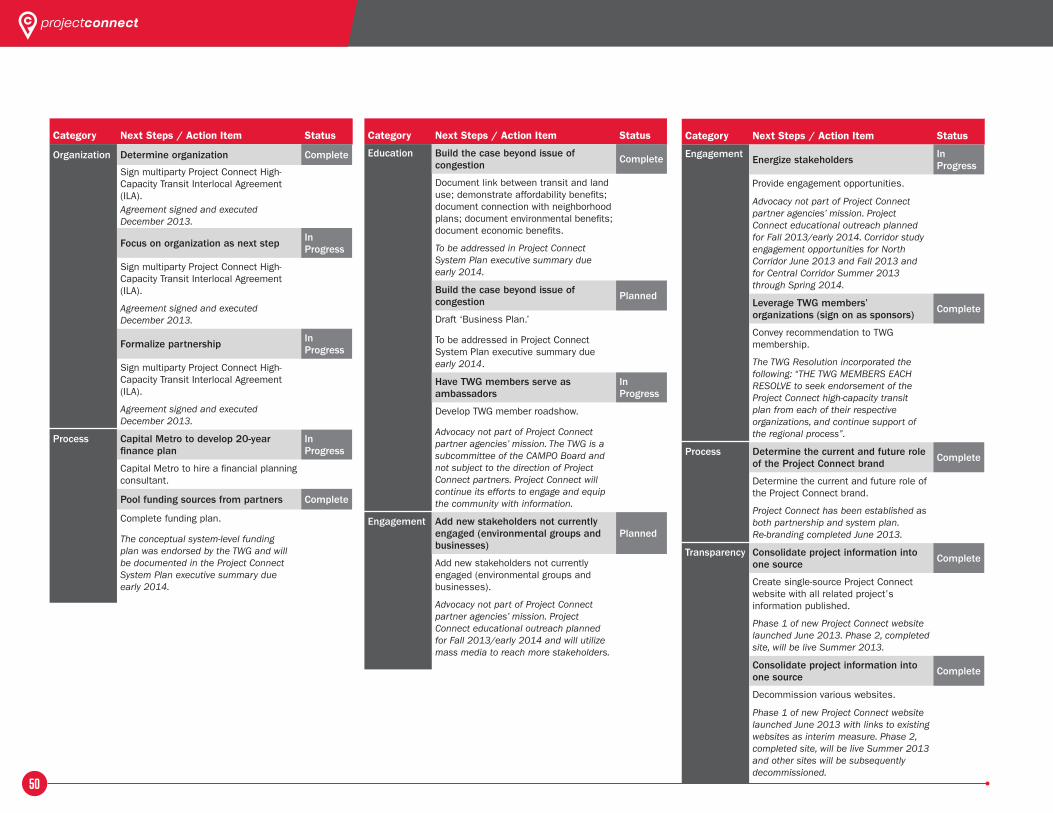
50
Category Next Steps / Action Item Status
Organization Determine organization Complete
Sign multiparty Project Connect High-Capacity Transit Interlocal Agreement (ILA).Agreement signed and executed December 2013.
Focus on organization as next step In Progress
Sign multiparty Project Connect High-Capacity Transit Interlocal Agreement (ILA).
Agreement signed and executed December 2013.
Formalize partnership In Progress
Sign multiparty Project Connect High-Capacity Transit Interlocal Agreement (ILA).
Agreement signed and executed December 2013.
Process Capital Metro to develop 20-year finance plan
In Progress
Capital Metro to hire a financial planning consultant.
Pool funding sources from partners Complete
Complete funding plan.
The conceptual system-level funding plan was endorsed by the TWG and will be documented in the Project Connect System Plan executive summary due early 2014.
Category Next Steps / Action Item Status
Education Build the case beyond issue of congestion Complete
Document link between transit and land use; demonstrate affordability benefits; document connection with neighborhood plans; document environmental benefits; document economic benefits.
To be addressed in Project Connect System Plan executive summary due early 2014.
Build the case beyond issue of congestion Planned
Draft ‘Business Plan.’
To be addressed in Project Connect System Plan executive summary due early 2014.
Have TWG members serve as ambassadors
In Progress
Develop TWG member roadshow.
Advocacy not part of Project Connect partner agencies’ mission. The TWG is a subcommittee of the CAMPO Board and not subject to the direction of Project Connect partners. Project Connect will continue its efforts to engage and equip the community with information.
Engagement Add new stakeholders not currently engaged (environmental groups and businesses)
Planned
Add new stakeholders not currently engaged (environmental groups and businesses).
Advocacy not part of Project Connect partner agencies’ mission. Project Connect educational outreach planned for Fall 2013/early 2014 and will utilize mass media to reach more stakeholders.
Category Next Steps / Action Item Status
Engagement Energize stakeholders In Progress
Provide engagement opportunities.
Advocacy not part of Project Connect partner agencies’ mission. Project Connect educational outreach planned for Fall 2013/early 2014. Corridor study engagement opportunities for North Corridor June 2013 and Fall 2013 and for Central Corridor Summer 2013 through Spring 2014.
Leverage TWG members’ organizations (sign on as sponsors) Complete
Convey recommendation to TWG membership.
The TWG Resolution incorporated the following: “THE TWG MEMBERS EACH RESOLVE to seek endorsement of the Project Connect high-capacity transit plan from each of their respective organizations, and continue support of the regional process”.
Process Determine the current and future role of the Project Connect brand Complete
Determine the current and future role of the Project Connect brand.
Project Connect has been established as both partnership and system plan. Re-branding completed June 2013.
Transparency Consolidate project information into one source Complete
Create single-source Project Connect website with all related project’s information published.
Phase 1 of new Project Connect website launched June 2013. Phase 2, completed site, will be live Summer 2013.
Consolidate project information into one source Complete
Decommission various websites.
Phase 1 of new Project Connect website launched June 2013 with links to existing websites as interim measure. Phase 2, completed site, will be live Summer 2013 and other sites will be subsequently decommissioned.

NExT STEPS
51
SySTEMThe system elements of this plan will inform the
CAMPO 2040 planning process and some or all
elements will appear as the proposed high-capacity
transit system in the CAMPO 2040 Plan. The Project
Connect System Plan will be updated every five years
to continue to inform future CAMPO Plan updates.
Typically, after System Planning in the project develop-
ment process come Corridor Studies for the individual
corridors to determine the most appropriate mode
and alignment or combination of modes and/or align-
ments for each corridor to meet the transportation
needs. Currently the two corridors with the highest
propensity for transit to succeed are the North and
Central Corridors. Both of these corridors currently
have more detailed corridor studies under way. As
individual Corridor Studies are completed they will be
incorporated into this Project Connect System Plan as
Addendums.
High Priority CorridorsHigh Priority Corridors have the highest potential for
high-capacity transit to succeed due to existing and
projected travel patterns and growth. Corridor studies,
the next phase in project development, are underway
for both the North and Central Corridors.
SySTEM ● Regional Plan
● System Plan
● Corridor Studies
● Project Preliminary Design/Environmental Analysis
● Project Final Design
● Project Construction
● Project Operation
fuNDiNg ● System Level Costs Estimated
● Current Funding & Financing Alternatives Identified
● System Level Conceptual Financial Plan
● Local Community Funding Discussions
● Local Funding ILA
● Financial Plan Implementation
ORgaNizaTiON ● Project Connect Cooperative
● Joint Agency Management ILA
● Regional System Owners Funding ILAs
● High-Capacity Transit Organization ILA
● System Implementation
REgiONal STaTuS Next Steps
Source: Knudson and URS, 2013.
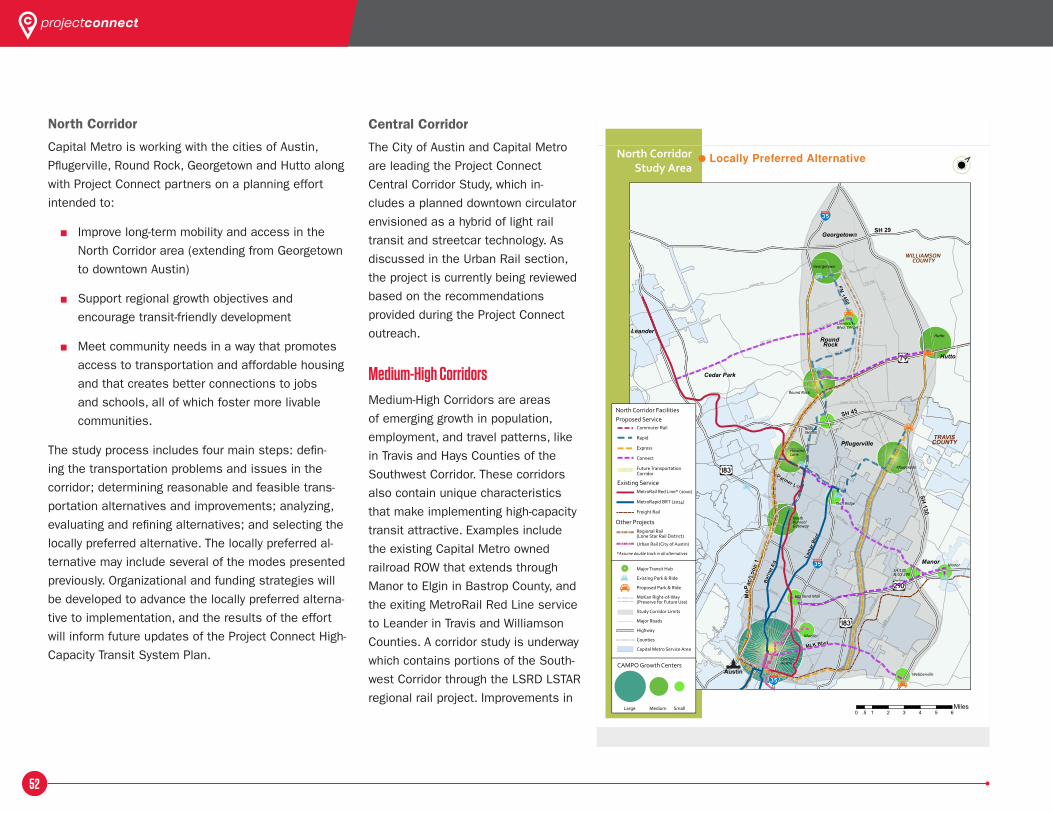
52
North Corridor
Capital Metro is working with the cities of Austin,
Pflugerville, Round Rock, Georgetown and Hutto along
with Project Connect partners on a planning effort
intended to:
■ Improve long-term mobility and access in the
North Corridor area (extending from Georgetown
to downtown Austin)
■ Support regional growth objectives and
encourage transit-friendly development
■ Meet community needs in a way that promotes
access to transportation and affordable housing
and that creates better connections to jobs
and schools, all of which foster more livable
communities.
The study process includes four main steps: defin-
ing the transportation problems and issues in the
corridor; determining reasonable and feasible trans-
portation alternatives and improvements; analyzing,
evaluating and refining alternatives; and selecting the
locally preferred alternative. The locally preferred al-
ternative may include several of the modes presented
previously. Organizational and funding strategies will
be developed to advance the locally preferred alterna-
tive to implementation, and the results of the effort
will inform future updates of the Project Connect High-
Capacity Transit System Plan.
Central Corridor
The City of Austin and Capital Metro
are leading the Project Connect
Central Corridor Study, which in-
cludes a planned downtown circulator
envisioned as a hybrid of light rail
transit and streetcar technology. As
discussed in the Urban Rail section,
the project is currently being reviewed
based on the recommendations
provided during the Project Connect
outreach.
Medium-High CorridorsMedium-High Corridors are areas
of emerging growth in population,
employment, and travel patterns, like
in Travis and Hays Counties of the
Southwest Corridor. These corridors
also contain unique characteristics
that make implementing high-capacity
transit attractive. Examples include
the existing Capital Metro owned
railroad ROW that extends through
Manor to Elgin in Bastrop County, and
the exiting MetroRail Red Line service
to Leander in Travis and Williamson
Counties. A corridor study is underway
which contains portions of the South-
west Corridor through the LSRD LSTAR
regional rail project. Improvements in
North Corridor Study Area
0 1 2 3 4 5 6.5Miles
Duval
Burn
et
Dess
au
Dess
au
Koenig
Anderson
45th St
Enfield
Expo
sitio
n 38th
35th
6th
7th
12th
ManorDK
5thCesBrtn
Cesar Chavez
John
ny M
orris
Deck
er L
n
Con
gres
sS
1st
Gua
d
Lam
ar
51st
McNeil
McNeil
Gattis School Rd
CO 111
University Blvd
FM 1431
Old Settlers
University Ave
Leander Rd
Braker
Braker
360
Tech Ridge
Lake Austin
BlBee Cave s/22 44
Lamar
Hutto
Manor
Georgetown
Pflugerville
Cedar Park
Leander
WILLIAMSON COUNTY
SH 29
SH130
SH 45
MLK Blvd
Hu o
Tech Ridge
Highland Mall
Mueller
Webberville
ManorSH 130& US 290
Lam
ar B
lvd
Bur
net R
d
1 460
Parmer Ln
Austin
MoP
oop
1
RoundRock
IH35 &SH45N
TRAVISCOUNTY
Sprin
gdal
e
UniversityBlvd. Center
Pugerville
CentralAus n
DeDeesss
auauau
uuguuPugggeeee
HowardLane
North Burnet/Gateway
Round Rock
Georgetown
SE Inner Loop
Sam Houston
Maple
CO 104
CO
110
SmallMedium
Existing Service
Proposed Service
Other Projects
North Corridor Facilities
CAMPO Growth Centers
MetroRail Red Line* (2010)
MetroRapid BRT (2014)
Freight Rail
Commuter Rail
Rapid
Express
Connect
Future Transportation
Regional Rail(Lone Star Rail District)
Urban Rail (City of Austin)
*Assume double track in all alternatives
Major Transit Hub
Existing Park & Ride
Proposed Park & Ride
MoKan Right-of-Way(Preserve for Future Use)
Study Corridor Limits
Major Roads
Highway
Counties
Capital Metro Service Area
Large
Corridor
Buune
t
4&5 &&
5N555
Old Se tlers
tenttityit
4466001
SE I
BBlll
eld
MMoo
ooooppp
11
McNeil
eChar Cr C
SpCeCesaCes
Dess
auDe
ssa
DDess
auDe
MMLKK BBBlvvdddd
Hig
h
FM 1431
University Blvd UUU
“the transit vision offers a
smart, comprehensive regional
network that will benefit our
entire region. now it’s time to
roll up our sleeves and get to
work on the next investment to
connect and enhance our regional
transportation system.”
— Capital Metro President/CEO Linda S. Watson
53
the Northwest Corridor are further along in the project
development process in engineering and environmen-
tal through the successful award of a federal grant
to make improvements to the existing MetroRail Red
Line. The East Corridor is next for moving into Corridor
Study as funding becomes available and conditions
continue to strengthen the likelihood for transit to
succeed.
Medium and low CorridorsThese corridors are considered “vision” corridors that,
while not currently viable for high-capacity transit, will
be re-evaluated during future updates for the System
Plan or as conditions warrant further consideration.
fuNDiNgThe next step for funding is to continue the local
community funding discussions begun during Project
Connect and the LSRD LSTAR project. The result of
these discussions will be local funding inter-local
agreements (ILAs) followed by the Project Connect
Conceptual Funding Plan implementation. Additional
funding for future corridor studies is being
investigated, as well.
ORgaNizaTiONThe next step for organization is to develop and imple-
ment the following ILAs:
■ Regional System Owners Funding ILAs
■ High-Capacity Transit Organization ILA
PubliC aND STakEHOlDER OuTREaCHAn enhanced website and new logo for Project Con-
nect were unveiled in June 2013. Any additional
outreach activities associated with Project Connect
will be associated with Project Connect North, Project
Connect Central, LSTAR, and/or other corridor studies
in the future.
fuTuRE uPDaTES aND THE TWgThe system elements of this plan will inform the
CAMPO 2040 planning process and some or all
elements will appear as the proposed high-capacity
transit system in the CAMPO 2040 Plan. The Project
Connect System Plan will be updated every five years
to continue to inform future CAMPO Plan updates. For
each five-year update a regional TWG will be convened
to guide the planning process and approve the new
system plan. Additionally, as individual corridor stud-
ies are completed they will be incorporated into this
System Plan as Addendums and the Vision Map will
be updated to reflect the latest approved corridor
study results.
NExT STEPS
54

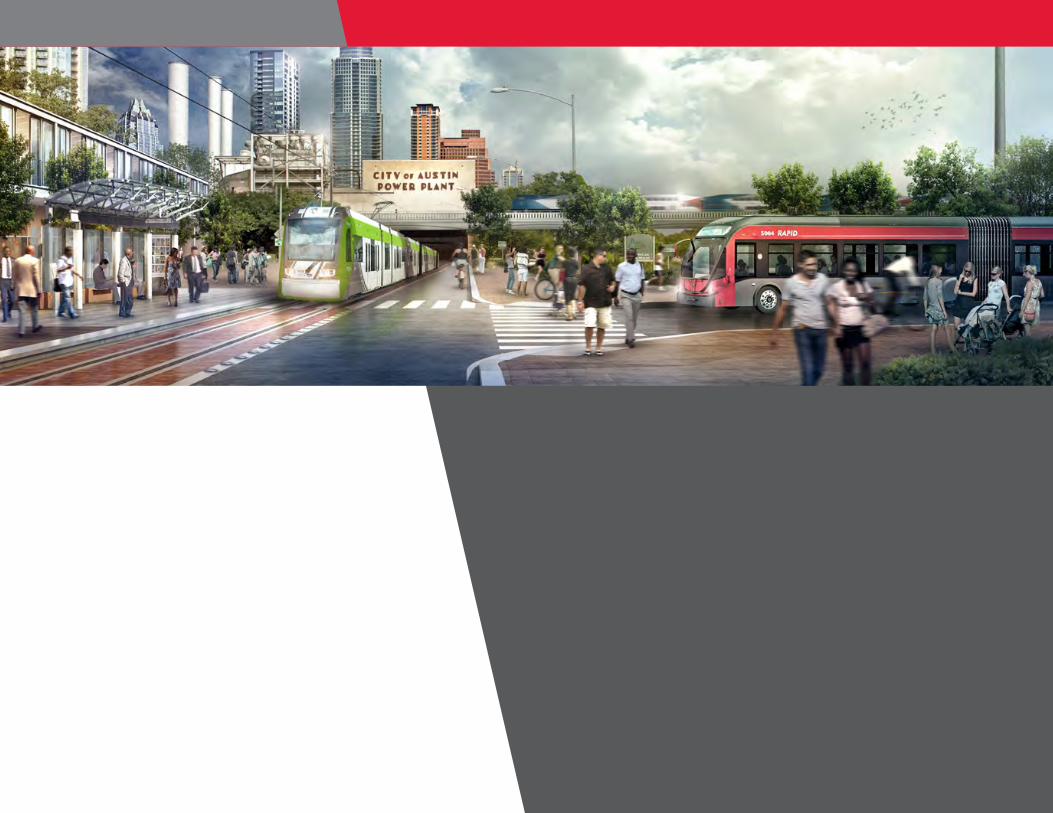
56
For more information see: www.projectconnect.com