project appraisal - module sample · pdf filemethods involved. there are two ... and...
TRANSCRIPT

product: 4503 | module code: c375
Project Appraisal

Project Appraisal
Module Introduction and Overview
Contents
1 Introduction 2
2 The Module Authors 3
3 Study Materials 3
4 Module Overview 4
5 Studying the Module 6
6 Assessment 7
7 Glossary 13

Project Appraisal
2 University of London
1 Introduction This is a module about financial and economic appraisal of projects. The
project is a very specific element of the public policy and management mix.
It normally consists of an investment – that is, the creation of an asset which
will generate benefits, financial and non-financial over a period of more than
one year. This is not universally applicable as a working definition, as
‘project’ is often used to describe a set of discrete activities that do not
always involve a capital investment, to achieve some specific goals. In this
module, however, we will be dealing with capital investments.
Financial appraisal involves predicting the financial flows, both expendi-
tures and revenues, associated with the investment. Companies make such
appraisals when choosing where and how to invest, and such financial
appraisal is at the heart of the appraisal process. Economic appraisal is often
used for public project appraisal because some of the relevant flows in-
volved are not financial. The benefits of a public investment may consist, in
part, of social benefits that do not have a monetary value. Some of the costs
incurred, such as environmental impact of an infrastructure investment,
may also have no market value. The normal approach with such non-
financial flows is to find ways of measuring the costs and benefits and
attributing a monetary value to them.
How do these two sorts of appraisal fit into the public policy-making pro-
cess? Often, an appraisal is a formal requirement1 for any investment above
a set financial limit, and a specified projected rate of return is a requirement
for approval. This applies at all levels of government and is often imposed as a
decision rule by the Ministry of Finance. Such a requirement does not neces-
sarily imply that all available options have been considered. This is one of the
limitations of project appraisal that you will see as you go through the module:
a project may have political backing for various reasons and the appraisal
process is designed to support a decision that has already been made.
A more productive use of appraisal is to inform the decision-making process.
There may be a variety of ways of solving a policy problem2, with different
rates of return, or different costs for the same results. The comparison of
projects to find the best return on a public investment can be an important
part of the policy decision process, if it is done in a timely manner.
Some decisions, of course, are made for reasons other than the projected
economic, financial or social returns. Some of the very big investment
projects in history, such as the construction of the Panama Canal, the Suez
Canal, the tunnel between Britain and France, the Hoover Dam in the USA
or more recent projects such as the Three Gorges Project or the construction
of the high-speed train network in China were made without the benefit of
1 In the USA, a cost-benefit analysis and consideration of alternatives has been a legal
requirement since the River and Harbors Act 1902, and various laws since that time. 2 If you have studied Public Policy and Strategy you will be familiar with the wide variety of
policy instruments available to policy makers.
Module Introduction and Overview
Centre for Financial and Management Studies 3
careful analysis of returns on investment, but in their own ways transformed
their economic and geo-political environments.
How does this module fit into the postgraduate programmes of which it is
part? It is a very specific and quite technical module, which will enable you
to carry out financial and economic appraisals. It will give you enough
theory to understand the financial and economic processes involved in such
an appraisal, but the emphasis is on practice, with some critique of the
methods involved. There are two related modules: Environmental and Social Impact Assessment is specifically concerned with these two aspects of project
appraisal, themselves often also a formal requirement of the project approv-
al process; while, the module Project, Programme and Policy Evaluation offers a
post-hoc process of assessing whether projects, programmes and policies
have been successful after implementation.
2 The Module Authors Tony Allen is a retired university lecturer in economics. Prior to retirement,
he taught at the University of Westminster in London, where he was he was
a Principal Lecturer and Subject Leader in Economics and taught on both
undergraduate and postgraduate courses. He has also been a member of the
Associate Faculty of Henley Management College (now part of Reading
University) from 1986 to 2010 where he contributed to their MBA pro-
grammes, and was the author of some of their MBA distance learning
materials. He was also a Visiting Lecturer in Economics at the Middlesex
University Business School, and he has been an external examiner at several
British universities. Since retirement Professor Allan has been working as a
self-employed educational consultant. He has been a tutor at the Centre for
Financial and Management Studies since 2003. During this time, he has been
involved in tutoring and revising and writing various modules, including
Project Appraisal, Public Financial Management: Revenue and Development Assistance.
Alberto Asquer is the Academic Director of the Public Policy and Manage-
ment Programme. After a degree in Economics at the University of Cagliari
and a Research Doctorate at the University of Salerno in Italy, he did an MSc
and a PhD in Management at the London School of Economics. His works
on regulatory reform of infrastructure, privatisation and liberalisation of
utilities, and organisational change in public sector organisations, have been
published in Governance, International Public Management Journal, International Journal of Public Administration, Utilities Policy, Water Policy, and Competition and Regulation in Network Industries.
3 Study Materials The textbook for this module is:
Boardman AE, D Greenberg, AR Vining and DL Weimer (2014) Cost–Benefit Analysis: Concepts and Practice, 4th Edition, Harlow UK: Pearson
Education Limited.

Project Appraisal
4 University of London
In addition, you will receive a Module Reader, with relevant articles and examples. You will be guided through all of this reading as you work through the module.
4 Module Overview
Unit 1 Investment Appraisal Techniques I 1.1 Introduction 1.2 Cash Flow Analysis 1.3 Private Sector Appraisal Techniques 1.4 Conclusions
Unit 2 Investment Appraisal Techniques II 2.1 Introduction 2.2 Net Cash Flow and the Working Capital 2.3 Mutually Exclusive Projects and Other Issues 2.4 Conclusions Suggested Solutions to ‘Great Eastern Toys (B)’ Case
Unit 3 Social Cost-Benefit Analysis 3.1 Introduction 3.2 The Main Stages of a Social Cost-Benefit Analysis 3.3 Theoretical Basis of Social Cost-Benefit Analysis 3.4 Social Cost-Benefit Analysis Case Study 3.5 The Social Discount Rate (SDR) 3.6 Conclusions
Unit 4 Valuation Methodologies in Social Cost-Benefit Analysis 4.1 Introduction 4.2 Revealed Preference Methods 4.3 Stated Preferences – Contingent Valuation 4.4 Summary and Review
Unit 5 Sector Analysis and Case Studies in SCBA 5.1 Introduction 5.2 Transport Projects 5.3 Water 5.4 Education 5.5 Environment 5.6 Health Care 5.7 Cost-Effectiveness Analysis (CEA) 5.8 Summary and Review
Unit 6 Risk and Uncertainty Analysis 6.1 Introduction 6.2 Risk and Uncertainty 6.3 Techniques for Risk Analysis 6.4 Uncertainty 6.5 Risk and Large Projects
Module Introduction and Overview
Centre for Financial and Management Studies 5
6.6 Spreadsheet Modelling and Risk Analysis 6.7 Conclusions
Unit 7 Distributional Issues and Social Cost-Benefit Analysis 7.1 Introduction 7.2 Analysing the Distribution of Costs and Benefits 7.3 Displaying Distributional Impacts 7.4 Distributional Weighting 7.5 Multi-Criteria Analysis (MCA) 7.6 Conclusions
Unit 8 Critique and Reflection 8.1 Introduction 8.2 Standings, Value Assumptions, and Legitimacy of Cost-Benefit Analysis 8.3 The Strengths and Limitations of Social Cost-Benefit Analysis 8.4 SCBA in Developing Countries Preparation for the Examination
Unit Content
Units 1 and 2
Units 1 and 2 consider the investment appraisal techniques that are used in the
private sector. Investment is defined as real capital formation such as the
production or maintenance of machinery or housing construction; these
types of investment will produce a stream of goods and services for future
consumption. Investment involves the sacrifice of current consumption and
the production of investment goods, which are used to produce goods or
services, and it includes the accumulation of inventories. Investment ap-
praisal is the evaluation of prospective costs and revenues generated by an
investment in a capital project over its expected life. Such appraisal includes
the assessment of risks (although this is covered separately in Unit 6) and uses
a number of different techniques for deciding whether to commit resources to
the project. These techniques include discounted cash flow (DCF) and the
calculation of net present value (NPV) internal rate of return (IRR).
Unit 3
Unit 3 develops the theoretical and applied aspects of Social Cost-Benefit
Analysis. The basic tools of SCBA consider the direct costs and benefits of a
project but also the wider costs and benefits at the level of the national or
regional economy of a country. Social cost-benefit analysis is used mainly
for projects where there is public sector investment and where there are
wider development aims over and above those of generating revenues and
profits, which are the main concern of the private sector.
Unit 4
Unit 4 is about the main valuation techniques of Revealed Preference and
Contingent Valuation for the measurement of project impacts that either
lack a market price or which can be used to calculate shadow prices, and the
unit analyses the strengths and weaknesses of these valuation techniques. It

Project Appraisal
6 University of London
covers cost-effectiveness analysis in situations where project benefits are not
measurable and assesses the most appropriate project evaluation techniques
for different economic sectors. Finally, it provides a critical review of the
advantages and limitations of social cost-benefit analysis.
Unit 5
Unit 5 is about the application of SCBA in transport, water, education, envi-
ronment and healthcare. It shows how the analysis has been used to make
decisions in these sectors and how it can inform the decision-making process.
Unit 6
Unit 6 deals with the issues of risk and uncertainty and presents some of the
methods of dealing with this aspect of project appraisal. It covers the differ-
ent types of risk and uncertainty implicit in projects, and some of the
techniques for dealing with risk and uncertainty and their strengths and
weaknesses. Risks may include physical (climate, weather, earthquakes and
other natural disasters), financial, monetary (foreign exchange movements),
planning and security risks. As well as risk, to which a probability of occur-
rence may be assigned, there is another element in project appraisal –
uncertainty, to which a probability cannot be assigned.
Unit 7
Unit 7 considers some of the important issues associated with the impacts of
projects on the distribution of income in country and how SCBA may be
used to take these distributional issues into account. When appraisals are
being carried out in the context of poverty reduction strategies, the impact
on distribution is crucial.
Unit 8
The last unit looks at some of the critiques that have been made of the use of
SCBA for decision-making. These include the use of monetary values as a
common metric for incommensurate things, the accuracy of forecasts, the
use of monetary values for items that in practice have no monetary value,
such as damage to the natural environment.
5 Studying the Module As you work through the module materials, there are various exercises that
are designed to consolidate your knowledge and skills. We recommend that
you do the exercises, most of which take half an hour or less, before you
look at any model answers that are given in the unit.
At certain points we will ask you to reflect on various aspects of the policy
process where you work. It will be valuable for you and your fellow stu-
dents to share these reflections on the VLE. These short notes setting out the
issue and the approach will enrich your and your fellow students’ experi-
ence of the module.
Please feel free to raise queries with your tutor and with your fellow stu-
dents, if there are issues that are not clear to you. Do this as soon as you find

Module Introduction and Overview
Centre for Financial and Management Studies 7
a problem, because waiting will hold you up as you work through the
module.
We hope that you will find the module instructive, useful and occasionally
challenging.
6 Assessment Your performance on each module is assessed through two written assign-
ments and one examination. The assignments are written after week four
and eight of the module session and the examination is taken at a local
examination centre in September/October.
Preparing for assignments and exams
There is good advice on preparing for assignments and exams and writing
them in Sections 8.2 and 8.3 of Studying at a Distance by Talbot. We recom-
mend that you follow this advice.
The examinations you will sit are designed to evaluate your knowledge and
skills in the subjects you have studied: they are not designed to trick you. If
you have studied the module thoroughly, you will pass the exam.
Understanding assessment questions
Examination and assignment questions are set to test your knowledge and
skills. Sometimes a question will contain more than one part, each part
testing a different aspect of your skills and knowledge. You need to spot the
key words to know what is being asked of you. Here we categorise the types
of things that are asked for in assignments and exams, and the words used.
All the examples are from the Centre for Financial and Management Studies
examination papers and assignment questions.
Definitions
Some questions mainly require you to show that you have learned some concepts, by setting out their precise meanings. Such questions are likely to be preliminary and be supplemented by more analytical questions. Generally ‘Pass marks’ are awarded if the answer only contains definitions. They will contain words such as:
Describe Define Examine Distinguish between Compare
Contrast Write notes on Outline What is meant by List
Reasoning
Other questions are designed to test your reasoning, by explaining cause and effect. Convincing explanations generally carry additional marks to basic definitions. They will include words such as:
Interpret Explain What conditions influence

Project Appraisal
8 University of London
What are the consequences of What are the implications of
Judgement
Others ask you to make a judgement, perhaps of a policy or of a course of action. They will include words like:
Evaluate Critically examine Assess Do you agree that To what extent does
Calculation
Sometimes, you are asked to make a calculation, using a specified technique, where the question begins:
Use indifference curve analysis to Using any economic model you know Calculate the standard deviation Test whether
It is most likely that questions that ask you to make a calculation will also ask for an application of the result, or an interpretation.
Advice
Other questions ask you to provide advice in a particular situation. This applies to law questions and to policy papers where advice is asked in relation to a policy problem. Your advice should be based on relevant law, principles and evidence of what actions are likely to be effective. The questions may begin:
Advise Provide advice on Explain how you would advise
Critique
In many cases the question will include the word ‘critically’. This means that you are expected to look at the question from at least two points of view, offering a critique of each view and your judgment. You are expected to be critical of what you have read.
The questions may begin:
Critically analyse Critically consider Critically assess Critically discuss the argument that
Examine by argument
Questions that begin with ‘discuss’ are similar – they ask you to examine by argument, to debate and give reasons for and against a variety of options, for example
Discuss the advantages and disadvantages of Discuss this statement Discuss the view that Discuss the arguments and debates concerning

Module Introduction and Overview
Centre for Financial and Management Studies 9
The grading scheme: Assignments The assignment questions contain fairly detailed guidance about what is
required. All assignment answers are limited to 2,500 words and are marked
using marking guidelines. When you receive your grade it is accompanied
by comments on your paper, including advice about how you might im-
prove, and any clarifications about matters you may not have understood.
These comments are designed to help you master the subject and to improve
your skills as you progress through your programme.
Postgraduate assignment marking criteria
The marking criteria for your programme draws upon these minimum core
criteria, which are applicable to the assessment of all assignments:
• understanding of the subject
• utilisation of proper academic [or other] style (e.g. citation of references, or use of proper legal style for court reports, etc.)
• relevance of material selected and of the arguments proposed
• planning and organisation
• logical coherence
• critical evaluation
• comprehensiveness of research
• evidence of synthesis
• innovation / creativity / originality
The language used must be of a sufficient standard to permit assessment of
these.
The guidelines below reflect the standards of work expected at postgraduate
level. All assessed work is marked by your Tutor or a member of academic
staff, and a sample is then moderated by another member of academic staff.
Any assignment may be made available to the external examiner(s).
80+ (Distinction). A mark of 80+ will fulfil the following criteria: • very significant ability to plan, organise and execute independently a
research project or coursework assignment;
• very significant ability to evaluate literature and theory critically and make informed judgements;
• very high levels of creativity, originality and independence of thought;
• very significant ability to evaluate critically existing methodologies and suggest new approaches to current research or professional practice;
• very significant ability to analyse data critically;
• outstanding levels of accuracy, technical competence, organisation, expression.
70–79 (Distinction). A mark in the range 70–79 will fulfil the following criteria: • significant ability to plan, organise and execute independently a
research project or coursework assignment;
• clear evidence of wide and relevant reading, referencing and an engagement with the conceptual issues;
• capacity to develop a sophisticated and intelligent argument;

Project Appraisal
10 University of London
• rigorous use and a sophisticated understanding of relevant source materials, balancing appropriately between factual detail and key theoretical issues. Materials are evaluated directly and their assumptions and arguments challenged and/or appraised;
• correct referencing; • significant ability to analyse data critically; • original thinking and a willingness to take risks.
60–69 (Merit). A mark in the 60–69 range will fulfil the following criteria: • ability to plan, organise and execute independently a research project
or coursework assignment; • strong evidence of critical insight and thinking; • a detailed understanding of the major factual and/or theoretical issues
and directly engages with the relevant literature on the topic; • clear evidence of planning and appropriate choice of sources and
methodology with correct referencing; • ability to analyse data critically; • capacity to develop a focussed and clear argument and articulate
clearly and convincingly a sustained train of logical thought.
50–59 (Pass). A mark in the range 50–59 will fulfil the following criteria: • ability to plan, organise and execute a research project or coursework
assignment; • a reasonable understanding of the major factual and/or theoretical
issues involved; • evidence of some knowledge of the literature with correct referencing; • ability to analyse data; • shows examples of a clear train of thought or argument; • the text is introduced and concludes appropriately.
40–49 (Fail). A Fail will be awarded in cases in which there is: • limited ability to plan, organise and execute a research project or
coursework assignment; • some awareness and understanding of the literature and of factual or
theoretical issues, but with little development; • limited ability to analyse data; • incomplete referencing; • limited ability to present a clear and coherent argument.
20–39 (Fail). A Fail will be awarded in cases in which there is: • very limited ability to plan, organise and execute a research project or
coursework assignment; • failure to develop a coherent argument that relates to the research
project or assignment; • no engagement with the relevant literature or demonstrable
knowledge of the key issues; • incomplete referencing; • clear conceptual or factual errors or misunderstandings; • only fragmentary evidence of critical thought or data analysis.

Module Introduction and Overview
Centre for Financial and Management Studies 11
0–19 (Fail). A Fail will be awarded in cases in which there is: • no demonstrable ability to plan, organise and execute a research
project or coursework assignment;
• little or no knowledge or understanding related to the research project or assignment;
• little or no knowledge of the relevant literature;
• major errors in referencing;
• no evidence of critical thought or data analysis;
• incoherent argument.
The grading scheme: Examinations The written examinations are ‘unseen’ (you will only see the paper in the
exam centre) and written by hand, over a three hour period. We advise that
you practise writing exams in these conditions as part of your examination
preparation, as it is not something you would normally do.
You are not allowed to take in books or notes to the exam room. This means
that you need to revise thoroughly in preparation for each exam. This is
especially important if you have completed the module in the early part of
the year, or in a previous year.
Details of the general definitions of what is expected in order to obtain a
particular grade are shown below. These guidelines take account of the fact
that examination conditions are less conducive to polished work than the
conditions in which you write your assignments. Note that as the criteria of
each grade rises, it accumulates the elements of the grade below. Assign-
ments awarded better marks will therefore have become comprehensive in
both their depth of core skills and advanced skills.
Postgraduate unseen written examinations marking criteria
80+ (Distinction). A mark of 80+ will fulfil the following criteria: • very significant ability to evaluate literature and theory critically and
make informed judgements;
• very high levels of creativity, originality and independence of thought;
• outstanding levels of accuracy, technical competence, organisation, expression;
• shows outstanding ability of synthesis under exam pressure.
70–79 (Distinction). A mark in the 70–79 range will fulfil the following criteria: • shows clear evidence of wide and relevant reading and an engagement
with the conceptual issues;
• develops a sophisticated and intelligent argument;
• shows a rigorous use and a sophisticated understanding of relevant source materials, balancing appropriately between factual detail and key theoretical issues.
• materials are evaluated directly and their assumptions and arguments challenged and/or appraised;
• shows original thinking and a willingness to take risks;
• shows significant ability of synthesis under exam pressure.

Project Appraisal
12 University of London
60–69 (Merit). A mark in the 60–69 range will fulfil the following criteria: • shows strong evidence of critical insight and critical thinking;
• shows a detailed understanding of the major factual and/or theoretical issues and directly engages with the relevant literature on the topic;
• develops a focussed and clear argument and articulates clearly and convincingly a sustained train of logical thought;
• shows clear evidence of planning and appropriate choice of sources and methodology, and ability of synthesis under exam pressure.
50–59 (Pass). A mark in the 50–59 range will fulfil the following criteria: • shows a reasonable understanding of the major factual and/or
theoretical issues involved:
• shows evidence of planning and selection from appropriate sources;
• demonstrates some knowledge of the literature;
• the text shows, in places, examples of a clear train of thought or argument;
• the text is introduced and concludes appropriately.
40–49 (Fail). A Fail will be awarded in cases in which: • there is some awareness and understanding of the factual or
theoretical issues, but with little development;
• misunderstandings are evident;
• there is some evidence of planning, although irrelevant/unrelated material or arguments are included.
20–39 (Fail). A Fail will be awarded in cases which: • fail to answer the question or to develop an argument that relates to
the question set;
• do not engage with the relevant literature or demonstrate a knowledge of the key issues;
• contain clear conceptual or factual errors or misunderstandings.
0–19 (Fail). A Fail will be awarded in cases which: • show no knowledge or understanding related to the question set;
• show no evidence of critical thought or analysis;
• contain short answers and incoherent argument. [2015–16: Learning & Teaching Quality Committee]
Specimen exam papers CeFiMS does not provide past papers or model answers to papers. Modules
are continuously updated, and past papers will not be a reliable guide to
current and future examinations. The specimen exam paper is designed to
be relevant and to reflect the exam that will be set on this module.
Your final examination will have the same structure and style and the range
of question will be comparable to those in the Specimen Exam. The number
of questions will be the same, but the wording and the requirements of each
question will be different.
Good luck on your final examination.

Module Introduction and Overview
Centre for Financial and Management Studies 13
Further information Online you will find documentation and information on each year’s
examination registration and administration process. If you still have
questions, both academics and administrators are available to answer
queries.
The Regulations are also available at www.cefims.ac.uk/regulations/,
setting out the rules by which exams are governed.
7 Glossary There are a number of technical terms and specialised concepts introduced
in this module. The following glossary includes the main ones as a reference
guide during your study of the module.
Definitions
Benefit-cost Ratio The ratio of discounted benefits to discounted costs
Biophysical The non-human environment, including living organisms (plants and animals) and non-living matter (e.g. water and air)
Cash flow The flow of money to and from a company, enterprise or project
Consumer surplus The additional benefit received over and above the amount actually paid by consumers
Consumption rate of interest The same as the Social Rate of Discount (see below)
Contingent valuation A process of asking people how much they would be willing to pay for a good or service or how much they are willing to accept to give it up
Cost-effectiveness analysis (CEA) Analysis which compares the costs of alternative ways of producing the same or similar outputs
Cost of illness Uses the value of treatment costs of those who fall ill as a result of, say, poor air quality, as the value of the costs of that pollution
Critical path analysis The analysis and sequencing of each task in a process to calculate the optimum sequence for completion
Cultural/ Heritage impact assessment Assessment of impacts on anything that may have aesthetic, architectural, historical, scientific, social, spiritual, linguistic or technological value

Project Appraisal
14 University of London
Cumulative effects assessment Assessment of impacts due to numerous separate developments, which might be insignificant on their own, but which can interact or combine to cause significant impacts
Defensive expenditures and replacement costs DE is the monetary amount that people would be prepared to spend on, say, their environment, to prevent its degradation, and RC represents the cost of restoring that environment to its original state after it has been damaged
Diminishing marginal utility The more that someone consumes of a particular good, the less value or utility an extra Unit of that good will have
Discount rate The annual percentage rate at which the present value of a unit of value is assumed to reduce with time
Discounted cash flow (DCF) A method of appraising investments based on the idea that the value of a specific sum of money depends precisely on when it is received, the value reducing with time
Depreciation The loss of value of capital goods due to wear and tear, ageing or technical obsolescence
Economic efficiency The present value of a project’s social benefits less the present value of its social costs
Economic impact assessment Assessment of the impacts of a project on the wider economy, which can be direct, indirect, induced or fiscal
Engagement Process of interacting with stakeholders to produce better decisions/ outcomes – the level of engagement may increase in level, as follows: inform, consult, involve, collaborate, empower
Evaluation An assessment of the efficiency, effectiveness, impact, sustainability and relevance of a project in the context of stated objectives
Ex ante appraisal Appraisal carried out before a project is started, based on prediction and extrapolation
Ex post evaluation An evaluation of a completed project
Externalities Also known as spill-over effects and intangible effects – the impacts of a project on third parties or society in general not captured by markets and therefore market prices
Financial analysis The type of investment appraisal carried out by profit-seeking businesses – it involves the evaluation of the prospective costs and revenues generated by an investment in a capital project over its expected life, excluding non-monetary items and externalities

Module Introduction and Overview
Centre for Financial and Management Studies 15
Gini coefficient A coefficient based on the Lorenz curve showing the degree of inequality in a frequency distribu-tion such as personal incomes. If the frequency distribution is equal, the Lorenz curve coincides with the 45° line
Hedonic pricing Hedonic pricing is a method of establishing an economic value for environmental factors such as pollution and environmental degradation; the method uses a surrogate measure such as the impact of pollution on property and land prices, and it assumes that there is specific data on land and property prices which can be assessed against pollution – this is a technique used for calculating revealed preferences (RP)
Human capital The technique attempts to measure earnings of individuals to value the impacts of such events as education, health-care, risks of accidents and death – a technique used for calculating revealed preferences (RP)
Impact Any change (beneficial or adverse) in the environment (social or biophysical) as a result of human activity
Impact analysis A detailed accounting of the environmental, health and social impacts of a project
Infrastructure projects Infrastructure projects are normally concerned with the provision of roads, airports, ports, sewage and water systems, railways, telecommunication and other public utilities such as schools, hospitals and clinics; such projects are basic to economic development and improvements in infrastructure may also be used to attract industry and investment to a particular country and or region
Integrated assessment Forms of impacts assessment that aim to align/combine a number of established assessment techniques (e.g. Economic Impact Assessment + Social Impact Assessment), and/or to com-pare/explore interrelationships between themes (e.g. biophysical and social)
Internal rate of return (IRR) The discount rate that produces a NPV of zero
Investment appraisal The evaluation of the prospective costs and revenues generated by an investment in a capital project over its expected life
Kaldor-Hicks compensation test A project or policy should be adopted only if those who gain could fully compensate those who lose and still be better off
Life-cycle assessment Compilation and evaluation of the inputs, outputs and the potential environmental impacts of a product system throughout its life cycle
Lorenz curve A graphical representation showing the degree of inequality of a frequency distribution in which the cumulative percentages of a population are plotted against the cumulative percentage of the variable under study (e.g. incomes, employment)

Project Appraisal
16 University of London
Marginal utility of income The extra satisfaction gained by a consumer from a small increment in income
Mitigation Measures to prevent/ eliminate, reduce/ minimise, remediate/ repair or compensate adverse impacts
Monte Carlo method Method for estimating probabilities – it involves the construction of a model and the simulation of the outcome of an activity a large number of times
Net present Value (NPV) The difference between the discounted present value of future benefits and the discounted present value of future costs
Opportunity cost of capital The next best alternative return available for the funds in the capital markets
Opportunity cost The value of the most valuable of alternative uses
Pareto efficiency A position in which it is not possible to make at least one person better off without making anyone worse off. Also known as allocative efficiency
Pay Back The period over which the cumulative net revenue from an investment project equals the original investment
Present value The discounted value of a financial sum arising at some future period
Private costs and benefits The costs incurred and the benefits received by those producers and consumers immediately involved in a project
Private rate of return (PRR) The rate of return to an individual or business of some activity or investment – only includes the costs incurred by that individual or business (private costs) and the benefits to that individual or business (private benefits)
Production-function methods These methods measure the impact of, for example, pollution, on production and output, and use the market prices of that production/output to value these impacts
Problem tree A diagrammatic representation of a negative or potentially negative situation showing a cause and effect relationship
Programme A programme includes a number of related but distinct projects
Project A series of activities with set objectives to produce a specific outcome within a limited time frame

Module Introduction and Overview
Centre for Financial and Management Studies 17
Project cycle The project cycle follows the life of the project from the initial idea through to its completion
Public goods Goods that are both non-rivalrous in consumption and no one can be prevented from consuming them (non-excludable)
Quality adjusted life years (QALYs) Morbid life years are adjusted by subjective measures of quality where a fully functional year of life is given a weight of 1 and dysfunctional years are counted as fractions
Rate of return Net profit after depreciation as a percentage of average capital employed in the business – the rate of return calculation may be made using profit before or after tax
Relevant cash flows The cash costs and revenues incurred as a result of an investment
Return on capital employed (ROCE) Ratio of accounting profit generated by an investment project to the required capital outlay, expressed as a percentage
Revealed preference (RP) The value of non-market impacts of a project are inferred from observable behaviour in markets for related goods and, in particular, purchases made in actual markets
Risk A future event or outcome to which some measure of probability can be attached
Risk analysis The determination of the probability of different outcomes for a project
Sensitivity analysis The identification of important areas of uncertainty to test key assumptions in a systematic way in order to determine the factors that are most likely to affect project success and to identify possible measures that could be taken to improve the chances of success (e.g. discount rate used, project life, year in full project revenue is achieved)
Shadow price The opportunity cost to society of participating in some form of economic activity – it is applied where actual prices cannot be charged or where prices do not reflect the true scarcity value of a good
Significance The significance of impacts is typically determined by considering their magnitude/severity, extent, duration and probability – opposite ends of the spectrum are:
highly significant impacts: Impacts that are diverse, irreversible and/or unprecedented low significance/ insignificant impacts: Impacts that are generally site-specific, largely reversible, and – in relation to adverse impacts – readily addressed by mitigation
Social Anything relating to humans and their interactions, including economic, cultural, human rights, health and safety concerns

Project Appraisal
18 University of London
Social cost-benefit analysis (SCBA) Analysis of future cost and benefit streams from a project, including items for which the market does not provide a satisfactory measure of economic value
Social costs and benefits The total costs and benefits of a project including both the private costs and benefits and the spillovers (externalities) on third parties and society in general
Social rate of discount An adjusted discount rate in which the discount rate may be adjusted to take account of time preference: the importance of the project to future generations
Social Rate of Return (SRR) The rate of return to society as a whole of some activity or investment. Includes the social costs to society (private costs plus externalities) and the social benefits to society (private benefits and external benefits)
Social welfare The total wellbeing of a community
Social welfare function An expression of society’s taste for different economic states
Stakeholders The people, groups or institutions likely to affect or be affected by or have an interest in a project
Stakeholder analysis Consultation with stakeholders on their priorities for incorporation in a project or ex-post analysis of the actual impacts of a project on stakeholders
Straight-line depreciation Where the residual (scrap value) of an asset is deducted from the original cost and the balance is divided equally by the number of years of estimated life
Sustainability assessment Assessment processes that aim to determine whether or not an initiative will contribute to sustainable development
Switching value (decision pivot point) The percentage change in a project variable (investment costs, revenue etc) required to change the NPV to zero by interpolation
Travel cost method (TCM) The value of an environmental location is the time and cost that people take to travel to that location plus the admission charge if there is such a charge
Uncertainty A future event or outcome to which no probability of its occurrence can be attached
Vulnerable individuals or groups People who are differentially or disproportionately sensitive to change (or in need of change), since they are underrepresented, disadvantaged or lacking in power/ influence/ capacity

Module Introduction and Overview
Centre for Financial and Management Studies 19
Weighted average cost of capital (WACC) Investment projects may be financed by debt and/or equity in the private sector – the respective costs of both types of finance are weighted by the proportions used to finance a particular project in order to calculate that project’s cost of capital
Welfare/Distributional weights The weighting attached to a particular cost or benefit for a particular project beneficiary
Willingness to accept The compensation required to return an individual to his or her original state of economic well-being following some change (possibly hypothetical) in the world
Working capital The cash to fund the stock of goods/inputs that a business needs to hold in order to operate
Willingness to pay (WTP) The willingness of an individual to pay in order to get a good or services

DO NOT REMOVE THE QUESTION PAPER FROM THE EXAMINATION HALL
UNIVERSITY OF LONDON
CENTRE FOR FINANCIAL AND MANAGEMENT STUDIES
MSc Examination Postgraduate Diploma Examination
91DFMC375
PUBLIC POLICY & MANAGEMENT PUBLIC FINANCIAL MANAGEMENT
Project Appraisal
Specimen Examination
This is a specimen examination paper designed to show you the type of examination you will have at the end of this module. The number of questions and the structure of the examination will be the same, but the wording and requirements of each question will be different. The examination must be completed in THREE hours. Answer THREE questions.
The examiners give equal weight to each question; therefore, you are advised to distribute your time approximately equally between three questions.
You should, where possible, illustrate your answers with references and/or practical examples from the module and from your own experience.
PLEASE TURN OVER
Specimen Examination
Centre for Financial and Management Studies 21
Answer THREE questions; at least ONE from EACH section. Answer ALL parts of multi-part questions.
Section A
(Answer at least ONE question from this section)
1 Explain the discounted cash flow methods of project appraisal in the private sector. Why is discounting an important com-ponent part of the calculations that are made to appraise net benefits of an investment project?
2 Explain how changes of working capital are taken into
account in the accurate estimation of the Net Cash Flow of a project.
3 Outline the main stages of a Social Cost-Benefit Analysis
(SCBA) with reference to a project appraisal with which you are familiar.
4 Suggest an appropriate methodology to value each of the
following project impacts: a) a tourism project that attracts more visitors to a national
park b) a highway project that generates increased traffic noise
and air pollution in the vicinity of the highway c) a dam project that floods a valley which results in the
loss of unique prehistoric archaeological sites. For each impact you should select a different methodology.
Your answer should emphasise the strengths and weaknesses of your chosen methodology in relation to the project impact being discussed.

Project Appraisal
22 University of London
Section B
(Answer at least ONE question from this section)
5 Assess the main strengths and limitations of Social Cost-Benefit Analysis (SCBA) for the project appraisal of public sector investment projects.
Use examples from relevant projects to illustrate your analysis.
6 Identify and discuss the main issues encountered in the
appraisal of large projects (megaprojects). What actions can project analysts and decision makers take to
try to prevent or mitigate some of the risks and uncertainties generally attached to such projects?
7 Explain how the techniques of SCBA can be applied to a sector
with which you are familiar. Your analysis should emphasise the special problems and difficulties of using the technique in your chosen sector.
8 Critically assess the limitations of Social Cost-Benefit Analysis
(SCBA) in the evaluation of non-economic values in relation to environmental issues and sustainable development, consider-ing particularly: a) the limited consideration given to distributional equity b) its vulnerability to political influence.
[END OF EXAMINATION]

Project Appraisal
Unit 1 Investment Appraisal Techniques I
Contents
1.1 Introduction 3
1.2 Cash Flow Analysis 4
1.3 Private Sector Appraisal Techniques 7
1.4 Conclusions 19
References 20

Project Appraisal
University of London 2
Unit Content Units 1 and 2 focus on the investment appraisal techniques that are used in the
private sector. These methodologies also form the basis of project appraisal
as part of social cost-benefit analysis (which you will study in Units 3, 4 and
5), therefore it is useful, as a starting point, to study how the techniques are
applied in the original source domain. You will see later on in this module
how project appraisal in the public sector differs from the way in which
investments are evaluated in the pursue of private (business) interests.
Learning Outcomes After completing your study of this unit, you will be able to
• explain and use cash flow analysis
• discuss private sector appraisal techniques
• use spreadsheets for investment appraisal
• apply private sector investment appraisal techniques to different situations.
Readings for Unit 1
Textbook Anthony Boardman, David Greenberg, Aidan Vining and David Weimer
(2014) Cost-Benefit Analysis – Concepts and Practice, from Chapters 6
‘Discounting Benefits and Costs in Future Time Periods’, and 2
‘Conceptual Foundations of Cost-Benefit Analysis’.
Module Reader David Potts (2002) ‘Project Planning and Analysis for Development’.
Clay Carr and Markus Pudelko (2006) ‘Convergence of Management
Practices in Strategy, Finance and HRM between the USA, Japan and
Germany’.

Unit 1 Investment Appraisal Techniques I
Centre for Financial and Management Studies 3
1.1 Introduction Investment, in the economic sense of the word, is an increase in the stock of
physical capital assets such as plant and machinery, buildings and other
assets that will generate a flow of goods or services in the future. This is
different to the concept of financial investment, such as buying financial
assets like stocks and shares, which merely transfers ownership between
seller (or issuer) and buyer, although such activities will generate a flow of
income for the purchaser in the future from interest or dividend payments.
Investment appraisal is mainly concerned with the financial and economic
viability of projects. This allows project analysts to consider whether the
return that might be expected from an investment compares favourably with
alternative investment in other projects (the opportunity cost of the invest-
ment). Thus, if there are a number of alternative investment options, which
option produces the best financial return, taking into account other factors
such as risk? Risk is a complex area in its own right, so it is analysed sepa-
rately in Unit 6.
This unit is concerned with an examination of investment appraisal in the
private sector, often called financial analysis or capital budget, because compa-
nies in this sector will be primarily concerned with the profitability of their
investments (although the private sector also includes not-for-profit organi-
sations such as charities and NGOs). Such investment decisions can involve:
• the replacement and/or acquisition of new capital assets;
• new products;
• cost savings;
• acquisitions and mergers.
Investment appraisal techniques are also used in public sector projects and
in public–private partnership projects, and similar techniques of appraisal
are used; this is why they are covered in this unit. However, investment
appraisal in the public sector is normally concerned with broader criteria,
including the impact on employment, poverty, and external costs and
benefits (externalities), rather than just the financial impacts. This involves
the use of social cost-benefit analysis (SCBA) and this is considered in Units
3 and 4.
A profit seeking business will be concerned with the evaluation of the
prospective costs and revenues (and related cash outflows and inflows)
generated by an investment in a capital project over its expected life. The
expected life of a capital project is the time period that the analyst considers
to be relevant for the evaluation of the prospective costs and revenues. It
may extend from the date when the investment is made and the capital
project starts generating costs and revenues until the date when capital
assets are no longer productive and the flow of costs and revenues fades
away. Alternatively, it may cover the period between the date when the
investment is made and an arbitrary date in the (distant) future when the
analyst believes that uncertainty makes evaluation of the prospective costs
and revenues no longer workable.

Project Appraisal
University of London 4
The financial viability of an investment can be appraised by a number of
different methods, which include:
• payback period
• accounting rate of return (ARR)
• net present value (NPV)
• internal rate of return (IRR)
• benefit-cost ratio.
These methods are explained, and their strengths and weaknesses discussed,
in this unit. Also, this unit provides examples of the use of spreadsheets for
investment appraisal (you should download and open the file:
‘ProjectAppraisal_U1v12013.xls’ available on the VLE).
1.2 Cash Flow Analysis Investment appraisal in the private sector is called financial analysis (or capital budget) because the only project impacts considered are those costs and
revenues (and related cash outflows and inflows) of the project that affect
the financial position of a company (sometimes called private costs and
benefits). The cash flows that are relevant to the decision are those that are
affected by the decision. This is most easily calculated by comparing the
status quo (the do nothing or without option) with the effects of the project (the
with option). This produces the incremental costs and revenues – that is, the
impacts of the project on the cash flows of the business.
These cash flows typically consist of:
• Capital expenditure or outlay: this includes the cash outflows due to the purchase cost of such items as buildings, equipment, plant and machinery, design and training expenditure. In financial accounting terms, such investments are exhibited in financial reports as fixed assets (property, plant, and equipment) and are depreciated to take account of their decline in value and to provide for capital replacement. At the end of a project’s working life, investments may have a written-down or residual value which will reflect their scrap or disposal value. Some types of projects may have cash outflows at the end of the project due to decommissioning costs, reclamation costs, etc.
Investment costs also include working capital. Working capital refers
essentially to stocks of goods that the business or project needs to
hold in order to operate – such as cloth in the case of a clothing
factory. In addition, if sales involve the granting of credit to
customers, then these debtors will need financing. Conversely, any
credit extended by a company’s suppliers will reduce the company’s
working capital requirements. Typically, capital expenditure will be
‘front-loaded’ – it will occur at the beginning and/or in the early
years of a project’s working life.
• Annual operating costs: these are the costs incurred in operating the project, such as labour costs, costs of raw materials or other types of stocks, water, electricity, etc.
Unit 1 Investment Appraisal Techniques I
Centre for Financial and Management Studies 5
• Annual revenues: these will arise from the sale of the output of the project and thus will produce a positive cash inflow into the company. Alternatively, some types of investment produce greater efficiency and thus lower the annual operating costs – these savings can be treated as positive cash gains to the business. These annual revenues less annual operating costs will equal the project’s Annual Net Cash Flows (NCFs) for each year of the expected life of the project.
Different types of projects will have different cost and revenue profiles; the
results of project appraisal techniques will also depend on the project life.
Large-scale industrial process projects, such as cement works or dams, may
have an assumed project life of around 30–40 years, with occasional invest-
ments in updating plant due to the development of new technologies.
Investment in an irrigation project for tree crop production will have a
shorter investment cycle as trees are replaced and replanted. A hotel project
for tourism will require shorter cycle investments to upgrade rooms and
facilities if it is to maintain its competitive position in relation to other
competing hotels and holiday complexes.
Example
Let us have a look at a cash flow analysis conducted on a spreadsheet. You should download and open the file named ‘ProjectAppraisal_U12014.xls’ and available on the VLE. The sheet named ‘Example 1’ provides a simple instance of cash flow analysis. An investment in a piece of machinery is expected to expand current production and sales of manufactured goods of an imaginary firm. After the investment is made, production will increase, as well as costs of direct materials and manufacturing overhead. Labour costs are assumed to remain constant (the piece of machinery is automated and requires no additional specialised workforce). Also, we assume that all the production that originates from the new piece of machinery will be sold.
Cash flow analysis is based on conjectures on prospective costs and revenues. In Example 1, we can set four parameters, that relate to (1) rate of increase of production, (2) rate of increase of direct material costs, (3) rate of increase of manufacturing overhead costs, and (4) expected life of the project (we can also input the capital expenditure, although it does not affect Net Cash Flow). The parameters of the model are:
Rate of increase of production 30 %
Rate of increase of direct material costs 20 %
Rate of increase of manufacturing overhead costs 10 %
Expected life of the capital project (years) 8
As the capital project under consideration consists of the expansion of an existing business venture, we can base our estimation of future cash flow on past performance of existing machinery. Of course, you can try to change the values of the parameters to see how this affects the Net Cash Flow.
Let us have a look at a slightly more complex instance of cash flow analysis. You should now open the sheet named ‘Example 2’ within the same file. This example relates to an investment in a piece of machinery that is expected to expand current production and sales of manufactured goods of an imaginary firm. Differently from the previous example, production will increase gradually over time (you can input the rate of increase of production). Costs related to materials will increase accordingly, while costs of manufac-

Project Appraisal
University of London 6
turing overhead will have a one-time increase after the investment is made. Labour costs are assumed to remain constant. We also assume that all the production that originates from the new piece of machinery will be sold.
In Example 2, we can set three parameters, that relate to (1) expected life of the capital project, (2) year-to-year rate of increase of production and of direct material costs, (3) one-time rate of increase of manufacturing overhead costs (we can also input the capital expenditure, although it does not affect Net Cash Flow). The parameters of the model are:
Expected life of the capital project (years) 7
Rate of increase of production and of direct material costs
Year 1 2.00 % Year 2 2.00 %
Year 3 3.00 %
Year 4 3.00 % Year 5 4.00 %
Year 6 4.00 %
Year 7 5.00 %
Rate of increase of manufacturing overhead costs 10 %
As in the previous example, because the capital project under consideration consists of the expansion of an existing business venture, we can base our estimation of cash flow on past performance of existing machinery. The result is a forecast of revenues, costs, and Net Cash Flow streams (graphically, this is illustrated in Figure 1.1).
Figure 1.1 Revenues, Costs, and Net Cash Flow of the Model in Example 2
This model provides some additional insights, with respect to the previous one. We notice that, after the investment is made, Net Cash Flow is relatively disappointing for a few years – in Year 1 and 2, Net Cash Flow is actually lower than the one that we got before the investment is made! This is not so surprising, provided that (as it may happen in capital projects) the investment entails a sharp increase in fixed costs (manufacturing overhead) while production and sales (hence, income on sold products) increase only gradually over time. Only from Year 3 onwards is Net Cash Flow higher than the one before the investment is made.
Year 1 Year 4Year 2 Year 5 Year 6 Year 7Year 3
140,000
120,000
100,000
80,000
60,000
40,000
20,000
0

Unit 1 Investment Appraisal Techniques I
Centre for Financial and Management Studies 7
Try and change the values of the parameters and see how this affects Net Cash Flow. For example, let us say that we cautiously expect lower year-to-year rate of increase of production and sales in all of the 7 years while leaving all other parameters constant. If we halve year-to-year rates of increase of production and sale, how long should we wait until Net Cash Flow is higher than the one we got before the investment is made?
1.3 Private Sector Appraisal Techniques Private sector appraisal techniques concentrate on financial analysis and
commercial profitability. The main components of financial analysis are cash
flow analysis (revenue and costs), the profit and loss account and balance
sheet, working capital, source and application of funds and working capital
statements.
Reading
Please now read Potts’s extract, ‘Financial Analysis for Commercial Projects’, which goes into more detail on financial analysis of investment projects. The reading also discusses financial ratios and how these may be interpreted. However, Potts notes that these financial ratios are not often used in project appraisal. Financial ratios are more likely to be used to assess the financial viability of a company or organisation, and therefore be of interest to institutions, which provide funding.
The main aim of private sector appraisal is to establish the financial viability of the project and to assess its impacts on the financial statements of the commercial organisa-tion. In the case of publicly floated companies, investors will be concerned with the returns to shareholders. A number of investment appraisal techniques are discussed below. It should be noted that all these techniques provide financial guidelines for whether a project seems financially viable. There are other factors that can determine whether a private sector project is viable or not. These factors may include market conditions for the project’s products and or services, the financier’s assessment of risk, and the legal and regulatory environment (this may be particularly important for privat-ised companies that are subject to regulation, such as water, telecommunications, energy and other utility companies).
Make sure your notes cover the points cited.
1.3.1 Payback method The payback method, based on cash flows, is a traditional method of in-
vestment appraisal. It assesses how quickly the incremental Net Cash Flows,
which accrue to an investment project, pay back the initial capital invested.
Where there are several projects, the project that pays back the investment in
the shorter period would normally be chosen. Typically, companies that use
the payback method use a pre-determined minimum acceptable payback
period in order to accept or reject projects.
David Potts (2002) ‘Financial Analysis for Commercial Projects’, reprinted in the Module Reader from Project Planning and Analysis for Development.

Project Appraisal
University of London 8
Example
Have a look at the sheet named ‘Example 3’ within the same file as the previous exam-ple. Here we see how the payback method helps in choosing between two different projects. Let us assume that we have the option to invest in one of two alternative capital projects, named A and B. An analyst has estimated the expected Net Cash Flow that originates from both projects, as is shown below.
Table 1.1 Net Cash Flow of two alternative capital projects
Year Project A Cash flows ($) Project B Cash flows ($)
0 –150,000 –150,000
1 10,000 20,000
2 20,000 50,000
3 50,000 80,000
4 70,000 100,000
5 50,000 150,000
Our task is to select which of the two investments is more advantageous. The payback method simply suggests choosing the capital project that provides quicker repossession of the capital expenditure. Hence, we need to calculate the cumulative Net Cash Flow that is obtained after each year in the future and see when the cumulative Net Cash Flow is at least equal to the capital expenditure. You can see from the calculation made in the example that Project A repays its capital expenditure of $ 150,000 in Year 4, while Project B does so in Year 3. Other things being equal, Project B would be selected.
Try to change the values of the Net Cash Flows and see how this affects payback periods and, therefore, the selection of the project.
The advantages of payback as an appraisal technique are:
• it is simple to calculate
• the emphasis on speed of return of the investment, which may be important if liquidity or risk1 are significant issues
• it avoids having to forecast cash flows beyond the payback point; forecasting is subject to uncertainty, especially the further into the future the forecast is made, so this is an advantage.
But the technique also has disadvantages:
• it ignores cash flows beyond the payback point; projects that are worthwhile when cash flows are considered over the life of the project are rejected because these cash flows are not received quickly enough (notice in the above example that Project A more than recovers its capital outlay by the end of the project’s life)
• it ignores the cost of capital employed to finance the project
• it ignores the’ time value of money’; the positive cash flows received in later years are treated the same as those received earlier in the project’s life2.
1 This assumes risk is a function of time, so that a project that pays back more quickly is less
risky because the present value of any future sum is always lower; see Unit 6.
Unit 1 Investment Appraisal Techniques I
Centre for Financial and Management Studies 9
1.3.2 Accounting Rate of Return (ARR) The accounting rate of return (ARR) is the second major method for invest-
ment appraisal. There are slight variations in its calculation. The basic form
is the ratio of accounting profit generated by an investment project to the
required capital expenditure, expressed as a percentage. Two main methods
of calculation are used:
• the ratio of the average annual profit over the life of a project to the average capital employed; this measure reflects the fact that as the value of the asset is written down over its life through depreciation charges – see below, Box 2.1 – then the firm recovers the costs of the investment during the project’s working life;
• the ratio of the average annual profit over the life of the project to the total investment (capital outlay).
The accounting rate of return may be expressed as:
ROCE =
Average ProfitsInitial or Average Capital Employed
Granted some approximation for the sake of simplicity, accounting profits
can be conceived here as cash flows less depreciation3. You should read Box
1.1 for further information concerning depreciation if you are unfamiliar
with the concept.
Box 1.1 Depreciation
Depreciation is an accounting concept. In order to match the cost of an investment with the revenues the investment produces, a fraction of the initial investment cost is consid-ered an expense in each accounting period. Depreciation is not included in cash flow analysis. With cash flow analysis, all investment expenditures are included in the cash flow only in the year in which the investment cost was actually incurred. If depreciation was included in the cost streams of the cash flow, there would be double counting of the project’s investment costs and therefore the project’s net benefits would be undervalued. This may be important where one receives financial data for inclusion in the investment appraisal cash flow analysis. If you receive data on costs net of depreciation, depreciation should be added back into the cost stream.
Straight-line depreciation
This is the most common form of depreciation. The original or historic cost of a capital asset (less any expected residual or scrap value at the end of the asset’s working life) is divided by the years of its estimated working life to produce an annual depreciation charge or expense to set against revenues. The expression for straight-line depreciation is given as:
2 This objection can be overcome by calculating the discounted payback period. Discounting
is explained in section 1.3.3. Discounting will extend the time period before a project pays back its capital outlay, because the present value of any future sum is always lower than the current value.
3 In practice, there may be other differences arising from non-cash transactions as well; for example, if sales are on credit, then sales cash flows will be lower than the sales revenues as recorded in the profit and loss/income statement (the difference being recorded as an increase in debtors on the balance sheet). To simplify the analysis these are ignored.
Project Appraisal
University of London 10
Dt =
K − SN
where:
Dt = annual depreciation K = the cost of the asset S = scrap or residual value of the asset at the end of its life N = working life of the asset.
Example
A vehicle purchased for $30,000 has an estimated working life of 5 years and an estimat-ed residual value of $5,000.
Dt =
30,000−5,0005
= 5,000
This annual amount is charged against revenues each year for five years. Each year, the value of the asset on the balance sheet is reduced (written down) by the $5,000. Thus at the end of the five years, total depreciation charges will amount to $25,000, and the balance sheet value of the assets will show as $5,000. This final $5,000 (its residual value) is recovered by the sale of the asset for $5,000 (and this, plus the depreciation charges, equals the initial outlay of $30,000). In practice, forecasting this residual value more than five years ahead is likely to be subject to error and may require a further adjustment, depending on the actual sales value realised.
The decision rule for the ARR is that the return generated by the project
should be compared with the cost of the capital employed in the project. For
example, if a project were financed by a loan, the cost of capital would be the
interest rate on the loan. If the interest on the loan were 10%, then a project
must earn more than, or at least equal to, this rate to be acceptable. If the
project were financed by shareholders, the cost would be the return (in the
form of dividends) that shareholders expect on their shares.
If there is a combination of the two sources of finance (shares and loans),
the costs of finance are weighted according to the proportions of each
type involved in the financing of the project. The resulting cost of capital
is called ‘weighted average cost of capital’ or WACC. Calculating the
WACC is important because it sets the benchmark against which the
return generated by the project is compared, when the project is financed
by a combination of different financial sources. Sometimes, the calcula-
tion of WACC gets complicated because of the variety of sources of
finance within contemporary economies, e.g., common stocks, preferred
stocks, bonds, etc., each bearing different costs.
Example
Have a look at the sheet named ‘Example 4’ within the same file. In this example, we see the calculation of ARR of an investment in a capital project. A company is trying to decide whether to invest in a project that involves an initial capital expenditure of $100,000. The project will have an estimated life of four years and it is assumed there will be no residual value of the asset at the end of this period.
Unit 1 Investment Appraisal Techniques I
Centre for Financial and Management Studies 11
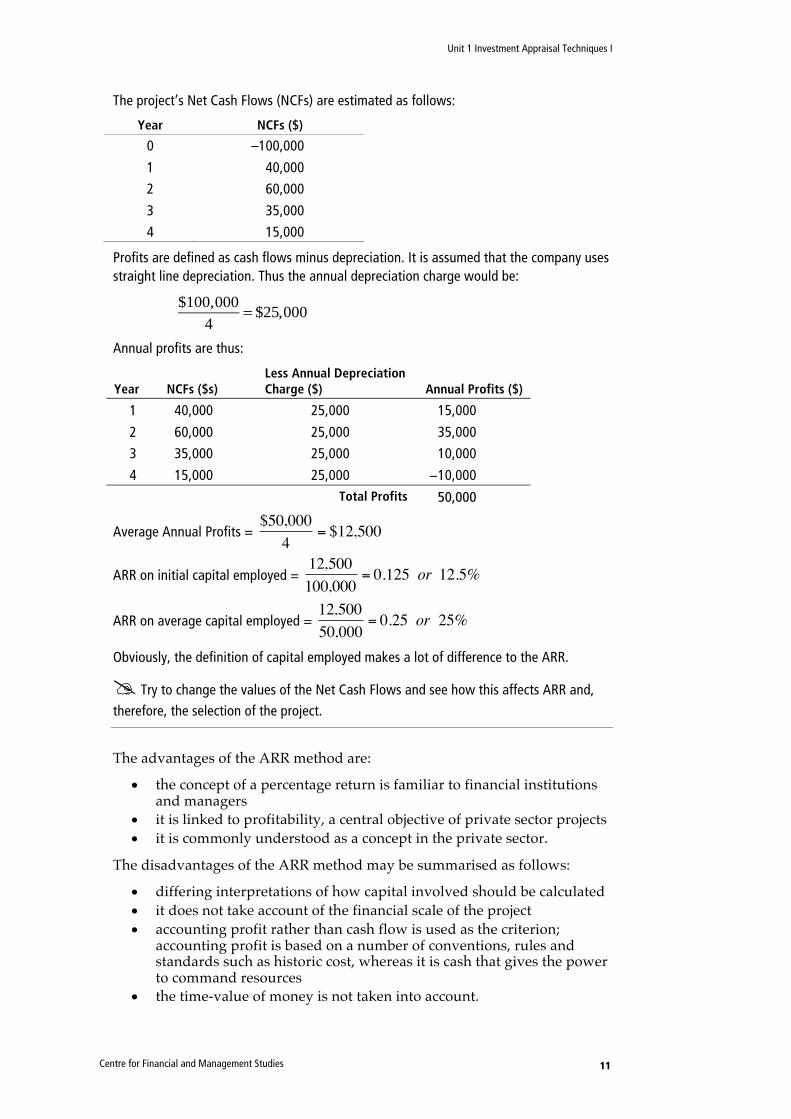
The project’s Net Cash Flows (NCFs) are estimated as follows:
Year NCFs ($)
0 –100,000
1 40,000
2 60,000
3 35,000
4 15,000
Profits are defined as cash flows minus depreciation. It is assumed that the company uses straight line depreciation. Thus the annual depreciation charge would be:
$100,0004
= $25,000
Annual profits are thus:
Year NCFs ($s) Less Annual Depreciation Charge ($) Annual Profits ($)
1 40,000 25,000 15,000
2 60,000 25,000 35,000
3 35,000 25,000 10,000
4 15,000 25,000 −10,000
Total Profits 50,000
Average Annual Profits = $50,0004 = $12,500
ARR on initial capital employed = 12,500100,000 = 0.125 or 12.5%
ARR on average capital employed = 12,50050,000 = 0.25 or 25%
Obviously, the definition of capital employed makes a lot of difference to the ARR.
Try to change the values of the Net Cash Flows and see how this affects ARR and, therefore, the selection of the project.
The advantages of the ARR method are:
• the concept of a percentage return is familiar to financial institutions and managers
• it is linked to profitability, a central objective of private sector projects
• it is commonly understood as a concept in the private sector.
The disadvantages of the ARR method may be summarised as follows:
• differing interpretations of how capital involved should be calculated
• it does not take account of the financial scale of the project
• accounting profit rather than cash flow is used as the criterion; accounting profit is based on a number of conventions, rules and standards such as historic cost, whereas it is cash that gives the power to command resources
• the time-value of money is not taken into account.

Project Appraisal
University of London 12
1.3.3 Discounted cash flow methods Broadly speaking, most of the costs of the capital expenditure or outlay of an
investment project are incurred now (in the present), or in the early years of
a project. Most of the benefits occur further into the future. To make the two
comparable, we need to discount those future benefits so as to express
everything in present value terms. Using present values then reflects the
preference of most people for present consumption over future consump-
tion; we place less value on something expected in the future as compared
with something we receive today. Discounting reflects not only people’s
preferences for current consumption over future consumption, which is
known as time preference, but also the opportunity cost of foregone interest
when we spend today rather than investing for the future. This is called the
time value of money because equal sums of money do not have the same value
if they relate to different time periods.
Reading
If you are unfamiliar with discounting, you should now read from Chapter 6 of your textbook by Boardman et al. pages 137–43, ‘The Basics of Discounting’, and the first part of ‘Compounding and Discounting over Multiple Years’ up to the paragraph heading ‘Net Present Value of a Project’ on p. 143.
In your notes on this reading, be sure to cover the relationship between the discount rate and the discount factor.
Example
Turn now to work sheet named ‘Example 5’ in the ‘ProjectAppraisal_U1v12013.xls’ file. The model shows the calculation that is made to 'convert' future values into present values according to a given discount rate. For example, future values of $2,000 at time 2 and $10,000 at time 4 discounted at the rate of 3% per time period results in total present value of $10,770.
Try to change the values of the parameters and see how this affects the present value. What happens if you increase the discount rate? What happens if you decrease it? How does total present value change if you postpone (or anticipate) future values in time?
Net present value (NPV)
The net present value (NPV) of the project is the total of the discounted net
cash flows over the lifetime of the project. The mathematical expression for
the NPV is:
At
(1+ r)tt=0
n
∑
where At is the project’s cash flows (either positive or negative) in time t; t takes on values from 0 to year n, where n represents the point in time when
the project comes to the end of its life; and r is the annual rate of discount or
the time value of money (which is assumed to remain a constant over the life
Anthony Boardman, David Greenberg, Aidan Vining and David Weimer (2014) Cost- Benefit Analysis, pages cited from Chapter 6 ‘Discounting Benefits and Costs in Future Time Periods’.

Unit 1 Investment Appraisal Techniques I
Centre for Financial and Management Studies 13
of the project), which should reflect the organisation’s cost of capital. The
assumption is that the ‘free’ cash flows generated by the project can be re-
invested at that cost of capital, which – as the opportunity cost – represents
the next best alternative return available.
Example
Have a look at the sheet named ‘Example 6’, which shows the calculation of Net Present Value of an investment in a capital project. A company is deciding whether to invest in a project that requires an initial capital expenditure of $180,000. The project is expected to generate annual Net Cash Flows (NCFs) of $60,000 during its estimated five-year working life, and the asset is expected to have no residual value at the end of this period. The company’s cost of capital is 10%.
The table below assumes that investment takes place in period 0 so that discounting applies from the first year after the investment has occurred. It also assumes that the cash flows accrue at the beginning of each year so that the discounting applies for the whole year. These are common assumptions used to simplify the analysis.
Table 1.2 Discounted Cash Flows
Year NCFs ($)
Discount Factor (r = 10%)
Present Value (PV) ($)
0 –180,000 1.000 –180,000
1 60,000 0.909 54,545
2 60,000 0.826 49,587
3 60,000 0.751 45,079
4 60,000 0.683 40,981
5 60,000 0.621 37,255
Net Present Value (NPV) = +47,447
Please be clear about the difference between the discount rate and the discount factor. The discount rate is r. The discount factor is given by
1(1+ r)t
In this example, r = 0.10, so in Year 1 the discount factor is 1/(1 + 0.10) or 0.909. In Year 2 the discount factor is 1/(1 + 0.10)2 or 0.826. The net cash flow in each year is multiplied by the discount factor for that year. Discount factors can be obtained from discount tables often included in accountancy and finance texts, and can be used for manual calculations. Of course, we can conveniently use the spreadsheet to make the required calculations. In the example, the discount rate is 10% as this represents the company’s cost of capital.
The NPV of the project is the sum of the PV of the future net cash flows less the capital expenditure. That is, $227,447 less $180,000 = $47,447.
Try to change the values of the parameters and see how this affects the Net Present Value. What happens if you increase the discount rate? What happens if you decrease it? How does NV change if the expected life of the project is longer (or shorter)?

Project Appraisal
University of London 14
Notice that NPV measures the absolute addition to the cash of the business,
in present value terms. A project that has a positive NPV should be selected.
If there are several project options, one would normally choose the project
which has the higher NPV over the lifetime of the project. This is because we
are assuming that firms are seeking to maximise shareholder value. A
project with a positive NPV is generating a return that is greater than the
(opportunity) cost of capital and is thus increasing the wealth of the compa-
ny. A project with a negative NPV implies that the company would be better
off investing in alternatives (as indicated by the cost of capital) than invest-
ing in this particular project.
Thus NPV is an appropriate measure for assessing the impact of investment
projects on shareholder value or wealth. It also takes into account the time
value of money, the full life of the project although there may be some bias
in terms of scale.
Reading
Boardman and his colleagues provide additional information on NPV analysis on pages 143–147 of Chapter 6. Please read these pages now.
If you feel that you still unfamiliar with NPV, check that you can calculate the NPV in the example in the reading.
Spreadsheets typically contain inbuilt computing functions that facilitate the
calculation of NPV. We can bypass the effort to calculate the sum of present
values of each net cash flow by using appropriate formulas.
Example
Net Present Value Function
Have a look at the sheet named ‘Example 7’. Let us consider an investment in a capital project that entails a capital expense of $250,000 and the following Net Cash Flow:
Year Net Cash Flow
1 $ 8,500
2 $ 23,700
3 $ 37,700
4 $ 44,850
5 $ 48,425
6 $ 51,925
7 $ 52,000
8 $ 52,000
Let also assume a given discount rate of 3%. The Present Value of the Net Cash Flow can be calculated with the “NPV” function. You can either type the function in any empty cell, or recall the appropriate command from the menu of the spreadsheet (you can find it in the menu Insert / Function). The function requires an argument, whose general syntax is in the form (rate; values), where “rate” is the discount rate and “values” is the vector or matrix of the Net Cash Flow. You can either type the actual figures as the function’s
Anthony Boardman, David Greenberg, Aidan Vining and David Weimer (2014) Cost- Benefit Analysis, pages cited from Chapter 6 ‘Discounting Benefits and Costs in Future Time Periods’.

Unit 1 Investment Appraisal Techniques I
Centre for Financial and Management Studies 15
argument (i.e. 3%; 8,500; 23,700; 37,000…) or you can more conveniently point at the coordinates of the cells that contain the data.
By using the NPV function, you can easily calculate that the Present Value of the capital project is $273,530.
In order to calculate the Net Present Value of the capital project, we need to subtract the capital expense from the Present Value. You will find that the Net Present Value of the capital project is $273,530 – $250.000 = $23,530.
Try to type the functions in the spreadsheet and see if you get these results.
You should notice that the NPV function assumes the cells contain the future net cash flows for the project. In our example, the initial investment occurs in period 0, and Net Cash Flows begin at the end of period 1. Therefore, to calculate the Net Present Value of the project, you need to subtract the initial investment (in period 0) from the NPV of the Net Cash Flows in next periods.
Internal rate of return (IRR)
The internal rate of return of the project is defined as that rate of discount
which, when applied to the project’s cash flows, produces a zero NPV. The
mathematical expression for the IRR is therefore linked to the expression for
the NPV:
At(1+ r)t = 0t=0
n
∑
Example
Now we will demonstrate the calculation of IRR. Have a look at the sheet named ‘Example 8’. Let us assume that we wish to calculate the IRR of an investment in a capital project equal to the one that we used in the previous exercise. We can proceed in two ways. In the first approach, we try to find IRR through a sequence of approximations. We know that at a discount rate of 10%, the NPV was positive, so to find the IRR, the DR needs to be raised (in order to lower the PV). This is a trial and error process if done manually. A discount rate of 21% produces a negative NPV. So we know that the Internal Rate of Return (IRR) is below this rate. It may take you a while, but after some further trials you may find that the IRR is about 19.85-19.86%.
Table 1.3 Calculation of IRR
Year NCFs ($) Discount Factor
(r = 10%)
Present Value (PV)
($s) Discount Factor
(r = 21%) PV ($s)
0 –180,000 1.000 –180,000 1.000 –180,000
1 60,000 0.909 54,545 0.826 49,587
2 60,000 0.826 49,587 0.683 40,981
3 60,000 0.751 45,079 0.564 33,868
4 60,000 0.683 40,981 0.467 27,990
5 60,000 0.621 37,255 0.386 23,133
NPV = +47,447 NPV = –4,441

Project Appraisal
University of London 16
In the second approach, we make use of powerful tools of the spreadsheet. Rather than manually searching for IRR, we can have the software do the effort for us. We can use the command “Goal Seek” of the spreadsheet, which you should find – depending on the software that you use and its version – within the “What-if Analysis” menu or the “Tools” menu. You can fill in details about the “Formula cell” that you wish to get equal to the “Target value” by changing the “Variable cell”. In our model, we wish the cell that contains the NPV to be set equal to zero by changing the value of the cell that contains the discount rate. The command allows to find IRR remarkably faster and more precisely than we can most probably get by manually changing the discount rate: we should get that IRR is equal to 19.8577097873201%.
Try both approaches by working on the sheet “Example 7”. First, try to find IRR by manually changing the discount rate (cell D14). Then, try to calculate IRR by using the “Goal Seek” command so that it will be the software to search for you the value of the discount rate (D40) that makes NPV = 0.
The decision rule is to accept any projects whose IRR exceeds the organisa-
tion’s cost of capital since this will add to shareholder wealth, and
consequently, reject any project that does not meet this criterion. If we
continue to assume that this company’s cost of capital is 10%, then the
project generates a higher return than this and should be accepted. Typical-
ly, companies, especially large diversified ones with many different business
units or product divisions, will set ‘hurdle rates’ for IRR; that is, the mini-
mum acceptable rate of return that projects must generate to be acceptable
(this is sometimes called ‘soft capital rationing’). Occasionally in financial
analysis (as opposed to social cost-benefit analysis which is considered in
Unit 3), these discounting methods are referred to as the financial net pre-
sent value and the financial internal rate of return.
Reading
The IRR is explained on pages 160–62 in Chapter 6 of your textbook, which you should read now.
Make sure your notes cover the defects of IRR, which are discussed in the last Section on p. 162.
In the case of independent projects there is no conflict between NPV and
IRR. A project that yields a positive NPV will generate an IRR that exceeds
the cost of capital. But if you have to choose between alternative projects, a
conflict between the two methods can arise (this is looked at in detail in next
unit).
An investment project whose cash flows are discounted at x% generates an
NPV of $y. The IRR, the rate of discount that just makes the NPV equal to
zero, is shown where the NPV curve intersects the horizontal axis. That is,
the higher the rate of discount, the lower the NPV, until that NPV is zero.
Any further increase in the DR produces a negative NPV. The relationship
between NPV and IRR is shown in Figure 1.2 below:
Anthony Boardman, David Greenberg, Aidan Vining and David Weimer (2014) Cost-Benefit Analysis, pages cited from Chapter 6 ‘Discounting Benefits and Costs in Future Time Periods’.

Unit 1 Investment Appraisal Techniques I
Centre for Financial and Management Studies 17
Figure 1.2 Relationship between NPV & IRR
As before, we can make use of the inbuilt computing functions of spread-
sheets for calculating IRR while avoiding the search for the discount rate
that makes NPV equal to nil.
Example
Internal Rate of Return Function
A similar procedure can be carried out to conveniently calculate the Internal Rate of Return of the project. Have a look at the sheet named ‘Example 9’ within the same file. Here we will calculate the Internal Rate of Return of the same model that we used before. The Internal Rate of Return can be calculated with the “IRR” function of the spreadsheet (again, you may find it in the menu Insert / Function). The argument of this function is in the form (values; guess), where “value” is a vector or matrix of the Net Cash Flow and “guess” is just a number from where calculation will start to approximate the value of IRR in an iterative fashion. You can either type the actual figures as the function’s argument (i.e. 8,500; 23,700; 37,000 … ; and for example 5% as “guess”) or you can more conveniently point at the coordinates of the cells that contain the data of the Net Cash Flow.
By using the IRR function, you should find that the Internal Rate of Return of the capital project is about 4.83%.
Try to type the function in the spreadsheet and see if you get that result.
Benefit–cost ratio
Another measure that is used in net present value analysis is the benefit–cost ratio of different project options. This is also called the profitability index. The
benefit-cost ratio compares the present value of project benefits with the
present value of project costs over the project life. In effect, this displays the
PV of returns per $ invested. Thus, with two project options, one would
normally choose a project with a benefit-cost ratio of, for example, 3.0 over a
project with a benefit-cost ratio of 2.5. The mathematical expression for the
benefit cost ratio is
NPV
IRR
NPV
Discount rate (%)x %0
y $

Project Appraisal
University of London 18
BCR =(B(t)) / (1+ d)t
t∑
(C(t)) / (1+ d)t
t∑
where:
BCR is the benefit-cost ratio d is the rate of discount t is the number of years from the base year, for each year of
the project period B(t) and C(t) are total benefits and total costs in year t.
At any discount rate d:
• if BCR > 1.0, accept the project proposal
• if BCR < 1.0, reject the project proposal
• if BCR = 1.0, there will be no net effect whether the project proposal is accepted or not.
Example
If we continue to use the same example that we used to illustrate NPV and IRR, then, at a rate of discount of 10%, the project yields the following benefit-cost ratio:
Net cash flows in present value terms = $227,447 Capital expenditure = $180,000 Benefit-cost ratio = 1.26
In the case of independent projects, both benefit-cost ratio and NPV give the same result. A project that yields a positive NPV must have a benefit-cost ratio greater than one.
Reading
Please now read the section in your textbook, “Applications of the Decision Rule in Practice” beginning on pages 32–34 in Chapter 2, which explain the benefit-cost ratio. Notice particu-larly the problem of using the benefit-cost ratio when comparing projects of different scale.
How widely used are these methods of financial decision making, and are
they applied in the same way in different systems of market economy? This
is the subject of the next reading. You will see that there are significant
differences between the three economies covered in the study, concerning
which investment appraisal methods are used, and also differences in the
criteria used (e.g. length of pay-back period, required return on investment).
Reading
Please now read the article by Carr and Pudelko, on their international comparison of management practices. The section on finance, pages 79–81, and the first part of the discussion on pages 89–90 highlight the differences in the use of investment appraisal techniques such as discounted cash flows (DCF) payback and return on capital as between the different countries.
Your notes should cover the main issues raised in this unit.
Anthony Boardman, David Greenberg, Aidan Vining and David Weimer (2014) Cost- Benefit Analysis, pages cited from Chapter 2 ‘Conceptual Foundations of Cost- Benefit Analysis’.
Chris Carr and Markus Pudelko (2006) ‘Convergence of Management Practices in Strategy, Finance and HRM between the USA, Japan and Germany’, reprinted in the Module Reader from the International Journal of Cross Cultural Management.

Unit 1 Investment Appraisal Techniques I
Centre for Financial and Management Studies 19
1.4 Conclusions This unit has introduced you to some of the basic methods used in invest-
ment appraisal, and their respective strengths and weaknesses. The main
methods considered are those commonly used in private sector investment
appraisal; they include
• the payback period
• accounting rate of return (ARR)
• net present value (NPV)
• internal rate of return (IRR)
• benefit-cost ratio.
The two principal methodologies, however, are NPV and IRR. While this
unit has been mainly concerned with investments in the private sector, the
methodologies also form the basis for project appraisal as part of a social
cost-benefit analysis of the wider costs and benefits to society, which you
will study in Unit 3. Investment appraisal techniques, by definition, concen-
trate on the financial viability of the project or proposed investment.
A summary of the strengths and weaknesses of investment appraisal tech-
niques is contained in Table 1.4.
Table 1.4 Summary of the Strengths and Weaknesses of Investment Appraisal Techniques
METHOD STRENGTHS WEAKNESSES
Payback Simplicity Emphasis on speed of return of the investment Avoids having to deal with cash flows in future periods
Ignores total cash flows beyond the payback period Ignores the time value of money
Accounting Rate of Return (ARR)
Based on profitability Focuses on corporate financial performance Relatively easy calculation Commonly understood as a concept in the private sector
Possible different definitions of what to include in the cost streams Ignores the scale of investment Ignores time value of money
Discounted cash flow – Net Present Value (NPV)
Takes account of the time value of money Focuses on project worth and thus impact on shareholder value Takes account of scale of investment solution is determinate The NPV decision rule performs better than the IRR of the incremental cash flow in choosing between mutually exclusive projects
No indication of the safety margin of the investment Concept of NPV less familiar than rate of return

Project Appraisal
University of London 20
Discounted cash flow – Internal Rate of Return (IRR)
Takes account of the time value of money Gives an idea on the safety margin of the investment More familiar concept than NPV – rate of return
No account taken of investment scale Assumes interim reinvestment of revenue at the project’s own rate of return Problems with mutually exclusive projects
References Boardman A, D Greenberg, A Vining and D Weimer (2014) Cost–Benefit Analysis, Harlow UK: Pearson Education Ltd. Carr C and M Pudelko (2006) ‘Convergence of Management Practices in Strategy, Finance and HRM between the USA, Japan and Germany’, International Journal of Cross Cultural Management, 69(1), 75–100. Potts D (2002) Project Planning and Analysis for Development, London UK: Lynne Rienner.