progressive collapse analysis
TRANSCRIPT
R.JEYANTHI

PROGRESSIVE COLLAPSE

CAUSES
Design mistake
Faulty construction
Abnormal load events
Pressure Loads Impact Loads
- Internal gas explosions - Aircraft impact
- Blast - Vehicular collision
- Wind over pressure - Earthquake
- Extreme values of - Overload due to
environmental loads occupant overuse

PROGRESSIVE COLLAPSE DESIGN STRATEGIES
TYPE OF APPROACHES
DIRECT
SPECIFIC LOCAL
RESISTANCE
ALTERNATE PATH
METHOD
INDIRECT
PRESCRIPTIVE DESIGN RULES

OBJECTIVE
To design G+8 RC structure
To analyze the structure by Non linear static analysis method
To perform pushover analysis for the structure with removal of critical columns fully and partially
To determine the potential for progressive collapse
To give the preventive measures
SCOPE
Reduction of potential for progressive collapse in new and renovated Federal buildings
Potential of progressive collapse is assed using Non linear static analysis
method since it gives economical design


STUDYING THE VULNERABILITY OF STEEL MOMENT RESISTANT FRAMES SUBJECTED TO PROGRESSIVE COLLAPSE
Mojtaba Hosseini, Nader Fanaie and Amir Mohammad Yousefi
Steel Building
10 storey building, 5x5 panels each 5x5m
Analysis Nonlinear Dynamic Procedure
Removal Corner columns from 1st storey, 5th storey, 8th storey and 9th storey
S/W Open Sees program
Results After the removal of corner column A1compressive axial forces of adjoining column and in other columns
CASE I increased 8.8 times the primary forces and 5.21 times.
CASE II increased 8.6 times the primary forces and 5.16 times
CASE IIICASE IV
increased 8.67 times the primary forces and 5.19 timesincreased 8.66 times the primary forces and 5.23 times
Conclusion The axial force values of adjoining columns are 30% and 40% greater than their ultimate strengths Safety is achieved by increasing column dimensions or using new materials and methods.

PROGRESSIVE COLLAPSE ANALYSIS OF A REINFORCED CONCRETE FRAME BUILDING
Shefna L Sunamy, Binu P, Dr. Girija K
Building description
12 storey R.C. building. Six bays of 5 m in the longitudinal direction , four bays of 5 m in the transverse direction
Modeling & analysis
The structure is modeled using SAP 2000 Non Linear static progressive collapse analysisSeismic loading is considered (Zone II, III, IV ,V)
Column removal scenario
Long side column removed Short side column removed Corner column removed
DCR Demand capacity ratio should satisfy acceptance criteria
GSA guidelines
DCR < 2.0 for typical structural configurations DCR < 1.5 for atypical structural configurations
Conclusion Seismically Designed building resist progressive collapse.Nonlinear static analysis reveals hinge formation starts from the location having maximum demand capacity ratio.To mitigate progressive collapse an alternate load path has to be provided (Providing bracings, increasing column dimension)

Progressive Collapse Analysis of Reinforced Concrete Framed Structure Raghavendra C, Mr. Pradeep A R
Building description
-For the analysis, a typical frame of height 37.5 m is considered -All the supports are modeled as fixed supports
Analysis - Linear Static analysis is used to analyze the structure
Software -ETABS v9.7 for the IS 1893 load combinations
Column removal
- For PC analysis the columns at eight different location is removed for each case
Progressive
Collapse Analysis
-RC frame in the earthquake zones 2, 3, 4 and 5 is designed usingETABS program for dead, live, wind and seismic loads.
- The specified GSA load combination was applied- The Demand Capacity Ratio (DCR), the ratio of the member force and themember strength is calculated.
Conclusion - While removing the column the intersecting beams of the shorterspan beams tend to take the extra burden load and DCR values ofthat beams were more compared to longer span beams.- To avoid the progressive failure of beams and columns, adequatereinforcement is required to limit the DCR within the acceptancecriteria.

PROGRESSIVE COLLAPSE ANALYSIS OF REINFORCED CONCRETE FRAMED STRUCTURE
Rakshith K , Radhakrishna
Buildingdescription & Modeling
Typical frame structure of height 37.5m is considered.
It is modeled using ETABS v9.7 software. Linear static analysis is conducted on each of these models.
Analysis Analysis is carried out by ETABS Software for IS 1893 load combinations.
Column removal
Critical Column are removed for progressive collapse analysis in different cases. Separate linear static analysis is performed for each case.
DemandCapacity ratio
DCR for flexure at all storeys is calculated for three cases of column failure. Demand capacity ratio < 2.0 (acceptance criteria as per GSA 2003
Results C1 removed
B1 and B5 exceed acceptance criteria value suggested by GSA for progressive collapse guidelines
C16removed
B23 and B24 exceed acceptance criteria value suggested by GSA for progressive collapse guidelines as
C18removed
B25 and B26 exceed acceptance criteria value suggested by GSA for progressive collapse guidelines
Conclusion Progressive failure of beams and columns is avoided by adequate reinforcement is required to limit the DCR within the acceptance criteria. It can develop alternative load paths

Progressive Collapse of Steel Frames Kamel Sayed Kandil, Ehab Abd El Fattah Ellobody
Steps carried out:
Modeling
Cases considered
Results
2D models for different cases and 3D model is analysed and
compared
3, 6, 9, 12 storey building is considered for damping ratio 5%,
6%, 8%, 10%
Finally all the cases were compared
Conclusion: Increase in damping ratio decrease the lateral deflection
Increase in no of stories decreases the potential for
progressive collapse
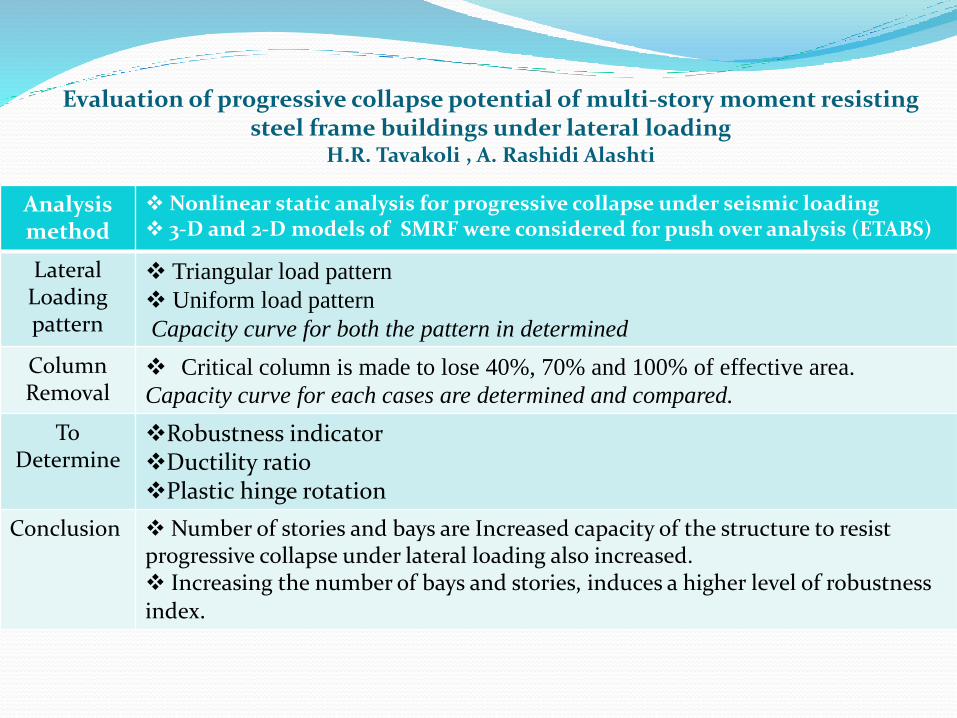
Evaluation of progressive collapse potential of multi-story moment resisting steel frame buildings under lateral loading
H.R. Tavakoli , A. Rashidi Alashti
Analysis method
Nonlinear static analysis for progressive collapse under seismic loading 3-D and 2-D models of SMRF were considered for push over analysis (ETABS)
LateralLoading pattern
Triangular load pattern
Uniform load pattern
Capacity curve for both the pattern in determined
ColumnRemoval
Critical column is made to lose 40%, 70% and 100% of effective area.
Capacity curve for each cases are determined and compared.
ToDetermine
Robustness indicatorDuctility ratio Plastic hinge rotation
Conclusion Number of stories and bays are Increased capacity of the structure to resist progressive collapse under lateral loading also increased. Increasing the number of bays and stories, induces a higher level of robustness index.

3-D Nonlinear Static Progressive Collapse Analysis of Multi-story Steel Braced Buildings
H.R. Tavakoli, A. Rashidi Alashti & G.R. Abdollahzadeh
Building description
Special dual system SMRF with concentrically X braces CASE I - 5 stories buildings with 4 spans CASE II - 15 stories buildings with 6 spans
Lateral load patterns
Uniform pattern +ve and –ve Triangular pattern +ve and -ve
ToDetermine
Robustness indicatorDuctility ratio Plastic hinge rotation
Conclusion Triangular pattern induce the least capacity curve for intact and damage structureRobustness index in uniform and triangular pattern is almost the same. Number of stories and bays are increased larger capacity to resist progressive collapse under lateral loading and higher level of robustness index obtained.

Progressive Collapse Assessment of RC Structures under Instantaneous and Gradual Removal of Columns
A.R. Rahai, M. Banazadeh, M.R. Seify Asghshahr & H. Kazem
Building description
5 story RC structure model with RC resisting moment frames at either side was designed using a high ductility level.
Column removal scenario
Three columns are removed, Instantaneously Gradually
Analysis method
For instantaneous removal method static analysis is performed
In gradual reduction method concrete strength reduction factor is determined
Modeling 3D model of the RC structure was developed using Opensees software
Results Instantaneous removal- 4 sec once column C1 was removed - Maximum vertical displacement is 1.411 m occurring at t=1.19 sec.
Gradual removal- 34200 sec once column C1 was removed- Maximum vertical displacement is 1.03m.

Progressive Collapse Analysis Of Building
Miss. Preeti K. Morey Prof S.R.Satone
Mathematicalmodeling
Using STADD Pro software 3d model of a frame is analyzed
DCR ( AcceptanceCriteria)
For typical structure (symmetrical structure) = DCR≤ 2.0For typical structure (unsymmetrical structure) = DCR≤ 1.5 DCR= M max / Mp
Performanceanalysis
C1 , C3 is removed and critical column is identified for both static and seismic case. Result of column wise DCR of Linear Static analysis and linear dynamic analysis for both static and seismic case is considered.
CONCLUSION Case II - RC Frame with removal of column c3 has highest DCR value in comparison with case I. DCR of column c3 is 1.98 which is less than 2 i.e. GSA criteria. Hence the frame is less vulnerable to progressive collapse.

Analytical Study of Seismic Progressive Collapse in one-Story Steel BuildingF. Nateghi Alahi
Introduction Corner-column building was weakened to navigate the initial damage toward a certain part of the structure. Nonlinear static analysis was carried out
FEM GSA progressive collapse guidelines were applied
NumericalAnalysis
Combination of gravity loads was applied to the structure and then the push-over analysis was carried Plastic hinges of Damaged and primary model was compared. Push over curve indicates that damaged model has less secondary stiffness than the primary one.
Conclusion Collapse pattern is in a way that the deformation of damaged frame increases near the failed column and further away from it, deformation of the frames decreases. So during an earthquake progressive collapse gets started fromdamaged frames then passes through the others beside it.

Linear and nonlinear analysis of progressive collapse for seismic designed steel moment frames.
M. A. Hadianfard & M. Wassegh
Structuralmodel
3-story and 6-story SMRF designed for medium level and very high level seismic zones
Analysis -Linear static analysis & Non Linear static analysis carried out as per 1. GSA 2003, 2. UFC 2009
- Push down curves are determined
Conclusions - potential of progressive collapse decreases with increasing the height of the structures - In short steel structures steel structures designed for higher seismicity, there is less possibility of occurrence of progressive collapse.- In LSA, the resisting-capacity of progressive collapse of UFC 2009 is less than the GSA 2003. And for NLSA it is vice versa- For mitigating progressive collapse, the gravity loads should not have one-way patterns, so that gravity loads will not be concentrated in some elements and the potential of progressive collapse can be decreased in the structure.

Progressive Collapse Analysis of an RC Building with Exterior Non-Structural WallsMENG-HAO TSAI*, TSUEI-CHIANG HUANG
Types of Exterior Non-Structural Walls
Parapet-type wall, Wing-type wall , Panel-type wall.
Building description Column loss scenario
Elastic displacement Progressive Collapse Analysis
10-story, MRRC building with a 2-story basement In 1st storey at 3 different location columns are removed
(Case 1A, 1B, 2A) RC frame > parapet walls >wing walls >panel walls linear static analysis and Non linear static analysis
Conclusion Linear static analysis results - DCRs of beams are generally reduced with consideration of the exterior walls
Nonlinear static analysis results - collapse resistance of the RC building subjected to column loss may be significantly increased with the wing-type walls

Fragility Assessment of Progressive Collapse BuildingsKuan-Hsoung Chen
Objective
Modeling
- To identify the progressive damage by the nonlinear pushover analysis.- 2D nine-story, 3bay MRF building
Column loss scenario
Capacity curves
- 8 cases were considered- T of various locations of column removal scenarios were determinedNonlinear pushover analysis-capacity of column loss in 1st story is 3 times greater than column in roof story.- Strength of removal interior columns are greater than corner column loss.
Nonlinear hinges plastic hinges is generated from lower story to higher story with an increase of incremental vertical loadings
Conclusions - Ground level column loss activate the damage above the column removal and don’t propagate to its neighboring spans. - The roof level column loss only leads to local damage

Assessment of progressive collapse-resisting capacity of steel moment frames
Jinkoo Kima, Taewan Kimb
Analysis procedure
Acceptance criterion(as per GSA2003)procedure for linear static analysis
Applied loads for static and dynamic analyses
-DCR vary from 1.25 to 3.0
- Remove column , carry linear static analysis
- Check DCR in each structural member- At each inserted hinge, equal but opposite moments are applied -Steps are repeated until DCR of any member does not exceed the limit - For static analysis both the GSA 2003 and the DoD 2005 use dynamic amplification factor of 2.0 in load combination
Analysis of model Open sees software- Linear dynamic and Non linear dynamic analysis is carried out
Conclusion - SMRF designed for lateral load is less vulnerable for progressive collapse. -potential for progressive collapse was highest when a corner column was suddenly removed.- progressive collapse potential decreased as the number of story increased.

Design of steel moment frames considering progressive collapseJinkoo Kim and Junhee Park
Analysis of structure
• 3x3 bay and 9-story. Span length are varied as 6 m, 9 m, and 12m.• Nonlinear dynamic analysis using the program code OpenSees
Progressive collapse potential.
- Vertical deflection as bay width and girder size decreases .- beam size may lead to strong beam weak Column.- Weak story is prevented if summation of plastic moment capacity of columns > than beam.
Plastic design
- vertical deflection if damping ratio and stiffness ratio
Conclusion Structures redesigned by plastic design method to prevent progressive collapse turned out to satisfy the given failure criterion in most of the model structures.

METHODOLOGY
Detailed study of literature review
G+8 RCC building is taken for Project
Prepare AUTO CAD plan for G+8 structure
Modeling in ETABS
Non linear static analysis is carried out
Identification of critical column
Removal of critical column to initiate progressive collapse
DCR, Robustness indicator are determined
Result comparison – before & after progressive collapse
check for acceptance criteria as per GSA 2003 guidelines
By this evaluation a building can be assessed whether it can withstand progressive collapse

AUTO CAD DRAWINGS


ETABS Modeling

Front and side elevation of building

Non Linear static analysisSteps to be followed: Preliminary Pushover Analysis
Procedure:- Modeling of structure is carried out- Load cases are defined
- Loads are assigned- Load combinations are provided as per IS 875 part 5
Seismic load case:
Response spectrum user defined file
ELX Res spec x
ELY Res spec y
Wind load case:Applied as point load in floor diaphragms
WLX Wind load along X direction
WLY Wind load along Y direction
Gravity load case:
DL Self weight
DI Super imposed load
LL 1 live load greater that 3
LL 2 live load lesser than 3

Load combination as per IS 875 part 5DL – Dead load, DI – Dead Imposed, WLX- Wind load in direction, WLY – Wind load in Y direction,
EQX,EQY – Seismic load in X&Y direction
Basic Load Case COMB001 - 1.5 DL + 1.5 DL1 + 1.5 DL2 + 1.5 LL1 + 1.5 LL2 + 1.5 LL3
Seismic Load CasesCOMB002 - 1.2 DL + 1.2 DL1 + 1.2 DL2 + 0.6 LL1 + 0.3 LL2 + 1.2 ELX COMB003 - 1.2 DL + 1.2 DL1 + 1.2 DL2 + 0.6 LL1 + 0.3 LL2 + 1.2 ELY COMB004 - 1.5 DL + 1.5 DL1 + 1.5 DL2 + 1.5 ELX COMB005 - 1.5 DL + 1.5 DL1 + 1.5 DL2 + 1.5 ELY COMB006 - 0.9 DL + 0.9 DL1 + 0.9 DL2 + 1.5 ELX COMB007 - 0.9 DL + 0.9 DL1 + 0.9 DL2 + 1.5 ELY
Wind Load Cases COMB008 - 1.2 DL + 1.2 DL1 + 1.2 DL2 + 1.2 LL1 + 1.2 LL2 + 1.2 LL3 + 1.2 WLX COMB009 - 1.2 DL + 1.2 DL1 + 1.2 DL2 + 1.2 LL1 + 1.2 LL2 + 1.2 LL3 - 1.2 WLX COMB010 - 1.2 DL + 1.2 DL1 + 1.2 DL2 + 1.2 LL1 + 1.2 LL2 + 1.2 LL3 + 1.2 WLY COMB011 - 1.2 DL + 1.2 DL1 + 1.2 DL2 + 1.2 LL1 + 1.2 LL2 + 1.2 LL3 - 1.2 WLY COMB012 - 1.5 DL + 1.5 DL1 + 1.5 DL2 + 1.5 WLX COMB013 - 1.5 DL + 1.5 DL1 + 1.5 DL2 - 1.5 WLX COMB014 - 1.5 DL + 1.5 DL1 + 1.5 DL2 + 1.5 WLY COMB015 - 1.5 DL + 1.5 DL1 + 1.5 DL2 - 1.5 WLY COMB016 - 0.9 DL + 0.9 DL1 + 0.9 D + 1.5 WLX COMB017 - 0.9 DL + 0.9 DL1 + 0.9 DL - 1.5 WLX COMB018 - 0.9 DL + 0.9 DL1 + 0.9 DL2 + 1.5 WLY COMB019 - 0.9 DL + 0.9 DL1 + 0.9 DL2 - 1.5 WLYLoad combination as per GSA Guidelines For static Analysis2 ( LL + 0.25 DL)

Maximum displacement occurs for the combination 1.5DL+ 1.5DI + 1.5WLY For this combination the bending moment action and axial force on the columns in the ground floors were compared to identify the critical members
Alternate path methodThe ratio of bending moment of the damaged building to the intact building is calculated to check the bending moment behavior of the adjacent columns and adjoining beams of the removed column
Based on this the alternate path for the load flow can be figured out

Bending Moment Behavior of structural elements in Case1 (for load combination based on IS 875 part 5)
Bending Moment acting on frame
Bending Moment ratio(Intact to collapsed frame)

Bending Moment Behavior of structural elements in Case1 (for load combination based on GSA guidelines)
Bending Moment acting on frame
Bending Moment ratio(Intact to collapsed frame)

Bending Moment Behavior of structural elements in Case2 (for load combination based on IS 875 part 5)
Bending Moment acting on frameBending Moment ratio
(Intact to collapsed frame)

Bending Moment Behavior of structural elements in Case2 (for load combination based on GSA guidelines)
Bending Moment acting on frameBending Moment ratio
(Intact to collapsed frame)

Bending Moment Behavior of structural elements in Case3 (for load combination based on IS 875 part 5)Bending Moment acting on frame
Bending Moment ratio(Intact to collapsed frame)

Bending Moment Behavior of structural elements in Case3 (for load combination based on GSA guidelines)Bending Moment acting on frame
Bending Moment ratio(Intact to collapsed frame)

In the case1 the bending moment of the columns in the storeysabove the location of removed column remains unchanged, where as the bending moment of the columns in the storey adjacent to either side of the removed column as been increased. And the bending moments of adjoining beams were also increased.
In the case2 also the bending moment of the columns in the storeys above the location of removed column remains unchanged and the bending moment of columns in the storey adjacent to either side of the removed column as been increased. And the bending moments of adjoining beams were also increased.
In the case 3 the bending moment of the columns in the storeysabove the location of the removed column has been reduced and the bending moments has been increased for the remaining columns in the ground storey. And the bending moments of adjoining beams were also increased.

Demand Capacity ratio
Demand Capacity Ratio (DCR) is the ratio of Member force to the Member strength.
DCR = Member force/ Member strength
Allowable DCR < 2, for typical structural configuration,
< 1.5, for atypical structural configuration.
DCR is calculated for the each elements in the frame which consists of removed column

DCR values for case 1(for gravity loads) (for gravity loads and lateral
loads)

DCR values for case 2(for gravity loads) (for gravity loads and lateral
loads)

DCR values for case 3(for gravity loads) (for gravity loads and lateral
loads)

According to the GSA guideline atypical frame building having DCR values greater than 1.5 indicate that the portion is severely damaged and have more damage potential.
It can be seen that in the third case that the demand to capacity ratio (DCR) values exceeds the acceptance criteria in the first and second storey beam. But in other spans damage could not propagate.
(for gravity loads) (for gravity loads and lateral loads)
The maximum DCR value experienced by the frame is 1.71. So in the third case there is possibility for the spread of collapse.
The maximum DCR value experienced by the frame is 1.7. So in the third case there is possibility for the spread of collapse.

Robustness Indicator
Here since the robustness Indicator is almost equal to 1, the structure is able to provide an alternative load path if the structure is damaged.
Cases Removed
column
V damaged Robustness
indicator
Case1 Middle 6837KN 0.99
Case2 Inner 6837KN 0.99
Case3 Corner 6836KN 0.94

Summary From Comparing the Bending Moment and shear force
for Intact structure and all the three cases it has beenconcluded that in case 3 the bending moment andshear has been increased more (ie When the cornercolumn is removed BM and SF increase morecompared to other cases).
After determining the DCR values for gravity loadsalone and lateral loads, then it is compared.
Robustness Indicator is calculated for Intact and otherthree cases and it is not equal to 0ne expect for intact,which shows that the building is vulnerable.