progress report: subsidence in california, march 2015 – … 4.7 miles of the aqueduct experiencing...
TRANSCRIPT

1
ProgressReport:SubsidenceinCalifornia,March2015–September2016TomG.Farr,CathleenE.Jones,ZhenLiuJetPropulsionLaboratoryCaliforniaInstituteofTechnologyExecutivesummarySubsidencecausedbygroundwaterpumpingintheCentralValleyhasbeenaproblemfordecades.Overthelastfewyears,interferometricsyntheticapertureradar(InSAR)hasbeenusedfromsatellitesandaircrafttoproducemapsofsubsidencewithsensitivityoffractionsofaninch.Forthisstudy,wehaveobtainedandanalyzeddatafromtheEuropeanSpaceAgency’ssatellite-borneSentinel-1AfromtheperiodMarch2015–September2016andtheNASAairborneUAVSARfortheperiodMarch2015–June2016,andproducedmapsoftotalsubsidencefromthetwodatasets.ThesedataaddtotheearlierdataprocessedfromtheJapanesePALSARfor2006–2010,CanadianRadarsat-2fortheperiodMay2014–January2015,andUAVSARforJuly2013-March2015,forwhichsubsidencemeasurementswerereportedpreviously(Farretal.,2015).HerewealsopresentresultsfortheSouth-CentralcoastofCaliforniaincludingVentura,Oxnard,SantaBarbaraandnorthtotheSanJoaquinValleyaswellastheSantaClaraValleyfromcolleagueswhohaveprocessedSentinel-1AdatacoveringMarch2015–March2016.Asmultiplesceneswereacquiredduringtheseperiods,wecanalsoproducetimehistoriesofsubsidenceatselectedlocationsandtransectsshowinghowsubsidencevariesbothspatiallyandtemporally.GeographicInformationSystem(GIS)fileswillbefurnishedtoDWRforfurtheranalysisofthe4-dimensionalsubsidencetime-seriesmaps.ThenewSentinel-1AdatashowthetwoknownmainsubsidencebowlsintheSanJoaquinValley:ThelargeriscenteredonCorcoranandextends60milestotheNW,affectingtheCaliforniaAqueduct.FortheperiodMay2015–September2016,maximumtotalsubsidencewasfoundtobeabout22”nearCorcoran.AsecondbowliscenteredonElNidoandisapproximately25milesindiameter,encompassingmostoftheEastSideBypass.FromMay2015–September2016maximumsubsidencetotaledabout16”SEofElNido.Anewarea,notedinthepreviousRadarat-2datanearTranquilityabout10miSEofMendota,hasintensifiedintheSentinel-1Adataandsubsidedabout20”betweenMay2015–September2016.IntheSacramentoValley,DavisandWoodlandsubsidedabout2”fromMarch2015–June2016andanunusuallysmallintenseareaofsubsidencedetectedinthepreviousreportnearArbuckleshowedamaximumsubsidenceofabout12”.SierraValley,anareanorthofLakeTahoenotobservedinthedataacquiredfortheearlierreportshowedsubsidenceofabout6”inanareacoincidentwithloweredwaterlevelsinwells.DatawerecollectedwiththeNASAUAVSARairborneplatformoverthesametwoswathspreviouslyacquired,andcenterontheCaliforniaAqueductinordertoevaluatesubsidenceonorneartheaqueductusingahighspatialresolutionsyntheticapertureradarinstrument.ThenorthernswathcoverstheCaliforniaAqueductfromtheareaimmediatelynorthofSanLuisReservoirtojustsouthofKettlemanCity,andthesouthernswathcovers

2
theCaliforniaAqueductfromduewestofButtonwillowtotheEdmonstonPumpingPlant.Timeseriesanalysisshowssubsidencetobehighlyvariableacrossthisextent,aswasobservedandreportedfortheearlierUAVSARdataset[Farretal.,2015].ThefastestsubsidenceisagainobservedalongthenorthernstretchoftheaqueductattheAvenalCut-offRd.hotspotidentifiedfirstinsummer2014,whereboththeamountofsubsidenceoftheaqueductandtheextentofaqueductexperiencinghighsubsidencehasincreasedsubstantially.FortheperiodJuly2013–June2016subsidenceatthecenterofthesubsidencebowl,locatedinthesameplaceasbefore(lessthanhalfamilefromtheaqueduct),isnow27.6”,withmaximumsubsidenceoftheaqueductstructureequalto25”and4.7milesoftheaqueductexperiencing>10”ofsubsidence.ForreferencewenotethatthepreviouslyreportedvaluesfortheperiodJuly2013-March2015were13”maximumsubsidenceoftheaqueductand>8”ofsubsidencealonga1.3milestretchoftheaqueduct.AlthoughlowerthanattheAvenalsite,highsubsidencecontinues(1)alongthehistoricallysubsidingareacenteredapproximatelyonaqueductCheck16,andlocalizednear(2)Check15,(3)Check19,(4)Check34,and(5)alongtheDelta-MendotaCanalat36°53’N,120°38’W.ParticulareffortwasmadetoidentifynewhotspotsimmediatelyadjacenttotheaqueductinbothUAVSARimageswaths,particularlysmallareasofverylocalizedsubsidence.Threeoftheseidentified,oneinthenorthernUAVSARswathat36°51’50”N,120°46’30”WandtheothersinthesouthernUAVSARswathat35°20’30”N,119°27’10”Wand34°59’’12”N,118°59’30”W.Thelattersubsidencefeatureiscentereddirectlyontheeastsideoftheaqueductandexperiencedamaximumof6.5”duringApril2014–June2016.Introduction TheproblemofsubsidenceTheaquifersystemofthesouthernCentralValleyandmanyotheralluvialbasinsofCaliforniahasbothunconfinedandconfinedpartscausedbyalternatinglayersofcoarseandfine-grainedsediments.Waterinthecoarse-grained,unconfinedorwater-tableaquiferscanbeextractedorrechargedeasilyandcausesonlyminor‘elastic’compactionreflectedasseasonalsubsidenceandreboundofwaterlevelsandthelandsurface.Mostwaterwellsexploitthedeeperconfinedaquifers,andwithdrawalofwaterfromthemcausesdrainageofthefine-grainedconfininglayerscalledaquitards.Significantamountsofwaterisavailablefromtheaquitards.These,however,drainslowlyandcompactbothelasticallyandinelastically.Ingeneral,ifwaterlevelsarenotdrawntoolow,whenpumpingceaseswaterrechargestheaquitardsandtheirstructureexpands.However,ifwaterlevelsaredrawntoolowanirreversiblecompactionofthefine-grainedaquitardsoccurs.Thewatercannotrechargethelayers,causingpermanentsubsidenceandlossofsomegroundwaterstoragecapacity(seeGallowayetal.,1999pages8-13;Bertholdietal.,1991forreviews).Measuringandunderstandingsubsidenceasafunctionofgroundwaterdynamicswillgreatlyimprovemanagementofthatimportantresource.Inaddition,theeffectofsubsidenceoninfrastructurecanalsobemonitoredusingtheremotesensingmethodologyofsyntheticapertureradarinterferometry(InSAR)tomeasuresurfacedeformationusing
3
instrumentsdeployedonsatellitesoraircraft.Theeffectsofsubsidenceoninfrastructurearevaried:Roadscanbebrokenbyfissures,pipelineshavebeenexhumed,andthechangeinslopeofthelandcanalterdrainagepatterns.Thislasteffecthasbeenobservedinnaturalwaterways(areachoftheSanJoaquinRiverslatedforrestorationwork)andwaterconveyancestructures(USBR’sDelta-MendotaCanal,DWR’sCaliforniaAqueduct,localagencyirrigationcanals)wherecanalliningraisesandotherremedialmeasureshavebeennecessary.Areasoflowreliefthathavesubsidedarealsosubjecttoflooding. HowInSARworksKeypoints:
1) InSARmeasuressubsidencerelativetoalocationchosenduringprocessing.2) InSARmeasuressubsidencerelativetothefirstimagedateinaseries.3) Radarmeasurementsfromdifferentinstrumentsdeployedonmultiplesatellites
cannotbecombinedinterferometrically.4) However,subsidencemeasurementsmaybecombinediftheyoverlapintime.
Thereare3mainsourcesoferrorinthesubsidencemapsproducedbyprocessingInSARobservationsintotimeseriesofdeformation:
Phaseunwrappingerrors.Thesemanifestasdiscontinuitiesorjumpsinthedeformationmeasurementbetween2dates.Ifthejumpsarenottooseriousanddon’tshowupinmanyotherdatepairs,thenthistypeoferrordoesn’tusuallycauseerrorsintheaggregatedtimeseries.
Temporaldecorrelation.Smallscalechanges(atthescaleofafewinchestoafoot)inthesurfacebetweentworadaracquisitionseffectivelyscramblesthephase-differenceinformation.Plowingorvegetationwavinginthewindarecommoncauses.Iftheeffectisgreatenough,theaffectedareasareblankedout.Otherwise,increasednoisewillbepresentinslightlydecorrelatedareas.
Atmosphericwatervapor.Thisisthemostseriouserrorsourceandtheonemostdifficulttodealwith.Watervaporcausesadelayintheradarsignalthatlooksexactlylikesurfacedeformation.Thebestwaytodealwiththisistousethefactthatchangesinwatervaporoccuroverlargeareasandtendtocomeandgowhilesignificantsurfacedeformationisusuallymorelocalandpersistent.Therefore,averagingmanypairsofdateswilltendtodilutetheeffectofsporadicwatervaporintrusions.
Theseerrorsourcesaretreatedinmoredetailinthemainbodyofthereportandinthereferences.
Interferometricsyntheticapertureradar(InSAR)isatechniquewherebysurfacechangeoccurringbetweentworadarimagingpassescanbemeasuredandmappedtohighprecision(seeMadsenandZebker,1998;Massonnet,1997forreviews).Theabilitytomapsurfacedeformationofafractionofaninchoverlargeareasatspatialresolutionsof100feetorfinerhasopenedupnewpossibilitiesforremotemonitoringofgroundwaterresources.Mostapplicationshaveusedsatelliteradarsystems,althoughairbornesystemsarealsoavailable.

4
TheInSARtechniqueworksbyacquiringimagesfromthesameviewinggeometryattwodifferenttimesbetweenwhichachangeinthesurfacepositionhasoccurred.Thephasesofthereturningradarwavesfromthetwoacquisitionsaresubtractedtocreateaphase-differencemap,orinterferogram,thatcanbeprocessedtocreateamapofchangesindistancealongtheline-of-sightdirectionthatareprecisetofractionsoftheradarwavelength(typicalwavelengthsare1-10inches).Therearehoweversomenoisefactorswhichmustbeconsidered,inparticularorbitalortrackpositionerror,atmosphericnoise,topography-inducederrors,andtemporalphasedecorrelation.OrbitalerrorscanbehandledintheInSARdataprocessingthroughre-estimationandtopographyerrorislargelyremovedduringpost-processingcorrection.AtmosphericwatervaporandothervariationsintheEarth’stropospherecanintroducephasedelayartifactsthatmimicsurfacechangesandforsatellite-borneinstrumentstheionospherecanalsocontributenoise.Troposphericvariationsareusuallydealtwithbyanalyzingmanyinterferometricpairsandaveraging(stacking),undertheassumptionthatgrounddeformationissteadyandatmosphericphaseisrandomintime.Fortime-varyingdeformationsignals,moresophisticatedspatiotemporalfilteringcanbeappliedduringInSARtimeseriesanalysistomitigatetheeffectsofatmosphericnoise(Gallowayetal.,1998;Lanarietal.,2004;OzawaandUeda,2011;Chaussardetal.,2013).Anotherproblem,especiallyacuteinagriculturalareasliketheCentralValley,issmall-scalesurfacechangesnearthescaleoftheradarwavelength.Cropsblowinginthewindorfieldsplowedbetweenradarimageacquisitionscanspoilthephasecoherencebetweenthetworadarimagesandcauselossofinformation.Thiseffectcanbeamelioratedbyusingalongerwavelengthandselectinginterferometricpairsthathavesmallorbitaltrack(baseline)separationsandtemporaldifferences.Aftermanypairsofradarimagesoveranareahavebeenprocessedintointerferograms,theycanbefurtheranalyzedtocreateatimeseriesofsurfacedeformation.ThisisdonebyanInSARtimeseriesinversionalgorithmcalledtheSmallBaselineSubset(SBAS)method(Berardinoetal.,2002;Sansostietal.,2010).SBASmakesuseofinterferometricpairsthathavesmallspatialbaselinesandshorttemporalseparations.Thetimeseriesisconstructedpixelbypixelandrequiresnoassumptionsonthecontinuityorstabilityofphaseintime.ProperchoiceofthereferencelocationisneededinordertotietogethertherelativeInSARmeasurementsintoaconsistentreferenceframe.Thereferencelocation(orpixel)isusuallychosenataplacethatisstablecomparedtothedeformationofinterestbasedoninsitugeodeticmeasurementsoraprioriinformation.TheInSARtimeseriesanalysisproducesahistoryofline-of-sight(LOS)surfacedisplacementssimilartoGPStimeseriesobservationsbutwithmuchhigherspatialresolution.InSARtimeseriesrecoverbothlong-termmeanLOSvelocitiesandthetimevaryingcomponents,whileatthesametimeisolatingatmosphericdelays(aswellassurfacedeformation)intotherespectiveSARimageepochs(e.g.,Lanarietal.,2004).Thistechniquehasbeenappliedsuccessfullyforimagingnon-steady-statedeformationatvolcanoes(Lundgrenetal.,2004),deformingplateboundaries(Lundgrenetal.,2009),andaquiferdynamics(Farretal.,2015;Farr,2011;Lanarietal.,2004).Aftertheinitialtimeseriesinversion,temporalandspatialfilteringcanbeappliedtofurthersuppressturbulentatmosphericnoiseandsmooththedeformationtimeseries.Thesatelliteresultsshownherehavebeenaveragedto300’pixelsinordertoreducetherandomerrors.Since

5
atmosphericnoiseisspatiallycorrelatedbuttemporallyuncorrelated,itsneteffectontheInSARtimeseriesisusuallynegligible.TheestimatedmeasurementprecisionforInSARtimeseriesisgenerallyasmallfractionofawavelength,dependingontheInSARacquisitionsandnoiselevels(Gallowayetal.,1998;OzawaandUeda,2011;Chaussardetal.,2013).InthecaseoftheSentinel-1Ameasurementsusedforthesubsidencemeasurement,uncertaintiesassociatedwiththeverticaldisplacement(subsidence/uplift)measurementsweredeterminedtobelessthan1”andusuallylessthan0.5”.FortheUAVSAR-derivedsubsidencemeasurementsaccuraciesof0.25”-1”areobtained.Theseuncertaintiescoverrandomerrors,butdonotincludesystematicerrorsrelatedtochoiceofreferencelocation,unwrappingerrors,spatiallycorrelatedresidualatmospherenoise,oruncorrectedionosphereerrors.Afinalstepinpost-processingistoprojecttheLOSmeasurementstotheverticaldirectionundertheassumptionthatthereisnosignificanthorizontalsurfacemovementgradientandallofthemeasureddeformationcomesfromsubsidence/uplift.Thisallowsmeasurementsfrommultiplesatelliteswithdifferentimaginggeometriestobecomparedwitheachother.TheresultscanalsobecomparedwithverticalsurfacechangemeasuredwithGPSandtraditionalsurveyingmethods.SeveralgroupshavemadestudiesoftheeffectsofgroundwaterwithdrawalandrechargeonInSARmeasurementsofdeformationoftheEarth’ssurface(Reevesetal.,2011;Calderheadetal.,2011;LuandDanskin,2001;Amelungetal.,1999).PreliminaryevaluationsofInSARapplicationstogroundwatermonitoringinthewesternUnitedStateshavebeenmadeoverthelastfewyearsforLosAngeles(Bawdenetal.,2001),theAntelopeValley(Gallowayetal.,1998),LasVegas(Hoffmannetal.,2001;Belletal.,2008),theSantaClaraValley(Sneedetal.,2003),theCoachellaValley(SneedandBrandt,2007),andthesouthernCentralValley(FarrandLiu,2015;Farr,2011;Sneedetal.,2013;BorchersandCarpenter,2014).AnumberofsatellitesystemshavebeenflownovertheyearstoprovideInSARdata(Table1).Notethatwhilethesatellitesspanonlyafewyearseach,theyoverlapintimeallowingtheirtimeseriestobecompared.ThatisafocusofongoingresearchinourgroupatJPL.Forthepreviousreport(Farretal.,2015),PALSARimagesspanningtheperiodJune2007–December2010andRadarsat-2imagesfortheperiodMay2014–January2015wereprocessedtotwoindependenttimeseries.ThisreportusesSentinel-1AtocoverMay2015–August2016andlaterandiscontinuingtoaddnewdatatothetimeseries.DetailsofthedatausedarelistedintheAppendix.FurtherworkunderthistaskwillfillthegapbetweenthePALSARandRadarsat-2resultsusingRadarsat-1data.

6
Table1.Past,present,andfutureradarsatellites.Theresolutionspecifiedisthevaluesfortheinstrumentpriortospatialaveraging.UAVSAR,whichisanL-bandSARflownonaGulfstream-3aircraft,hasamuchhighersignal-to-noiseratiothansatelliteSARs,usuallyachievingafactorof100increaseinsignalthroughtheuseofahigh-powerinstrumenttransmittingfrom41,000ft.altituderatherthanfromEarthorbit.ItalsohashigherspatialresolutionthanthesatelliteSARs,with<6’instrumentgroundresolution,whichallowssignificantlyhigherresolutionthansatelliteSARswhenaccountingforthespatialaveragingthatisdonetoreducethephasenoise.Thereductioninphasenoisemeansthatdeformationmeasurementaccuracyisincreasedandtemporaldecorrelationisreduced.ThepracticaloutcomeisthatalargerproportionofaUAVSARscenewillproduceusefulmeasurements.PreviousInSARresultsfromUAVSARincludemeasurementsoffaultslipinCalifornia(Donnellanetal.,2014),landslidesalongtheSanAndreasfault(Scheingrossetal.,2013),andsinkholeprecursorygroundmovementinLouisiana(JonesandBlom,2014).TheUAVSARdataanalysismethodsusedinthisworkarebasedonproceduresdevelopedtomonitortheleveesintheSacramento-SanJoaquinDeltausingtheinstrument(Jonesetal.,2012;2015;Sharmaetal.,2015).UnlikeintheCentralValley,groundwaterpumpingisnotaproblemintheSacramento-SanJoaquinDelta.However,subsidencefromaerobicoxidationofthesoilandcompactionofthesoilfrompumpingtoremovewaterfromtheupperlayersofthesoiliscommonthroughoutthearea(DeverelandLeighton,2010).UAVSARdataprocessinginitiallyfollowedsimilarstepstothoseusedforthesatellitedata.Lowcoherenceareasforwhichthesubsidencecouldnotbedeterminedaccuratelywereeliminatedfromtheanalysisbymaskingoutpixelswiththatwerenotcorrectlyphaseunwrappedinatleast80%oftheinterferograms.Thismaskingstepeliminatedmostopenwaterandlandareasthatexperiencedhighandpersistenttemporaldecorrelation.Atemporalfilterofwidth1monthwasappliedtosmooththeresults;thisvaluewaschosentobesufficientlyshortthatweareabletoresolvewhensubsidencerateschangedduring

7
2014.TroposphericphasenoisewasestimatedusingtheopensourceToolboxforReducingAtmosphericInSARNoise(TRAIN)(Bekaertetal.,2015).AfterperformingthetimeseriesInSARanalysis,furtherprocessingwascarriedouttoimprovesubsidenceestimationinlowcoherenceareas.Pixelswereclassifiedbasedupontheiraveragecoherence,andadaptivespatialfilteringwasappliedsuchthatlowcoherenceareaswereaveragedwithnearbysame-classpixelstoreducenoise,andhighcoherencepixelswerenotaveragedatall.UncertaintiesinthederivedsubsidencevalueswereobtainedthroughaJackniferesamplingprocedurewherebytheSBASprocessingwasrunonthestackwithdatafromasingleacquisitionremoved,repeatedwithremovalofeachacquisitiondateintheseries.Thisprocedureestimatesthecombinedeffectofrandomerrorsandsystematicerrorsassociatedwithasingleacquisition.TheuncertaintiesinthecumulativesubsidencederivedfromUAVSARInSARareintherangeof0.25”to1.0”acrossmostoftheimagedarea.EstimatesforeachpixelareincludedintheGISproductsprovidedtoDWR,andshowninplotsinanappendixtothisdocument.SanJoaquinValleySubsidenceMapsofsubsidenceintheSanJoaquinValleyweremadefortheperiodMay7,2015–September10,2016(Fig.1).Twomainsubsidencebowlscanbeseeninthemapsoftotalsubsidence:AsouthernoneintheTularebasinabout25x65mi.centeredonCorcoranandanorthernoneabout15x25mi.centeredSofthetownofElNido.ThemaximumtotalsubsidenceintheTulareBasinwasabout22”nearCorcoran.ThemaximumsubsidenceSEofElNidowasapproximately16”.ThesepatternsaregenerallysimilartotheearlierPALSARandRadarsat-2results,butweseecontinueddevelopmentofadiffuseareaNWofCorcoranwithasubsidenceofupto12”.Subsidenceofover12”extendsWtotheCaliforniaAqueductnearAvenal;attheaqueductisasmallpatchoftotalsubsidenceofalmost18”whichoccurredduringtwoperiods:May-Oct.2015andApr.-Aug.2016(Fig.2).ThenorthernsubsidencebowlSEofElNidosubsidedabout16”withpocketsupto20”.TheEastSideBypassrunsrightthroughthemainpartofthesubsidenceinthisarea.ArelativelynewareaofsubsidencehasbeenrecognizednearTranquilityabout10miSEofMendota.ThiswasfirstnotedinRadarsat-2dataforlate2014,buthasintensifiedinthemeantime.Theareaisabout7miindiameter.Itshistoryofsubsidence(Fig.2)showsitsubsidedin2stages:earlyMay–Oct.2015andApr.–Aug.2016.

8
Figure1.TotalsubsidenceintheSanJoaquinValleyfortheperiodMay7,2015–Sept.10,2016asmeasuredbyESA’sSentinel-1AandprocessedatJPL.TwolargesubsidencebowlsareevidentcenteredonCorcoranandSEofElNidowithasmall,newfeaturebetweenthem,nearTranquility.AnarmofthelargeCorcoranbowlalsoextendstotheCaliforniaaqueductnearAvenal.ThedeformationhistoriesofafewselectedlocationsintheSanJoaquinValleyareplottedinFigure2.ThelargemaximumsubsidenceintheCorcoranareaisclearandshowsvirtuallynorecoveryatanytimeduringtheperiodofmeasurement.ThemaximumsubsidencelocationnearElNidoshowssomeflatteningbetweenOct.2015andMar.2016.TherelativelynewsubsidencefeatureatTranquilityandthehistoryoftheaqueduct

9
featurenearAvenalalsoshowaflatteningbetweenOct.2015andMar.2016,butrenewedsubsidenceafterApr.2016.ThereissomesuggestionthatthesubsidenceslowsstartinginAug.2016,butasdiscussedlater,thismaybeanartifactofatmosphericwatervaporcontamination.
Figure2.SubsidencehistoriesofafewlocationsintheSanJoaquinValley.‘Avenal’islocatedatthemaximumsubsidencemeasuredneartheCaliforniaaqueductnearthetownofAvenal.ThiswasalsomappedbyUAVSAR(Fig.8).CorcoranmaxislocatedinthemaximumsubsidencepocketSofCorcoran.ElNidomaxislocatedinthepocketSEofElNido.Tranquilityislocatedatthemaximumsubsidence9miSEofMendota,betweenthetwomainsubsidencebowls.
Figure3.TransectsshowingtotalsubsidencealongtheCaliforniaAqueductandtheEastSideBypass.ThetransectsextendfromNtoSandrepresenttotalsubsidencefromMay7,2015–May25,2016.NotethedeepsubsidenceaboutmidwayalongtheEastSideBypass.Thatcorrespondstotheredareaonthemap(Fig.1).Thesharppitnearmile150ontheCaliforniaAqueductcorrespondstothefeaturenearAvenalandshowninFig.2.

10
ThetransectsshowninFigure3giveamoredetailedpictureofthetotalsubsidencemeasuredinthevicinityoftheCaliforniaAqueductandtheEastSideBypassovertheperiodofmeasurement.ItisclearthattheEastSideBypasshassufferedsignificantsubsidence,concentratedinitscentralarea.Incontrast,mostareasinthevicinityoftheCaliforniaAqueductexperiencedonlyafewinchesofsubsidence.TheexceptionisthesubsidenceconcentratednearAvenalandplottednearmile150.Thislocationwasrecognizedinthepreviousreport.Theseamountscorrespondtoaveragesovertheprocessedpixel(about300’),notthevaluesontheaqueductstructureitself.SubsidencehistoriesatspecificlocationscanalsobecomparedwithcontinuousGPSmeasurementsobtainedthroughouttheCentralValley(Fig.4).Here,wecompareourmeasurementswithdatafromthePlateBoundaryObservatory(http://www.unavco.org)and2CalTranssites(http://www.dot.ca.gov/dist6/surveys/CVSRN/index.htm).NotethatlargesubsidencesignalsshowupveryreliablyintheInSARtimeseries,butthatthereareexcursionsfromtheGPStimeseries.Asdiscussedearlier,thesearemostlikelyduetowatervaporvariationsintheloweratmospherewhichcausephasedelaysoftheradarwaveswhichmimicdeformation.Itisverydifficulttoeliminatethiseffectwithoutprecisemapsofthewatervaporobtainedatthesametimeastheradarobservations.Thereforethemostpracticalwaytodealwiththesevariationsistoacquireobservationsatmanydatesandusethefactthatthewatervaporvariationsarenotcorrelatedfromdatetodateto‘average’outtheeffects.WeexpectthatasmoredatesareobtainedforCalifornia,thetimeseriesandsubsidencemapswillbecomemoreconsistent.
Figure4.SelectedcomparisonsofGPSverticaltimeseriesandInSARtimeseriesatthesamelocationsintheSanJoaquinValleyprojectedtovertical.InSARtimeserieshavebeenarbitrarilyoffsetverticallyforanoptimalmatchtotheGPStimeseries.GPSsitesareshowninFigure1.TheuppertwoplotshavethesamerangeofYvaluesandallplotshavethesamedaterange.Notesomelargedeviations,mostlikelyduetowatervaporvariationsaffectingtheInSARphasemeasurements.

11
UAVSARResultsAlongCaliforniaAqueductFigure5showscoverageoftheCentralValleybythetwoUAVSARflightlinesusedformonitoringmovementincloseproximitytotheCaliforniaAqueduct.Thevaluesshownarecumulativeforthefulltimeperiodofmeasurement,startinginmid-2013(northernline)orsping-2014(southernline)andextendingthroughJune2016.Acommoncolorscaleisusedtoshowthattheswathtothenorthhasmanylocationsexperiencingsignificantlygreatersubsidencethanisobservedinthesouthernswath.Overallthetrendsaresimilartowhatwasreportedpreviously(Farretal.,2015),withhighersubsidenceintheSanLuisFieldDistrictsectionoftheaqueduct.However,theamountofsubsidenceexperiencedhasincreasedsignificantly,with60-100%increasestypicalinbothareas.Areasshowinghighsubsidencerates,includingratesthatareanomalousrelativetothesurroundingareaandlocalizedneartheaqueduct,arehighlightedindividuallybelowforline14511(Figure6)andline13300(Figure7).WenotethatsubsidencevaluesmeasuredwithUAVSARInSARareaveragedacrossapixelofarea~20’x20’,somaximumvaluesmeasuredonthegroundcouldbehigheratlocationswithinthepixel.Figure6showsonlythenorthernimagedswath.Inthisstretchoftheaqueductthereisanextendedregionofsubsidenceinthecenter,anareaofveryhighsubsidencewithaverywell-definedlocusadjacenttoAvenalCut-offRd.,andseveralotherareasshowinghighsubsidence.SignalstypicalofwellwithdrawalareobservableawayfromtheaqueducttotheeastofthehotspotatAvenalCut-offRd.Theseshowupasbroaderscalesubsidenceinthesatelliteimage(Figure1)butcanberesolvedandlocalizedtoidentifytheirsourcelocationswiththehigherresolutionandlowernoiseoftheUAVSARdata.ThehighestamountsofsubsidenceoccuratthepreviouslyidentifiedlocalizedsubsidencebowllocatedbetweenHuronandKettlemanCitydirectlytothenorthofAvenalCut-offRd.andCheck20,referredtoastheAvenalhotspot(Figure8).Thisfeaturehasdeepenedto27.6”atitsmaximumandexpandedsothattheaqueducthassubsidenceasmuchas25”,withthegreatestsubsidencenearthepreviousmaximumsubsidencelocationdirectlywestofthehot-spotcenter.Theareaofimpactfromthehotspothasdramaticallyincreased,with~4.7milesoftheaqueductexperiencing10”orgreatersubsidencesincethemeasurementsstartedinJuly2013andmostofthatoccurringsincesummer2014.Forreference,thepreviouslyreportedvaluesfortheperiodJuly2013-March2015were13”maximumsubsidenceoftheaqueductand>8”ofsubsidencealonga1.3mistretchoftheaqueduct.Inaddition,Figure8showsthatitispossiblethattwosmallerhotspotsare

12
Figure5.OverviewofsubsidencemeasuredinthetwoUAVSARimageswathscoveringtheCaliforniaAqueduct.TheseswathswereplannedspecificallytoimagetheCaliforniaAqueduct,andthereforemissthelargesubsidencebowlstotheeastthatareseeninthesatelliteSARresults.Theswathtothesouth,whichcoverspartoftheaqueductintheSanJoaquinFieldDistrict,isUAVSARline13300andshowscumulativesubsidencebetweenApril2014andJune2016.Theswathtothenorth,whichcoversthecentralsectionoftheCaliforniaAqueduct(SanLuisFieldDistrict),isUAVSARline14511andshowscumulativesubsidencebetweenJuly2013andJune2016.PartoftheDeltaMendotaCanalisincludedinthenorthernswath.

13
Figure6.OverviewofcumulativesubsidencebetweenJuly2013andJune2016inthenorthernUAVSARswath,whichcoversthepartoftheCaliforniaAqueductintheSanLuisFieldDistrict.Theswathissplitintothreeimageswiththenorthern/center/southernpartofthelineplottedatleft/center/right.ThehotspotofsubsidencenearAvenalCut-offRd.hasexpandedandisnowveryapparentonthebroad-scalemap.Asecondsmallersubsidencebowlisdevelopingimmediatelytothesouthandotherlocalizedbowlsareseentotheeast.Thestarindicatesthereferencelocation,relativetowhichsubsidenceatotherlocationsismeasured.
Figure7.OverviewofcumulativesubsidencebetweenApril2014andJune2016inthesouthernUAVSARswath,whichcoversthepartoftheCaliforniaAqueductintheSanJoaquinFieldDistrict.Thebroad-scalesubsidenceimpactstheaqueductmostsignificantlybetweenCheck33andCheck34,andlesssignificantlynearthenortheastedgeoftheswath.Localizedsubsidence/upliftareastotheeastareoilfields.Thestarindicatesthereferencelocation,relativetowhichsubsidenceatotherlocationsismeasured.

14
Figure8.Opticalimagewithlatitude/longitudespecified(topleft)andsubsidencemap(upperright)showingthesubsidencehotspotcenteredjustnorthofAvenalCut-offRd.and<0.5mieastoftheCaliforniaAqueduct.Muchsmallerhotspotsarepotentiallyformingcentered<1mifromtheaqueducttothenortheastandsoutheastofthemainsubsidencebowl.Anotherlargeandlocalizedsubsidencebowlseveralmilestotheeastoftheaqueducthasalsodeepenedandexpanded(upperright).ThebottomtwomapsshowtherelativeexpansionofthesubsidencebowlbetweenMarch2015(bottomleft)andJune2016(bottomright).Thesamecolorscaleisusedforbothandonlyareassubsiding>10”areplotted.Theaqueductnowshowsareaswith25”ofsubsidence.Approximately5milesoftheaqueducthasbeenloweredby>10”.

15
formingcentered<1mifromtheaqueduct,onedirectlytothenortheastandtheotherdirectlysoutheastofthemainsubsidencebowl.Furthermore,anotherlargeandlocalizedsubsidencebowlseveralmilestotheeastoftheaqueducthasdeepenedandexpandedsincethelastreportedsubsidenceinMarch2015(Figure8,upperright).BecausethisbowlhassimilarmagnitudetotheAvenalhotspot,itsareaofinfluenceisalsolikelytoexpandifpumpingcontinues.AcomparisonbetweenresultsfortheAvenalhotspotfromSentinel(Figures1,2,and3)andUAVSAR(Figure8)fortheAvenalareashowasimilarrateofsubsidence.Howeversmallerareasnotedbelowgenerallydon’tshowupincoarse-resolutionsatellitedata.TwonewlocalizedsubsidencefeaturessimilarinshapetotheAvenalhotspot,albeitsmallerinmagnitude,havebeenidentified.OneislocatedsouthofSanLuisReservoirandnorthofCheck14(36°51’50”N,120°46’30”W)(Figure9)andtheothersouthoftheWindGapPumpingPlantandnorthofCheck37(34°59’’12”N,118°59’30”W)(Figure10).Inaddition,asmallsubsidencefeatureintheshapeofanarcnorthofCheck27andatthelocationofaformerseepcontinuestosubside(Figure11).
Figure9.LocalizedsubsidenceadjacenttoandextendingintotheCaliforniaAqueduct,locatednorthofCheck14(36°51’50”N,120°46’30”W)[Seeinsetupperleft].HerethemaximumsubsidencebetweenJuly2013andJune2016was~10”atthefeature’scenterandthemaximumsubsidenceoftheaqueductdirectlywas~8”ontheeastside.Thisfeatureisn’tvisibleintheSentinel-1Aresults.

16
Figure10.Smallsubsidencebowlcenteredontheeastsideoftheaqueductat34°59’’12”N,118°59’30”W.ThislocationissouthoftheWindGapPumpingPlantandnorthofCheck37(Insetupperright).Althoughthemagnitudeofsubsidence(<7”)issmall,itsproximitytotheaqueductandtheindicationthatthereisahighsubsidencegradientdirectlybeneaththeaqueductmakesitsignificant.
Figure11.Smallsubsidencefeatureintheshapeofanarcat35°20’30”N,119°27’10”W,northofCheck27,thatiscenteredatthetoeoftheaqueduct’seastslope.Thiswasidentifiedpreviouslytobethelocationofaformerseep.Maximumimpacttotheaqueductis<5”fortheperiodApril2014toJune2016,howeverthesubsidencecontinuedbetweenJan.2015[Farretal.,2014]andJune2016,whichindicatesprogressandcumulativesubsidenceinthislocalizedarea.

17
SubsidenceonabroaderspatialscalethatwasmeasuredwithUAVSARcontinuesatallsitesreportedpreviously.ThesearethehistoricallysubsidingextendedsectionoftheCaliforniaAqueductbetweenCheck16(MP122.07)andCheck17(MP132.95)nearCantuaCreek(Figure12);eastofHuron,inthevicinityofCheck19(Figure13);andnearwhereOldRiverRd.crossestheaqueduct,betweenCheck33andCheck34(Figure14).
Figure12.SubsidencenearCantuaCreek,affectinganextendedsectionoftheCaliforniaAqueductencompassingChecks16and17thatexperienced8”ormoreofsubsidencebetweenJuly2013andJune2016.Twoareasshowinghighsubsidenceatorneartheaqueductareshownontheright.
Figure13.SubsidenceinthevicinityofCheck19eastofHuron,whichhasbeenpersistentsinceJuly2013.Anopticalimageofthewiderareaisshownatupperleft.

18
OnenewareaidentifiedashavinghighersubsidenceinthislongertimeseriesislocatedinthenorthernUAVSARswath(Figure15).Thesubsidenceappearstoextenduptotheaqueductslopebutisnotyetaffectingitgreatly.NosignificantsubsidenceisidentifiedanywherealongthesectionoftheaqueductintheenvironsoftheBuenaVistaPumpingPlantwhereaseepdevelopedin2016(Figure16).
Figure14.AreaofhighestwidespreadsubsidenceinthesouthernUAVSARswath,locatedjustwestofCheck34.ThehighestsubsidenceoftheaqueductdirectlyislocatedeastofOldRiverRoad.
Figure15.AreanearCheck15wheresubsidenceof5”-10”hasoccurredandextendstothetoeoftheaqueductalongan~0.5milestretchofthewestsideslopeandattwomorelocalizedareasontheeastsideslope.

19
Figure16.SubsidencemapinthegeneralvicinityofCheck29andtheBuenaVistaPumpingPlant.Areasincolorshowed>2”ofsubsidenceduringApril2014andJune2016.Nosignificantsubsidingareasinproximitytotheaqueductwereidentified,howeverlongertermmonitoringisneededtoidentifyareasliketheoneshowninFigure11.UAVSARmeasuredsubsidencealongpartoftheDelta-MendotaCanalinadditiontotheCaliforniaAqueduct.Figure17showstheoneobservedareashowinghighsubsidencealongthisstructure.
Figure17.SubsidingsectionoftheDelta-MendotaCanalnear36°53’N,120°38’W.

20
SacramentoValleySubsidenceAsubsidencemapfortheSacramentoValleyusingSentinel-1Adatawasalsoproducedforthisreport,coveringtheperiodMarch1,2015toMay30,2016.Thismapuseddatafromdescending(NE-SW)path#42.TheSacramentoValleysubsidencemap(Figure18)showsmuchlessdeformationthanintheSanJoaquinValleytothesouth.Italsoexhibitslargerblankareasduetotemporaldecorrelationcausedbysmall-scalechangesinvegetationorplowing.
Figure18.SubsidencemapofSacramentoValleycoveringtheperiodMarch1,2015toMay30,2016obtainedfromSentinel-1Adescendingpass#42.NotesubsidencealongthewestsideofthevalleyincludingtheArbuckleareamarked‘A’andasmallareaofsubsidenceinSierraValley,marked‘S’,NofLakeTahoe.ThemuchlargersubsidenceintheElNidoareashowsupatthebottomofthemap.NotethatthecolorscaleismuchdifferentthanthatforFigure1asthesubsidenceamountsaremuchless.

21
AroundWoodlandandDavis,sitesofprevioussubsidence,subsidenceoccursinsmallareasuptoabout2”.AsmallareaonthewestsideofthevalleyatArbuckle,notedinthepreviousreportcontinuedtosubsideuntiltheendof2015.Totalsubsidencefortheperiodofobservationswasabout12”(Fig.19).Apreviouslyun-reportedareaofsubsidencewasfoundinthemapinSierraValley(~39.8°N,120.25°W).Recentreports(CADWR,2003;http://sierravalleygmd.org/updates.html)indicateincreaseduseofgroundwatertherealongwithhydrogeologyconducivetocompactionandsubsidence.Acontourmapofgroundwaterleveldeclines(http://sierravalleygmd.org/updates.html)matchesthezoneofsubsidence.Maximumsubsidenceintheareawasabout6”;thehistoryofdeformationoftheareaisshowninFig.19.
Figure19.SubsidencehistoriesoftwolocationsintheSacramentoValleyfromSentinel-1Adescendingpass#42(Fig.18).NotethelargesubsidenceinSierraValleywhichcorrespondstoanareaofsignificantdrawdowninthelocalwells.Arbucklewasidentifiedinthepreviousreportashavingexceptionallylargesubsidence.ThetrendcontinueduntilaboutNov.2015whensubsidenceslowed.

22
Figure20.SelectedcomparisonsofGPSverticaltimeseriesandInSARtimeseriesatthesamelocationsintheSacramentoValleyprojectedtovertical.InSARtimeserieshavebeenarbitrarilyoffsetverticallyforanoptimalmatchtotheGPStimeseries.GPSsitesareshowninFigure18.AllplotshavethesamerangeofYvalues(6”)andthesamedaterange.Notesomedeviations,mostlikelyduetowatervaporvariationsaffectingtheInSARphasemeasurements.SantaClaraValleyDeformationAdeformationmapfortheSantaClaraValleywasproducedbycolleaguesatArizonaStateUniversity,UniversityofCaliforniaBerkeley,andJPL(Shirzaeietal.,2016)andtheyhavekindlyallowedustoreformatitandpresentasFigure21.TheperiodcoveredisMarch1,2015toMarch7,2016and,asshownbythemap,theoveralldeformationisupliftwhichisamaximumofabout1”overthetimeperiod.ThedeformationhistoryofthemaximumlocationisshowninFigure22andshowssmallvariationsthroughouttheyear,butageneralupwardtrend.

23
Figure21.TotalsubsidenceintheSantaClaraValleyfortheperiodMarch1,2015–March7,2016asmeasuredbyESA’sSentinel-1A,descendingpath#42(Shirzaeietal.,2016).ThestraightedgeofthecolormapiscausedbytheinfluenceoftheSilverCreekFault.
Figure22.DeformationhistoryofthelocationofmaximumdeformationintheSantaClaraValley.Notethatthelocationisgenerallyuplifting,withshortperiodsofsmallamountsofsubsidence.

24
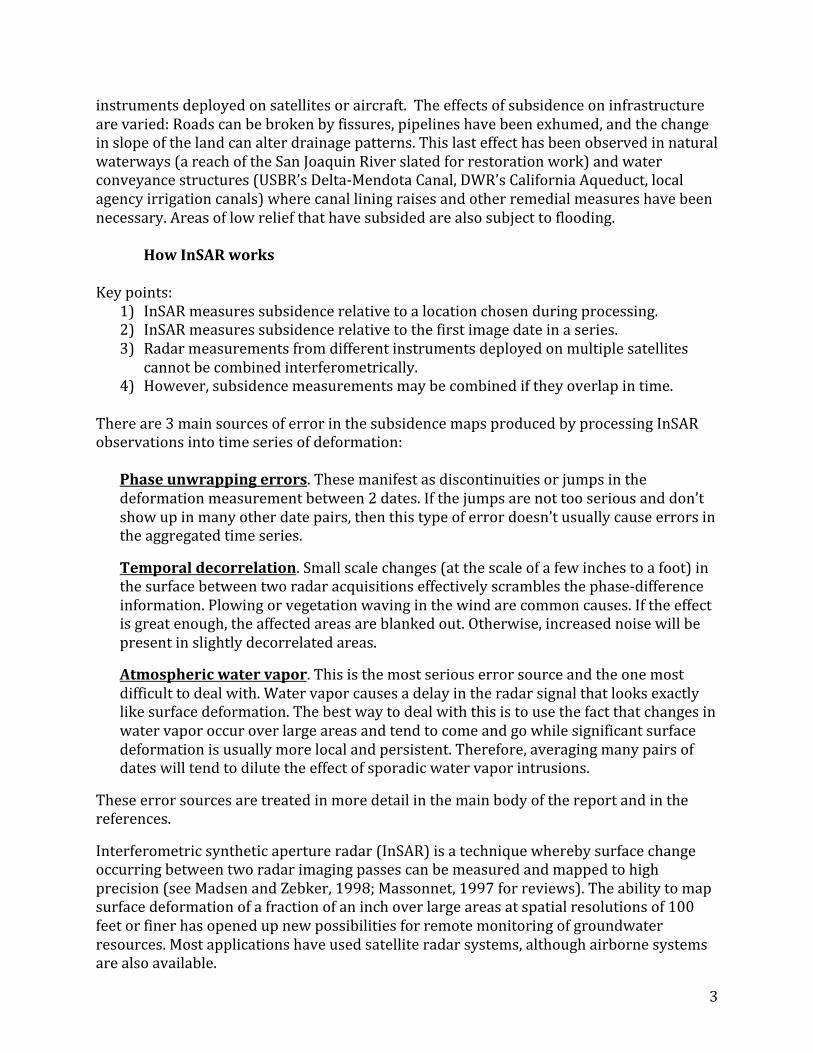
South-CentralCoastregionThesameascendingpath#137usedintheSanJoaquinValleyalsocoveredthesouth-centralcoastalregionofCalifornia(Fig.23).ThemaininterestwasthecoastalfloodplainoftheSantaClaraRiver(OxnardPlain),buttheprocessedareaextendedwestalongthecoasttoPointConception,eastintotheLosAngelesbasin,andnorthtothesouthendoftheSanJoaquinValley.Fortheprocessedperiod(May7,2015–August17,2016)isolatedareasofupto2”ofsubsidencewerenotedintheOxnardPlainaswellasafairlylargezoneofupto2.5”subsidenceinthefoothillsnorthofCarpinteria.TheknownsubsidenceofCuyamaValleyalsoshowsupaswellasvariousisolatedareasinotheralluvialbasinsinthearea.PixelhistoriesareshowninFig.24forsomeofthesefeatures.
Figure23.Subsidenceinthesouth-centralcoastregionofCalifornia,includingVentura,SantaBarbaraandnorthtotheSanJoaquinValleycoveringtheperiodMay7,2015–August17,2016.Thispath(ascending#137)coverstheCentralValleyaswell(Fig.1).NotealargeareainthefoothillsaboveCarpinteria(#1)whichcouldbeduetoatmosphericwatervapor,smallpatchesofsubsidenceintheOxnardPlain(#2,O),andsubsidenceintheCuyamaValley(C).
25
Figure24.Subsidencehistoriesfor2locationsinthesouth-centralcoastregionfromSentinel-1Aascendingpass#137(Fig.23).Thenumberedcurvesareindicatedonthemap:1=areaNofCarpinteria,2=siteinOxnardPlain.
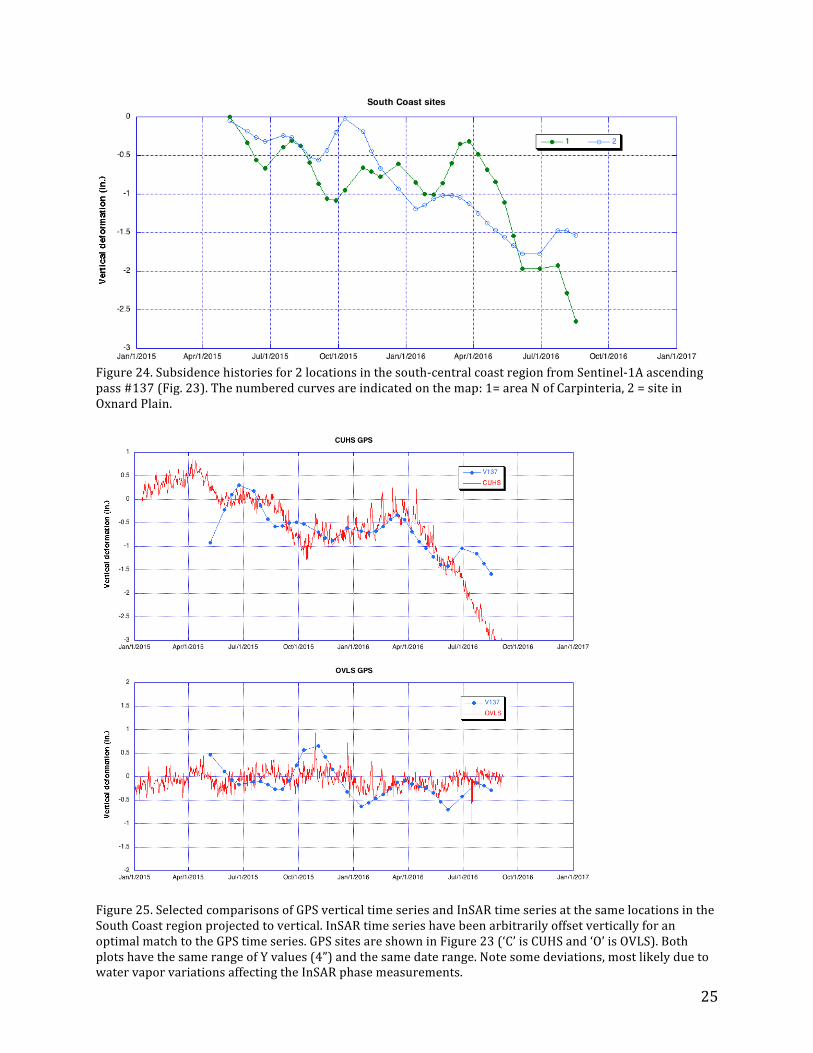
Figure25.SelectedcomparisonsofGPSverticaltimeseriesandInSARtimeseriesatthesamelocationsintheSouthCoastregionprojectedtovertical.InSARtimeserieshavebeenarbitrarilyoffsetverticallyforanoptimalmatchtotheGPStimeseries.GPSsitesareshowninFigure23(‘C’isCUHSand‘O’isOVLS).BothplotshavethesamerangeofYvalues(4”)andthesamedaterange.Notesomedeviations,mostlikelyduetowatervaporvariationsaffectingtheInSARphasemeasurements.

26
ConclusionsandFuturePlansSentinel-1A,launchedinApril2014,hasprovedtobeusefulformakingmapsofsubsidenceinalluvialbasinsofCalifornia.MapsaswellaspixelhistoriesofsubsidenceandtransectsshowingtemporalandspatialdetailsofsubsidencecanbeproducedfromtheInSARdata.UpdatesofthesubsidencemapsforCaliforniawillcontinuewithSentinel-1B,launchedinApril2016,joiningitstwininorbit.ThefirstacquisitionsforCaliforniabySentinel-1Awereinlate2014andarecontinuing,ingeneralevery12-24days.EarlyacquisitionsoverCaliforniaweremoresporadic,buthavebecomemorereliableasthecoverageareahasexpandedalongwithESA’scapabilitytocollectandprocessthedata.WehavebegundownloadingandprocessingSentinel-1dataforotherbasinsofCalifornia,includingAntelopeValley,CoachellaValley,BorregoValley,andtheSalinasValley,alongwithcoastalareas.Asthedatabaseexpands,weexpecttobeabletopresentmapsofthoseareas,aswellascontinuingmonitoringoftheCentralValley.Figure26showsthecoverageofSentinel-1AoverCaliforniausedforthisreport.ThehighspatialresolutionandlowinstrumentnoiseoftheUAVSARisshowntoaccuratelymeasuresubsidencealongtheCaliforniaAqueductandelsewhereinitsswathbothoverlargeareasand,ofparticularvalue,onamuchmorelocalizedscale.TheUAVSARresultsreportedherefocusonshowingthesmall-scalesubsidencedirectlyimpactingtheaqueductandidentifytwonewsuchfeaturesinadditiontoonenewareaofbroaderarealsubsidence.Furthermore,subsidenceisshownnottoberapidinthevicinityoftherepairedsectionneartheBuenaVistaPumpingPlant.AcquisitionoftheUAVSARlineswillcontinuein2016-2017andcouldinprinciplebeexpandedtocovermoreoftheCentralValley.Asdescribedabove,theInSARtimeseriesweproduceareessentiallyseriesofmapsrepresentingthechangeinsurfaceelevationforeachsatelliteorairborneradaracquisitiondate.Inasense,weproduce4-dimensionaldatasets.Forthesatelliteresultswehavefoundthataconvenientformatforstorageandpost-processingisamulti-bandGeoTiffformat,whereeach‘band’isanacquisitiondate.MostcommonGeographicInformationSystemsoftwarepackagesrecognizethisformatandcandisplaymapproductsfromthedata.WefurnishallofthesatelliteproductstotheDWRinthisformatforfutureuseandgenerationofadditionalproducts,althoughthenewerHDF5formatcouldbeafuturechoice.TheUAVSARdatafilesforeachtimesteparesolargethatthefilesaredeliveredasGISrasterswithheaderfilesforeachtimestep.Thecumulativeverticaldisplacementfortheentiretimeseriesisinthedataofthelasttimestep.UAVSARresultsarealsoavailableasasingleHDF5fileforeachimageswathuponrequest.

27
Figure26.CoverageofSentinel-1AoverCaliforniausedforthisreport.Ascending(SE-NW)path137passesfromVenturathroughtheSanJoaquinandSacramentoValleysanddescending(NE-SW)path42coverstheSantaClaraandSacramentoValleys.Otherpathshavebeenacquiredandprocessedforcross-calibrationandverificationpurposes.

28
AcknowledgementsThisworkwasfundedbytheCaliforniaDepartmentofWaterResources.ThisworkwascarriedoutattheJetPropulsionLaboratory,CaliforniaInstituteofTechnology,undercontractwithNASA.UAVSARdataarecourtesyNASA/JPL-Caltech.TheAlaskaSatelliteFacility(http://www.asf.alaska.edu/)archivesanddistributestheSentinel-1AandUAVSARdatausedinthisreport.Copyright2016CaliforniaInstituteofTechnology.U.S.Governmentsponsorshipacknowledged.ReferencesAmelung,F.,D.L.Galloway,J.W.Bell,H.A.Zebker,R.J.Laczniak,1999,SensingtheupsanddownsofLasVegas:InSARrevealsstructuralcontroloflandsubsidenceandaquifer-systemdeformation,Geology,v.27,p.483-486.Bawden,G.W.,W.Thatcher,R.S.Stein,K.W.Hudnut,G.Peltzer,2001,TectoniccontractionacrossLosAngelesafterremovalofgroundwaterpumpingeffects,Nature,v.412,p.812-813.Bekaert,D.P.S.,R.J.Walters,T.J.Wright,AHooper,andD.JParker(2015),StatisticalcomparisonofInSARtroposphericcorrectiontechniques,RemoteSensingofEnvironment,v.170,p.40-47,doi:10.1016/j.rse.2015.08.035.Bell,J.W.,F.Amelung,A.Ferretti,M.Bianchi,F.Novali,2008,PermanentscattererInSARrevealsseasonalanlong-termaquifer-systemresponsetogroundwaterpumpingandartificialrecharge,WaterResourcesResearch,v.44,doi:10.1029/2007WR006152.Berardino,P.,G.Fornaro,R.Lanari,E.Sansosti,2002,AnewalgorithmforsurfacedeformationmonitoringbasedonsmallbaselinedifferentialSARinterferograms,IEEETrans.Geosci.RemoteSensing,v.40,doi:10.1109/TGRS.2002.803792.Bertoldi,G.L.,R.H.Johnston,K.D.Evenson,1991,GroundwaterintheCentralValley,California—Asummaryreport,U.S.GeologicalSurveyProfessionalPaper1401-A,44p.Borchers,J.W.,M.Carpenter,2014,LandSubsidencefromGroundwaterUseinCalifornia,ReportofFindingstotheCaliforniaWaterFoundation,http://www.californiawaterfoundation.orgCADWR,2003,California’sGroundwater,DWRBulletin118,update2003.Calderhead,A.I.,R.Therrien,A.Rivera,R.Martel,J.Garfias,2011,Simulatingpumping-inducedregionallandsubsidencewiththeuseInSARandfielddataintheTolucaValley,Mexico,Adv.WaterResources,v.34,p.83-97,doi:10.1016/j.advwatres.2010.09.017.

29
Chaussard,E.,F.Amelung,H.Abidin,S-H.Hong,2013,SinkingcitiesinIndonesia:ALOSPALSARdetectsrapidsubsidenceduetogroundwaterandgasextraction,Rem.Sens.Env.,v.128,p.150-161.Deverel,S.J.,D.A.Leighton,2010,Historic,recent,andfuturesubsidence,Sacramento-SanJoaquinDelta,California,USA,SanFranciscoEstuaryandWatershedScience,v.8.Donnellan,A.,J.Parker,S.Hensley,M.Pierce,J.Wang,J.Rundle,2014,UAVSARobservationsoftriggeredslipontheImperial,SuperstitionHills,andEastElmoreRanchFaultsassociatedwiththe2010M7.2ElMayor‐Cucapahearthquake,Geochemistry,Geophysics,Geosystems,v.15,p.815-829.Farr,T.G.,2011,Remotemonitoringofgroundwaterwithorbitalradar,abs.,GroundwaterResourcesAssoc.Ann.Mtg.,Sacramento,CA.http://www.grac.org/am2011.aspFarr,T.G.,Z.Liu,2015,MonitoringSubsidenceAssociatedwithGroundwaterDynamicsintheCentralValleyofCaliforniaUsingInterferometricRadar,Ch.24inRemoteSensingoftheTerrestrialWaterCycle,GeophysicalMonograph206,V.Lakshmi,ed.,AmericanGeophysicalUnion,JohnWiley&Sons,Inc.Farr,T.G.,C.Jones,Z.Liu,2015,Progressreport:SubsidenceintheCentralValley,California,submittedtoCADWR.Availableat:http://www.nasa.gov/jpl/nasa-california-drought-causing-valley-land-to-sink.Galloway,D.L.,D.R.Jones,S.E.Ingebritsen,1999,LandsubsidenceintheUnitedStates.U.S.GeologicalSurveyCircular1182,175p.Galloway,D.L.,K.W.Hudnut,S.E.Ingebritsen,S.P.Phillips,G.Peltzer,F.Rogez,P.A.Rosen,1998,Detectionofaquifersystemcompactionandlandsubsidenceusinginterferometricsyntheticapertureradar,AntelopeValley,MojaveDesert,California,WaterResourcesResearch,v.34,p.2573-2585.Hoffmann,J.,H.A.Zebker,D.L.Galloway,F.Amelung,2001,SeasonalsubsidenceandreboundinLasVegasValley,Nevada,observedbysyntheticapertureradarinterferometry,WaterResourcesResearch,v.37,p.1551-1566.Jones,C.E.,G.Bawden,S.Deverel,J.Dudas,S.Hensley,S.-H.Yun,2012,StudyofmovementandseepagealongleveesusingDINSARandtheairborneUAVSARinstrument,InProc.SPIE8536,SARImageAnalysis,Modeling,andTechniquesXII,85360E,InternationalSocietyforOpticsandPhotonics,doi:10.1117/12.976885.Jones,C.E.,R.G.Blom,2014,BayouCorne,Louisiana,sinkhole:Precursorydeformationmeasuredbyradarinterferometry,Geology,v.42,p.111-114.Jones,C.E.,J.Dudas,G.W.Bawden,2016,Applicationofremotesensingtoassessmentofwaterconveyanceinfrastructureintegrity.InR.L.AndersonandH.Ferriz(Eds.),Applied

30
GeologyinCalifornia,SpecialPublication26,AssociationofEnvironmentalandEngineeringGeologists,StarPublishingCompany.Lanari,R.,P.Lundgren,M.Manzo,F.Casu,2004,SatelliteradarinterferometrytimeseriesanalysisofsurfacedeformationforLosAngeles,California,Geophys.Res.Lett.,v.31,doi:10.1029/2004GL021294.Lu,Z.,W.R.Danskin,2001,InSARanalysisofnaturalrechargetodefinestructureofaground-waterbasin,SanBernardino,California,Geophys.Res.Lett.,v.28,p.2661-2664.Lundgren,P.,F.Casu,M.Manzo,A.Pepe,P.Berardino,E.Sansosti,R.Lanari,2004,GravityandmagmainducedspreadingofMountEtnavolcanorevealedbysatelliteradarinterferometry,Geophys.Res.Lett.,v.31,L04602.Lundgren,P.,E.A.Hetland,Z.Liu,andE.J.Fielding,2009,SouthernSanAndreas-SanJacintofaultsystemslipratesestimatedfromearthquakecyclemodelsconstrainedbyGPSandinterferometricsyntheticapertureradarobservations,J.Geophys.Res.,v.114,B02403,doi:10.1029/2008JB005996.Madsen,S.N.,H.A.Zebker,1998,ImagingRadarInterferometry,ch.6,p.359-380,inHenderson,F.M.,A.J.Lewis,ed.,1998,PrinciplesandApplicationsofImagingRadar,ManualofRemoteSensing,v.2,Wiley,NY,866pp.Massonnet,D.,1997,Satelliteradarinterferometry,ScientificAmerican,v.276,Feb.,p.46-53.Ozawa,T.,H.Ueda,2011,Advancedinterferometricsyntheticapertureradar(InSAR)timeseriesanalysissuinginterferogramsofmultiple-orbittracks:acasestudyonMiyake-Jima,J.Geophys.Res.,116,B12407,doi:10.1029/2011JB008489.Reeves,J.A.,R.J.Knight,H.Zebker,W.A.Schreuder,P.S.Agram,andT.R.Lauknes,2011,HighqualityInSARdatalinkedtoseasonalchangeinhydraulicheadforanagriculturalareaintheSanLuisValley,Colorado,WRR,v.47,DOI:10.1029/2010WR010312.Sansosti,E.,F.Casu,M.Manzo,R.Lanari,2010,Space‐borneradarinterferometrytechniquesforthegenerationofdeformationtimeseries:AnadvancedtoolforEarth’ssurfacedisplacementanalysis,Geophys.Res.Lett.,v.37,L20305,doi:10.1029/2010GL044379.Sharma,P.,C.E.Jones,J.Dudas,G.Bawden,S.Deverel,2016,MonitoringofsubsidencewithUAVSARonShermanIslandinCalifornia’sSacramento-SanJoaquindelta.RemoteSensingofEnvironment,181,218-236,doi:10.1016/j.rse.2016.04.012.Shirzaei,M.,R.BürgmannandE.Fielding,2016,Sentinel-1TOPSmultitemporalinterferometryformonitoringslowgroundmotionsintheSanFranciscoBayArea,GeophysicalResearchLetters,submitted.

31
Sneed,M.,andBrandt,J.T.,2013,DetectionandmeasurementoflandsubsidenceusingglobalpositioningsystemsurveyingandInterferometricSyntheticApertureRadar,CoachellaValley,California,1996-2005:U.S.GeologicalSurveyScientificInvestigationsReport2007-5251,v.2.0,31p.Sneed,M.,S.V.Stork,R.J.Laczniak,2003,Aquifer-systemcharacterizationusingInSAR,inK.R.PrinceandD.L.Galloway,eds.,USGeologicalSurveysubsidenceinterestgroupconferenceproceedings,2001,USGSOpen-FileRept.03-308.Sneed,M.,andBrandt,J.T.,2007,DetectionandmeasurementoflandsubsidenceusingglobalpositioningsystemsurveyingandInterferometricSyntheticApertureRadar,CoachellaValley,California,1996-2005:U.S.GeologicalSurveyScientificInvestigationsReport2007-5251,31p.

32
Appendix:DetailedlistsofdatausedSentinel-1ADataListingDatafromtheSentinel-1AsatelliteoftheEuropeanSpaceAgency(ESA)wasusedforthisreport.DatawereobtainedfromtheAlaskaSatelliteFacility(https://www.asf.alaska.edu).SeeTable1forsomecharacteristicsoftheinstrument.AlldatafortheSanJoaquinValleywasfromasingleorbitalpath,repeatedapproximatelyevery24days.Thepathwasascending(SEtoNW)number137,showninFigure26.ThesamepathwasalsoextendedintotheSacramentoValley,thoughfewerdateswereacquired.Adescendingpath,number42wasalsoprocessedfortheSacramentoValley.Thatpathhadacquisitionsevery24daysandforalongertimeperiod,allowingmorereliableresults.TheSanJoaquinandSacramentoValleyswereprocessedseparatelytokeepdatavolumesmanageableandbecausethemaximumamountofdeformationwasverydifferentinthetwoareas.Sentinel-1Aacquiresdatainamodifiedscan-SARmodecalledInterferometricWideSwathmode(IW).Swathsarebrokeninto3subswathsacross-trackandintoframesalongtrack,whicharestitchedtogetherintheprocessing.VVpolarizationwasusedforallInSARproductsandtheincidenceanglevariesfrom29°to46°.Detailsoftheframesusedaregivenbelow.TableA1.DetailsofSentinel-1Aframesusedforthisreport.SanJoaquinValley(ascendingpath137)
GranuleNameAbsolute
OrbitPath
NumberFrame
Number AcquisitionDate CenterLat CenterLon
S1A_IW_SLC__1SSV_20150507T015909_20150507T015936_005809_007783_0A02 5809 137 121 2015-05-07T01:59:36Z 38.2032 -120.6027
S1A_IW_SLC__1SSV_20150507T015934_20150507T020001_005809_007783_21B0 5809 137 126 2015-05-07T02:00:01Z 39.7114 -120.9421
S1A_IW_SLC__1SSV_20150507T015958_20150507T020025_005809_007783_DEA7 5809 137 131 2015-05-07T02:00:25Z 41.4371 -121.1492
S1A_IW_SLC__1SSV_20150531T015902_20150531T015926_006159_008023_120E 6159 137 120 2015-05-31T01:59:26Z 37.491 -120.4462
S1A_IW_SLC__1SSV_20150531T020001_20150531T020028_006159_008023_74F2 6159 137 132 2015-05-31T02:00:28Z 41.2588 -121.298
S1A_IW_SLC__1SDV_20150612T015903_20150612T015929_006334_008542_88F9 6334 137 120 2015-06-12T01:59:29Z 37.5956 -120.469
S1A_IW_SLC__1SSV_20150624T015904_20150624T015931_006509_008A40_A0B8 6509 137 120 2015-06-24T01:59:31Z 37.7136 -120.4952
S1A_IW_SLC__1SSV_20150624T015928_20150624T015955_006509_008A40_C87F 6509 137 125 2015-06-24T01:59:55Z 39.4463 -120.7098
S1A_IW_SLC__1SSV_20150624T015953_20150624T020020_006509_008A40_2C1B 6509 137 130 2015-06-24T02:00:20Z 40.7298 -121.1763
S1A_IW_SLC__1SSV_20150718T015904_20150718T015931_006859_0093FC_2DF5 6859 137 119 2015-07-18T01:59:31Z 37.7148 -120.4898
S1A_IW_SLC__1SSV_20150718T015929_20150718T015956_006859_0093FC_A1F8 6859 137 125 2015-07-18T01:59:56Z 39.2232 -120.8273
S1A_IW_SLC__1SSV_20150718T015954_20150718T020021_006859_0093FC_8A55 6859 137 129 2015-07-18T02:00:21Z 40.731 -121.1709
S1A_IW_SLC__1SDV_20150730T015905_20150730T015931_007034_0098F3_B456 7034 137 120 2015-07-30T01:59:31Z 37.9261 -120.3837
S1A_IW_SLC__1SSV_20150811T015905_20150811T015932_007209_009DB6_0927 7209 137 120 2015-08-11T01:59:32Z 37.7152 -120.4907
S1A_IW_SLC__1SSV_20150811T015930_20150811T015957_007209_009DB6_9419 7209 137 125 2015-08-11T01:59:57Z 39.2236 -120.8282
S1A_IW_SLC__1SSV_20150811T015955_20150811T020022_007209_009DB6_99FF 7209 137 130 2015-08-11T02:00:22Z 40.7314 -121.1719
S1A_IW_SLC__1SDV_20150823T015906_20150823T015932_007384_00A274_AFD4 7384 137 121 2015-08-23T01:59:32Z 37.5958 -120.4655
S1A_IW_SLC__1SSV_20150904T015906_20150904T015933_007559_00A743_526B 7559 137 120 2015-09-04T01:59:33Z 37.7148 -120.4911
S1A_IW_SLC__1SSV_20150904T015931_20150904T015958_007559_00A743_1B7C 7559 137 125 2015-09-04T01:59:58Z 39.2232 -120.8286
S1A_IW_SLC__1SSV_20150904T015956_20150904T020023_007559_00A743_AC5B 7559 137 130 2015-09-04T02:00:23Z 40.731 -121.1722
S1A_IW_SLC__1SSV_20150928T015907_20150928T015928_007909_00B0A5_9B50 7909 137 121 2015-09-28T01:59:28Z 37.4295 -120.4276
S1A_IW_SLC__1SDV_20151010T015907_20151010T015934_008084_00B54A_36FA 8084 137 120 2015-10-10T01:59:34Z 37.5958 -120.4645
S1A_IW_SLC__1SDV_20151103T015907_20151103T015933_008434_00BEB3_6450 8434 137 121 2015-11-03T01:59:33Z 37.5959 -120.4655
S1A_IW_SLC__1SSV_20151115T015902_20151115T015928_008609_00C380_10D6 8609 137 120 2015-11-15T01:59:28Z 37.382 -120.4172
S1A_IW_SLC__1SSV_20151115T015926_20151115T015953_008609_00C380_A7AA 8609 137 125 2015-11-15T01:59:53Z 38.8905 -120.7534
S1A_IW_SLC__1SSV_20151115T015951_20151115T020018_008609_00C380_C5FA 8609 137 130 2015-11-15T02:00:18Z 40.3984 -121.0957
S1A_IW_SLC__1SDV_20151127T015901_20151127T015927_008784_00C867_764C 8784 137 119 2015-11-27T01:59:27Z 37.2628 -120.3904
S1A_IW_SLC__1SDV_20151221T015900_20151221T015926_009134_00D232_39D0 9134 137 119 2015-12-21T01:59:26Z 37.2626 -120.3912
S1A_IW_SLC__1SDV_20160114T015859_20160114T015925_009484_00DC2E_A309 9484 137 119 2016-01-14T01:59:25Z 37.2627 -120.3912
S1A_IW_SLC__1SSV_20160126T015924_20160126T015951_009659_00E14D_F626 9659 137 124 2016-01-26T01:59:51Z 38.8903 -120.7528

33
S1A_IW_SLC__1SDV_20160207T015809_20160207T015836_009834_00E65A_9D60 9834 137 109 2016-02-07T01:58:36Z 34.3632 -119.76
S1A_IW_SLC__1SDV_20160207T015834_20160207T015901_009834_00E65A_8B5F 9834 137 114 2016-02-07T01:59:01Z 35.8727 -120.0862
S1A_IW_SLC__1SDV_20160207T015859_20160207T015925_009834_00E65A_2B96 9834 137 119 2016-02-07T01:59:25Z 37.2627 -120.3912
S1A_IW_SLC__1SSV_20160219T015809_20160219T015836_010009_00EB80_E840 10009 137 109 2016-02-19T01:58:36Z 34.3633 -119.7605
S1A_IW_SLC__1SSV_20160219T015834_20160219T015901_010009_00EB80_7948 10009 137 113 2016-02-19T01:59:01Z 35.8727 -120.0868
S1A_IW_SLC__1SSV_20160219T015859_20160219T015926_010009_00EB80_9A87 10009 137 119 2016-02-19T01:59:26Z 37.3818 -120.4177
S1A_IW_SLC__1SDV_20160302T015809_20160302T015836_010184_00F077_C0AC 10184 137 108 2016-03-02T01:58:36Z 34.3632 -119.7616
S1A_IW_SLC__1SDV_20160302T015834_20160302T015901_010184_00F077_5DCF 10184 137 113 2016-03-02T01:59:01Z 35.8727 -120.0879
S1A_IW_SLC__1SDV_20160302T015859_20160302T015925_010184_00F077_2231 10184 137 119 2016-03-02T01:59:25Z 37.2626 -120.3929
S1A_IW_SLC__1SDV_20160314T015817_20160314T015845_010359_00F590_5287 10359 137 110 2016-03-14T01:58:45Z 34.8522 -119.8666
S1A_IW_SLC__1SDV_20160314T015842_20160314T015909_010359_00F590_F69F 10359 137 116 2016-03-14T01:59:09Z 36.3615 -120.1943
S1A_IW_SLC__1SDV_20160314T015907_20160314T015934_010359_00F590_7536 10359 137 121 2016-03-14T01:59:34Z 37.8704 -120.5269
S1A_IW_SLC__1SDV_20160326T015810_20160326T015837_010534_00FA6A_4120 10534 137 109 2016-03-26T01:58:37Z 34.3631 -119.7613
S1A_IW_SLC__1SDV_20160326T015835_20160326T015902_010534_00FA6A_6204 10534 137 114 2016-03-26T01:59:02Z 35.8727 -120.0876
S1A_IW_SLC__1SDV_20160326T015859_20160326T015926_010534_00FA6A_8428 10534 137 119 2016-03-26T01:59:26Z 37.2626 -120.3926
S1A_IW_SLC__1SSV_20160407T015810_20160407T015837_010709_00FF8A_150F 10709 137 109 2016-04-07T01:58:37Z 34.3632 -119.7614
S1A_IW_SLC__1SSV_20160407T015835_20160407T015902_010709_00FF8A_8AB5 10709 137 114 2016-04-07T01:59:02Z 35.8727 -120.0877
S1A_IW_SLC__1SSV_20160407T015900_20160407T015927_010709_00FF8A_4AAD 10709 137 119 2016-04-07T01:59:27Z 37.3818 -120.4186
S1A_IW_SLC__1SDV_20160419T015811_20160419T015838_010884_0104D5_C208 10884 137 109 2016-04-19T01:58:38Z 34.3635 -119.7613
S1A_IW_SLC__1SDV_20160419T015835_20160419T015902_010884_0104D5_E20A 10884 137 114 2016-04-19T01:59:02Z 35.873 -120.0876
S1A_IW_SLC__1SDV_20160419T015900_20160419T015926_010884_0104D5_4427 10884 137 119 2016-04-19T01:59:26Z 37.263 -120.3926
S1A_IW_SLC__1SSV_20160501T015811_20160501T015838_011059_010A54_2DAA 11059 137 110 2016-05-01T01:58:38Z 34.3632 -119.7616
S1A_IW_SLC__1SSV_20160501T015836_20160501T015903_011059_010A54_763F 11059 137 115 2016-05-01T01:59:03Z 35.8727 -120.0879
S1A_IW_SLC__1SSV_20160501T015901_20160501T015928_011059_010A54_6D62 11059 137 120 2016-05-01T01:59:28Z 37.3817 -120.4189
S1A_IW_SLC__1SSV_20160501T015926_20160501T015953_011059_010A54_399D 11059 137 124 2016-05-01T01:59:53Z 38.8902 -120.7551
S1A_IW_SLC__1SDV_20160513T015815_20160513T015842_011234_010FDE_B126 11234 137 110 2016-05-13T01:58:42Z 34.5297 -119.7981
S1A_IW_SLC__1SDV_20160513T015840_20160513T015906_011234_010FDE_2455 11234 137 115 2016-05-13T01:59:06Z 36.0392 -120.1249
S1A_IW_SLC__1SDV_20160513T015904_20160513T015942_011234_010FDE_EA32 11234 137 120 2016-05-13T01:59:42Z 37.7621 -120.503
S1A_IW_SLC__1SSV_20160525T015815_20160525T015842_011409_01159A_A7C0 11409 137 110 2016-05-25T01:58:42Z 34.5298 -119.7968
S1A_IW_SLC__1SSV_20160525T015840_20160525T015907_011409_01159A_D99C 11409 137 115 2016-05-25T01:59:07Z 36.0392 -120.1235
S1A_IW_SLC__1SSV_20160525T015905_20160525T015932_011409_01159A_5305 11409 137 120 2016-05-25T01:59:32Z 37.5482 -120.455
S1A_IW_SLC__1SDV_20160606T015816_20160606T015843_011584_011B33_10B8 11584 137 111 2016-06-06T01:58:43Z 34.7982 -119.69
S1A_IW_SLC__1SDV_20160606T015841_20160606T015908_011584_011B33_FA90 11584 137 116 2016-06-06T01:59:08Z 36.0392 -120.1237
S1A_IW_SLC__1SDV_20160606T015906_20160606T015932_011584_011B33_12AE 11584 137 121 2016-06-06T01:59:32Z 37.7606 -120.3443
S1A_IW_SLC__1SDV_20160630T015817_20160630T015844_011934_012632_783B 11934 137 111 2016-06-30T01:58:44Z 34.5299 -119.7979
S1A_IW_SLC__1SDV_20160630T015842_20160630T015909_011934_012632_C2B9 11934 137 116 2016-06-30T01:59:09Z 36.0393 -120.1247
S1A_IW_SLC__1SDV_20160630T015907_20160630T015933_011934_012632_4037 11934 137 121 2016-06-30T01:59:33Z 37.4293 -120.4303
S1A_IW_SLC__1SDV_20160724T015819_20160724T015846_012284_01319D_1D95 12284 137 111 2016-07-24T01:58:46Z 34.782 -119.6821
S1A_IW_SLC__1SDV_20160724T015843_20160724T015910_012284_01319D_9D50 12284 137 116 2016-07-24T01:59:10Z 36.2937 -120.0129
S1A_IW_SLC__1SDV_20160724T015908_20160724T015934_012284_01319D_F4F4 12284 137 121 2016-07-24T01:59:34Z 37.7613 -120.3445
S1A_IW_SLC__1SSV_20160805T015820_20160805T015846_012459_013772_EBB0 12459 137 111 2016-08-05T01:58:46Z 34.5299 -119.7976
S1A_IW_SLC__1SSV_20160805T015844_20160805T015911_012459_013772_3FD9 12459 137 116 2016-08-05T01:59:11Z 36.0394 -120.1243
S1A_IW_SLC__1SSV_20160805T015909_20160805T015936_012459_013772_7228 12459 137 121 2016-08-05T01:59:36Z 37.5483 -120.4558
S1A_IW_SLC__1SDV_20160817T015820_20160817T015847_012634_013D31_5181 12634 137 111 2016-08-17T01:58:47Z 34.7994 -119.6901
S1A_IW_SLC__1SDV_20160817T015845_20160817T015912_012634_013D31_4718 12634 137 116 2016-08-17T01:59:12Z 36.0394 -120.1241
S1A_IW_SLC__1SDV_20160817T015910_20160817T015936_012634_013D31_5CD2 12634 137 121 2016-08-17T01:59:36Z 37.4293 -120.4297
S1A_IW_SLC__1SDV_20160829T015757_20160829T015827_012809_014324_CD00 12809 137 107 2016-08-29T01:58:27Z 33.5042 -119.3872
S1A_IW_SLC__1SDV_20160829T015825_20160829T015853_012809_014324_12B9 12809 137 113 2016-08-29T01:58:53Z 34.8524 -119.8668
S1A_IW_SLC__1SDV_20160829T015851_20160829T015918_012809_014324_2FF9 12809 137 118 2016-08-29T01:59:18Z 36.3618 -120.1945
S1A_IW_SLC__1SDV_20160829T015916_20160829T015943_012809_014324_3A8A 12809 137 123 2016-08-29T01:59:43Z 37.8706 -120.5271
S1A_IW_SLC__1SDV_20160910T015821_20160910T015848_012984_0148C8_C481 12984 137 112 2016-09-10T01:58:48Z 34.53 -119.7981
S1A_IW_SLC__1SDV_20160910T015846_20160910T015913_012984_0148C8_EDE0 12984 137 117 2016-09-10T01:59:13Z 36.0394 -120.1249
S1A_IW_SLC__1SDV_20160910T015911_20160910T015937_012984_0148C8_0D2B 12984 137 122 2016-09-10T01:59:37Z 37.4294 -120.4305
SacramentoValley(descendingpath42)
GranuleNameAbsolute
OrbitPath
NumberFrame
Number AcquisitionDate CenterLat CenterLon
S1A_IW_SLC__1SSV_20150301T140703_20150301T140731_004839_00605B_6C1B 4839 42 463 2015-03-01T14:07:31Z 38.6358 -120.9004
S1A_IW_SLC__1SSV_20150301T140729_20150301T140756_004839_00605B_5ECD 4839 42 468 2015-03-01T14:07:56Z 36.8651 -121.1015
S1A_IW_SLC__1SSV_20150325T140704_20150325T140731_005189_0068C0_4F8D 5189 42 463 2015-03-25T14:07:31Z 38.3731 -120.7658
S1A_IW_SLC__1SSV_20150325T140729_20150325T140756_005189_0068C0_2D18 5189 42 468 2015-03-25T14:07:56Z 36.8644 -121.1001
S1A_IW_SLC__1SSV_20150418T140705_20150418T140732_005539_00714E_BC23 5539 42 463 2015-04-18T14:07:32Z 38.3519 -120.7727
S1A_IW_SLC__1SSV_20150418T140730_20150418T140757_005539_00714E_D319 5539 42 468 2015-04-18T14:07:57Z 36.8432 -121.1069
S1A_IW_SLC__1SSV_20150512T140706_20150512T140733_005889_007958_9A43 5889 42 464 2015-05-12T14:07:33Z 38.3523 -120.7717
S1A_IW_SLC__1SSV_20150512T140731_20150512T140758_005889_007958_BC28 5889 42 469 2015-05-12T14:07:58Z 36.8436 -121.1059

34
S1A_IW_SLC__1SSV_20150605T140708_20150605T140735_006239_008284_8D27 6239 42 464 2015-06-05T14:07:35Z 38.352 -120.7734
S1A_IW_SLC__1SSV_20150605T140733_20150605T140800_006239_008284_8A98 6239 42 469 2015-06-05T14:08:00Z 36.8434 -121.1076
S1A_IW_SLC__1SSV_20150629T140710_20150629T140737_006589_008C6D_76A1 6589 42 464 2015-06-29T14:07:37Z 38.352 -120.7742
S1A_IW_SLC__1SSV_20150629T140735_20150629T140802_006589_008C6D_9A6F 6589 42 469 2015-06-29T14:08:02Z 36.8433 -121.1084
S1A_IW_SLC__1SSV_20150723T140710_20150723T140737_006939_00963C_DABF 6939 42 464 2015-07-23T14:07:37Z 38.3517 -120.7686
S1A_IW_SLC__1SSV_20150723T140735_20150723T140802_006939_00963C_23AE 6939 42 469 2015-07-23T14:08:02Z 36.8431 -121.1028
S1A_IW_SLC__1SSV_20150816T140711_20150816T140738_007289_009FE6_9592 7289 42 465 2015-08-16T14:07:38Z 38.352 -120.7687
S1A_IW_SLC__1SSV_20150816T140736_20150816T140803_007289_009FE6_77E1 7289 42 470 2015-08-16T14:08:03Z 36.8433 -121.1029
S1A_IW_SLC__1SSV_20150909T140712_20150909T140739_007639_00A972_5D14 7639 42 464 2015-09-09T14:07:39Z 38.3517 -120.7685
S1A_IW_SLC__1SSV_20150909T140737_20150909T140804_007639_00A972_DFD3 7639 42 470 2015-09-09T14:08:04Z 36.843 -121.1028
S1A_IW_SLC__1SSV_20151003T140713_20151003T140740_007989_00B2CA_EC3E 7989 42 464 2015-10-03T14:07:40Z 38.3518 -120.7685
S1A_IW_SLC__1SSV_20151003T140738_20151003T140805_007989_00B2CA_D9E2 7989 42 470 2015-10-03T14:08:05Z 37.111 -121.2135
S1A_IW_SLC__1SSV_20151027T140713_20151027T140740_008339_00BC45_46E2 8339 42 465 2015-10-27T14:07:40Z 38.352 -120.7695
S1A_IW_SLC__1SSV_20151027T140738_20151027T140805_008339_00BC45_9840 8339 42 470 2015-10-27T14:08:05Z 36.8433 -121.1037
S1A_IW_SLC__1SSV_20151120T140707_20151120T140734_008689_00C5C0_9D95 8689 42 463 2015-11-20T14:07:34Z 38.6852 -120.6944
S1A_IW_SLC__1SSV_20151120T140732_20151120T140759_008689_00C5C0_C157 8689 42 468 2015-11-20T14:07:59Z 37.1766 -121.0299
S1A_IW_SLC__1SSV_20151214T140706_20151214T140733_009039_00CF82_225D 9039 42 463 2015-12-14T14:07:33Z 38.6851 -120.696
S1A_IW_SLC__1SSV_20151214T140731_20151214T140758_009039_00CF82_8D56 9039 42 469 2015-12-14T14:07:58Z 37.1766 -121.0314
S1A_IW_SLC__1SSV_20160107T140705_20160107T140732_009389_00D977_A30A 9389 42 463 2016-01-07T14:07:32Z 38.6852 -120.6954
S1A_IW_SLC__1SSV_20160107T140730_20160107T140757_009389_00D977_B5FE 9389 42 468 2016-01-07T14:07:57Z 37.1766 -121.0308
S1A_IW_SLC__1SSV_20160131T140705_20160131T140732_009739_00E3A3_94F3 9739 42 463 2016-01-31T14:07:32Z 38.6851 -120.6948
S1A_IW_SLC__1SSV_20160131T140729_20160131T140756_009739_00E3A3_C165 9739 42 468 2016-01-31T14:07:56Z 37.1765 -121.0302
S1A_IW_SLC__1SSV_20160224T140704_20160224T140731_010089_00EDD9_285E 10089 42 462 2016-02-24T14:07:31Z 38.685 -120.6959
S1A_IW_SLC__1SSV_20160224T140729_20160224T140756_010089_00EDD9_4DA7 10089 42 467 2016-02-24T14:07:56Z 37.1765 -121.0314
S1A_IW_SLC__1SSV_20160319T140705_20160319T140732_010439_00F7BD_A420 10439 42 463 2016-03-19T14:07:32Z 38.6849 -120.6957
S1A_IW_SLC__1SSV_20160319T140730_20160319T140757_010439_00F7BD_B167 10439 42 468 2016-03-19T14:07:57Z 37.1763 -121.0311
S1A_IW_SLC__1SSV_20160412T140706_20160412T140733_010789_0101FE_552B 10789 42 463 2016-04-12T14:07:33Z 38.6847 -120.6951
S1A_IW_SLC__1SSV_20160412T140730_20160412T140757_010789_0101FE_CE65 10789 42 468 2016-04-12T14:07:57Z 37.1762 -121.0306
S1A_IW_SLC__1SSV_20160506T140707_20160506T140734_011139_010CD3_A1C7 11139 42 463 2016-05-06T14:07:34Z 38.6849 -120.6964
S1A_IW_SLC__1SSV_20160506T140731_20160506T140758_011139_010CD3_620C 11139 42 468 2016-05-06T14:07:58Z 37.1764 -121.0318
S1A_IW_SLC__1SSV_20160530T140708_20160530T140735_011489_011835_D5D7 11489 42 464 2016-05-30T14:07:35Z 38.6847 -120.6958
S1A_IW_SLC__1SSV_20160530T140733_20160530T140800_011489_011835_92CA 11489 42 468 2016-05-30T14:08:00Z 37.1761 -121.0313
S1A_IW_SLC__1SSV_20160810T140712_20160810T140739_012539_013A18_4411 12539 42 465 2016-08-10T14:07:39Z 38.6846 -120.6951
S1A_IW_SLC__1SSV_20160810T140737_20160810T140804_012539_013A18_F2A6 12539 42 470 2016-08-10T14:08:04Z 37.176 -121.0305
CentralCoast(ascendingpath137)
GranuleNameAbsolute
OrbitPath
NumberFrame
Number AcquisitionDate CenterLat CenterLon
S1A_IW_SLC__1SSV_20150507T015751_20150507T015821_005809_007783_37A3 5809 137 105 2015-05-07T01:58:21Z 33.8354 -119.4634
S1A_IW_SLC__1SSV_20150531T015747_20150531T015814_006159_008023_F632 6159 137 105 2015-05-31T01:58:14Z 33.1865 -119.5128
S1A_IW_SLC__1SSV_20150531T015812_20150531T015840_006159_008023_7D81 6159 137 110 2015-05-31T01:58:40Z 34.6964 -119.8358
S1A_IW_SLC__1SDV_20150612T015747_20150612T015815_006334_008542_D264 6334 137 105 2015-06-12T01:58:15Z 33.1865 -119.5127
S1A_IW_SLC__1SDV_20150612T015812_20150612T015840_006334_008542_4F8E 6334 137 110 2015-06-12T01:58:40Z 34.6964 -119.8357
S1A_IW_SLC__1SSV_20150624T015748_20150624T015815_006509_008A40_44FD 6509 137 105 2015-06-24T01:58:15Z 33.1855 -119.5128
S1A_IW_SLC__1SSV_20150624T015813_20150624T015841_006509_008A40_161E 6509 137 110 2015-06-24T01:58:41Z 34.9397 -119.7041
S1A_IW_SLC__1SSV_20150718T015749_20150718T015816_006859_0093FC_2083 6859 137 104 2015-07-18T01:58:16Z 33.1866 -119.5076
S1A_IW_SLC__1SSV_20150718T015813_20150718T015841_006859_0093FC_8C4B 6859 137 110 2015-07-18T01:58:41Z 34.6965 -119.8306
S1A_IW_SLC__1SDV_20150730T015749_20150730T015816_007034_0098F3_8127 7034 137 105 2015-07-30T01:58:16Z 33.1865 -119.5076
S1A_IW_SLC__1SDV_20150730T015814_20150730T015842_007034_0098F3_18BF 7034 137 110 2015-07-30T01:58:42Z 34.6964 -119.8306
S1A_IW_SLC__1SSV_20150811T015750_20150811T015817_007209_009DB6_EA1C 7209 137 105 2015-08-11T01:58:17Z 33.187 -119.5084
S1A_IW_SLC__1SSV_20150811T015815_20150811T015843_007209_009DB6_2417 7209 137 110 2015-08-11T01:58:43Z 34.6969 -119.8314
S1A_IW_SLC__1SDV_20150823T015751_20150823T015818_007384_00A274_4A84 7384 137 105 2015-08-23T01:58:18Z 33.1867 -119.5091
S1A_IW_SLC__1SDV_20150823T015816_20150823T015843_007384_00A274_0FEE 7384 137 110 2015-08-23T01:58:43Z 34.6966 -119.8321
S1A_IW_SLC__1SSV_20150904T015751_20150904T015818_007559_00A743_C6AA 7559 137 106 2015-09-04T01:58:18Z 33.1867 -119.5087
S1A_IW_SLC__1SSV_20150904T015816_20150904T015844_007559_00A743_9DCE 7559 137 110 2015-09-04T01:58:44Z 34.6965 -119.8317
S1A_IW_SLC__1SDV_20150916T015751_20150916T015818_007734_00ABED_C847 7734 137 106 2015-09-16T01:58:18Z 33.1867 -119.5079
S1A_IW_SLC__1SDV_20150916T015816_20150916T015844_007734_00ABED_EB4C 7734 137 111 2015-09-16T01:58:44Z 34.6966 -119.8308
S1A_IW_SLC__1SSV_20150928T015752_20150928T015819_007909_00B0A5_2432 7909 137 106 2015-09-28T01:58:19Z 33.1869 -119.5078
S1A_IW_SLC__1SSV_20150928T015817_20150928T015844_007909_00B0A5_7CD3 7909 137 111 2015-09-28T01:58:44Z 34.6967 -119.8308
S1A_IW_SLC__1SDV_20151010T015752_20151010T015819_008084_00B54A_B0A7 8084 137 106 2015-10-10T01:58:19Z 33.1867 -119.5082
S1A_IW_SLC__1SDV_20151010T015817_20151010T015845_008084_00B54A_0E64 8084 137 110 2015-10-10T01:58:45Z 34.6965 -119.8312
S1A_IW_SLC__1SDV_20151103T015752_20151103T015819_008434_00BEB3_C649 8434 137 105 2015-11-03T01:58:19Z 33.1868 -119.5092
S1A_IW_SLC__1SDV_20151103T015817_20151103T015844_008434_00BEB3_0D17 8434 137 110 2015-11-03T01:58:44Z 34.6966 -119.8322
S1A_IW_SLC__1SSV_20151115T015746_20151115T015813_008609_00C380_8D75 8609 137 105 2015-11-15T01:58:13Z 32.8535 -119.438
S1A_IW_SLC__1SSV_20151115T015811_20151115T015839_008609_00C380_50F6 8609 137 109 2015-11-15T01:58:39Z 34.3634 -119.7601

35
S1A_IW_SLC__1SDV_20151127T015746_20151127T015814_008784_00C867_08C7 8784 137 105 2015-11-27T01:58:14Z 32.8534 -119.4371
S1A_IW_SLC__1SDV_20151127T015812_20151127T015838_008784_00C867_18B9 8784 137 110 2015-11-27T01:58:38Z 34.3633 -119.7591
S1A_IW_SLC__1SDV_20151221T015745_20151221T015813_009134_00D232_98B0 9134 137 104 2015-12-21T01:58:13Z 32.8532 -119.4378
S1A_IW_SLC__1SDV_20151221T015811_20151221T015838_009134_00D232_20F1 9134 137 109 2015-12-21T01:58:38Z 34.3631 -119.7599
S1A_IW_SLC__1SDV_20160114T015744_20160114T015812_009484_00DC2E_61EC 9484 137 104 2016-01-14T01:58:12Z 32.8533 -119.4378
S1A_IW_SLC__1SDV_20160114T015810_20160114T015837_009484_00DC2E_A7B7 9484 137 109 2016-01-14T01:58:37Z 34.3633 -119.7599
S1A_IW_SLC__1SSV_20160126T015744_20160126T015811_009659_00E14D_B0DD 9659 137 104 2016-01-26T01:58:11Z 32.8533 -119.4374
S1A_IW_SLC__1SSV_20160126T015809_20160126T015836_009659_00E14D_5498 9659 137 108 2016-01-26T01:58:36Z 34.3633 -119.7595
S1A_IW_SLC__1SDV_20160207T015744_20160207T015811_009834_00E65A_1651 9834 137 103 2016-02-07T01:58:11Z 32.8532 -119.4379
S1A_IW_SLC__1SDV_20160207T015809_20160207T015836_009834_00E65A_9D60 9834 137 109 2016-02-07T01:58:36Z 34.3632 -119.76
S1A_IW_SLC__1SSV_20160219T015743_20160219T015811_010009_00EB80_7305 10009 137 104 2016-02-19T01:58:11Z 32.8532 -119.4384
S1A_IW_SLC__1SSV_20160219T015809_20160219T015836_010009_00EB80_E840 10009 137 109 2016-02-19T01:58:36Z 34.3633 -119.7605
S1A_IW_SLC__1SDV_20160302T015744_20160302T015811_010184_00F077_83F4 10184 137 104 2016-03-02T01:58:11Z 32.8532 -119.4394
S1A_IW_SLC__1SDV_20160302T015809_20160302T015836_010184_00F077_C0AC 10184 137 108 2016-03-02T01:58:36Z 34.3632 -119.7616
S1A_IW_SLC__1SDV_20160314T015749_20160314T015819_010359_00F590_0DE1 10359 137 105 2016-03-14T01:58:19Z 33.4809 -119.3754
S1A_IW_SLC__1SDV_20160314T015817_20160314T015845_010359_00F590_5287 10359 137 110 2016-03-14T01:58:45Z 34.8522 -119.8666
S1A_IW_SLC__1SDV_20160326T015744_20160326T015812_010534_00FA6A_37A6 10534 137 104 2016-03-26T01:58:12Z 32.8532 -119.4392
S1A_IW_SLC__1SDV_20160326T015810_20160326T015837_010534_00FA6A_4120 10534 137 109 2016-03-26T01:58:37Z 34.3631 -119.7613
S1A_IW_SLC__1SSV_20160407T015744_20160407T015812_010709_00FF8A_CD45 10709 137 104 2016-04-07T01:58:12Z 32.8532 -119.4393
S1A_IW_SLC__1SSV_20160407T015810_20160407T015837_010709_00FF8A_150F 10709 137 109 2016-04-07T01:58:37Z 34.3632 -119.7614
S1A_IW_SLC__1SDV_20160419T015745_20160419T015813_010884_0104D5_F256 10884 137 104 2016-04-19T01:58:13Z 32.8535 -119.4392
S1A_IW_SLC__1SDV_20160419T015811_20160419T015838_010884_0104D5_C208 10884 137 109 2016-04-19T01:58:38Z 34.3635 -119.7613
S1A_IW_SLC__1SSV_20160501T015745_20160501T015813_011059_010A54_F82D 11059 137 105 2016-05-01T01:58:13Z 32.8531 -119.4395
S1A_IW_SLC__1SSV_20160501T015811_20160501T015838_011059_010A54_2DAA 11059 137 110 2016-05-01T01:58:38Z 34.3632 -119.7616
S1A_IW_SLC__1SDV_20160513T015815_20160513T015842_011234_010FDE_B126 11234 137 110 2016-05-13T01:58:42Z 34.5297 -119.7981
S1A_IW_SLC__1SDV_20160513T015749_20160513T015817_011234_010FDE_1832 11234 137 105 2016-05-13T01:58:17Z 33.0198 -119.4755
S1A_IW_SLC__1SSV_20160525T015749_20160525T015817_011409_01159A_5B0C 11409 137 105 2016-05-25T01:58:17Z 33.0198 -119.4742
S1A_IW_SLC__1SSV_20160525T015815_20160525T015842_011409_01159A_A7C0 11409 137 110 2016-05-25T01:58:42Z 34.5298 -119.7968
S1A_IW_SLC__1SDV_20160606T015750_20160606T015818_011584_011B33_1C2D 11584 137 106 2016-06-06T01:58:18Z 33.2748 -119.3629
S1A_IW_SLC__1SDV_20160606T015816_20160606T015843_011584_011B33_10B8 11584 137 111 2016-06-06T01:58:43Z 34.7982 -119.69
S1A_IW_SLC__1SDV_20160630T015752_20160630T015819_011934_012632_DD4A 11934 137 106 2016-06-30T01:58:19Z 33.0199 -119.4754
S1A_IW_SLC__1SDV_20160630T015817_20160630T015844_011934_012632_783B 11934 137 111 2016-06-30T01:58:44Z 34.5299 -119.7979
S1A_IW_SLC__1SDV_20160724T015753_20160724T015821_012284_01319D_CFD1 12284 137 106 2016-07-24T01:58:21Z 33.0199 -119.4747
S1A_IW_SLC__1SDV_20160724T015819_20160724T015846_012284_01319D_1D95 12284 137 111 2016-07-24T01:58:46Z 34.782 -119.6822
S1A_IW_SLC__1SSV_20160805T015754_20160805T015822_012459_013772_729B 12459 137 106 2016-08-05T01:58:22Z 33.02 -119.475
S1A_IW_SLC__1SSV_20160805T015820_20160805T015846_012459_013772_EBB0 12459 137 111 2016-08-05T01:58:46Z 34.5299 -119.7976
S1A_IW_SLC__1SDV_20160817T015754_20160817T015822_012634_013D31_E7CB 12634 137 106 2016-08-17T01:58:22Z 33.02 -119.4748
S1A_IW_SLC__1SDV_20160817T015820_20160817T015847_012634_013D31_5181 12634 137 111 2016-08-17T01:58:47Z 34.7994 -119.6901

36
UAVSARThetwoUAVSARflightlinesusedforevaluatingsubsidenceoftheCaliforniaAqueductwerelineIDCValle_13300(southernsection)andlineIDSnjoaq_14511(northernsection).TableA2showstheflightdates,UAVSARflightIDs,andtemporalbaselinesforlines13300and14511.Eachacquisitionwasusedinatleastthreeinterferogramstoprovidesufficientredundancytoeliminatesystematiceffectsfromatmosphericvariationandaircraftmotionartifacts.TableA2.UAVSARlineID,flightID,andacquisitiondateofthedatausedforevaluatingsubsidenceoftheCaliforniaAqueductduringthe2014drought.
UAVSAR Line ID 14511 UAVSAR Line ID 13300 Acq. No.
Flight ID
Date of acquisition
Acq. No.
Flight ID Date of acquisition
1 13129 7/19/2013 1 14033 4/2/2014 2 13165 10/31/2013 2 14062 5/15/2014 3 14005 1/17/2014 3 14086 6/16/2014 4 14019 2/12/2014 4 14112 8/14/2014 5 14033 4/2/2014 5 14140 10/6/2014 6 14068 5/29/2014 6 14166 11/13/2014 7 14086 6/16/2014 7 15002 1/7/2015 8 14112 8/14/2014 8 15053 4/27/2015 9 14140 10/6/2014 9 15149 10/7/2015
10 14166 11/13/2014 10 16003 2/18/2016 11 15002 1/7/2015 11 16056 6/14/2016 12 15017 3/10/2015 13 15053 4/27/2015 14 15056 5/16/2015 15 16003 2/18/2016 16 16056 6/14/2016
UAVSARuncertaintiesFiguresA1andA2showtheuncertaintiesassociatedwiththeverticaldisplacement(subsidence/uplift)measurements.Theseuncertaintiescoverrandomerrors,butdonotincludesystematicerrors,i.e.,systematicshiftsthataffectallinterferograms,forexample,persistentwatervaporwithinmountainvalleys,wereitpresentinallimages,wouldnotbeincludedintheerrorestimation.

37
FigureA1.UncertaintyintheverticalmovementderivedfromUAVSARlineID14511,coveringthesectionoftheCaliforniaAqueductwithintheareaoverseenbytheSanLuisFieldDivision.Theswathissplitintothreeimageswiththenorthern/center/southernpartofthelineplottedatleft/center/right.
FigureA2.UncertaintyinthesubsidencederivedfromUAVSARlineID13300,coveringthesouthernsectionoftheCaliforniaAqueductwithintheareaoverseenbytheSanJoaquinFieldDivision.