progress report - nerpcnerpc.nic.in/reports/monthly reports/mpr 2010-11/mpr_may 2010.pdf · diesel...
TRANSCRIPT

¼ããÀ¦ã ÔãÀ‡ãŠãÀ Government of India ãäÌã²ãì¦ã ½ãâ¨ããÊã¾ã Ministry of Power
‡ãŠñ³ãè¾ã ãäÌã²ãì¦ã ¹ãÆããä£ã‡ãŠÀ¥ã Central Electricity Authority
„§ãÀ ¹ãîÌããê àãñ¨ããè¾ã ãäÌã²ãì¦ã Ôããä½ããä¦ã
North Eastern Regional Power Committee
ãäÍãÊããñâØã Shillong
Progress Report
For the month of
May, 2010

CONTENTS
Sl. No. Topics Page No. 1 Brief Highlights of North Eastern Regional Power System 1 2 Salient Features 2 DETAILS OF THE REPORT 3 Monthly Power Supply Position: (i) Energy generation in the Region 3 (ii) Requirement Vs Availability in the Region 3 (iii) Estimation of Peak Demand (MW) 4 (iv) Estimation of Energy Requirement (MU) 4 4 Station wise Energy Generation (MU) & Peak Generation (MW): (i) State Sector 5, 6 (ii) Central Sector 7 5 Plant Load Factor (PLF) 8 6 Voltage Profile of Important Sub-Stations 8 7 (i) Inter Regional Energy Exchange 9 (ii) Major Grid disturbances 9 (iii) Meetings held by NERPC 9 8 Status of progress of: (i) Generating Units 10 (ii) Transmission Lines 11, 12 9 Commercial Status: (i) UI Accounting 13 (ii) Schedule and CS Share Allocation 14, 15
10 NER Grid Status on (i) Regional Peak Demand day 16 (ii) Regional Minimum Demand day 17 ANNEXURES
A-1 Major Reservoir Levels I A-2 Frequency Analysis and it's Profile II A-3 Scheduled Bilateral Exchanges III A-4 Energy Exchanges IV
EXHIBITS B-1 Frequency Profile:
(i) Duration of frequency in different ranges I (ii) Frequency Variation Index II
B-2 Voltage Profile: (i) Voltage Profile of Important Sub-Stations III
B-3 Energy Generation: (i) Energy Generation by Constituents during the month IV
(ii)Energy scenario of State's during the month V B-4 Reservoir profile :
(i) Reservoir statistics for the month VI

NERPC, Shillong Progress Report for May, 2010 Page-1
NORTH EASTERN REGIONAL
POWER COMMITTEE
Brief highlights of North Eastern Regional Power System for the month of May, 2010
# The maximum unrestricted demand during the month of May, 2010 was
1578 MW, which was 1577 MW in the month of April, 2010. The peak demand
met in NER during the period under review was 1322 MW, which was 1358 MW
last month.
# The maximum, minimum & average system frequency were 50.80,
48.76 & 49.73 Hz respectively. The maximum, minimum & average FVI were
4.380, 0.420 & 1.370 respectively. The average FVI was less than its previous
month’s figure. (refer Annex-II).
# Maximum export of power from NER to ER was 308 MW (on 13/05/10
at 24:00 hrs) and that from ER to NER was 441 MW (07/05/10 at 11:00 hrs).
Total net energy import during the month was 96.647 MU (from ER).

1
2 Number of total grid disturbance during this month
May-10 May-09
3 Installed Capacity of the Region ( in MW )(grid) 2033.12 2036.78
4 Energy Generation in MU (Gross)::Thermal 349.935 374.117Hydel 232.310 220.343Diesel / Oil 0.000 0.000Total 582.245 594.460
5 Demand in MW ::Registered Peak demand 1578.00 1568.65Peak demand met 1322.00 1342.00Shortage ( % age ) -16.22 -14.45
6 Regional Energy(Gross) in MU ::Energy requirement 745.97 751.37Energy availability 652.91 638.96Surplus (+) / Deficit (-) ( % age ) -12.47 -14.96
7 Inter Regional Energy Exchange in MU ::NER ----> ER 11.838 10.970ER ----> NER 108.485 93.500Net Export -96.647 -82.53
8 Frequency profile ::Average frequency ( Hz ) 49.73 49.68Average Frequency Variation Index 1.370 2.121
9 Load Factor ( in % ) 55.61 54.75
Page-2
SALIENT FEATURES OF NORTH EASTERN REGIONAL GRID FOR APRIL, 2010
New unit/ transmission lines/Transformers commissioned during this month
1 (One)
Nil
NERPC, Shillong Progress Report for May, 2010

ENERGY GENERATION IN THE REGION FOR THE MONTH OF May-10
Total(gen) Total(gen)
Gross Net Gross Net Gross Net Gross Net Gross Net
A B C D E F G H I J
State Sector :Assam 18.610 18.424 0.000 0.000 71.130 70.419 50.990 49.460 140.730 138.303Meghalaya 14.960 14.810 0.000 0.000 0.000 0.000 0.000 0.000 14.960 14.810Mizoram 0.000 0.000 0.000 0.000 0.000 0.000 0.000 0.000 0.000 0.000Tripura 0.940 0.931 0.000 0.000 51.430 50.916 0.000 0.000 52.370 51.846Nagaland 1.350 1.337 0.000 0.000 0.000 0.000 0.000 0.000 1.350 1.337Total ( State Sector ) 209.410 206.296
Central Sector :NEEPCO :Khd+Kop+Kop-II 8.400 8.316 0.000 0.000 0.000 0.000 0.000 0.000 8.400 8.316K'guri 0 0 0.000 0.000 0 0 119.900 116.303 119.900 116.303RCNagar 0 0 0 0 56.485 55.920 0 0 56.485 55.920Doyang 3.510 3.475 0 0 0 0 0 0 3.510 3.475Ranganadi 143.130 141.699 0 0 0 0 0 0 143.130 141.699NHPC :Loktak 41.410 40.996 0.000 0.000 0.000 0.000 0.000 0.000 41.410 40.996Total ( Central Sector ) 372.835 366.709Total NER 232.310 229.987 0.000 0.000 179.045 177.255 170.890 165.763 582.245 573.005
REQUIREMENT Vs AVAILABILITY IN THE REGION
Requirt. Availy. Shortfall Requirt. Availy.** ShortfallAr.Pr. 36.76 30.15 6.60 85 64 21Assam 416.42 380.34 36.08 849 802 47Manipur 43.67 36.20 7.47 90 89 1M'laya 106.56 80.63 25.92 275 186 89Mizoram 28.21 23.18 5.03 60 52 8Nagaland 44.83 39.46 5.37 86 85 1Tripura 69.52 62.94 6.58 133 126 7REGION 745.97 652.91 93.06 1578 1322 256
Page-3
9.46% 5.24%12.47% 16.25%
17.82% 13.78%11.98% 0.69%
17.11% 1.19%24.33% 32.41%
17.97% 24.71%8.66% 5.58%
STATESENERGY requirement (MU) at 50 Hz POWER requirement (MW) at 50 HzAvailability & L/S at prevailing freq. Availability & L/S at prevailing freq.
%Shortfall %Shortfall
All figures in MU
ConstituentsHydro Coal / Oil fired Gas Based(OpenCycle) Gas Based(Com Cycle)
NERPC, Shillong Progress Report for May, 2010
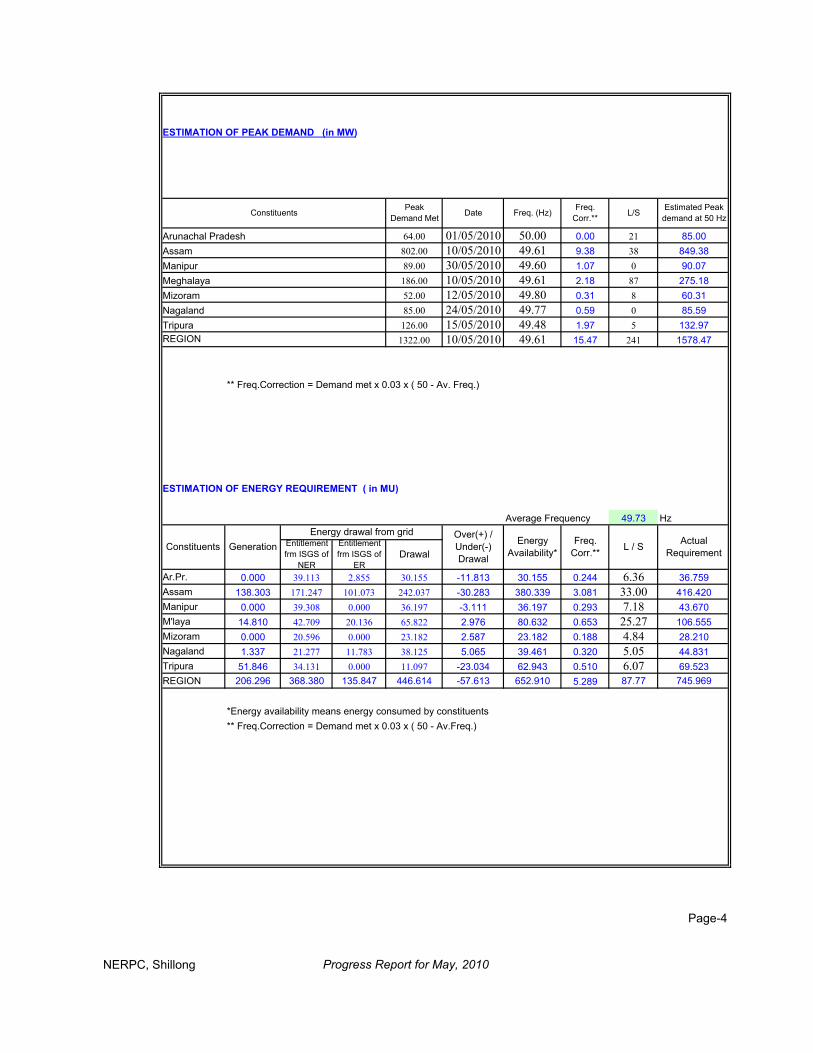
64.00 01/05/2010 50.00 0.00 21 85.00802.00 10/05/2010 49.61 9.38 38 849.3889.00 30/05/2010 49.60 1.07 0 90.07186.00 10/05/2010 49.61 2.18 87 275.1852.00 12/05/2010 49.80 0.31 8 60.31
Nagaland 85.00 24/05/2010 49.77 0.59 0 85.59Tripura 126.00 15/05/2010 49.48 1.97 5 132.97
1322.00 10/05/2010 49.61 15.47 241 1578.47
Average Frequency 49.73 Hz
Ar.Pr. 0.000 39.113 2.855 30.155 -11.813 30.155 0.244 6.36 36.759Assam 138.303 171.247 101.073 242.037 -30.283 380.339 3.081 33.00 416.420Manipur 0.000 39.308 0.000 36.197 -3.111 36.197 0.293 7.18 43.670M'laya 14.810 42.709 20.136 65.822 2.976 80.632 0.653 25.27 106.555Mizoram 0.000 20.596 0.000 23.182 2.587 23.182 0.188 4.84 28.210Nagaland 1.337 21.277 11.783 38.125 5.065 39.461 0.320 5.05 44.831Tripura 51.846 34.131 0.000 11.097 -23.034 62.943 0.510 6.07 69.523REGION 206.296 368.380 135.847 446.614 -57.613 652.910 5.289 87.77 745.969
*Energy availability means energy consumed by constituents
Page-4
** Freq.Correction = Demand met x 0.03 x ( 50 - Av.Freq.)
Energy Availability*
Freq. Corr.** L / S Actual
Requirement Constituents GenerationOver(+) / Under(-) Drawal
Entitlement frm ISGS of
ERDrawal
Energy drawal from gridEntitlement frm ISGS of
NER
Mizoram
REGION
** Freq.Correction = Demand met x 0.03 x ( 50 - Av. Freq.)
ESTIMATION OF ENERGY REQUIREMENT ( in MU)
Arunachal PradeshAssamManipurMeghalaya
ESTIMATION OF PEAK DEMAND (in MW)
Constituents Peak Demand Met Date Freq. (Hz) Freq.
Corr.** L/S Estimated Peak demand at 50 Hz
NERPC, Shillong Progress Report for May, 2010
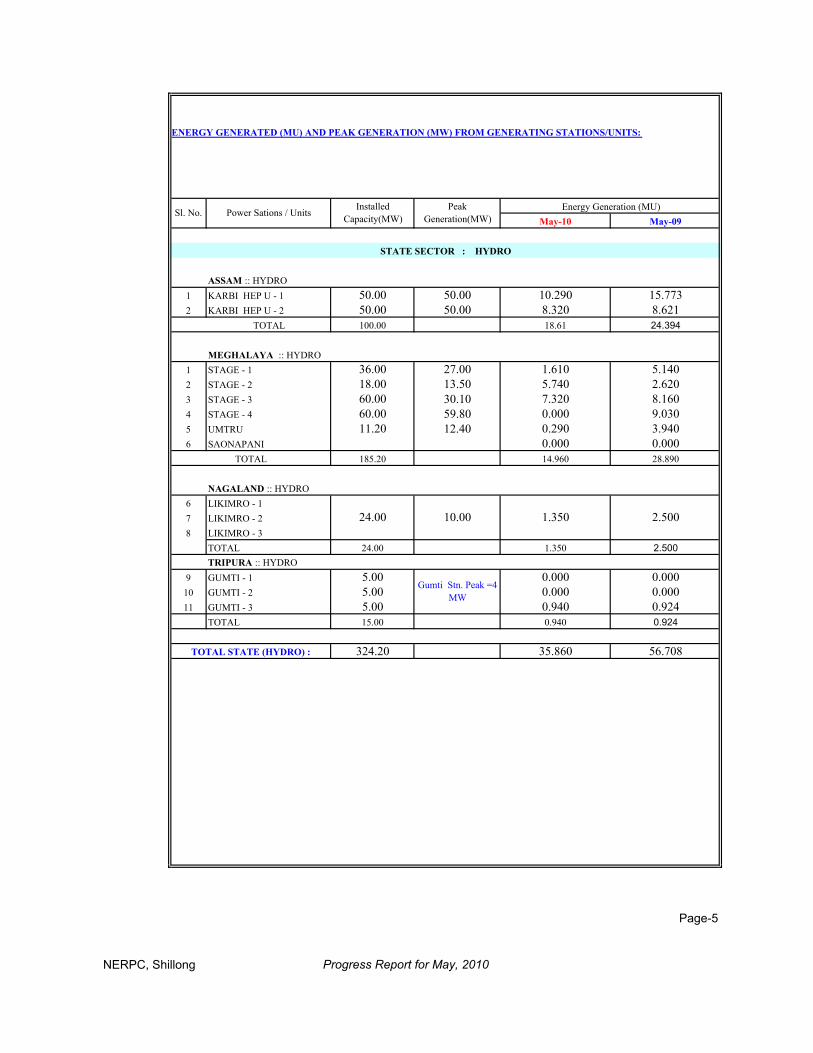
ENERGY GENERATED (MU) AND PEAK GENERATION (MW) FROM GENERATING STATIONS/UNITS:
May-10 May-09
ASSAM :: HYDRO1 KARBI HEP U - 1 50.00 50.00 10.290 15.7732 KARBI HEP U - 2 50.00 50.00 8.320 8.621
TOTAL 100.00 18.61 24.394
1 STAGE - 1 36.00 27.00 1.610 5.1402 STAGE - 2 18.00 13.50 5.740 2.6203 STAGE - 3 60.00 30.10 7.320 8.1604 STAGE - 4 60.00 59.80 0.000 9.0305 UMTRU 11.20 12.40 0.290 3.9406 SAONAPANI 0.000 0.000
185.20 14.960 28.890
6 LIKIMRO - 17 LIKIMRO - 28 LIKIMRO - 3
TOTAL 24.00 1.350 2.500TRIPURA :: HYDRO
9 GUMTI - 1 5.00 0.000 0.00010 GUMTI - 2 5.00 0.000 0.00011 GUMTI - 3 5.00 0.940 0.924
TOTAL 15.00 0.940 0.924
324.20 35.860 56.708
Page-5
10.00 1.350 2.500
Gumti Stn. Peak =4 MW
Peak Generation(MW)
Energy Generation (MU)
STATE SECTOR : HYDRO
MEGHALAYA :: HYDRO
Sl. No. Power Sations / Units Installed Capacity(MW)
TOTAL
NAGALAND :: HYDRO
24.00
TOTAL STATE (HYDRO) :
NERPC, Shillong Progress Report for May, 2010

May-10 May-09
MIZORAM ::Thermal1 Bairabi 22.92 0.00 0.000 0.000
TRIPURA :: THERMAL1 BARAMURA - 1 5.00 0.000 0.0002 BARAMURA - 2 5.00 0.000 0.0003 BARAMURA - 3 6.50 0.000 0.0004 BARAMURA - 4 21.00 14.180 14.6805 ROKHIA - 1 8.00 0.000 0.0006 ROKHIA - 2 8.00 0.000 0.0007 ROKHIA - 3 8.00 4.550 3.9808 ROKHIA - 4 8.00 3.750 3.7379 ROKHIA - 5 8.00 0.000 0.00010 ROKHIA - 6 8.00 0.000 0.00011 ROKHIA - 7 21.00 14.660 14.77312 ROKHIA - 8 21.00 14.290 14.847
TOTAL 127.50 51.430 52.017
ASSAM :: THERMAL1 LTPS - 1 15.00 6.090 9.9702 LTPS - 2 15.00 9.420 9.5103 LTPS - 3 15.00 5.420 10.1504 LTPS - 4 15.00 8.240 8.7605 LTPS - 5 20.00 10.600 7.4106 LTPS - 6 20.00 13.480 14.5207 LTPS - 7 20.00 12.220 8.1408 NTPS - 1 20.00 11.550 12.8409 NTPS - 2 21.00 10.750 11.24010 NTPS - 3 21.00 9.540 10.03011 NTPS - 4 11.00 5.000 0.00012 NTPS - 5 22.00 8.290 6.88013 NTPS - 6 22.00 5.860 5.72014 DLF 24.50 5.660 7.060
TOTAL 261.50 122.120 122.230411.92 173.550 174.247736.12 209.410 230.955
Page-6
NTPS Stn. Peak = 95 MW
TOTAL STATE THERMAL/GAS :TOTAL SC GEN(HY+TH/GAS)
STATE SECTOR : THERMAL/GAS
Baramura Stn. Peak = 21 MW
Rokhia Stn. Peak = 57.9 MW
LTPS Stn. Peak = 106 MW
ENERGY GENERATED (MU) AND PEAK GENERATION (MW) FROM GENERATING STATIONS/UNITS:
Sl. No. Power Sations / Units Installed Capacity(MW) Peak Generation(MW) Energy Generation (MU)
NERPC, Shillong Progress Report for May, 2010

May-10 May-09
1 KHANDONG - 1 25.00 0.00 0.000 4.3152 KHANDONG - 2 25.00 0.00 0.000 3.3303 KOPILI Stg - II 25.00 0.00 0.000 3.5404 KOPILI - 1 50.00 0.00 0.000 9.1805 KOPILI - 2 50.00 50.00 2.890 3.6906 KOPILI - 3 50.00 50.00 3.230 0.0007 KOPILI - 4 50.00 50.00 2.280 22.2308 DOYANG -1 25.00 1.260 0.5909 DOYANG -2 25.00 0.980 0.24010 DOYANG -3 25.00 1.270 1.29011 LOKTAK - 1 35.00 17.170 6.94012 LOKTAK - 2 35.00 0.000 7.42013 LOKTAK - 3 35.00 24.240 0.00014 RANGANADI - 1 135.00 40.360 32.78015 RANGANADI - 2 135.00 48.830 32.32016 RANGANADI - 3 135.00 53.940 35.770
860.00 196.450 163.635
1 KATHALGURI - 1 33.50 22.400 21.7202 KATHALGURI - 2 33.50 22.660 20.5303 KATHALGURI - 3 33.50 18.110 19.2404 KATHALGURI - 4 33.50 10.790 19.9605 KATHALGURI - 5 33.50 21.400 1.8906 KATHALGURI - 6 33.50 0.000 21.1307 KATHALGURI - 7 30.00 17.430 16.2008 KATHALGURI - 8 30.00 0.000 16.5409 KATHALGURI - 9 30.00 7.110 8.39010 R.C.NAGAR - 1 21.00 14.499 14.25011 R.C.NAGAR - 2 21.00 14.188 14.12212 R.C.NAGAR - 3 21.00 13.674 13.56713 R.C.NAGAR - 4 21.00 14.124 12.331
TOTAL THERMAL/GAS : 375.00 176.385 199.870
TOTAL CS ( HY + TH/GAS ) : 1235.000 372.835 363.505
TOTAL NER GEN(HY+TH/GAS) : 1971.120 582.245 594.460
Page-7
CENTRAL SECTOR : THERMAL/GAS
Kathalguri Stn. Peak = 194 MW
RC Nagar Stn. Peak = 83 MW
Doyang Stn. Peak = 45.5 MW
Loktak Stn. Peak = 66 MW
Ranganadi Stn. Peak =405 MW
TOTAL HYDRO :
ENERGY GENERATED (MU) AND PEAK GENERATION (MW) FROM GENERATING STATIONS/UNITS:
Sl. No. Power Sations / Units Installed Capacity(MW)
Peak Generation(MW)
Energy Generation (MU)
CENTRAL SECTOR : HYDRO
NERPC, Shillong Progress Report for May, 2010

May-10
1 LTPS* AEGCL 120.00 65.470 73.332 NTPS* AEGCL 117.00 50.990 58.583 Baramura Tripura 37.50 14.180 50.824 Rokhia Tripura 90.00 37.250 55.635 AGBPP NEEPCO 291.00 119.900 55.386 AGTPP NEEPCO 84.00 56.485 90.387 Bairabi Mizoram 22.92 0.000 0.00
A. MAXIMUM AND MINIMUM VOLTAGE (kV ) OF IMPORTANT SUB - STATIONS :
Sl. No.
1234567
Voltage Range in kV as percentage of time for the block
2.13 0.00 92.35 5.520.35 0.00 97.94 1.71
Page-8
MISA 400 kV381
430 377426
MINIMUM ( kV ) MAXIMUM ( kV )
138 120
VOLTAGE PROFILE :
*LTPS-- Lakwa Thermal Power Station, NTPS-- Namrup Thermal Power Station
NAME OF S/S
210142 128
Sl. No.
237 205MISA 220 kVSALAKATI 220 kV
BALIPARA 400 kV
SUB-STATION
MISA BALIPARA
HAFLONG 132 kVAIZAWL 132kVKUMARGHAT 132kV
Plant Load Factor (PLF) and Voltage Profile :
PLANT LOAD FACTOR OF THE THERMAL/ GAS STATIONS IN NER
Power Station Installed Capacity (MW)
Generation (in MU)
Stationwise PLF (%)State/ Constituent
380<kV<420 kV>420kV < 360 360<kV<380
136 126
237
NERPC, Shillong Progress Report for May, 2010

Page-9
2
31. 50th OCC Meeting was held on07.05.10 at NERLDC Conferencehall, PGCIL, Shillong.
-96.647
MEETING HELD BY NERPC DURING THIS MONTH
Major Grid Disturbances during this month Category GD-V
1. On 15.0510 at 12:13 Hrs.
All Fig in MU
NER to ER 11.838
ER to NER 108.485
INTER - REGIONAL EXCHANGE :
NET EXPORT
1
NERPC, Shillong Progress Report for May, 2010

[A] NEEPCO
1. Monarchak TGBPP 104 2012 Activities in progress2. Tuirial HEP Mizoram 2 2 X 30 WORKS HELD-UP Being reviewed by PIB3. Kameng HEP A. Pradesh 4 4X150 MAR' 2012 Activities in progress4. Tuival H.E. Proj. Mizoram 3 3X70 2015 Status not available5. Tipaimukh HEP 1500 2015 Activities in progress6. Mawphu HEP 2 90 2014 UNDER CCEA7. Pare HEP, Ar. Pradesh 110 2015 UNDER CCEA
[B] NHPCa). Loktak Downstream HEP 2 66 2014 Activities in progressb) Subansiri Lower HEP 2000 2012 Activities in progressc) Siang Middle HEP 2000 2014 Activities in progressd) Subansiri Upper HEP 2000 DPR Under prepe) Subansiri Middle HEP 1000 DPR Under prep f) Dibang Multipurpose Project 3000 Under TEC
[C] NTPCa). Bongaigaon TPS 3 3X250 Unit # I- Mar' 2011 Activities in progress
Unit # II- Aug' 2011Unit # III- Jan' 2012
[D] JV PROJECT a). Palatana CCPP 2 2X323.3 Unit # I- Dec'2011 Activities in progress
Unit # II- Mar'2012[E] ASSAM (a) Lakwa WHRP 37.2 2012 Activities in progress
[F] MIZORAM (a) Tuivai Hydel Project 2 51 2012 Activities in progress(b) Bairabi Dam Project 2 2 X 40 2012 Activities in progress
(G) MeSEB(a) Myntdu - Leishka HEP 2 3x42 2011 Activities in progress
Page-10
Commissioning Schedule REMARKS
PROGRESS OF GENERATION PROJECTS IN NER
Name of the Generation Scheme No. of Units Capacity (MW)
NERPC, Shillong Progress Report for May, 2010

Length Total no. Stubs com - Tower Stringing Remarks(ckt kms) Ann.pl Ant/revd of locs . pleted(nos.) Erected complt-ckm
A : Lines under ASEB.132 kV Nazira - Lakwa 2nd Ckt 21 Completed Work in progress132 kV, S/C Rangia - Sipajhar - Rowta- Depota 147 Work in progress132 kV, S/C Sarusajai - Kahilipara 8 Work in progressLILO of 132 kV Mariani - Dimapur S/C at Bokajan 6 completed Rly Clearance awaited
132 kV Nazira- Garmur (Mariani) S/C 63 Tender is in progress220 kV Kathalguri - Tinsukia 2nd Ckt 50 2006-07 Work in progress
D : Lines under Meghalaya :Myntdu Leshka-Khlieriat 132 KV D/C 2011 Work in progress220 kV Misa-Byrinahat D/C Jun-10 Work in progress132 kV Agia - Nangalbibra Work in progress
E : Lines under Mizoram :132 kV Khawzawl-E Lungdar S/C 48 100 100 76 0 Work in progress132 kV Khawzawl-Ngopa S/C 57 117 117 117 57 Work in progress132 kV Kolasib-Tuirial S/C 41 114 114 114 41(Conductor) Work in progress Kolasib-Sairul B D/C 25 Work in progress132 kV Kolasib-Melriat S/C 90 369 Nil Nil Nil Work in progress132 kV Bairabi-Bawktlang S/C 30 93 91 85 14 Work in progress132 kV Khawzawl-Champhai S/C 30 90 Nil Nil Nil Work in progress
G : CTU Lines:1.LILO of 132 kV Dimapur-Kohima at Dimapur (PG) 2 09/2009 03/2011 3 ROW problem2. 132 kV Kopili-Khandong 12 09/2009 08/2010 43 37 24 8 ROW problem3. 132 kV Aizwal-Aizwal (Deposit Work) 20104.+/- 800 kV HVDC Bipol Bis'nath Chariali-Agra 1971 08/2013 08/2013 1343 174 Award is in progress5. 400 kV Balipara - Biswanath Chariali D/C 130 08/2013 08/2013 167 25 56.LILO of 400 kV R'nadi-Balipara D/C at Bis Chariali 54 08/2013 08/2013 68 Engg.&survey under progre7. 400 kV Kameng - Balipara D/C 110 02/2013 02/2013 142 78.400 kV Balipara - Bongaigaon D/C 596 02/2013 03/2012 838 205 449. 400 kV Lower Subansiri - Biswanath Chariali line-I 334 02/2013 03/2012 432 80 1810. 400 kV Lower Subansiri - Biswanath Chariali line-II 340 02/2013 03/2012 442 13 311. 132 kV D/C Biswanath Chariyali- B. Chariyali (AEGCL) 32 08/2013 08/2013 55 Engg.&survey under prog.12.400 kV Palatana - Silchar 24813.400 kV Silchar - Bongaigaon 405
Page-11
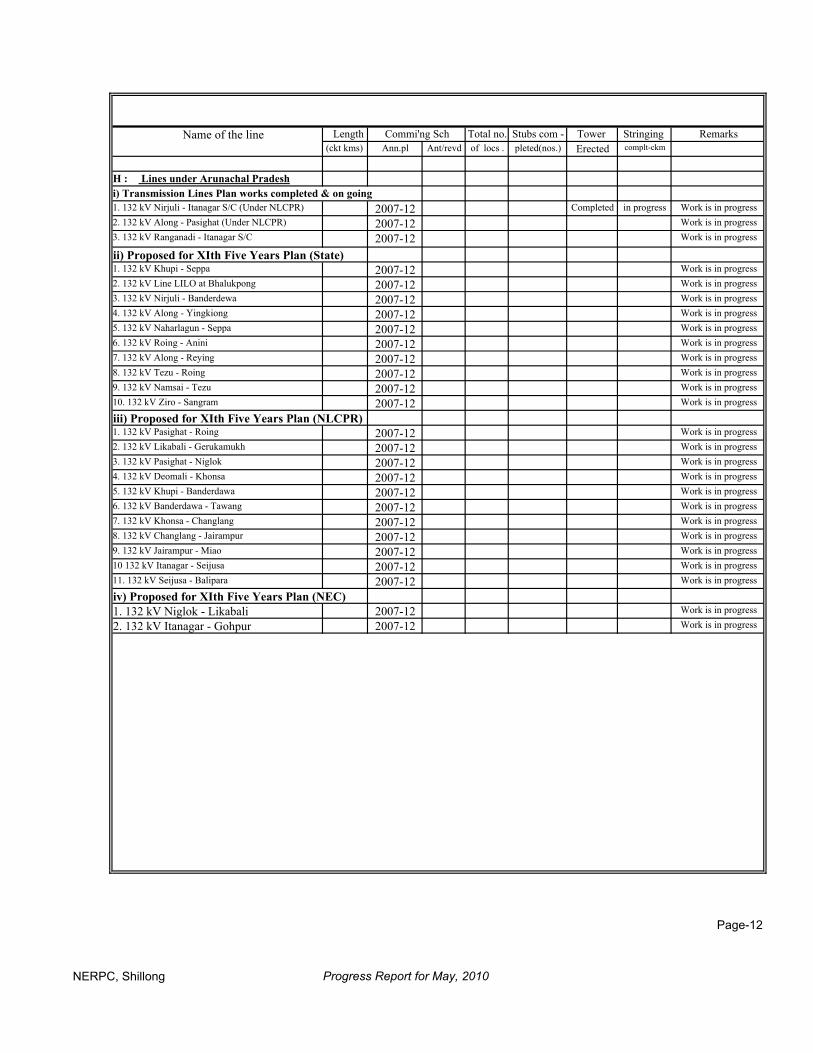
PROGRESS OF TRANSMISSION LINES IN NE REGION
Name of the lineCommi'ng Sch
NERPC, Shillong Progress Report for May, 2010
Length Total no. Stubs com - Tower Stringing Remarks(ckt kms) Ann.pl Ant/revd of locs . pleted(nos.) Erected complt-ckm
H : Lines under Arunachal Pradeshi) Transmission Lines Plan works completed & on going1. 132 kV Nirjuli - Itanagar S/C (Under NLCPR) 2007-12 Completed in progress Work is in progress2. 132 kV Along - Pasighat (Under NLCPR) 2007-12 Work is in progress3. 132 kV Ranganadi - Itanagar S/C 2007-12 Work is in progress
ii) Proposed for XIth Five Years Plan (State)1. 132 kV Khupi - Seppa 2007-12 Work is in progress2. 132 kV Line LILO at Bhalukpong 2007-12 Work is in progress3. 132 kV Nirjuli - Banderdewa 2007-12 Work is in progress4. 132 kV Along - Yingkiong 2007-12 Work is in progress5. 132 kV Naharlagun - Seppa 2007-12 Work is in progress6. 132 kV Roing - Anini 2007-12 Work is in progress7. 132 kV Along - Reying 2007-12 Work is in progress8. 132 kV Tezu - Roing 2007-12 Work is in progress9. 132 kV Namsai - Tezu 2007-12 Work is in progress10. 132 kV Ziro - Sangram 2007-12 Work is in progress
iii) Proposed for XIth Five Years Plan (NLCPR) 1. 132 kV Pasighat - Roing 2007-12 Work is in progress2. 132 kV Likabali - Gerukamukh 2007-12 Work is in progress3. 132 kV Pasighat - Niglok 2007-12 Work is in progress4. 132 kV Deomali - Khonsa 2007-12 Work is in progress5. 132 kV Khupi - Banderdawa 2007-12 Work is in progress6. 132 kV Banderdawa - Tawang 2007-12 Work is in progress7. 132 kV Khonsa - Changlang 2007-12 Work is in progress8. 132 kV Changlang - Jairampur 2007-12 Work is in progress9. 132 kV Jairampur - Miao 2007-12 Work is in progress10 132 kV Itanagar - Seijusa 2007-12 Work is in progress11. 132 kV Seijusa - Balipara 2007-12 Work is in progress
iv) Proposed for XIth Five Years Plan (NEC)1. 132 kV Niglok - Likabali 2007-12 Work is in progress
2. 132 kV Itanagar - Gohpur 2007-12 Work is in progress
Page-12
Commi'ng Sch Name of the line
NERPC, Shillong Progress Report for May, 2010

UI Receivable/ Payable for the month of May-10
Arunachal Pradesh 30.155 33.842 -3.687 250.58 61.21ASEB 242.037 265.075 -23.038 1538.67 146.94Manipur 36.197 41.168 -4.971 293.07 35.91MeSEB 65.822 66.127 -0.306 220.86 109.35Mizoram 23.182 23.067 0.115 74.49 59.98Nagaland 38.125 32.276 5.849 25.25 204.02Tripura 11.097 29.303 -18.206 724.46 2.02
Entitlement, Schedule, Drawal and UI Charges May-10
Arunachal Pradesh 39.113 39.189 33.842 30.155 -3.687 1.894
ASEB 171.247 170.881 265.075 242.037 -23.038 13.917
Manipur 39.308 39.351 41.168 36.197 -4.971 2.572
MeSEB 42.709 42.709 66.127 65.822 -0.306 1.115
Mizoram 20.596 20.594 23.067 23.182 0.115 0.145
Nagaland 21.277 21.231 32.276 38.125 5.849 -1.788
Tripura 34.131 34.424 29.303 11.097 -18.206 7.224
( Source : UI A/c, NERPC )
Page-13
UI Energy (MU)
Actual Drawal from Grid
(MU)
Over Drawal (+) / Under Drawal (-)
(MU)
UI Payable (-)/ Receivable (+)
(Rs. In Cr)
Net Schedule from Grid
(MU)
UI Receivable (Rs. in Lakhs)
UI Payable (Rs. in Lakhs)
Drawal Schedule
from CGSs (MU)
Entitlement from CGSs
(MU)
OrganisationActual (MU)
Schedule (MU)
NERPC, Shillong Progress Report for May, 2010

Schedule for ISGS's Generation and State's Drawl for the month of May-10
Arunachal Pradesh 39090.52 39090.52 31292.08 39090.52ASEB 171043.74 104761.400000 275805.14 251163.55 275805.14
Manipur 39276.39 39276.39 37561.87 39276.39MeSEB 42665.33 20870.250000 63535.58 68303.63 68303.63Mizoram 20573.91 20573.91 24056.42 24056.42Nagaland 21254.70 12211.60 33466.30 39562.50 39562.50Tripura 34092.22 34092.22 11515.35 34092.22
Total 367996.82 137843.25 505840.07 463455.40 520186.82
LOKTAK 41305.58 40940.22KHANDONG 0.00 -268.16
KOPILI-I 8408.47 7842.72KOPILI-II 0.00 -29.97
DHEP 3169.17 3216.21RHEP 142433.34 142869.77
AGTPP 54972.30 55429.16AGBPP 117707.96 116808.75
Total 367996.82 366808.69
May-10
Page-14
Schedule From ISGS(MWH)
Bilateral Schedule from Outside NER ( MWH )
Total Schedule ( MWH )
Source : Provisional REA for the month:
Ex.PP. Drawal ( MWH )
Tr. Energy ( MWH )
ISGS Schedule ( MWH )
Injection ( MWH )
States
NERPC, Shillong Progress Report for May, 2010

Cumulative wt. Average Share Allocation (%) ( Up to this month) in CS Stations
KOPILI KOPILI-II KHANDONG RHEP DHEP AGBPP AGTPP Loktak HEP
(200 MW) (25 MW) ( 50 MW) (405 MW) (75 MW) (291 MW) ( 84 MW) ( 90 MW)
Arunachal Pradesh 5.193 6.193 4.192 18.462 6.882 5.693 6.180 4.942
Assam 53.455 46.615 56.277 43.328 43.742 56.465 45.178 29.415
Manipur 7.385 7.225 6.565 8.373 7.893 8.125 8.143 30.115
Meghalaya 17.150 18.650 16.650 11.250 11.230 11.550 11.340 12.140
Mizoram 4.619 6.278 3.940 5.710 5.240 5.429 6.190 5.068
Nagaland 6.155 5.656 6.653 5.335 17.935 5.805 5.607 6.427
Tripura 6.043 9.383 5.723 7.542 7.078 6.933 17.362 11.893
Total 100.00 100.00 100.00 100.00 100.00 100.00 100.00 100.00
Details of Fixed and Energy Charges of CS Stations for FY 2009-10
Projects Installed Design Annual ReferenceCapacity Energy Fixed Charge( MW ) (GWh ) ( Rs. Crore)
KOPILI HEP 200 1186.14* 57.6738 * *As per CERC order dated 19.02.08in petition No 76/2007.
KOPILI -II 25 86.3* 12.9511 ** * Provisional, ** As per CERC order dated 01.01.08 in pet. No 70/2006
KHANDONG HEP 50 277.61* 19.6328 * *As per CERC order dated 14.01.08in petition No 26/2007.
RHEP 405 1509.69 203.4081 *As per CERC order dated 30.04.08in petition No 89/2007.
DHEP 75 227.24 58.5 * *As per CERC order dated 03.10.07in petition No 88/2007.
AGBPP 291 NA 233.59 * *As per CERC order dated 22.02.08 in Pet.No150/ /2005, ^ Base Rate of energy Charge as per CERC Order
AGTPP 84 NA 52.71 * *As per CERC order dated 20.02.08 in Pet.No135/2005,^Base Engy. charge as per CERC order
LOKTAK HEP 105 448.00 50.0353 * *As per CERC order dated 05.09.07 in Pet.No 171/2004
Page-15
States
NERPC, Shillong Progress Report for May, 2010

HOURLY DATA ON PEAK DEMAND MET DAY
DATE:- 09.05.2010All figures in MW
HR
S.
Total ISGS
Injection (MW)
STATE SECTORER
Total Drawal by
States
Manipur Mizoram Nagaland ArPr
GEN Drawal Demand Met GEN Demand
Met Drawal GEN Demand Met Drawal DM DM DM DM IMPORT(+)/
EXPORT(-)
1 254.29 211 241.82 452.8 53 153.7 100.72 71 99.9 28.38 35.72 22.45 48.86 38.60 279.40 589.79 852.06 869.19 17.1 237.152 254.30 210 220.92 430.8 5 106.6 101.64 71 97.0 25.84 28.88 21.21 48.32 31.73 242.21 540.40 764.65 782.61 18.0 236.343 251.48 210 194.41 404.3 5 104.8 99.76 72 94.8 23.12 26.69 20.72 40.46 31.65 204.35 538.03 723.36 742.39 19.0 232.454 254.42 209 173.60 382.8 5 108.4 103.38 72 87.3 15.55 26.60 20.40 38.69 35.53 177.10 540.38 699.71 717.48 17.8 236.655 252.53 208 179.35 387.8 5 128.7 123.74 71 99.7 28.67 26.88 24.74 46.05 38.15 213.56 536.97 752.03 750.54 -1.5 254.026 270.16 168 186.29 354.1 29 115.5 86.79 15 20.5 5.91 54.09 30.43 57.66 35.95 202.06 481.16 668.13 683.22 15.1 255.067 381.48 168 207.47 375.6 43 136.7 93.58 71 71.3 -0.08 55.20 43.19 62.36 41.05 142.83 664.19 785.49 807.03 21.5 359.948 375.66 168 221.85 389.6 43 153.9 111.34 71 78.0 6.91 54.85 47.98 58.69 41.01 182.74 657.11 824.09 839.85 15.8 359.899 375.72 167 236.38 403.4 29 142.6 113.36 71 81.2 10.43 62.66 38.06 52.11 44.63 195.67 642.86 824.77 838.53 13.8 361.9610 238.34 123 277.78 401.0 29 133.9 104.63 69 69.1 0.08 53.34 33.54 45.10 31.77 321.11 459.92 767.81 781.03 13.2 225.1211 240.88 123 295.57 418.8 5 91.5 86.47 68 71.2 2.73 45.29 32.13 40.72 32.92 311.86 437.63 732.57 749.49 16.9 223.9512 257.19 123 291.80 415.1 9 101.5 92.43 68 77.2 8.99 38.77 35.15 42.93 30.74 315.99 457.79 741.41 773.78 32.4 224.8213 252.77 123 286.87 410.1 18 96.9 78.73 67 68.1 0.77 52.52 35.67 45.15 33.28 302.56 461.50 741.71 764.06 22.3 230.4314 254.15 123 270.52 393.8 18 105.8 87.73 68 52.5 -15.78 54.84 28.79 49.23 33.93 277.50 463.79 718.90 741.30 22.4 231.7515 255.94 123 278.13 401.4 18 94.4 76.33 69 65.4 -3.26 60.24 33.35 48.33 33.31 286.13 465.95 736.43 752.08 15.6 240.3016 255.13 123 284.88 408.1 18 103.1 85.03 69 66.6 -1.94 67.82 34.23 55.55 33.21 320.20 465.05 768.69 785.25 16.6 238.5717 390.96 123 263.65 386.9 18 102.5 84.51 68 67.3 -1.13 59.04 35.15 33.40 48.79 146.04 600.67 733.10 746.71 13.6 377.3518 567.65 167 368.72 536.1 18 116.1 98.01 63 72.1 8.99 58.27 36.76 44.22 60.41 131.93 816.24 923.97 948.17 24.2 543.4419 788.71 167 462.86 629.9 34 144.7 110.42 69 89.6 20.29 72.08 36.32 43.55 66.42 55.08 1059.37 1082.59 1114.45 31.9 756.8520 828.90 216 439.04 654.8 59 169.3 110.13 70 68.0 -2.09 72.56 39.93 53.86 65.20 -15.46 1173.97 1123.70 1158.51 34.8 794.0921 815.03 216 429.03 644.8 55 163.6 108.18 68 73.8 5.36 73.81 39.41 45.01 59.89 -23.81 1154.59 1100.26 1130.78 30.5 784.5022 692.38 216 392.21 608.0 54 154.0 100.12 71 80.4 8.93 71.55 32.16 42.35 51.92 38.34 1033.52 1040.38 1071.86 31.5 660.9023 508.82 211 317.87 529.3 54 161.9 108.04 72 67.6 -3.97 70.50 24.34 33.06 43.26 110.42 845.69 929.98 956.12 26.1 482.6824 399.63 210 267.48 477.8 30 129.4 99.27 71 53.3 -17.59 56.55 17.55 28.57 39.54 107.36 710.94 802.69 818.30 15.6 384.01
Max 828.90 216 462.86 654.82 59 169.3 123.74 72 99.9 28.67 73.81 47.98 62.36 66.42 321.11 1173.97 1123.70 1158.51 34.8 794.09Min 238.34 123 173.60 354.07 5 91.5 76.33 15 20.5 -17.59 26.60 17.55 28.57 30.74 -23.81 437.63 668.13 683.22 -1.5 223.95
Page-16
HR
S.
Total ISGS
Injection (MW)
STATE SECTORER
Total Drawal by
States
Total Demand
Met
Gross Demand
met
Actual Loss
ASEB MeSEB TripuraTotal N.E.R GEN
NERPC, Shillong Progress Report for May, 2010

HOURLY DATA ON MINIMUM DEMAND MET DAY
DATE: 13.05.2010All figures in MW
HR
S.
Total ISGS
Injection (MW)
STATE SECTOR
Actual Loss
Total Drawal by
States
ERTotal N.E.R GEN
Total Demand
Met
Gross Demand met = Sum of demand met of
all the states+loss
Manipur Mizoram Nagaland ArPr
GEN Demand Met Drawal GEN Demand
Met Drawal GEN drawal Demand Met DM DM DM DM IMPORT(+)/
EXPORT(-)
1 274.47 209 529.1 319.90 56 136.8 80.82 71 34.83 106.06 23.74 22.69 46.79 23.57 259.01 610.9 888.8 869.93 -18.9 293.332 280.01 144 388.4 244.52 5 96.7 91.67 72 30.74 102.26 16.54 21.77 45.47 29.26 222.93 500.4 700.4 723.37 23.0 257.043 279.05 148 389.3 240.90 5 93.3 88.27 71 28.74 99.90 17.00 21.37 44.43 23.20 211.75 503.6 688.4 715.33 26.9 252.154 277.75 139 375.3 236.66 5 96.8 91.78 71 26.09 97.22 13.78 20.51 44.14 21.64 208.70 492.5 669.3 701.21 31.9 245.875 288.37 139 348.8 210.14 5 124.0 119.05 71 18.24 89.28 18.30 24.03 50.77 24.70 202.10 503.0 679.9 705.15 25.2 263.126 343.30 139 365.1 226.51 5 124.0 119.05 71 21.72 92.99 43.42 -0.22 60.25 34.69 154.99 558.2 720.3 742.41 22.1 321.227 364.59 138 377.0 238.80 29 135.9 106.77 64 17.34 81.35 41.50 22.20 56.28 40.87 187.01 595.9 755.1 782.92 27.8 336.758 368.27 149 477.4 328.22 29 129.7 100.58 68 18.39 86.03 41.64 31.32 47.57 45.40 263.08 614.2 859.0 877.29 18.2 350.029 367.73 22 379.0 356.88 29 119.4 90.51 67 20.60 87.29 40.46 27.07 42.17 36.59 267.69 485.5 732.0 753.15 21.1 346.5810 370.61 22 380.9 358.56 29 89.6 60.76 61 24.98 86.40 28.70 26.27 31.41 34.92 211.64 483.2 678.2 694.84 16.7 353.9411 384.40 69 338.7 269.89 18 80.2 62.32 64 23.96 88.33 25.98 24.44 46.85 24.29 117.37 535.5 628.8 652.83 24.0 360.3512 374.61 156 476.2 320.04 9 90.7 81.86 62 23.16 85.11 0.02 24.41 40.78 39.04 172.31 601.5 756.2 773.87 17.6 356.9813 378.79 113 421.3 307.88 5 90.5 85.47 61 27.74 89.13 0.02 26.04 43.73 43.35 172.93 558.5 714.0 731.49 17.5 361.2814 372.89 128 443.5 315.78 5 88.6 83.60 67 32.58 99.36 0.07 24.00 46.84 40.81 186.72 572.3 743.2 759.08 15.9 356.9715 506.63 141 463.3 322.49 5 94.1 89.10 65 36.08 101.56 0.06 31.91 54.38 39.19 91.38 718.0 784.5 809.34 24.8 481.8216 488.64 137 503.1 365.67 5 94.0 89.04 66 30.30 95.95 35.51 38.06 56.17 42.99 195.17 696.7 865.8 891.88 26.1 462.5417 660.08 146 520.7 374.21 5 94.8 89.84 65 23.16 88.65 31.04 39.24 58.11 49.71 40.41 877.0 882.2 917.46 35.2 624.8718 635.06 150 536.9 386.41 5 112.4 107.42 68 37.88 105.40 45.39 42.42 68.74 58.57 100.41 858.0 969.8 958.48 -11.4 646.4119 755.02 213 650.8 437.82 43 139.8 96.76 70 37.56 107.23 57.20 45.13 72.09 66.35 81.45 1080.8 1138.7 1162.27 23.6 731.4220 762.74 233 478.4 245.32 37 79.8 42.74 69 38.80 107.85 57.04 42.42 74.41 66.44 -168.93 1101.9 906.3 932.97 26.6 736.0921 776.57 168 357.7 189.70 71 102.2 31.25 70 44.81 114.73 53.61 41.50 70.88 61.16 -253.97 1085.4 801.8 831.49 29.7 746.8622 715.37 161 325.7 165.04 66 130.9 64.65 70 49.06 118.92 14.39 39.61 24.55 52.83 -255.77 1012.1 706.9 756.38 49.5 665.8723 679.82 163 275.2 112.02 9 81.0 71.93 70 33.24 103.18 45.12 30.43 10.51 43.77 -328.04 922.0 589.2 594.01 4.8 675.0424 441.39 171 274.5 103.06 5 81.6 76.59 70 36.17 106.49 35.64 23.72 23.01 34.54 -139.57 688.2 579.5 548.62 -30.9 472.28
Max 776.57 233 650.8 437.82 71 139.8 119.05 72 49.06 118.92 57.20 45.13 74.41 66.44 267.69 1101.9 1138.7 1162.27 49.5 746.86Min 274.47 22 274.5 103.06 5 79.8 31.25 61 17.34 81.35 0.02 -0.22 10.51 21.64 -328.04 483.2 579.5 548.62 -30.9 245.87
Page-17
HR
S.
Total ISGS
Injection (MW)
STATE SECTOR
ASEB MeSEB TripuraActual Loss
Total Drawal by
States
ERTotal N.E.R GEN
Total Demand
Met
Gross Demand met = Sum of demand met of
all the states+loss
NERPC, Shillong Progress Report for May, 2010

ANNEXURES &
EXHIBITS

Annexure-I
RESERVOIR PARTICULARS OF THE MONTH : May-10
Level Energy content(MU) Level Energy content(MU)KHANDONG 719.3 M 704 M 703.13 0.00 714.80 15.00KOPILI 609.5 M 592.83 M 598.05 21.00 597.10 17.00LOKTAK 768.5 M 766.2 M 767.63 69.66 768.30 200.00BARAPANI 3220 Ft 3150 Ft 3164.78 6.30 3164.62 6.20
GUMTI 93.55 M 83.6 M 81.50 0.60 84.20 1.80
DOYANG 333 M 306 M 307.65 2.00 308.10 3.00
End of the monthName of the Reservoirs FRL MDDL Beginning of the month
NERPC, Shillong Progress Report for May, 2010

Annexure-II
FREQUENCY ANALYSIS FOR THE MONTH OF : May-10
( Freq.in Hz ) ( Time: H:M )
1. Maximum frequency 50.80 8:20
2. Minimum frequency 48.76 23:07
3. Monthly average 49.73
Frequency in Hz as %age of time for the blocks :
Daily Frequency Variation Index :
DATE FVI DATE FVI01-May-10 2.003 17-May-10 2.51002-May-10 1.262 18-May-10 4.38003-May-10 0.920 19-May-10 2.53904-May-10 0.950 20-May-10 1.77005-May-10 0.595 21-May-10 1.80506-May-10 1.140 22-May-10 1.02907-May-10 0.605 23-May-10 0.49408-May-10 0.688 24-May-10 0.54709-May-10 0.750 25-May-10 0.48010-May-10 1.600 26-May-10 0.42011-May-10 1.505 27-May-10 0.46112-May-10 2.611 28-May-10 0.81413-May-10 1.650 29-May-10 0.75114-May-10 2.659 30-May-10 0.70615-May-10 1.863 31-May-10 1.45916-May-10 1.490 Average FVI 1.370
f >50.33.54
f < 49.212.68
49.2 < f < 50.383.78
15.06.10
Frequency ( Date:D.M.Y )
28.05.10
NERPC, Shillong Progress Report for May, 2010

Annexure-III
Details of Scheduled Bilateral Exchanges within the Region in May-10
1 Tripura(Baramura) Manipur 3304.562500 3188.3069382 Tripura(Baramura) Mizoram 3304.562500 3188.3069383 ASEB POWERGRID^ 213.615275 ^ The actual energy consumed by POWERGRID4 TSECL MeSEB (NVVN) 270.000000 258.430000
Scheduled Bilateral Exchange with SEBs / Organisations in other Regions
Sl.No. From To Energy ( At Seller Periphery) (MWH)
Energy ( At NER-ER Periphery) (MWH)
Energy ( At Buyer Periphery) (MWH)
1 Ar. Pradesh BRPL (AP) 5507.750000 5326.9900002 APDCL WBSEDCL (NVVN) 350.000000 339.1500003 APDCL MSEDCL (NVVN) 312.500000 302.8125004 HPPC APDCL (NVVN) 240.000000 227.340000 218.7000005 HPPC APDCL (NVVN) 240.000000 227.340000 218.7000006 Shyam Century TNEB (LANCO) 6048.000000 5638.3200007 WBSEDCL MeECL (NVVN) 5980.000000 5846.480000 5650.5200008 GFL MeECL (RPTCL) 4464.000000 4037.280000 3895.4400009 WBSEDCL TSECL (NVVN) 8092.000000 7914.010000 7638.100000
10 Farakka* Ar. Pradesh 1434.639375 1394.525000 1345.64780011 Kahalgaon 1* Ar. Pradesh 583.534000 544.125000 525.05300012 Talcher* Ar. Pradesh 1030.198125 1020.200000 984.43080013 Farakka* Assam 43068.923625 42101.100000 40621.75822514 Kahalgaon 1* Assam 11902.536250 11639.675000 11230.02780015 Kahalgaon 2* Assam 29668.171500 28982.625000 27958.19435016 Talcher* Assam 22547.172375 22038.000000 21262.71470017 Farakka* MeECL 5547.272250 5416.150000 5226.21740018 Kahalgaon 1* MeECL 2417.498000 2380.925000 2297.48010019 Kahalgaon 2* MeECL 9381.240000 9176.175000 8851.873200
20 Talcher* MeECL 3983.432750 3897.000000 3760.42230021 Farakka* Nagaland 5812.524625 5683.825000 5484.53475022 Kahalgaon 1* Nagaland 2501.712000 2448.025000 2362.22030023 Talcher* Nagaland 4181.823250 4079.750000 3936.710150
Bilateral exchange through IEX Power Exchange (-ve means injection, +ve means drawal)24 Arunachal Pradesh -1703.130000 -1651.00000025 Arunachal Pradesh 368.900000 354.48000026 Assam -711.790000 -689.72000027 MeSEB -1962.770000 -1894.42000028 MeSEB 2848.570000 2745.56000029 Tripura -4728.350000 -4568.12000030 Tripura 50.000000 48.010000
Energy ( At Seller Injn. Point) (MWH)
Energy ( At State Periphery)(MWH)
Sl.No. From To
NERPC, Shillong Progress Report for May, 2010

Annexure-IV
ENERGY EXCHANGE( in MU ) IN NER DURING
Loktak 40.940 DHEP 3.216Khandong -0.268 RHEP 142.870Kopili 7.843 AGTPP 55.429Kopili-II -0.030 AGBPP 116.8087
96.647
30.15 242.037 36.197 65.822 23.182 38.125 11.097
Ar.Pradesh Assam Manipur Meghalaya Mizoram Nagaland Tripura3.305
0.354 0.214 2.746POWERGRID 0.712 0.270
3.305
2. NTPC to ASEB 107.19 MU 1.963MeSEB 21.33 MUNagaland 12.50 MU 1.703 4.728Ar. Pradesh 3.05 MU
3.
May, 2010
ER
366.809
ISGS of NER
N.B - 1. Drawals are at inletpoints.
IEX Power ExchangeDetails of Bilateral transactions given in Annexure-III
0.048
NERPC, Shillong Progress Report for May, 2010

Exhibit-I
Frequency Duration for May, 2010
f < 49.212.68%
f > 50.33.54%
49.2 < f < 50.383.78%
f < 49.2 49.2 < f < 50.3 f > 50.3
NERPC, Shillong Progress Report for May, 2010

Exhibit-II
FVI Characteristics for May, 2010
0.420
4.380
1.370
0.000
0.500
1.000
1.500
2.000
2.500
3.000
3.500
4.000
4.500
5.000
01/05
/2010
02/05
/2010
03/05
/2010
04/05
/2010
05/05
/2010
06/05
/2010
07/05
/2010
08/05
/2010
09/05
/2010
10/05
/2010
11/05
/2010
12/05
/2010
13/05
/2010
14/05
/2010
15/05
/2010
16/05
/2010
17/05
/2010
18/05
/2010
19/05
/2010
20/05
/2010
21/05
/2010
22/05
/2010
23/05
/2010
24/05
/2010
25/05
/2010
26/05
/2010
27/05
/2010
28/05
/2010
29/05
/2010
30/05
/2010
31/05
/2010
FVI -
---->
FVI Av FVI
NERPC, Shillong Progress Report for May, 2010

Exhibit-III
Maximum & Minimum Voltage Levels of Important Substations in NER during May, 2010
426 430
237 237
142 138 136
381 377
205 210
128 120 126
0
50
100
150
200
250
300
350
400
450
500
BALIPARA 400kV MISA 400 kV MISA 220 kV SALAKATI 220 kV HAFLONG 132 kV AIZAWL 132 kV KUMARGHAT 132 kV
Important Sub Stations (400kV/220kV/132kV) ------>
Volta
ge L
evel
(kV)
--->
NERPC, Shillong Progress Report for May, 2010

Exhibit-IV
State and Central Sector Generation (MU) in NER in May, 2010
65.4
7
50.9
9
18.6
1
5.66
1.61 5.
74 7.32
0 0.29
0.00
0
0.94
14.1
8
37.2
5
1.35 8.
4
0 0
119.
9
56.4
85
3.51
143.
13
41.4
1
0
20
40
60
80
100
120
140
160
LTP
S
NTP
S
KA
RB
I
DLF
Stg
-I
Stg
-II
Stg
-III
Stg
-IV
Um
tru
Bai
rabi
Gum
ti
Bar
amur
a
Rok
hia
Likh
imro
Kop
ili
Kha
ndon
g
Kop
ili-II
Kat
halg
uri
RC
Nag
ar
Doy
ang
Ran
gana
di
Lokt
ak
Assam MeSEB Mizoram Tripura Nagaland NEEPCO NHPC
Gen
erat
ion
(MU
) ----
>
NERPC, Shillong Progress Report for May, 2010

Exhibit-V
NER States Energy Scenario in May, 2010
0.00
138.
30
0.00 14
.81
0.00
1.34
51.8
5
206.
30
39.1
1
171.
25
39.3
1
42.7
1
20.6
0
21.2
8
34.1
3
368.
38
30
242
36
66
23 38
11
447
30.1
5
380.
34
36.2
0 80.6
3
23.1
8
39.4
6
62.9
4
652.
91
36.7
6
416.
42
43.6
7 106.
56
28.2
1
44.8
3
69.5
2
745.
97
-6.6
0
-36.
08 -7.4
7
-25.
92 -5.0
3
-5.3
7
-6.5
8
-93.
06
-200
-100
0
100
200
300
400
500
600
700
800
Ar.Pradesh Assam Manipur Meghalaya Mizoram Nagaland Tripura Total
GEN
ERA
TIO
N (M
U) -
----->
Own Generation Entitlement from ISGS Drawal from Grid
Energy Available Actual Requirement Surplus (+) / Deficit(-)(MU)
NERPC, Shillong Progress Report for May, 2010

Exhibit-VIReservoir Statistics of NER in May, 2010
703.
1
598.
1 767.
6 964.
6
81.5
307.
7
0.0
210.
0
696.
6
63.0
6.0 20.0
714.
8
597.
1 768.
3 964.
6
84.2
308.
1
150.
0
170.
0
2000
.0
62.0
18.0
30.0
0
500
1000
1500
2000
2500
KHANDONG KOPILI LOKTAK BARAPANI GUMTI DOYANG
Wat
er L
evel
(m) &
Ene
rgy
Con
tent
(MU
/10)
---->
Beginning of the month Level Beginning of the month Energy content(MU)End of the month Level End of the month Energy content(MU)
NERPC, Shillong Progress Report for May, 2010