progress report 1994{1996 - royal institute of …/pdc... · progress report 1994{1996. pdc ... can...
TRANSCRIPT

Progress Report1994–1996


PDCCenter for Parallel Computers
Progress Report1994-1996

Front Cover Picture: A rendering of a geometric model of the SP-2 installed at theCenter for Parallel Computers at KTH. The picture shows a few of the SP-2 framesand the screen of the Silicon Graphics Onyx RE2. The red tubes in the backgroundrepresent the internal HiPPI network and the FDDI rings which connect PDC toSUNET and the world. The rendering model was developed by Johan Ihren, usingthe ray tracing program rayshade.On the screen there is a snapshot of a numerical simulation of an E-shaped wave-guide transmitting electromagnetic waves. The calculations are performed by solvingMaxwells equations with finite differences in time domain. The antenna current isshown on the antenna, surface currents on the waveguide surface and energy density(log scale) in the field, projected on the three outer artificial surfaces. Calculationshave been done by Gunnar Ledfelt, see Section 4.1 on page 35 for more details.
(Copyright c© 1996 Center for Parallel Computers.)
PDC ParallelldatorcentrumRoyal Institute of TechnologyS–100 44 Stockholm, SWEDENTelephone: +46–8–790 78 00Telefax: +46–8–24 77 84Email: [email protected]: http://www.pdc.kth.se/
Publisher: Parallelldatorcentrum, c©1996Editors: Fredrik Hedman, Tomas Wilhelmsson, Ulf AnderssonTypesetting & layout: Fredrik Hedman, Tomas WilhelmssonPrinted by: Ekblads, Vastervik, November 1996
ISBN 91-7170-695-X

Foreword
This progress report covers an intense period of transition and develop-ment at the Center for Parallel Computers (PDC). The progress occurredin different areas and most notably in the number of users and in thescope of their applications. There was also substantial development inthe PDC organization, hardware and software.
The most important event during the period was the decision by theSwedish Council for High Performance Computing (HPDR) of choosingPDC for its major grant in the Summer of 1995. This followed an eval-uation of different sites by a team of international experts. PDC wassuggested as the leading Swedish high performance computing facility.
The contract with HPDR resulted in a strengthened organization andan improved level of service. Examples are doubling of the systems staffand extended help desk service. Another is the process for allocatingcomputer time. Now the applications for resources are evaluated quar-terly by a scientific evaluation committee which, whenever necessary, canrequest international refereeing.
The grant also resulted in a very substantial upgrade of hardware andsoftware. For the first time in many years there is a high performancecomputer of international class in Sweden. This 96 node IBM SP-2 isthe largest SP-2 outside the United States and it has already producedsubstantial scientific progress as can be seen from the projects describedin this report. The improvements in networking and mass storage capa-bility are also very important. See Chapter 1 in this progress report fordetails.
These changes have brought in new users and new applications toPDC. A relatively large number of application software systems have nowbeen developed for the SP-2. This means, for example, that a typicalComputational Chemist or Physicist can rely on the PDC resources.There has also been a shift from the data parallel programming paradigmto message passing and the user profile is now quite similar to that ofthe NSF centers in the United States. There is, furthermore, a smallerfraction of projects in the computer science of parallel processing andmore dominance of chemistry, physics and other applications from thesciences. Many such examples are given in this progress report.
The industrial users have benefited from the creation of the Paralleland Scientific Computing Institute (PSCI) in 1995. PSCI is sponsored bySwedish industry, the Swedish National Board for Industrial and Tech-nical development (NUTEK) and by the Royal Institute of Technology(KTH). Its mission is research and graduate education in industrial appli-cations of scientific computing. The work is performed in close collabora-
Foreword 1

tion with industry and a quick view of projects with industrial relevancecan be seen in the color plates in Chapter 2, Figures 2.5 and 2.8–2.17.PDC and PSCI share some common resources and jointly participate inEuropean projects.
PDC will continue to develop in the direction, which now has beenestablished, but new programs will also be introduced in order to increasethe use of high performance computing in emerging fields. These includeadvanced visualization and scientific data base techniques related to massstorage. One aspect of these efforts is the desire of reaching users outsidethe traditional fields of the computational sciences.
PDC is looking forward to the next few years with confidence. Afterthese past years of a growing user base and improved infrastructure westrongly believe that high performance computing will continue to playan increasing role in science and engineering. We are also convincedthat the level of service which PDC provides will continue at a highprofessional level and that increased resources will benefit both old andnew user groups,
Bjorn EngquistDirector
2 Foreword

Contents
1 PDC – Paralleldatorcentrum 71.1 Background and Highlights . . . . . . . . . . . . . . . . . 71.2 Organization of PDC . . . . . . . . . . . . . . . . . . . . . 71.3 Cost of Operation and Staff . . . . . . . . . . . . . . . . . 81.4 Hardware Resources . . . . . . . . . . . . . . . . . . . . . 91.5 Events and Educational Activities . . . . . . . . . . . . . 10
2 Color Plates 11
3 Biology and Neural Modelling 273.1 Large Neural Network Simulations on Multiple Hardware
Platforms . . . . . . . . . . . . . . . . . . . . . . . . . . . 273.2 Neural Network Clustering and its Application in Remote
Sensing . . . . . . . . . . . . . . . . . . . . . . . . . . . . 293.3 Artificial Neural Networks for Modeling Airplane Pilot
Dynamics . . . . . . . . . . . . . . . . . . . . . . . . . . . 303.4 A Neural Network Model of the Olfactory Cortex and
Hippocampus . . . . . . . . . . . . . . . . . . . . . . . . . 323.5 Analysis of 3D Brain Data . . . . . . . . . . . . . . . . . . 34
4 Computational Electromagnetics 354.1 2D Computational Electromagnetics on the CM200 . . . . 35
5 Computational Fluid Dynamics 375.1 A Parallel CFD Project at C2M2 . . . . . . . . . . . . . . 375.2 Homogeneous and Heterogeneous Distributed CFD Com-
putations . . . . . . . . . . . . . . . . . . . . . . . . . . . 385.3 The NAS Parallel Benchmarks on a DEC Alpha Farm . . 395.4 Parallel Programming Models for Multi-block Flow Com-
putations . . . . . . . . . . . . . . . . . . . . . . . . . . . 405.5 Adapting a Regional Air Pollution Dispersion Model for
MasPar and CM200 . . . . . . . . . . . . . . . . . . . . . 415.6 Numerical Simulation of Fully Developed Turbulent Plane
Couette Flow . . . . . . . . . . . . . . . . . . . . . . . . . 455.7 Parallel Computing for Aircraft Design . . . . . . . . . . . 475.8 Solution of Compressible Flow Problems in Parallel with
Static Load Balancing . . . . . . . . . . . . . . . . . . . . 505.9 A Parallel Full Navier-Stokes Simulation of an Afterburner
at Volvo Aero Corporation . . . . . . . . . . . . . . . . . . 525.10 Parallel CFD on the IBM SP-2 . . . . . . . . . . . . . . . . 54
Contents 3

5.11 Supersonic Inviscid Flow Computations on Adaptive Un-structured Grids . . . . . . . . . . . . . . . . . . . . . . . 57
5.12 Numerical Computation of Hydrodynamics in FluidizedBeds . . . . . . . . . . . . . . . . . . . . . . . . . . . . . . 59
5.13 Consolidation of Concentrated Suspensions . . . . . . . . 605.14 Flutter Analysis of Two Dimensional Viscous Flow in
Turbomachines Using the Advection Upstream SplittingMethod (AUSM) . . . . . . . . . . . . . . . . . . . . . . . 62
6 Applications in Physics 676.1 An Universal Scaling Law for Atomic Diffusion in Con-
densed Matter . . . . . . . . . . . . . . . . . . . . . . . . 676.2 Atomic Kinetics and Dynamical Phason Disorder in a
Quasicrystal . . . . . . . . . . . . . . . . . . . . . . . . . . 706.3 Electric and Magnetic Non-Linear Properties Obtained
with Response Theory . . . . . . . . . . . . . . . . . . . . 736.4 Finite Element Modeling of Acoustic Emission . . . . . . 786.5 An Exact Absorbing Boundary Condition for 3D Thin
Structures . . . . . . . . . . . . . . . . . . . . . . . . . . . 796.6 The Continuation of Transient Data for a Hyperbolic Equa-
tion in a 3D Inhomogeneous Half-Space . . . . . . . . . . 806.7 Hypercycles versus Parasites in Spatial Models of the Ori-
gin of Life . . . . . . . . . . . . . . . . . . . . . . . . . . . 816.8 A Coupled Map Lattice Model of Self-Propelling Particles 826.9 Monte Carlo Studies of the Dynamics of Re-Entrant Ising
Spin Glasses . . . . . . . . . . . . . . . . . . . . . . . . . . 836.10 Code Porting and Cluster-Finding Experiences on the IBM
SP-2 and the CM200 . . . . . . . . . . . . . . . . . . . . . 886.11 Electronic Structure Calculations for the Physics and
Chemistry of Surfaces . . . . . . . . . . . . . . . . . . . . 916.12 Quantum Wavepacket Studies of Dynamical Processes at
Surfaces . . . . . . . . . . . . . . . . . . . . . . . . . . . . 946.13 First-Principles Modeling Defects in Semiconductors:
Oxygen in Silicon . . . . . . . . . . . . . . . . . . . . . . . 966.14 Fluctuations in Atomic Collision Cascades . . . . . . . . . 1016.15 Transport Simulation of Electrons Reflected Elastically
from Solids . . . . . . . . . . . . . . . . . . . . . . . . . . 1036.16 One-Group Radiation Transport Benchmarks for Aniso-
tropically Scattering Medium . . . . . . . . . . . . . . . . 1056.17 Modified Artificial Viscosity in Smooth Particle Hydrody-
namics on the CM200 . . . . . . . . . . . . . . . . . . . . 1066.18 Reduction of Impurity Scattering from Correlation of
Donors . . . . . . . . . . . . . . . . . . . . . . . . . . . . . 1076.19 A Monte Carlo Model for Radionuclide Transport in Frac-
tured Media . . . . . . . . . . . . . . . . . . . . . . . . . . 108
4 Contents

7 Applications in Geophysics 1117.1 Numerical Experiments on Gravitational Instability of
Geostructures . . . . . . . . . . . . . . . . . . . . . . . . . 1117.2 Molecular Dynamic Study of Melting of Earth’s Materials 1137.3 Finite Difference Modeling of Seismic Wave Propagation
in Heterogeneous Media . . . . . . . . . . . . . . . . . . . 115
8 Applications in Chemistry 1198.1 A Conformational Free Energy Landscape of ApApA from
Molecular Dynamics Simulations . . . . . . . . . . . . . . 1198.2 Dynamics of Hydrogen Atoms in Strong External Fields . 1208.3 Parallel Molecular Dynamics Simulations of DNA Systems 1218.4 Molecular Dynamics Simulation of a Poly(Ethylene Ox-
ide) Surface . . . . . . . . . . . . . . . . . . . . . . . . . . 1268.5 Molecular Dynamics Simulation of Ion Mobility in the
Crystalline Poly(Ethylene Oxide) Surface . . . . . . . . . 1278.6 An Integral Direct, Distributed-Data, Parallel MP2 Algo-
rithm . . . . . . . . . . . . . . . . . . . . . . . . . . . . . 1278.7 The Structure of the Blue Copper Proteins . . . . . . . . 1338.8 Ab Initio and DFT Investigations of Solution Tautomerism
of DNA Bases . . . . . . . . . . . . . . . . . . . . . . . . . 1358.9 Basis Set and Correlation Effects on Geometry of Octa-
hedral Second-Row Transition-Metal Complexes . . . . . . 1368.10 A First Principles Study of the Dehydroxylation of
2M1-Muscovite . . . . . . . . . . . . . . . . . . . . . . . . 138
9 Miscellaneous Projects 1419.1 Multi-Disciplinary Parallel Optimization . . . . . . . . . . 1419.2 Simulation and Prediction of Real and Artificial Financial
Systems . . . . . . . . . . . . . . . . . . . . . . . . . . . . 1439.3 Burgers’ Equation with Noisy Initial Data . . . . . . . . . 1449.4 PDC++ and Parade — C++ Class Library and Visualizer
for Data Parallel Programming . . . . . . . . . . . . . . . 145
Bibliography 147
Index 161
Contents 5

6 Contents

1 PDC – Paralleldatorcentrum
This fourth progress report of the Center for Parallel Computers (PDC)at the Royal Institute of Technology (KTH) covers the activities of thecenter from 1994 up until the end of June 1996. A brief overview of themost important activities at the center during this period follows in thissection. User projects are described in Chapters 3 through 9.
1.1 Background and Highlights
The Center was formed in January 1990 to act as a focal point andnational forum for research on and use of parallel computers. Our goalis to stimulate research and spread information on the use of parallelcomputers.
This is achieved by providing high-performance parallel computersand expertise on their use to the technical and scientific computing com-munity in Sweden.
The two years covered in this Progress Report has been a period ofgreat change and rapid development. During 1994 we upgraded our Con-nection Machine to a 16K CM200 and also installed our first IBM SP-2.We also moved both people and all hardware to new and renovated fa-cilities at KTH.
In 1995, the most important event was the HPDR decision to selectPDC for its major grant and the subsequent contract between HPDR
and KTH/PDC, signed on June 28 1995. The decision and contractfollowed after the evaluation, of PDC and other sites, by a committee ofinternational experts. The increased funding allowed us to substantiallyupgrade the SP-2 to 96 nodes and also acquire a mass storage system.To balance the expanded hardware base and increased responsibilitiesPDC has also hired more people.
So far, 1996 has been a period of consolidation and further expansionin hardware, resources and staff. Most notably, PDC has taken on thesystems support of the CRAY J932 owned by the KTH KALLSUP con-sortium. This arrangement is set up as a win-win arrangement whichequally benefits both KALLSUP and PDC users.
1.2 Organization of PDC
PDC has a board, a scientific council and a director. P. G. Hedstrom,Corporate Technical Director of Electrolux AB is chairman of the PDC
board, Professor S. Lennart Johnsson is chairman of the PDC scientificcouncil and Professor Bjorn Engquist is the PDC director. Furthermore,
PDC – Paralleldatorcentrum 7

there are 3 associate directors, 4 System Managers, 1 system engineer,2 program and application developers, 1 information officer and 2 secre-taries. Affiliated with PDC there are also 3 affiliated researchers.
Corp. Tech. Dir., P. G. Hedstrom Chairman, PDC BoardProf. S. Lennart Johnsson Chairman, Scientific CouncilProf. Bjorn Engquist Director
Fredrik Hedman Associate DirectorGert Svensson Associate Director
Dr. Per Oster Associate Director
Harald Barth System ManagerJonas Engstrom System ManagerJohan Ihren System ManagerLars Malinowsky System ManagerJohan Danielsson System EngineerPeter Carlsson Information Officer
Nils Jonsson Application SpecialistAnders Alund Application Specialist (part time)
Dr. Per Hammarlund Application ScientistDr. Erik Aurell ScientistDr. Mikhail Dzugotov Scientist
Berith Bodelsson SecretaryBritta Svensson Secretary
The associate directors each have a field of responsibility: Systems& Operations, Science & Customer Relations and Administration. Thesystem managers have specific primary and secondary systems assignedto them where they act as respectively responsible or back-up. Theyreport to the head for Systems & Operations. The program and ap-plication developers and information officer also have specific tasks andallocated to them. They report to the head of Science & CustomerRelations.
1.3 Cost of Operation and Staff
The operational cost, including staff and investments, has been coveredby the Swedish Council for High Performance Computing, HPDR, theRoyal Institute of Technology and the Swedish National Board for In-dustrial and Technical Development, NUTEK. A grant of 8 MSEK forthe budget year 93/94 and 7 MSEK for 94/95 was given by FRN to pur-chase a scalable MIMD-system. This grant was used to make the initialinvestment in SP-2 technology.
8 PDC – Paralleldatorcentrum

Operational costs94/95 (12 months) 95/96 (18 months)
NUTEK 400 kSEK HPDR 8 081 kSEKKTH 3 594 kSEK KTH 380 kSEK
Other 1 659 kSEK
Total 3 994 kSEK 10 120 kSEK
Investments94/95 (12 months) 95/96 (18 months)
FRN 15 879 kSEK HPDR 33 607 kSEKKTH 3 239 kSEK
Total 19 118 kSEK 33 607 kSEK
1.4 Hardware Resources
Networking
PDC is connected directly to SUNET via a dedicated FDDI connection.Internally, PDC has implemented a high-speed network infrastructureto support large-scale I/O and enable computational clusters of PDC
systems. A Netstar Gigarouter is the heart of the network, with a HiPPI
connection to large systems and FDDI connections to various networks.All large systems are connected to a HiPPI network (800 Mbit/s) viaNetstar HiPPI ClusterSwitch. Other systems, such as AFS file servers,are connected to a number of FDDI (100 Mbit/s) rings separated by aDigital Equipment FDDI GigaSwitch.
Current Hardware
• 96 node IBM SP-2, 80 T2 nodes, 16 wide nodes and 380 Gbyte useravailable disk. The peak performance is 267 Mflop/s per node giving apeak performance for the machine of 25.6 Gflop/s. Total of 18.5 Gbytememory.
• A CRAY J932 managed by PDC for the KALLSUP consortium at KTH.Peak 6.4 Gflop/s, total memory 8 Gbyte, total disk 150 Gbyte.
• Connection Machine CM200 with 16 384 processors, 2 Gbyte mem-ory and a 10 Gbyte DataVault. Scalable massively parallel SIMD-computer with data-parallel programming environment.
• High-end equipment for visualization. One SGI Onyx RE2 with twoR4400 CPUs and 640 Mbyte memory and three SGI Indigo R4000.
PDC – Paralleldatorcentrum 9

Mass storage
IBM 3494 Tape Library Dataserver with four IBM 3590 Magstar tapedrives. Can store up to 12 Tbyte of data. The current HSM system runson a the CRAY J932. HSM functionality is provided by Data MigrationFacility (DMF) from CRAY Research.
1.5 Events and Educational Activities
Throughout these two years PDC has arranged conferences, workshopsand events as well as several seminars on the use of parallel computers.The SP-2 and the Connection Machine has been used for courses in theM.Sc. programs at KTH, CTH and Hogskolan Gavle/Sandviken. SeeTables below.
Event Date
Conference on “Parallel Computing in Science and Industry”and Inauguration of 54 node SP-2 “Strindberg” 941215-16SP-2 Administrator Workshop 951218-19Nordic EUROPORT Conference 960229Inauguration of 96 node SP-2 “Strindberg” 960301Swisc96, Swedish Industrial Scientific Simulations 960530-31
Course Date Students
New Comp. Arch. for Numerical Calculationsa Jan. 94 16Programming of MPP Computers Mar. 94 23Parallel Computer Systems Spring 94 47Problem Solving Using Massively Parallel Computers Nov. 94 14Numerical Solution of Large Sparse Systemsa Nov. 94 11Introduction to Parallel Computing on the SP-2 Dec 94 23Introduction to Parallel Computing on the SP-2 May 95 17Introduction to Parallel Computing on the SP-2 May 95 21Parallel Computer Systems Spring 95 27Problem Solving Using Massively Parallel Computers Oct. 95 16Introduction to Parallel Computing on the SP-2 Oct. 95 15Introduction to Parallel Computing on the SP-2 Nov. 95 18Introduction to Parallel Computing on the SP-2 Nov. 95 18Introduction to Parallel Computing on the SP-2 Mar. 96 15Introduction to Parallel Computing on the SP-2 Apr. 96 6Introduction to Parallel Computing on the SP-2 May 96 15
Parallel programming in MPIb May 96 40Parallel Computer Systems Spring 96 34MPI Techniques for MD and MC Jun 96 19
aAt CTH.bAt Hogskolan Gavle/Sandviken.
10 PDC – Paralleldatorcentrum

2 Color Plates
Figure 2.1. Lattices before (left) andafter (right) cluster-finding. This sys-tem is what is typically generated andanalyzed by the Coffeepot program.(See Section 6.10 on page 88.)
Figure 2.2. Global oscillatory behav-ior induced in the excitatory networklayer by noise in a single (feedforward)inhibitory unit. Simulations are runon the CM200 with 32 × 32 networkunits in each of the three layers. Herethe activity color coded for all units inthe excitatory layer is displayed. Thisshows that spontaneous disinhibition(possibly caused by inhibitory neu-ronal random generators) can resultin synchronized oscillatory activity inthe excitatory layer. (See Section 3.4on page 32.)
100 ms 200 ms 300 ms 400 ms 500 ms
600 ms 700 ms 800 ms 900 ms 1000 ms
1100 ms 1200 ms 1300 ms 1400 ms 1500 ms
1600 ms 1700 ms 1800 ms 1900 ms 2000 ms −6.96
0
9.80
Color Plates 11

Figure 2.3. A contour map of theconformational free energy of theApApA trimer by using the reactioncoordinates R12 and R23. (See Sec-tion 8.1 on page 119.)
4
6
8
10
12 4
6
8
10
12
0
5
10
15
R12 (Å) R23 (Å)
Fre
e E
nerg
y (
kcal
/mol
)
Figure 2.4. This is an exampleof a Positron Emission Tomography(PET) image of a human brain. PET-images normally contains brain acti-vation calculated as regional cerebralmetabolism or regional cerebral bloodflow. (See Section 3.5 on page 34.)
12 Color Plates

Figure 2.5. An electromagnetic pulsestrikes a metallic cavity with a narrowopening of 1/40 of the diameter. Eventhough the opening is small a sub-stantial amount of the electromagneticpulse sneaks inside. The pictures showsthe amplitude of the magnetic field atthree different times. In the top pic-ture the pulse have propagated alonghalf the cavity. We can see how thefield leaks into the cavity and how thefield outside the cavity is scatteredby the metal. In the mid picture thefront of the pulse have just passedthe cavity and we can see some sur-face waves inside the cavity. Noticehow the scattered field in the pictureabove passes the outer boundary giv-ing rise only to small reflections. Thebottom picture shows that the fieldinside the cavity is of almost the sameamplitude as the original pulse. Thepossibility to simulate these phenom-ena is crucial to understand principlesimportant to constructing electronicequipment immune to external fields.(See Section 4.1 on page 35.)
Color Plates 13

6 h 18 h
30 h 42 h
Figure 2.6. This sequence shows a fictive radioactive release from the nuclear powerplant Ignalina in Lithuania. The release starts at 6 am on November 12, 1992 andcontinues with constant intensity for the entire 51 hour simulation. During this time alow pressure system over southern Scandinavia moves towards north, while decreasingin intensity. The four frames show a section of the full simulation domain with 12 hoursseparation starting 6 hours after the beginning of the release. Radioactivity is colorcoded with red for high air concentration and blue for low. The red arrows indicate winddirection with more “feathers” for higher wind speeds. (See Section 5.5 on page 41.)
14 Color Plates

Figure 2.7. A 3D view of a radioactive cloud from a fictive release at the Ignalinanuclear power plant in Lithuania. This shows the cloud at 6 am on November 13, 1992,which is 24 hours after the start of the release. The modeling domain is 241 by 241gridpoints at 22 km horizontal resolution and has 16 layers between the surface andabout 25 km. (See Section 5.5 on page 41.)
Color Plates 15

Figure 2.8. Pressure distributionaround an A-airfoil at 7.2 angle ofattack, Mach number = 0.15 andReynolds number per meter, Re/m= 2 000 000. Calculation made on 16IBM SP-2 processors, with a 512×128mesh, using Baldwin-Lomax turbu-lence model. (See Section 5.7 onpage 47.)
Figure 2.9. Pressure distribution onthe surface and isobars for a F5-wingat 0 angle of attack, M = 0.82 andRe/m = 3610 000. Calculation madeon 32 IBM SP-2 processors, with a192 × 40 × 48 mesh, using Baldwin-Lomax turbulence model. (See Sec-tion 5.7 on page 47.)
16 Color Plates

Figure 2.10. Pressure on the surfacefor an aircraft, with pylons, nacelle,etc. at 2.2 angle of attack, M = 0.8and Re/m = 11 160 000. The compu-tational mesh consists of 3.5 milliongrid points in 62 blocks and the com-putation was made on 32 IBM SP-2processors. The Granville turbulencemodel was used for this case, whichgives around 4500 floating point oper-ations per timestep and grid cell, orapproximately 2 · 1014 floating pointoperations to get a converged solution.(See Section 5.7 on page 47.)
Figure 2.11. The colors represent thepressure coefficient cp, proportional tothe static pressure p, on the surfaceof a Saab 2000 (blue=low p, red=highp). (See Section 5.8 on page 50.)
Color Plates 17

Figure 2.12. The gray surface is aniso-surface where the absolute velocityis zero and defines the recirculationzone of the afterburner where the flameis expected to stabilize. The structuresare color coded using axial velocity.(See Section 5.9 on page 52.)
Figure 2.13. This figure depictsthe flowfield downstream the after-burner. The streamlines are injectedat a thought fuel injection radius andare colored with Mach numbers. (SeeSection 5.9 on page 52.)
18 Color Plates

Figure 2.14. This figure gives a de-tailed picture of the flow around theflame holder of the afterburner. Thecolors represent static temperatureand the arrows indicate the local ve-locity of the fluid. (See Section 5.9 onpage 52.)
Figure 2.15. The picture shows thecomputed negative Cp on the ONERAM6 wing. This Euler solution wasobtained using a free stream Machnumber of 0.84 and the angle of at-tack was set to 3.06 degrees. On thesymmetry plane, pressure contours areplotted. The computation was per-formed on the IBM SP-2 using AVBP.(See Section 5.10 on page 54.)
Color Plates 19

Figure 2.16. As an illustration ofthe inherent capability of the AVBPprogram to treat realistic aerodynami-cal problems, a transonic flow about atwin engined Dassault Falcon jet planehas been computed. For the simula-tion a free stream Mach number of0.85 is assumed and the angle of at-tack is taken to be two degrees. Flowthrough conditions are imposed at theengines. Due to the symmetry of theflow, the numerical computations wereperformed using only one half of theaircraft geometry. The Euler solutionshow leeward side wing shocks and ashock at the top of the aircraft, bothphenomena typical for these flight con-ditions. The top picture shows the sur-face pressure and the bottom pictureshows pressure contours on the aircraftsurface with a shaded pressure field onthe symmetry plane. (See Section 5.10on page 54.)
20 Color Plates

Figure 2.17. A bubbling fluidizedbed can technically be described as acontainer in which the solid phase inthe form of closely packed particles(in this case silica sand with a meandiameter of 0.7 mm) is brought intomotion by an air flow inserted at thebottom of the container through anair distributor. The air tends to formbubbles which rise through the bed,but can also flow through the denseregions and shortcut between the bub-bles. The word fluidization comes fromthe fact that, at a gas flow rate withina certain range, the mixture becomesfluid-like. Fluidized beds have beenin industrial use for several decadesmainly as chemical reactors, solid fuelcombustors and dryers. These picturesshow how gas bubbles, defined as theregions where the gas concentration islarger than approximately 70%, riseup through the bed chaotically butwith a regularity in a statistical sense.(See Section 5.12 on page 59.)
Color Plates 21

0 0.2 0.4 0.6 0.8 1
0
0.1
0.2
0.3
0.4
0.5
0.6
0.7
0.8
0.9
1
max=0.558 min=0.001
0.446 0.474
0.502 0.53
0.5580
0.1
0.2
0.3
0.4
0.5
0 0.2 0.4 0.6 0.8 1
0
0.1
0.2
0.3
0.4
0.5
0.6
0.7
0.8
0.9
1
max=0.558 min=0.001
0.446
0.474
0.502
0.53
0.558
Figure 2.18. The pictures shows a numerically computed solution of a test problemin a closed quadratic container. The solution is almost stationary. The bottom wall ismoving to the right. The color contours represent the volume fraction of solid particles.The blue arrows show particle velocity scaled with the volume fraction of particles. Thered arrows show fluid velocity scaled with the volume fraction of fluid. (See Section 5.13on page 60.)
(a) Initial two-phase setup (b) Solid iron crystal (c) Calculated molten configuration
Figure 2.19. 3D view of MD computational cell containing 2048 atoms of iron (shownas spheres). Mirror reflections emphasize the 3D periodic boundary conditions. Themelting temperature of iron according to the embedded-atom method is about 7500 Kat a pressure of 3.3 million atmospheres at the boundary between the inner and outerEarth’s core. (See Section 7.2 on page 113.)
22 Color Plates

Figure 2.20. 3D view of a perfectMgO crystal (smaller spheres) pres-surized by argon (large red spheres).This setup was used to study recrys-tallization in the diamond anvil cell.Pressures in the directions parallel andperpendicular to the interface betweenAr and MgO are different. (See Sec-tion 7.2 on page 113.)
Figure 2.21. Left: A system ofscroll rings in a three dimensionalpartial differential equations modelon a 40 × 40 × 40 lattice. The dif-ferent colors, which correspond todifferent molecular species, indicatewhich molecular species is present atthe highest concentration on each lat-tice point. Right: A simplified pic-ture of a parasite infecting a writhed,sausage-shaped scroll wave cluster in afive-component hypercycle cellular au-tomata on a 128×128×128 lattice. Thecluster has a spiral cross section. Eachcolored cube corresponds to 8 × 8 × 8lattice points. The cubes are coloredaccording to the dominant species onthe corresponding lattice points, butthey are only displayed if less thanhalf of the lattice points are empty.All cubes where the parasite domi-nates are displayed in grey regardlessof the number of empty lattice points.The parasite, which here advances intothe core region at the central part ofthe cluster, will kill the cluster. (SeeSection 6.7 on page 81.)
Color Plates 23

Figure 2.22. Electron charge distri-bution for H chemisorbed on a (100)face of a slab of Ni atoms. The largeand small spheres represent the ion-cores of the Ni and H atoms, respec-tively. (See Section 6.11 on page 91.)
Figure 2.23. Examples of molecularsystems that are currently studied atPDC, employing the newly developedintegral direct, distributed-data par-allel MP2 implementation. Left: Thevan der Waals complex anthracene-Ar in its supposed minimum-energyconfiguration is displayed, i.e. withthe Ar atom “adsorbed” on the innerring of the catacondensed aromaticring system. Right: A subunit of theanti-cancer drug calicheamicin in itsconfiguration after the trigger reactionand ring closure. (See Section 8.6 onpage 127.)
24 Color Plates

Figure 2.24. The op-timized structure of[Cu(imidazole)2SCH3S(CH3)2]+
(left) compared to the crystalstructure of plastocyanin (right) [Gusset al., 1992]. The theoretical structurehas been optimized with the densityfunctional B3LYP method. This closesimilarity between the two structuresshow that the trigonal geometry ofthe copper ion is not enforced by theprotein [Malmstrom, 1994, Williams,1995], but is an effect of the intrinsicchemical properties of the copper ionand its ligands. (See Section 8.7 onpage 133.)
Figure 2.25. The optimized struc-ture (left) and the singly occupiedorbital (right) of [Cu(NH3)4]2+ inaccordance with the ligand-field the-ory, the structure is slightly distortedsquare planar and all the four ligandsfrom σ-bonds to the copper. (See Sec-tion 8.7 on page 133.)
Figure 2.26. The optimized trigonalstructure (left) and the singly-occupiedorbital (right) of [Cu(NH3)3SH]+.Two of the ammonia ligands formσ-bonds to the copper ion while theSH− ligand forms a π-bond to thecopper ion, which overlaps with two ofthe lobes of the Cu 3d orbital, therebyoccupying two ligand positions in asquare coordination. (See Section 8.7on page 133.)
Figure 2.27. Two optimized struc-tures of [Cu(NH3)2(SH)(SH2)]+. Thestructure on the left is distorted tetrag-onal and the structure on the right isthe trigonal. For this complex, thetrigonal structure is the most stable inaccordance with the structures foundin the crystals of the blue copper pro-teins. The energy difference betweenthe two structures is so low, however,that both structures may be occu-pied at ambient temperatures. (SeeSection 8.7 on page 133.)
Color Plates 25

AB
C
D
1.67
2.24
2.21
1.52
2.22
2.26
107
170
2.32
Figure 2.28. Interstitial oxygen, Oi, is shown on the left and the oxygen dimer, O2i
on the right, both in silicon. Symmetry axis lies along [100] and the O atoms are alignedalong [011]. All lengths in A. (See Section 6.13 on page 96.)
O
N
Si
140
140
1.651.64
1.691.82
2.54
NSiSi
Si
O O
Figure 2.29. Left: The core structure of the neutral Ni-O2i shallow thermal donordefect. The symmetry axis lies along [100] and the O atoms are aligned along [011]. Allbond lengths are in A. Right: The pseudo-wavefunction (× 100 a.u.) of the highestoccupied orbital of Ni-O2i. Note that it has little amplitude on N and is localizedon the Si radical. There are nodal surfaces lying between this atom and the O atomsdemonstrating anti-bonding behavior. (See Section 6.13 on page 96.)
26 Color Plates
3 Biology and Neural Modelling
3.1 Large Neural Network Simulations on Multiple HardwarePlatformsPer Hammarlund, Tomas WilhelmssonDepartment of Numerical Analysis and Computing Science, KTH
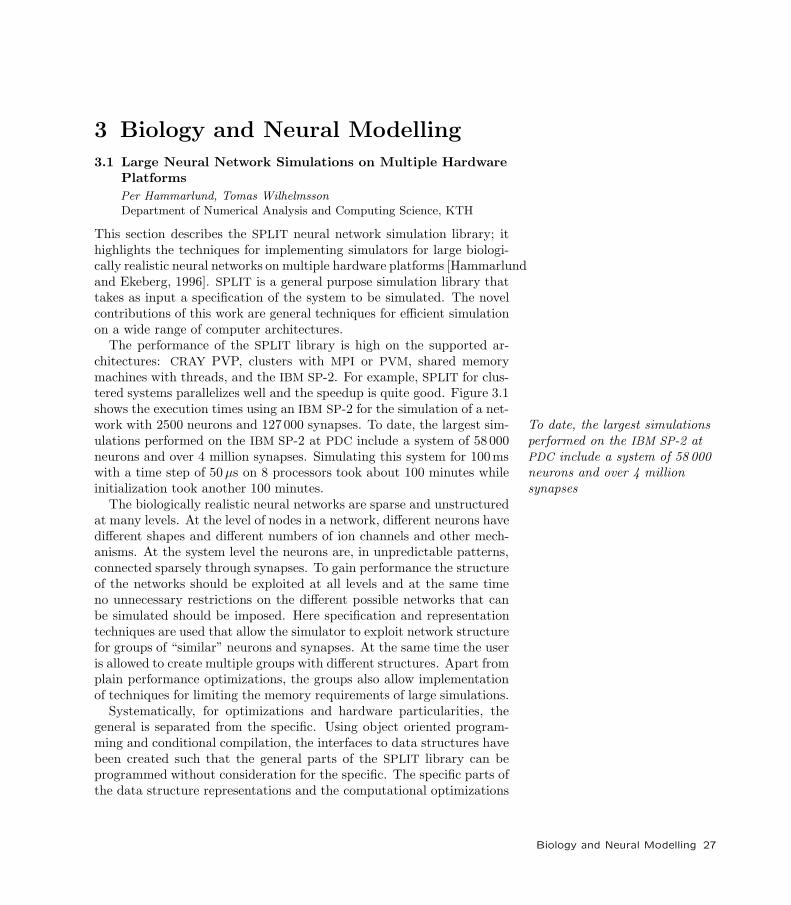
This section describes the SPLIT neural network simulation library; ithighlights the techniques for implementing simulators for large biologi-cally realistic neural networks on multiple hardware platforms [Hammarlundand Ekeberg, 1996]. SPLIT is a general purpose simulation library thattakes as input a specification of the system to be simulated. The novelcontributions of this work are general techniques for efficient simulationon a wide range of computer architectures.
The performance of the SPLIT library is high on the supported ar-chitectures: CRAY PVP, clusters with MPI or PVM, shared memorymachines with threads, and the IBM SP-2. For example, SPLIT for clus-tered systems parallelizes well and the speedup is quite good. Figure 3.1shows the execution times using an IBM SP-2 for the simulation of a net-work with 2500 neurons and 127000 synapses. To date, the largest sim- To date, the largest simulations
performed on the IBM SP-2 atPDC include a system of 58 000neurons and over 4 millionsynapses
ulations performed on the IBM SP-2 at PDC include a system of 58 000neurons and over 4 million synapses. Simulating this system for 100mswith a time step of 50 µs on 8 processors took about 100 minutes whileinitialization took another 100 minutes.
The biologically realistic neural networks are sparse and unstructuredat many levels. At the level of nodes in a network, different neurons havedifferent shapes and different numbers of ion channels and other mech-anisms. At the system level the neurons are, in unpredictable patterns,connected sparsely through synapses. To gain performance the structureof the networks should be exploited at all levels and at the same timeno unnecessary restrictions on the different possible networks that canbe simulated should be imposed. Here specification and representationtechniques are used that allow the simulator to exploit network structurefor groups of “similar” neurons and synapses. At the same time the useris allowed to create multiple groups with different structures. Apart fromplain performance optimizations, the groups also allow implementationof techniques for limiting the memory requirements of large simulations.
Systematically, for optimizations and hardware particularities, thegeneral is separated from the specific. Using object oriented program-ming and conditional compilation, the interfaces to data structures havebeen created such that the general parts of the SPLIT library can beprogrammed without consideration for the specific. The specific parts ofthe data structure representations and the computational optimizations
Biology and Neural Modelling 27

Figure 3.1. Performance of SPLITon IBM SP-2 when simulating a 2500neuron and 127 000 synapses network.
0 5 10 15 20 25 30 350
10
20
30
40
50
Number of processors
Exe
cutio
n tim
e (
min
utes
)
are completely hidden. The implementation of the SPLIT library findsThe implementation of theSPLIT library finds a balancebetween the convenience ofobject oriented programming ata high level and the necessity ofperformance oriented coding atthe low level.
a balance between the convenience of object oriented programming at ahigh level and the necessity of performance oriented coding at the lowlevel.
Using the techniques for separation of the general and specific, thelibrary executes on multiple hardware platforms. The library has thesame software interface on all platforms and a user is almost completelyunaware of the target architecture specifics. The internal organizationof SPLIT for shared and distributed memory systems is shown in Fig-ure 3.2. Supporting multiple platforms protects the user’s investmentin the specification of a large and complicated simulation network. Thesupported hardware platforms have different performance characteristicsand the simulation experiments have different requirements; a particu-lar simulation experiment can use the most suitable available computerarchitecture.
The shared memory parallel version achieves high utilization of theavailable processors by limiting the overhead from using locks to synchro-nize the execution and the distributed memory parallel version achievesscalability by minimizing the communication time through the use ofbuffers in the communication routines, and by exploiting the structure,synaptic connectivity and delays, of typical simulation neural networks.Three different communication algorithms have been developed for dis-tributed memory parallel machines. These communication algorithmshave different characteristics and efficiently support a wide range of sim-ulated systems and parallel systems.
28 Biology and Neural Modelling

Figure 3.2. The internal organizationof SPLIT for shared memory anddistributed memory systems (clusters).The parallel split sim object takescare of the parallelism on distributedmemory systems.
split_sim
split
split
split_sim split_sim
parallel_split_simSingle-processor
Master
Slave Slave
3.2 Neural Network Clustering and its Application in RemoteSensing
Bjorn LevinSANS, Numerical Analysis and Computing Science, KTH
It has previously been observed (see, e.g. [Lansner, 1991]) that a recur-rent Bayesian neural network [Lansner and Ekeberg, 1989] of the kinddeveloped within the SANS project is capable of showing a clustering be-havior. This is manifested in that training patterns sufficiently similar toeach other create a common fix-point for the relaxation. In other words,when the relaxation is started in the trained network, with a pattern rel-atively close to either of the two training patterns, the result will in bothcases be the very same output pattern. For this property to be practicallyuseful, however, a method is needed of controlling the degree of similar-ity required for the clustering to occur. During the spring, summer andearly autumn of 1994, the CM200 at KTH was used to perform a series ofexperiments evaluating ten different schemes of exercising such control.The basis of the implementation of the neural network algorithm camefrom the investigations into SIMD-parallelization reported in earlier PDC
annual reports. The approach used in the new clustering experimentswas to assign a virtual processor to each combination of starting patternand value of the clustering parameter governing the similarity requiredfor forming the clusters. When higher resolution than the number ofprocessors was desired for the clustering parameter an automaticallyactivated interval bisection scheme was implemented. Regarding the re-sults, a strong advantage of three of the methods was observed. Withthe added motivation of being developed from an intuitive assumptionof disturbances during learning, one of the schemes stood out as a clearwinner. The underlying idea in this scheme is that, during training, thepatterns occasionally get displayed simultaneously and then activate theunion of units that would have been activated by each of the patternstaken by itself. The resulting clustering is by necessity somewhat noisybut with clear collection of the strong clusters.
Using the improved clustering, the investigations into the interpre-tation of satellite images were resumed during the autumn of 1994. A
Biology and Neural Modelling 29

new set of images was acquired, including a verified ground-truth andreference interpretation using a more conventional automated method.The two methods compared evenly regarding the reliability of the re-sulting classifications. However, it should then be noted that the moreconventional method requires the manual selection of training areas andthat the neural network method shows distinctly more promising resultswhen part of the data of a measuring point is missing.
The results of both the above investigations are reported in the doc-toral thesis by Levin [Levin, 1995].
3.3 Artificial Neural Networks for Modeling Airplane PilotDynamics
Magnus RosenlundSANS, Numerical Analysis and Computing Science, KTH
Artificial neural networks (ANN) seem to be more flexible and extendiblethan classical PID-regulators as models of airplane pilot dynamics. Thepurpose of modeling is multiple. At present the models are used, amongother things, to estimate the flying abilities of different aircrafts. In thefuture the goal would be more automatic and better flying. Initially theinterest is in simulating the dynamics of an airplane pilot in a landingsituation and this task is accomplished by training an ANN with realflight data from several landings with a well known Swedish fighter air-craft. The problem that arises can be put as follows: Given a certainflight situation at times t−1, t−2, . . . how will the pilot react at time t?The object would then be to use the ANN to predict the pilots behaviori.e. commands, from a time history of events that may have influencedhim. The methods applied have mainly been developed at SANS underthe guidance of Dr Anders Lansner and uses a Bayesian (probabilistictype) neural network with data represented using localized RBF-typefunctions. During these simulations it is common to partition the datainto two sets called the training-data and the test-data. The ANN isthen trained with the training-data, an operation making use of massivecomputer power since the amount of both data and processing becomesextensive by necessity. Now the ANN is used in purely feedforward style(no relaxation) to predict new values from training-data and test-data.The reason for this working scheme is manifold, but enables checking ofthe principal feature of interest, namely the ANN’s ability to predict wellfrom previously unseen data. Figures 3.3 and 3.4 show an example ofsimulation results (aileron angle) from a session using as training-data aset consisting of 21 landings and test-data consisting of one. Each graphregard either training-data or test-data, and represent one landing (ran-domly chosen in the case of training-data) in unchanged condition andthe ANN’s prediction of the same.
30 Biology and Neural Modelling

Figure 3.3. Training data.
0 50 100 150 200 250 300 350 400 450 500−3
−2
−1
0
1
2
3
samplenumber
norm
aliz
ed a
ilero
n an
gle
− : unchanged, + : predicted
Figure 3.4. Test data.
0 100 200 300 400 500 600−3
−2
−1
0
1
2
3
samplenumber
norm
aliz
ed a
ilero
n an
gle
− : unchanged, + : predicted
Biology and Neural Modelling 31

Figure 3.5. The three layered net-work model used, mimicking the struc-ture of the hippocampus or the olfac-tory cortex. The top layer consists ofinhibitory “feedforward interneurons”,the middle layer of excitatory “pyra-midal cells”, and the bottom layerconsists of inhibitory “feedback in-terneurons”. Connections within thenetwork are shown for the center frontmost unit of each layer. Excitatory (as-sociative) connections are long rangeand sparse while inhibitory connec-tions are local. Spontaneously activeunits are indicated. The model areacorresponds to a 10× 10mm square ofthe hippocampus of a rat.
Excitatory connections
Feedback
layer
Feedforwardinhibitory
layerinhibitory
Excitatory
Inhibitory connections
layer
3.4 A Neural Network Model of the Olfactory Cortex andHippocampus
Tomas Wilhelmsson, Hans LiljenstromSANS, Numerical Analysis and Computing Science, KTH
We have implemented a model of the olfactory cortex, the “odor brain”,for large-scale simulations on the CM200 [Wilhelmsson, 1995]. Thismodel is now being modified to fit data for the hippocampus, a brainstructure associated with learning and memory. The objective is to in-vestigate the biological significance of the complex neurodynamics of acortical structure, in particular with respect to perception, learning andassociative memory [Liljenstrom, 1995].
The model complexity lies between that of abstract Hopfield nets andmore biologically detailed simulations with spiking, compartmentizednetwork units. Network units correspond to populations of cells (neu-rons) with a continuous (sigmoid) input–output relation, describing pulsedensity characteristics. The organization and connectivity of the modelis illustrated in Figure 3.5. Connection weights are adaptive and underneuromodulatory control to allow for learning and associative memoryto be studied. In the current simulations, we simulate a 10 × 10mmWe simulate a 10× 10mm
square area of the hippocampusof a rat
square area of the hippocampus of a rat.Previous simulations, using workstations, have shown that this model
is capable of reproducing the essential characteristics of experimentally
32 Biology and Neural Modelling
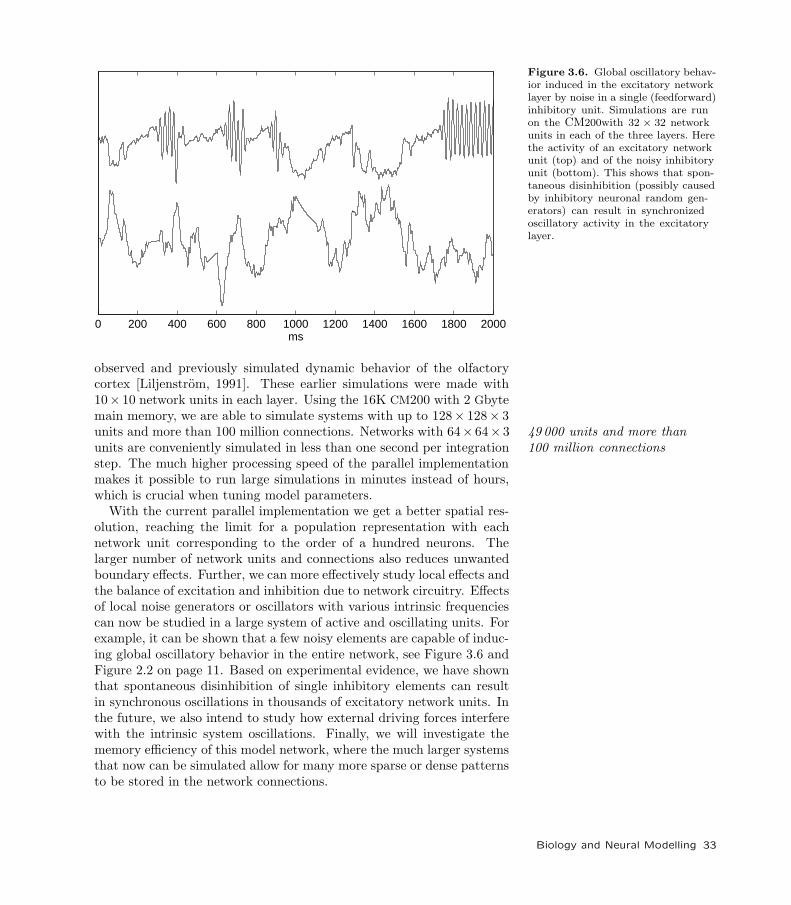
Figure 3.6. Global oscillatory behav-ior induced in the excitatory networklayer by noise in a single (feedforward)inhibitory unit. Simulations are runon the CM200with 32 × 32 networkunits in each of the three layers. Herethe activity of an excitatory networkunit (top) and of the noisy inhibitoryunit (bottom). This shows that spon-taneous disinhibition (possibly causedby inhibitory neuronal random gen-erators) can result in synchronizedoscillatory activity in the excitatorylayer.
0 200 400 600 800 1000 1200 1400 1600 1800 2000ms
observed and previously simulated dynamic behavior of the olfactorycortex [Liljenstrom, 1991]. These earlier simulations were made with10× 10 network units in each layer. Using the 16K CM200 with 2 Gbytemain memory, we are able to simulate systems with up to 128× 128× 3units and more than 100 million connections. Networks with 64× 64× 3 49 000 units and more than
100 million connectionsunits are conveniently simulated in less than one second per integrationstep. The much higher processing speed of the parallel implementationmakes it possible to run large simulations in minutes instead of hours,which is crucial when tuning model parameters.
With the current parallel implementation we get a better spatial res-olution, reaching the limit for a population representation with eachnetwork unit corresponding to the order of a hundred neurons. Thelarger number of network units and connections also reduces unwantedboundary effects. Further, we can more effectively study local effects andthe balance of excitation and inhibition due to network circuitry. Effectsof local noise generators or oscillators with various intrinsic frequenciescan now be studied in a large system of active and oscillating units. Forexample, it can be shown that a few noisy elements are capable of induc-ing global oscillatory behavior in the entire network, see Figure 3.6 andFigure 2.2 on page 11. Based on experimental evidence, we have shownthat spontaneous disinhibition of single inhibitory elements can resultin synchronous oscillations in thousands of excitatory network units. Inthe future, we also intend to study how external driving forces interferewith the intrinsic system oscillations. Finally, we will investigate thememory efficiency of this model network, where the much larger systemsthat now can be simulated allow for many more sparse or dense patternsto be stored in the network connections.
Biology and Neural Modelling 33

3.5 Analysis of 3D Brain Data
Sebastian AkermanDepartment of Neuroscience, Karolinska Institutet
Functional brain-imaging methods, such as Positron Emission Tomogra-phy (PET) used for measurements of the regional cerebral metabolismor the regional cerebral blood flow, sample data from more than 125 000parts of the brain, see Figure 2.4 on page 12. The PET-technique suf-fers from low signal to noise ratio (SNR) in investigations of humansubjects. The abundant noise in PET images calls for thorough investi-gations on noise behavior. Performing noise simulations on images fromPET require computations for a massive amount of data that can onlyComputations for a massive
amount of data that can only beaccomplished by highperformance computers
be accomplished by high performance computers, like the CM200.We have performed a series of simulations to study the effects of noise
on different detection schemes to be used in the analysis of PET images.By simulating 1000 re-runs of the same experiment using distributiondata from a group of human subjects in the control state, i.e. a state inwhich the brain is not engaged in a particular task, it was possible togenerate empirical distributions of false positive activation events.
The simulations have been repeated for different image subtractionsto investigate the effect of physiological noise. Comparing the resultof the original simulation of the physical noise, i.e. noise caused by theimaging technique, with the simulation of physiological noise and normaltest situations provide hints on how to set thresholds in our normal testimages as to achieve a certain probability for false positive activations.
The simulations were done in several steps. First the CM200 wasused to investigate the spatial 3D autocorrelation function in a sampleof regional cerebral blood flow images. This function was then usedto generate a 3D filter that imposes the found autocorrelation in sub-sequent simulated images. Finally, to get the desired accuracy in theestimations, tens of thousands of randomly generated images having thecorrect statistical properties were analyzed and false positive events wererecorded. In each such generated image around 1 000000 values mim-icking measurements of biochemical and physiological variables in thebrain are generated simultaneously, making the task very well suited foranalysis by data-parallel computing.
FFT-techniques were used to calculate autocorrelations and filters forthe sample generation phase. For the wide autocorrelation functions ofthe physiological noise and tested activation FFT-based filtering provedessential for efficient generation of the numerous samples needed in thesimulations.
Future simulation include another simulation run for a new PET-camera with higher resolution as well as simulation of overlapping activa-tion clusters from different test groups. Overlapping clusters are definedas groups of clustered activations from different images that have one ormore points of activation at corresponding positions.
34 Biology and Neural Modelling

4 Computational Electromagnetics
4.1 2D Computational Electromagnetics on the CM200
Ulf Andersson, Gunnar LedfeltCenter for Computational Mathematics and Mechanics, KTH
Computational Electromagnetics (CEM) has recently become a field ofsignificant interest. The reason for this is that the understanding ofelectromagnetic phenomena becomes crucial as electronic devices becomemore complicated and integrated and hence more vulnerable to externalfields. A striking example of this are the restrictions on the use of cellularphones in airplanes.
As even our daily life becomes more dependent on electronics theissue of electromagnetic compatibility, i.e. how to avoid undesired inter-ferences, is ever more important. Who will buy a car if it is known tolose control close to radio transmitters?
Today most of the data in electromagnetic compatibility comes frommeasurements and experiments but it is desirable to use numerical meth-ods to supplement or replace these costly experiments. The computa-tional burden of simulating the electromagnetic phenomena importantto these issues is very heavy. Only computers with Gbytes of memory Only computers with Gbytes of
memory and Gflop/sperformance are capable ofsolving realistic problems
and Gflop/s performance are capable of solving realistic problems.The analysis of wave propagation can be carried out in the time do-
main or in the frequency domain. In the area of electromagnetic com-patibility there is a great potential for time domain methods such asthe method presented here. If the frequency response is still desiredthe results of a transient calculation can be postprocessed by a Fouriertransform giving results for multiple frequencies.
Time integration with explicit methods is well suited to massivelydata-parallel computers since the PDE is a model for local interaction.When discretized by a structured (finite difference or finite volume) grid,the data can be mapped to the CM architecture and requires communi-cation only between nearest neighbors. Indeed one of the code variantsruns at almost 50% peak speed of the CM200.
Another benefit of time-domain techniques in CEM is that they cantake advantage of the software technology developed for ComputationalFluid Dynamics (CFD). The Maxwell equations (see below) are a hyper-bolic system of equations just like the Euler equations of fluid dynamics.It is therefore possible to take algorithms developed for the Euler equa-tions and use them to solve (4.1).
Computational Electromagnetics 35

For a transverse electric field in an isotropic, conducting medium in2D the Maxwell equations can be written as
∂∂tEx = 1
ε∂∂y Hz − σ
ε Ex
∂∂tEy = −1
ε∂∂xHz − σ
ε Ey
∂∂tHz = −1
µ∂∂xEy + 1
µ∂∂y Ex
(4.1)
where E = (Ex, Ey, 0)T is the electric field, H = (0, 0, Hz)T is the mag-netic field, σ is the conductivity, ε is the permittivity and µ is the per-meability.
We have developed a Finite Volume method based on central differ-ences and time discretization with a three stage Runge-Kutta method.This is second order accurate in both space and time for regular grids.The code has been tested on a series of cases and compared with otherapproaches in a European CEM project [Andersson and Ledfelt, 1995].
With outer boundary conditions simulating conducting walls, model-ing e.g. the field inside a metal container, the code runs at an astonishingThe code runs at an astonishing
speed of 2.5 Gflop/s speed of 2.5 Gflop/s. But in exterior problems where there is no physicalouter boundary the computational domain must be truncated. The infi-nite exterior of the computational domain is simulated by an AbsorbingBoundary Condition (ABC) which must be transparent for waves prop-agating towards the boundary from within. At the same time the ABCmust allow waves to enter the computational domain. This is achievedby modifying the Maxwell equations near the outer boundary and is de-scribed in detail in [Gradin and Ledfelt, 1995]. Using an ABC reducesthe performance of the code by a factor five mainly due to the implemen-tation of the source term. We estimate that this could be substantiallyimproved by a more careful implementation of the ABC.
The FLOP/s-rates are taken from calculations with 4096× 2048 cellsin single precision which is the maximum problem size that fits into the2 Gbyte primary memory of the CM200. For every test case so far singleprecision has proven to be sufficient.
Figure 2.5 on page 13 shows an electromagnetic pulse that strikes acavity with a thin slit. The main question is how strong the field will beinside the cavity. The opening in the cavity must be sufficiently resolvedin order to capture the physics and guarantee that the numerical methodpredicts a correct solution.
36 Computational Electromagnetics

5 Computational Fluid Dynamics
5.1 A Parallel CFD Project at C2M2
Magnus BergmanCenter for Computational Mathematics and Mechanics, KTH
The C2M2 project on Parallel CFD was supported from its start in 1990-91 by the NUTEK Super- and Parallel Computing Program. During thetwo first years the work was mainly directed to the efficient data-parallelimplementations of multi-block flow solvers using the PDC ConnectionMachine CM200 as main target architecture. This work [Sawley andBergman, 1994] has been widely published and still continues at EPFL
as described in Section 5.4.During 1993-94 work has been focused on the use of workstation farms
with fast network switches for industrial multi-block CFD computations.The work has been supported by FOA and DEC who contributed witha workstation farm consisting of three 133MHz DEC Alpha with FDDI
interface and a 3.6 Gbit/s DEC GIGAswitch. The CMB code has beenrewritten using the PVM message passing library to parallelize on farmsof workstations and tightly coupled MIMD machines [Bergman and Saw-ley, 1993]. A software layer, CCL, has been developed [Fristedt andBergman, 1994] that gives portability between different machines andefficiency using native communication libraries. An efficient schedulerfor load balancing of these multi-block meshes for MIMD machines hasalso been developed [Ozen, 1993, Ljungquist et al., 1993]. The work con-tinues as two different projects, one ESPRIT funded project extendingthe software to handle 3D multi-block meshes, and one project in col-laboration with Uppsala University to develop a dynamic load-balancingprocedure for MIMD machines. Furthermore many different tools for theusage of workstation farms has been installed and tested. For examplethe LSF software that can distribute UNIX commands to idling resourceson the farm.
The usage of workstation farms has been followed with interest fromSwedish industry. In particular from ABB Corporate Research, VolvoData and Saab Aerospace for which we have presented several bench-marks together with some measurements of the throughput of the GI-GAswitch. In particular of interest is the maximum channel bandwidth,the network latency and the total throughput of the system. A largeeffort has been made in reducing the latency since it was found to be themost important factor in reducing performance. This work was quitesuccessful and the low latency routines are now being implemented intothe CCL library.
Computational Fluid Dynamics 37

Table 5.1. A farm of Sun 10 work-stations with Ethernet connection run-ning a test case of a mesh around themid section of a car with 16 equallysized blocks. The number of worksta-tions ranged from 1 to 16 and gridsranging from one thousand to one mil-lion points. High efficiencies was ob-tained except for the smaller grid sys-tems. Performances above 100 Mflop/susing 16 Sun 10 workstations was alsoobtained.
N log2(N) 1 2 4 8 16
1024 10 1.27 2.05 3.75 6.1 9.692048 11 2.18 3.68 7.33 13.0 21.64096 12 3.55 6.70 12.9 24.3 42.6
16384 13 5.13 10.2 20.2 39.6 72.465536 14 6.3 12.6 25.0 49.2 95.4
262144 15 4.55 13.7 27.6 56.0 100.11048576 16 14.5 56.4 101.8
5.2 Homogeneous and Heterogeneous Distributed CFD
Computations
Magnus Bergman, Erland FristedtCenter for Computational Mathematics and Mechanics, KTHMark SawleyIMHEF, EPFL, Switzerland
The interest of the work here is to use networked computers to solvelarge CFD problems. The study includes both the usage of identicalworkstations (homogeneous farm) and a mixture of different computerarchitectures (heterogeneous farm). The former work, described in detailin [Bergman and Sawley, 1993], concerns the usage of Sun 10 worksta-tions with Ethernet connection. As a test case a mesh around the midsection of a car with 16 equally sized blocks was used. A large number ofruns was made i order to get the full behavior of the workstation farm asa computational resource. The number of workstations ranged from 1 to16 and grids ranging from one thousand to one million points. This largenumber of test cases gives the possibility to study effects like Amdahl’sand Gustafsson’s laws and so called super-linear speed-ups. High effi-ciencies was obtained except for the smaller grid systems. Performancesabove 100 Mflop/s using 16 Sun 10 workstations was also obtained. SeeTable 5.1.
Furthermore a series of heterogeneous CFD computations was done us-ing of different workstations (SGI, DEC Alpha, HP 700 series) togetherwith a vector computer, a single processor CRAY Y-MP. As a test casea mesh around a wing profile with an extended flap was used. The meshcompromised of 16 blocks of different sizes ranging from some hundredpoints to 8 000 points. Load balancing was done by means of a simplealgorithm that sorts the machines in order of processing power (perfor-mance was tested by running a test problem with 4 000 grid points). Theblocks are then assigned to processing nodes starting with the largestblock until each machine exceeds its relative performance. Several testruns during different times of the day showed that the computationaltime could be reduced by a factor of 2 compared to a single proces-sor CRAY Y-MP. An extensive description of the work can be found in[Bergman and Sawley, 1993].
38 Computational Fluid Dynamics

Table 5.2. Timings of a PVM ver-sion of the NAS benchmarks runningon a cluster consisting of four DECAlpha model 500 (200 MHz) and aGIGAswitch.
Kernel Total time Communication Total timeAlpha farm time CRAY Y-MP
The EP Kernel 414 NA 126A 3D Multigrid Solver 212 20 22Conjugate Gradient 69 15 12Integer Sort 89 45 113D FFT 238 NA 29
5.3 The NAS Parallel Benchmarks on a DEC Alpha Farm
Erland Fristedt, Magnus BergmanCenter for Computational Mathematics and Mechanics, KTHMagnus PerssonDigital Equipment, Sweden
The NAS parallel benchmarks are a set of applications that emulatesreal CFD-codes. The NAS benchmarks includes both data-movementand computational characteristics and has therefore been widely usedfor benchmarking of parallel machines. The work below is an effort inorder to test workstation farms for a wider range of CFD applications.The work was started by Anders Alund at ITM who ported the NAS
benchmarks from the serial and Intel versions [Alund and Sunderam,1993] to PVM (Parallel Virtual Machine) message-passing library. Thisversion was tested using four DEC Alpha model 500 (200MHz) farm anda GIGAswitch.
The NAS benchmarks was implemented with a modified PVM, whichhave better performance then the original version. Both latency andbandwidth has improved, latency has decreased from 1.5 to less than 1millisecond and the bandwidth has increased from 15Mbit/s to about70Mbit/s on DEC Alpha model 500. The observed timings on Alpha’sare compared with other workstation farms and a CRAY Y-MP using anidentical program. See Table 5.2.
The performance of this applications are rather disappointing. Thisis described in [Fristedt and Bergman, 1994]. The communication timeis too large compared with total time which will reduce the scalabilityof the codes. This is mainly due to the fact that communication inthis benchmark is frequent and relatively low-volume meaning that thenetwork latency is determining the achieved performance and scalability.It is important observations that this version of the NAS benchmarkwas developed for the CRAY computer leading to bad performance onthe workstation also on the nonparallel parts. We have tried the KAPpreprocessing tools on the DEC Alpha in order to adapt the code to thesize of the cache, etc. This did not improve the performance and we willcontinue to investigate this in order to find an appropriate tools for coderearrangement and optimization.
Computational Fluid Dynamics 39

One critical point is that PVM uses standard network protocol (i.e.TCP/UDP/IP); these are unsuitable for scalable parallel computing. Wehave tested latency and bandwidth using standard network protocolsgiving latencies of 256 microseconds and maximum bandwidth of 96Mbit/s. Further optimization of the PVM software is therefore necessaryto reach high performances of the NAS benchmarks on workstation farms.A more complete report on the testing will be given at the end of theDEC/FOA/KTH project [Fristedt and Bergman, 1994].
5.4 Parallel Programming Models for Multi-block FlowComputations
Mark Sawley, Jon TegnerIMHEF, EPFL, Switzerland
Block structured computational meshes exhibit both a coarse-grain par-allelism at the block level, and a fine-grain parallelism at the mesh pointlevel. For efficient parallel computation, the granularity of the problemneeds to be matched to that of the parallel computer employed.
In the present work, the time-dependent Euler equations for invis-cid, compressible flow in 2D geometries are resolved. The equationsare discretized in space using a finite volume formulation, using cen-tral differencing with added artificial dissipation. An explicit five-stageRunge-Kutta scheme is used to perform the time integration. To en-hance convergence to the required steady state, a local time steppingtechnique is employed.
Initial studies using the parallel computer systems at PDC employedfine grain parallelism, which is appropriate for both the CM200 and MP-1systems. It was found that the data parallel programming model pro-vides a convenient means to resolve the flow equations. In addition, highperformance levels and good scalability with the number of processing el-ements (PEs) employed can be achieved. Multi-block flow computationshave been undertaken using a serial data-parallel multi-block method,whereby individual blocks are treated in a sequential manner, the solu-tion in each block being computed using a data parallel approach [Sawleyand Tegner, 1994].
For the IBM SP-2 system, which has a much smaller number of pro-cessors, coarse-grain parallelism is more appropriate. For multi-blockcomputations, this is implemented in a straightforward manner usingwhat is sometimes termed a “control parallel” method. Here, the flowin different blocks is computed in an independent manner on differentprocessors. The necessary exchange of data between the neighbouringblocks (block connectivity) is undertaken using message passing. Boththe PVM and MPI libraries have been implemented in the code for com-putation on the SP-2.
40 Computational Fluid Dynamics
Apart from the level of granularity, there is a number of other differ-ences in the above two approaches [Sawley and Tegner, 1995]. Firstly,while Fortran 90 based languages were necessary to run the data parallelcode on the CM200 and MP-1 systems, Fortran 77 was employed for thecontrol parallel code on the SP-2. Adhering to these language standardshas shown to provide good code portability: the data parallel code hasbeen run with only minor modifications on CM5 and CRAY T3D sys-tems, while the control parallel code has been used on an Intel Paragon,CRAY T3D, NEC Cenju-3 and workstation clusters. Secondly, load bal-ancing issues differ for the two approaches. For the data parallel methodit is desirable to have the number of mesh cells (plus “ghost cells”) ineach block a multiple of the number of PEs. Since the blocks are treatedin a sequential manner, an equal number of mesh cells in each blockis not required. For the control parallel method, for which the blocksare computed in parallel, the number of cells in each block should beequal. This may in some cases impose considerable constraints on meshgeneration. Finally, the communication is implicit for the data parallelmethod. While the explicit message passing used for the control parallelmethod provides more programmer control, this is generally not requiredfor multi-block flow computations, and leads in a greater probability ofcoding errors.
Timing results have shown that high performance levels can be ob-tained on the SP-2 using the control parallel method. This is a conse-quence of both a high single processor performance and the relativelylow level of communication required for block connectivity. Due to thislow level of communication, the performance of the flow solver has beenfound to scale linearly with the number of processors used on the SP-2system at PDC.
5.5 Adapting a Regional Air Pollution Dispersion Model forMasPar and CM200Tomas WilhelmssonDepartment of Numerical Analysis and Computing Science, KTHJoakim Langner, Lennart RobertsonSwedish Meteorological and Hydrological Institute, Norrkoping
A large part of the services generated at the Swedish Meteorologicaland Hydrological Institute (SMHI) is based on the output from nu-merical models. The single most important model is the numericalweather prediction (NWP) model HIRLAM (High Resolution LimitedArea Model) [Kallberg, 1989] which generates routine forecasts over Eu-rope of up to 48 hours. Several other numerical models are closely linkedto HIRLAM. One of these is the MATCH model (Mesoscale AtmosphericTransport and Chemistry) [Persson and Robertson, 1990]. MATCH cangenerate distributions and depositions of various pollutants based on me-teorological data from e.g. HIRLAM. Computing resources put a limit on
Computational Fluid Dynamics 41

the amount of complexity that can be included in these types of mod-els. It is therefore of great interest for SMHI to explore the possibilitiesof parallel computer architectures which are now becoming available inorder to make increasing computing resources accessible in the future.
MATCH is an Eulerian atmospheric dispersion model. The basicmodel treats the physical processes (horizontal and vertical advectionand diffusion) governing the atmospheric transport of an arbitrary num-ber of chemical components. Depending on the application, differentmodules describing emissions, chemical interactions, and removal can beadded to the basic model. MATCH is an off-line model meaning that itreads the meteorological data necessary to drive the transport and othermodules from external archives. The model is coded to be very flexiblewith respect to the geometry of the input data and caters for the mostcommonly used horizontal and vertical grid structures. A typical gridUsed in an operational
emergency response application used in an operational emergency response application of the model isshown in Figure 5.1.
At present the horizontal advection is calculated using a fourth or-der integrated flux scheme [Bott, 1989a, Bott, 1989b]. This schemeutilizes polynomial fitting between neighboring gridpoints of a discreteintegrated concentration field in order to simulate the advective fluxesthrough the boundaries of adjacent grid boxes. It is a positive definitemass conserving scheme with low numerical diffusion which is necessaryin air pollution applications. For the vertical advection a second orderversion of the scheme is used.
Adapting MATCH for parallel processing
The MATCH model code available at the beginning of the project waswritten in Fortran77 and used a linear memory model. It was firstrecoded (still in Fortran 77) following conventions for scalable program-ming [Thi, 1993]. This made the code more portable to other kinds ofcomputer architectures as well.
Since the parallel computers readily available for the project were ofSIMD type (Connection Machine CM200 and MasPar MP-1 and MP-2)the adaption of the code was done using the data parallel program-ming model. The strategy chosen was to use the MasPar supplied VAST
translator which vectorizes Fortran 77 DO-loops to Fortran 90 array syn-tax. Major parts of the translated code ran efficiently from the begin-Major parts of the translated
code ran efficiently from thebeginning
ning. However, in some cases compiler directives and restructuring of theFortran77 code was necessary in order to generate efficient Fortran77code. The MasPar VAST translator gave much better code than TMC’sCMAX translator so it was used also for generating code for CM200.
The horizontal dimensions of the model is mapped to the processorsorganized in a two-dimensional grid thereby keeping the vertical dimen-sion locally in each processor. Both parallel platforms showed somepeculiar behavior with regard to the mapping of arrays onto the pro-
42 Computational Fluid Dynamics

Figure 5.1. Modeling domain usedin an operational emergency responseapplication. The grid is 68 by 108gridpoints at 55 km horizontal resolu-tion and is a part of the operationalHIRLAM grid at SMHI.
cessors. The CM200 compiler required that the dimension kept locallyin each processor should come first in the array declaration in order togenerate efficient code. A set of awk scripts was used to rotate all arrayindices when compiling for the CM200. The MasPar compiler on theother hand, generated a code that was twice as fast if all array dimen-sions where fixed at compile time. This problem was solved by includinga file with parameter statements for all array dimensions when compilingfor MP-1 and MP-2. This of course had the disadvantage that recom-piling was necessary when changing the size of the model domain. TheCM200 on the other hand ran efficiently with array bounds dynamicallyset at runtime.
Computational Fluid Dynamics 43
Adaption of the GRIB I/O library
Input meteorological data and output fields are stored in a binary packedformat called GRIB (Gridded Binary). This format contains, besidesthe data field, packing parameters and information about the the geom-etry of the data (projection, resolution etc. ). GRIB is a standard usedin meteorological applications and a full implementation of the modeltherefore requires an efficient implementation of GRIB-based I/O. Thesimplest thing to do is just to run the GRIB I/O routines serially onthe front end and communicate the unpacked data to the parallel pro-cessors. This means however, that the time spent on I/O becomes adominating fraction of the total execution time. In order to improve ef-ficiency the following strategy was used: 1) read the GRIB record fromdisk on the front end. 2) unpack the parts of the GRIB record con-taining the descriptive information and packing parameters on the frontend. 3) communicate the packed data field to the processor array. 4)unpack the data locally on each processor. Storing works the other wayaround. This strategy gives less communication since data is sent inpacked format and enables the unpacking to be performed in parallel.
Timing and profiling
A number of test runs have been carried out on different platforms us-ing the recoded Fortran77 version on workstations and the Fortran90version on the parallel machines. All test runs were performed usingmeteorological data from HIRLAM to drive the transport.
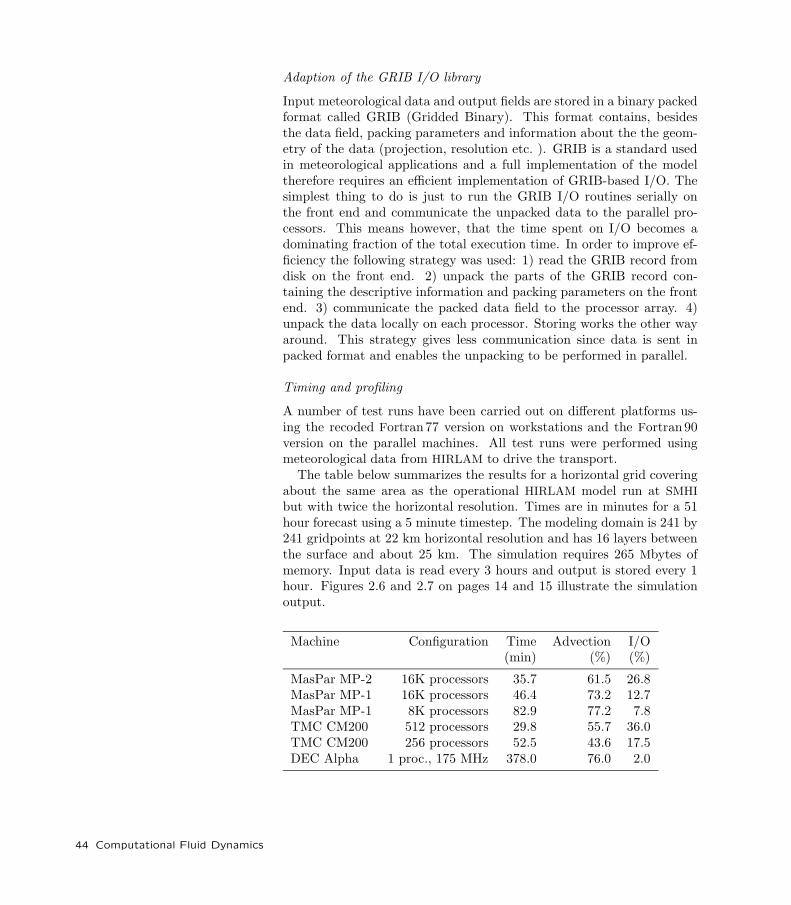
The table below summarizes the results for a horizontal grid coveringabout the same area as the operational HIRLAM model run at SMHI
but with twice the horizontal resolution. Times are in minutes for a 51hour forecast using a 5 minute timestep. The modeling domain is 241 by241 gridpoints at 22 km horizontal resolution and has 16 layers betweenthe surface and about 25 km. The simulation requires 265 Mbytes ofmemory. Input data is read every 3 hours and output is stored every 1hour. Figures 2.6 and 2.7 on pages 14 and 15 illustrate the simulationoutput.
Machine Configuration Time Advection I/O(min) (%) (%)
MasPar MP-2 16K processors 35.7 61.5 26.8MasPar MP-1 16K processors 46.4 73.2 12.7MasPar MP-1 8K processors 82.9 77.2 7.8TMC CM200 512 processors 29.8 55.7 36.0TMC CM200 256 processors 52.5 43.6 17.5DEC Alpha 1 proc., 175 MHz 378.0 76.0 2.0
44 Computational Fluid Dynamics

The 512 processor CM200 is fastest and computes a 51 hour simula-tion in 30 minutes while the simulation on MP-2 takes 36 minutes. Theparallel platforms are about 12 times faster than the DEC Alpha work-station for this particular problem. Most of the execution time is spentin the advection part of the model on all platforms. On the parallel ma-chines I/O is second in importance and constitutes a significant fractionof the total execution time. The fraction of time spent on I/O is muchsmaller on the workstation, but is similar in absolute numbers.
For MP-1 and CM200 the simulation has been run on different numberof processors in order to investigate scalability of the code. The parallelefficiency (defined as the achieved speedup divided by the theoreticalspeedup) is very similar on the two platforms. It is 88% when goingfrom 256 to 512 processors on CM200 and 89% when going from 8K to16K on MP-1. On both CM200 machine sizes, 14% of the execution timeis spent on communication.
Conclusions
The MATCH dispersion model has been successfully implemented on twodifferent parallel platforms using the data parallel programming model.The implementation required a major recoding of the original model The MATCH dispersion model
has been successfullyimplemented on two differentparallel platforms
to replace the linear memory model with a memory model suitable fordistributed memory systems. Once recoded the porting of the code torun on the parallel platforms was relatively straight forward using theVAST translator to translate from Fortran77 to Fortran 90. All changesto the code were done in the Fortran77 version of the code in order tomaintain a portable code.
The parallel platforms were about 12 times faster than the DEC Alphaworkstation presently used in operational applications on the test case.So far however, no efforts have been made to optimize the cache usageon the workstation. Although a major increase in I/O performance wasachieved by parallelizing the unpacking of binary GRIB records, I/Orepresented a significant fraction of the execution time on the parallelplatforms (8% to 36%) while only 2% of the execution time was spenton I/O on the workstation. The available timings for executing the testruns on different number of processors indicate a good efficiency for bothMasPar and CM200 when increasing the number of processors.
5.6 Numerical Simulation of Fully Developed TurbulentPlane Couette FlowJukka Komminaho, Anders Lundbladh, Arne JohanssonDepartment of Mechanics, KTH
Fully developed turbulence in plane Couette flow is studied by means ofdirect numerical simulation. Experience has shown that this is a partic-ularly difficult case to study because of a tendency to develop extremely
Computational Fluid Dynamics 45

(a) (f)
(b) (g)
(c) (h)
(d) (i)
(e) (j)
Figure 5.2. A grey scale coding of the streamwise velocity component in the midplanebetween the two walls moving in opposite directions. The relaminarization process atRe = 350 is here depicted at a number of consecutive times (here marked by a-j).
46 Computational Fluid Dynamics

long vertical structures aligned in the streamwise direction. For a nu-merical simulation study an extremely long (and also rather wide) boxis needed, almost 90 half-heights long in the present case.
The computations were carried out on the massively parallel CM200at PDC where the calculations amounted to a total of about one CPU The calculations amounted to a
total of about one CPU monthmonth. Accurate statistics have been acquired and the long structureshave been studied in detail. It was also shown that a weak (spanwise)rotation has a drastic effect on the long structures. Comparisons withexperimental results show excellent agreement [Bech et al., 1995].
Also the relaminarization of plane Couette flow turbulence was stud-ied by a step-wise lowering of the Reynolds number, see Figure 5.2.This was achieved by increasing the viscosity, thereby avoiding the in-stabilities that would occur if the velocity suddenly was decreased. Thetransition Reynolds number could hereby be determined to about 360thereby substantiating the previous numerical/experimental findings ofLundbladh & Johansson and Tillmark & Alfredsson. Also the turbulenceregeneration mechanisms could be elucidated at low Reynolds numbers.Strong similarities were found with the streak instability mechanismsobserved in typical bypass transition scenarios in various flows.
The code has recently also been ported to the IBM SP-2 machine andsome preliminary results look promising for the performance on thatmachine. A study of two dimensional turbulence has recently been ini-tiated where the aim is to perform simulations with up to 4196× 4196spectral modes. Furthermore a study of turbulent pipe flow by use ofa novel technique of utilizing an efficient spectral method has recentlybeen initiated.
In addition to the publications [Komminaho, 1995, Komminaho et al.,1995a, Komminaho et al., 1995b], results from this project have beenpresented at The 47:th annual meeting of the Fluid Dynamics Divisionof the American Physical Society, Atlanta, November 1994 and at EU-ROMECH Colloquium 236 in Trondheim, June 1995.
5.7 Parallel Computing for Aircraft Design
Anders Ytterstrom, Arthur RizziDepartment of Aeronautical Engineering, KTHThierry Poinsot, Vincent van KemenadeCERFACS, FranceJan VosIMHEF, EPFL, Switzerland
Developing and improving simulation tools to study the aerodynamicsaround complete vehicles or in complex internal geometries is a key pri-ority in the aerodynamic offices of many aeronautical engineering compa-nies. Major European aerospace companies such as Saab and Aerospa-tiale want to turn the Navier Stokes simulation method into a practicaltool that design engineers can use on a routine basis. Today this method
Computational Fluid Dynamics 47

applied to a full configuration is still at a research stage because longrun times with millions of grid points on expensive supercomputers pro-hibit the widespread use of the method and therefore refinement of thetool goes slowly. Aerospatiale and Saab believe that running these large-scale 3D viscous simulations on massively parallel (MPP) platforms canbring down the cost of these advanced simulations by a factor of tenwhich will lead to a more rapid development of the method, and ulti-mately put it in the hands of the designer so that Airbus for examplecan remain competitive in the international aerospace market.
European aerospace code
The PAR-AERO project was an ESPRIT-EUROPORT1 project startedin January 1994 and ended in December 1995. The Swedish part of theproject was financed by NUTEK.
In the PAR-AERO project, nine European partners (CERFACS, KTH
Stockholm, Aerospatiale, EPF Lausanne, Saab, PSS, ENSEEIHT, RUStuttgart, CIRA) have collaborated to implement parallel versions of theNavier-Stokes solver called NSMB (Navier Stokes Multi Block) [Leylandet al., 1995, Vos et al., 1995] developed and used by EPFL, KTH, CER-
FACS, Saab and Aerospatiale. The entire code has been parallelizedwith PARMACS and PVM and ported to most existing parallel platforms:IBM SP-1 and SP-2, CRAY J916, SGI clusters, IBM clusters, Meiko CS2,Meiko CS 2HA, CRAY T3D, Intel Paragon, Convex MPP. A specific toolto split meshes into multiple blocks (MB Split) has been developed andcoupled to NSMB.
Benchmarks
Test cases included a two dimensional airfoil (A-airfoil with 65 000 cells,see Figure 2.8 on page 16), a three dimensional wing (F5 wing with370 000 cells, see Figure 2.9 on page 16) and a full aircraft configura-tion (AS28G with 3.5 million points, see Figure 2.10 on page 17). Thefuselage-wing-pylon-nacelle computation has never been done before onvector machines because the memory required exceeds the usual vectormachine capacity. The execution speed on a CRAY Y-MP vector com-puter for the first two benchmark cases was around 170 Mflop/s. TheThe parallel performance has
been about 90%, and scalabilitywas shown to be excellent
parallel performance has been about 90%, and scalability was shown tobe excellent. Relative speed-ups compared to the CRAY Y-MP rangedfrom 0.8 to 10 depending on the configurations. Figure 5.3 presentspeedup obtained for the A airfoil on the SP-2.
The difference in speedup for the 2 curves in Figure 5.3, is due to theincreased amount of work when the computational grid is split into moredomains, or blocks. This difference is much larger for a 3D case, becausethe number of extra ghost cells outside the computational domain ismuch larger in a 3D case, compared to a 2D case.
48 Computational Fluid Dynamics

Figure 5.3. Speedup for the A-airfoilon the IBM SP-2. The difference be-tween the two curves is the extra workperformed on a computational gridwith many blocks, compared to a sin-gle block grid. The 16 blocks curvegives the same amount of work on allcases, but the 1 block-per-processorcurve gives an increased amount ofwork on cases with more processors.
1
2
3
4
5
6
7
8
9
10
11
12
13
14
15
16
1 2 4 8 16
T(1
) / T
(Np)
Np
A-airfoil speedup on IBM SP-2, 55 processors (KTH) for grid 4, 512x128 cells
ideal curve1 block per processor
16 blocks
Vision for aerospace
The very competitive aerospace market forces European industry to workwith the most technically advanced tools in the most cost-effective ways.The design teams must be able to make air flow simulations over the com-plete aircraft, and not just the components separately as done before,in order to assess the interactions and interferences between the com-ponents. The precision of the simulation must also be very high, andthis leads to a computational problem of very large magnitude and highcost. Multiprocessor parallel machines are relieving the bottlenecks ofhigh cost and limited computational capacity and allowing these com-putational tools to get into the hands of the design engineer. But moreresearch needs to be done in refining the algorithmic methods, in opti-mizing the parallel performance of the software and in integrating thesoftware into the industrial workplace.
In the EUROPORT newsletter Insights (11 2/96), Saab claims that“Parallel NSMB has convinced us that cost-efficient industrial applicationof aerodynamic analysis and design tools for 3D viscous flows requiresparallel processing.”
In the same newsletter, Aerospatiale Aircraft Business says: “We arenow convinced that even complex numerical simulation packages can beefficiently parallelized in a portable way. The high scalability of NSMB
makes us confident that the performance we need to remain competitivewith the US Aerospace industry can be reached on larger MPP machines(more than 128 processors, say).”
Computational Fluid Dynamics 49

Figure 5.4. The grid around the M6wing.
5.8 Solution of Compressible Flow Problems in Parallel withStatic Load Balancing
Anders AlundSwedish Institute of Applied Mathematics, GoteborgPer Lotstedt, Mattias SillenSaab Military Aircraft, Linkoping
Computational fluid dynamics (CFD) for aerospace applications requirecomputers with large storage capacity and high speed floating point ca-pability. Parallel computers with large primary memories and powerfulprocessors connected by a high speed network are suitable for CFD prob-lems. The performance of a parallel version of an industrial productioncode is here evaluated on the IBM SP-2 machine at PDC. In the open en-vironment at PDC it is possible to work with research oriented projects.For the large group of calculations at Saab dealing with classified ge-ometries a higher security level is required, which means that they haveto be run on a machine installed in a more controlled environment.
MultNaS is a program developed at Saab for solution of the Eulerand Navier-Stokes equations of compressible flow [Lotstedt and Sillen,1993]. The grid is partitioned into a number of blocks. Each block has astructured grid. The system of partial differential equations is discretizedaccording to Jameson. Steady state solutions are calculated by Runge-Kutta time-stepping and multigrid acceleration. Originally the code wasdesigned to run on one processor of a CRAY vector computer. The serial
50 Computational Fluid Dynamics

Figure 5.5. The Mflop/s rate forthe M6 wing and Saab 2000 airplaneusing from 2 up to 32 () processorscompared to the ideal speedup.
M6 wing
1 2 4 8 16 24 32
100
200
300
400
500
600
700
800
900
1000
Processors
Mflo
p/s
Saab 2000 airplane
1 2 4 8 16 24 32
100
200
300
400
500
600
700
800
900
1000
Processors
Mflo
p/s
version of MultNaS was modified in [Lotstedt and Alund, 1994] to fit themessage-passing programming model supported by PVM. The message-passing paradigm is the standard choice when transforming validatedCFD production codes to parallel processing. A master process initializesand controls the execution of the slaves. Each slave process calculatesthe solution in one or more blocks. The data at the block boundariesmust be sent to the processors holding the adjacent blocks. The parallelversion of the program and the performance on a cluster of workstationsis described in [Lotstedt and Alund, 1994] and [Alund et al., 1994].
The performance of the code on IBM SP-2 with thin nodes is tested intwo examples, where the Euler equations are solved. The first exampleis the standard wing ONERA M6. The freestream Mach number M∞is 0.84 and the angle of attack α is 3.06. The grid around the wingconsists of 1.96 · 106 cells partitioned into 32 blocks of equal size. Thegrid on the wing and the symmetry plane is shown in Figure 5.4. Usinga static load balancing algorithm, which takes the communication timeinto account, the steady state solution is calculated on 4, 8, 16 and 32processors. The Mflop/s rate for the iteration is plotted in Figure 5.5.On 32 processors the computational speed is 1.015 Gflop/s.
Saab 2000 is a propeller driven airplane for 54 to 58 passengers. Acomputational grid with 48 blocks and more than 0.8·106 cells surroundsthe port side. The cruise speed M∞ is 0.62 and α is 0. A plot of thesolution on the port side and its image on the starboard side is found inFigure 2.11 on page 17. The colors represent a coefficient proportionalto the static pressure on the surface of the airplane. The efficiency for16 and 32 processors in Figure 5.5 is lower than it is for the M6 wing.The reason is the heterogeneous sizes of the blocks in this more realisticconfiguration. One block is much larger than the others and must besplit to obtain a good load balance.
A detailed report with a description of the static load balancing algo-rithm, results for the Navier-Stokes equations with the k—ε turbulencemodel and comparisons with workstation clusters and CRAY Y-MP arefound in [Alund et al., 1995].
Computational Fluid Dynamics 51

Figure 5.6. Mesh consisting of 80blocks and 480 000 nodes.
The work described here is part of a project in NUTEK’s program forsuper and parallel computing. Project partners are ABB Corporate Re-search, Saab Military Aircraft, Volvo Aero Corporation, and the SwedishInstitute of Applied Mathematics.
5.9 A Parallel Full Navier-Stokes Simulation of anAfterburner at Volvo Aero Corporation
Roland RydenVolvo Aero Corporation, TrollhattanAnders AlundSwedish Institute of Applied Mathematics, Goteborg
Since the autumn 1994 Volvo Aero Corporation (VAC) has been involvedin a design process, aiming to increase the life of the flame holders inthe RM12 afterburner. The CFD activities were initiated at an earlystage and present a very challenging task, modeling the complex geom-etry of the afterburner. The multiblock grid was created using NURBSThe multiblock grid was created
using NURBS surfaces retrievedfrom the concurrent CAD work
surfaces retrieved from the concurrent CAD work and imported intoG3DMESH1 [Lindblad, 1995] via IGES format. The final mesh consistsof 80 blocks and 460 000 nodes, see Figure 5.6.
The solver used in this simulation VolSol V22 [Ryden, 1995] was par-allelized using PVM in February 1994 [Alund et al., 1994, Alund andRyden, 1994], and has been used in production runs since then, usingavailable workstation clusters at VAC. The solver consists of one hostprocess holding the complete problem, distributing the problem to theslaves using static load balancing algorithm, and then makes the syn-chronization at each time step. The slave processes exchange data at
1VAC in-house developed multi-block structured mesh generator.2VAC in-house developed solver for 3D compressible Navier-Stokes with reacting
flow.
52 Computational Fluid Dynamics

interface boundaries once in every time step. Because the time integra-tion is done using a three stage Runge-Kutta algorithm, the interfacefluxes in the first step are also sent between interfacing processes andthen kept constant for the next two steps in order to keep the conserva-tion.
When the IBM SP-2 at PDC, became available, during the afterburnerdesign process, this was a great opportunity to test the code on a full-scale problem. The full compressible Navier-Stokes equations includ-ing k—ε turbulence model, species transport and droplet tracking andevaporation presents a very complex engineering problem. The compu- The computational effort on
grid cell basis is very high andthus very feasible forparallelization using the messagepassing paradigm
tational effort on grid cell basis is very high and thus very feasible forparallelization using the message passing paradigm since the communi-cation is on surface basis and small compared to the computational effortwhich is on volume basis. The degrees of freedom within each cell is nineconsisting of
• Continuity equation (1)
• Momentum equations (2–4)
• Total energy equation (5)
• Turbulence kinetic energy transport (6)
• Dissipation of turbulence kinetic energy transport (7)
• Species transport equations (8–9)
This gives the problem as a whole 4 140 000 degrees of freedom. Theblock sizes holds 0.12% to 2.25% of the complete problem. This gives afairly well balanced problem for 10, 20 or 40 nodes. The runs performedon Strindberg used 1, 20 and 40 thin nodes with speed-up figures givenin the table below. The “possible speedup” is defined as the inverse ofthe largest node percentage, i.e. taking the load balancing into account.
# nodes Smallest Largest CPU time for Possible Achievednode size node size one time step speed-up speed-up
(%) (%) (seconds)
1 100.00 100.00 109.04 1.00 1.0020 4.85 5.15 5.65 19.42 19.2840 2.30 3.00 3.28 33.30 33.24
The speed-up is embarrassingly good for this problem, reducing thetime for one solution from 1200 CPU hours (50 days) to 36 CPU hourswhen using 40 nodes on Strindberg. It opens completely new possibil- It opens completely new
possibilities for the CFD
modeling to be used as apowerful engineering tool
ities for the CFD modeling to be used as a powerful engineering tool.Visualization of some output from this simulation can be seen in thecolor figures where Figure 2.12 on page 18 shows the recirculation zonewhere the flame is stabilized, Figure 2.13 on page 18 shows streamlines
Computational Fluid Dynamics 53

from a thought fuel injector radius, and Figure 2.14 on page 19 gives adetailed picture of the flow around the flame holder.
The essential part of the work described in this report is part of aproject in NUTEK’s program for super and parallel computing. Projectpartners are ABB Corporate Research, Saab Military Aircraft, VolvoAero Corporation and the Swedish Institute of Applied Mathematics.
5.10 Parallel CFD on the IBM SP-2Ingemar PerssonCenter for Computational Mathematics and Mechanics, KTH
Computational fluid dynamics (CFD) encompasses the computation offluid flow around bodies for all speed regimes. The aim is to use CFD as adesign tool to increase performance and effectiveness on the actual objectof interest. The fundamental equations of fluid flow, the Navier-Stokesequations, are considered to be exact and to apply to even the smallestobservable eddies of turbulence as long as we assume that the fluid isa continuous medium. However, the Navier-Stokes equations are verydifficult to solve. Not only because of the need of enormous computingpower but also due to the grid quality requirements. Thus it is com-mon to eliminate the viscous stress terms in the Navier-Stokes equationswhich yields the so called Euler equations. These equations relaxes boththe computing power needed and the requirements on the grid. Withinthe EU Human Capital and Mobility project we have examined a modu-lar cell-vertex finite volume code designed to solve realistic compressiblefluid flow problems. The code, called AVBP, is able to handle structuredand unstructured meshes in both 2D and 3D. The AVBP code developedat CERFACS has been used to solve the Euler equations for three dimen-sional inviscid, compressible flows in the transonic speed region. As testcases we have used geometries known as the ONERA M6, a simple winggeometry and the Dassault Falcon aircraft, a full aircraft geometry. Bothgrids are unstructured tetrahedral grids suitable for Euler flow calcula-tions and were generated using J. Peraire and J. Peiro’s unstructuredgrid generator. Such flows are described by the Euler equations,
∂w
∂t+
3∑i=1
∂F i
∂xi= 0
where
w =
ρ
ρu1
ρu2
ρu3
ρE
, F i =
ρui
ρuiu1 + pδi1
ρuiu2 + pδi2
ρuiu3 + pδi3
ui(p + ρE)
and δij is the Kronecker delta function.
54 Computational Fluid Dynamics

AVBP uses a cell-vertex finite volume method. The semi-discretescheme formulation for node k becomes,
dwk
dt= − 1
Vk
∑j|k∈Ωj
DkΩj
VΩj RΩj
where DkΩj
are the cell-vertex distribution coefficients, Vk is a controlvolume associated with node k, RΩj defines the cell residual of cell Ωj
and VΩj defines the volume of cell Ωj .AVBP has been implemented in Fortran 77, with non-standard exten-sions to allow dynamic memory allocation. The coarse grained blockdata structure in the sequential algorithm made it natural to parallelizethe code in a master/slave fashion by using PVMe or Parmacs as mes-sage passing library. This in turn necessitates a decomposition of thecomputational mesh that assigns equal amounts of data to each proces-sor and minimizes the communication cost of the interfaces. In AVBP,two rather simple decomposition methods have been implemented. As apreprocessing step to the parallel execution of the code, the mesh can bedecomposed by either the RCB (Recursive Coordinate Bisection) or theRIB (Recursive Inertia Bisection) partitioning algorithms. They try tobalance the number of generalized elements between the generated par-titions. The decomposition is done on the master node and thereaftereach partition is mapped onto a slave node. Each partition is made upof blocks and a block has a group as a substructure. The group is a setof elements on which operations are performed and it work as a cacheblocking strategy. This grouping strategy shows to be a useful tool to This grouping strategy shows to
be a useful tool to tune the codeto perform efficiently on aspecific machine architecturewithout the need of hand-tuningcritical parts of the code
tune the code to perform efficiently on a specific machine architecturewithout the need of hand-tuning critical parts of the code. Details onpartitions, blocks and groupings can be found in [Rudgyard et al., 1994].
Performance results
In order to evaluate the parallel performance of the computer code, testswith different parameter settings have been made. Altered parametersare the number of used processing nodes, the partition technique em-ployed, and the element grouping within each subdomain. The ONERA
M6 wing (57041 nodes, 306843 tetrahedral elements) can be consideredas a relatively small test case, whereas the twin engined Dassault Falconaircraft configuration (155932 nodes, 847361 tetrahedral elements) canbe classified as a relevant industrial test case, see Figures 2.15 and 2.16on pages 19 and 2.16. For both cases, explicit 4-stage Runge-Kuttatime-stepping has been used to advance the solution to reach the pre-scribed residual. The performance of the IBM SP-2 on a wide node was41 Mflop/s and 27 Mflop/s for a thin node. All tests were performedin a ’semi-dedicated’ mode, i.e. having a dedicated switch but a non-
Computational Fluid Dynamics 55

Figure 5.7. Speed-up graphs for theM6 wing and the Falcon aircraft usingRIB (o) and RCB (+)
0 10 20 30 40 50 60 700
10
20
30
40
50
60
70
Processors
Spe
ed−
up
Speed−up for the M6 wing using RIB (o) and RCB (+)
Speed-up (M6), p0 = 2
0 5 10 15 20 25 30 350
5
10
15
20
25
30
35
Processors
Spe
ed−
up
Speed−up for the Falcon aircraft using RIB (o) and RCB (+)
Speed-up (Falcon), p0 = 4
dedicated CPU. We define speed-up, Soptp0
(p), of base p0 as,
Soptp0
(p) =T opt(p0) p0
T opt(p),
where T opt(p) denotes the ”optimal” CPU time for p processors. With”optimal” we mean picking out the run times from the groupings thathas given the best performance, i.e. used least CPU time. From the datawe can conclude that AVBP parallelizes with excellent performance, seeFigure 5.7. In the case of the M6 wing, we get linear speed-up andfor the Falcon aircraft we receive super-linear speed-up. The performedparameter studies [Persson, 1995] have given us a good knowledge aboutwhat can be chosen as a nearly optimal grouping of the elements on theIBM SP-2 system.
Conclusions
The present study has shown that the AVBP compressible fluid flowThe AVBP compressible fluidflow solver program can be usedto solve realistic CFD problemsin a scalable and efficient wayon the IBM SP-2 system
solver program can be used to solve realistic CFD problems in a scalableand efficient way on the IBM SP-2 system. Certainly, several routinescould be further optimized for speed but then the design of a singlecode running efficiently on several platforms would be compromised. Asdemonstrated in [Persson, 1995], care has to be taken when choosing the’grouping number’. A non-appropriate chosen ’grouping number’ mayinduce up to 50 % longer computation time. The choice of decompositionalgorithm has shown to be of less importance. The different decompo-sition techniques usually give within 10 % the same run times. Thissmall difference comes as no surprise since the two methods comparedare relatively similar.
56 Computational Fluid Dynamics

5.11 Supersonic Inviscid Flow Computations on AdaptiveUnstructured GridsIngemar PerssonCenter for Computational Mathematics and Mechanics, KTH
The following results treats the computation of the axial symmetric flowaround a shell. Shells used in the Swedish army need to have at least two Shells used in the Swedish army
need to have at least twoindependent security systems toavoid unintentional detonations
independent security systems to avoid unintentional detonations. Onecommon system is based upon the rotation of the shell. However, theshell used in these calculations is stabilized by small wings and thus donot rotate. Instead, the approach used in this case is based on the differ-ence in pressure over a membrane, when the shell reaches a specific speed.The problem is to find suitable places for the two channel-entrances tothe membrane. Pressure is the only variable of interest here, and witha Reynolds number of several millions and no danger for separations,we decided to perform inviscid calculations, i.e. solving the Euler equa-tions. Another thing of interest was the possible impact of detonationknob-length and the pressure difference at different speeds.
The numerical treatment of the flow problem
The NSC2KE code [Mohammadi, 1994] has been used to solve the axialsymmetric Euler equations for inviscid, compressible flows in the super-sonic speed region. Our assumption that the flow is axisymmetric meansthat all of the θ derivatives are zero. We also assume that the swirl orthe θ component of the velocity is zero.The Euler equations are discretized in space on unstructured meshes us-ing a Finite Volume-Galerkin technique with a kinetic Riemann solverfor the convective part.
If we suppose that the flux F varies linearly on each triangle, the weakformulation is given by: Find Wh ∈ (Vh)4 such that ∀φh ∈ Vh := v ∈C0(Ω), v|T is linear ∀T ∈ T ∫
Ω
∂Wh
∂tφh −
∫Ω
Fh(Wh)∇(φh) +∫
∂Ω
Fh · nφh = 0
⇔
|Ci|Wn+1 −Wn
∆t+
∫∂Ci
Fd(Wn) · n = 0
where Ci is denoting a cell and
Fd(Wh) =
F (W∂Ω) on ∂Ci ∩ ∂Ωpiecewise constant approximation of F (W ) otherwise
Computational Fluid Dynamics 57

The approximation of F (W ) fulfills∫∂Ci
Fd · n =∑j 6=i
Φ(W ′|Ci , W′|Cj )
∫∂Ci∩Cj
n
where Φ(u, v) = 12 (F (u) + F (v)) − d(u, v) and a kinetic proposition for
the numerical diffusion, d, is used. In order to get second order spatialaccuracy a MUSCL like extension involving combinations of upwind andcentered gradients is applied.
Rather than using the explicit time integration scheme given above,NSC2KE make use of a four stage Runge-Kutta scheme. This also en-ables us to treat time dependent flows if wanted. In our case, we haveused a local time stepping procedure where ∆t(si) = ∆x
|u|+c and ∆x is aminimum height of the triangles having node si in common.
Vectorization and Parallelization
In order to achieve high performance, NSC2KE was first vectorized onthe CRAY J90 and later also parallelized using CRAY microtasking. Asthe code only had an inherent parallelism of 13%, a graph coloringscheme had to be implemented enabling parallelization of the most timeconsuming parts of the code. This edge and element coloring made thecode almost 85% parallel. On 4 processors a speed-up of 2.4 was mea-sured which can be considered good keeping in mind that Amdahl’s lawpredict a maximal theoretical speed-up of 2.76. The performance on asingle processor was 50 Mflop/s.
Computational results
In order to investigate the pressure ratio over the membrane and anypossible knob-length dependence, several runs for different parametersettings have been made. The altered key parameters here are the freestream speed and the knob-length. All grids, generated using a Delaunaymesh generator, are unstructured triangular grids suitable for Euler flowcalculations, see Figure 5.8. To enhance the resolution, e.g. shock captur-ing, the grids were adapted using NSCADAP [Persson and Ytterstrom,1996]. The refinement can be done with respect to flow quantities suchas density or pressure. Refinement can also be done with considerationtaken to a fixed wall.The computations resulted in
the knowledge that the suggestedknob-length variation was notsignificant
The computations resulted in the knowledge that the suggested knob-length variation (1 mm difference) was not significant and that the pres-sure ratio over the membrane was a factor three or more.
58 Computational Fluid Dynamics

Figure 5.8. Density field atMach=2.06 on a coarse adapted grid.
5.12 Numerical Computation of Hydrodynamics in FluidizedBedsHans LofstrandDepartment of Thermo and Fluid Dynamics, CTHEric PeiranoDepartment of Energy Conversion, CTH
The main objective of this work is to develop a method to evaluate atwo-fluid model of the gas and particle flow fields in a fluidized bed.A bubbling fluidized bed can technically be described as a container inwhich the solid phase in the form of closely packed particles (in thiscase silica sand with a mean diameter of 0.7mm) is brought into motionby an air flow inserted at the bottom of the container through an airdistributor. The air tends to form bubbles which rise through the bed,but can also flow through the dense regions and shortcut between thebubbles. The word fluidization comes from the fact that, at a gas flowrate within a certain range, the mixture becomes fluid-like. Fluidized Fluidized beds have been in
industrial use for severaldecades
beds have been in industrial use for several decades mainly as chemicalreactors, solid fuel combustors and dryers.
The two-fluid model is an averaged form of the Navier-Stokes equa-tions for each phase, cf. [Drew, 1983], and is represented by one continu-
Computational Fluid Dynamics 59

ity equation for each phase and one momentum equation in each direc-tion and for each phase. In the averaging process, interfacial momentumtransfer terms enter the momentum equations. These terms as well asthe particle pressure term are modeled using empirical correlations.
The numerical algorithm is based on a well-known finite differencemethod for two-fluid models, the IMF method by Harlow and Amsden[Harlow and Amsden, 1975]. A first order scheme, the upwind scheme,is used for the convective terms. The equations are discretized semi-implicitly in time, treating the space derivatives of unknown variablesexplicitly, so that a one-point scheme is obtained.
The solution of the equations show how gas bubbles, defined as theregions where the gas concentration is larger than approximately 70%,rise up through the bed chaotically but with a regularity in a statisticalsense. A typical instantaneous flow field is shown in Figure 2.17 onpage 21. The above mentioned regularity has also been observed inexperiments, where these statistical quantities have been evaluated fromcapacitance probe signals, cf. [Olowsom and Almstedt, 1990]. In orderto get relevant statistical quantities from the computations, simulationsof at least 30 seconds real time are necessary. The large amount ofcomputer time required to solve this kind of transient two-phase flowproblems using powerful workstations renders such a project impossible.To remedy this, a multiblock-version of the code has been adapted, withthe aid of MPI, for use on parallel computers such as IBM SP-2.
Presently, work is going on to guarantee that the mean values ofthe microscales (velocity, pressure, density profiles) and the macroscales(bubble frequency, mean bubble length, mean bubble rise velocity, etc. )are independent of the block structure used. The future goal is to vali-date different submodels for the interfacial momentum transfer term, dif-ferent boundary conditions, and to investigate effects of three-dimension-ality.
5.13 Consolidation of Concentrated Suspensions
Jacob YstromCenter for Computational Mathematics and Mechanics, KTHHeinz-Otto KreissUniversity of California, Los Angeles, USA
Condensed research description
A concentrated suspension is a two constituent mixture, consisting of aIt is for many applicationsunrealistic to use models thattake into account each separateparticle in a suspending fluid,therefore, a continuum modelingis desirable
fluid and solid particles, and where the interaction between particles isnot negligible. The particles are observable on an experimental scale butit is for many applications unrealistic to use models that take into ac-count each separate particle in a suspending fluid, therefore, a continuummodeling is desirable. We consider a continuum formulation for suspen-sions, where the fluid is incompressible Newtonian and where there is
60 Computational Fluid Dynamics

one type of incompressible solid particles. The density of the particles isassumed different from the fluid density, which makes the gravity field animportant forcing function. The separation of the two constituents dueto gravitational effects is called consolidation. Examples of concentratedsuspensions are sludge, paste and paint.
The main contributions are:
• We formulate a continuum model for the consolidation of concentratedsuspensions in several space dimensions. This model is based on classi-cal equations for mixture theory and a series of assumptions consistentwith the standard model in one space dimension and by rather gen-eral assumptions regarding the constitutive relations specific to themultidimensional case.
• The linearized system of equations of the suspension model is for theperiodic Cauchy problem proved to be well-posed.
• A general continuum formulation of irreversible compression, used tomodel compression rheology for flocculated suspensions in Euleriancoordinates is developed.
• A numerical solver for a genuinely two dimensional test problem forconcentrated suspensions is developed. This test problem is a drivencavity type of problem where the cavity is a closed box and with con-stant gravity perpendicular to the direction of a tangentially movingwall. Numerically computed solutions in one and two space dimen-sions are demonstrated to be well-behaved. The one dimensional com-putations are consistent with other computations which in turn havebeen validated to experiments.
The use of the IBM SP-2
The numerical solver and the computed solutions can be seen as a vali-dation process of the theoretical results. In this process a fast computerhas been necessary. The equations behave as ODE’s coupled to a systemof elliptic equations. The solver is implemented in C++, using a finitedifference class library D++, that takes care of space discretization. Theelliptic separate problems are therefore solved with a direct band-solver.The numerical algorithm is robust but not very effective, it is further-more implemented as a single processor code. Plans for future workinclude a more effective 2D solver that can be used in an experimentalverification process. For numerical example see Figure 2.18 on page 22.For further details see [Ystrom, 1993] and [Ystrom, 1996].
Computational Fluid Dynamics 61

5.14 Flutter Analysis of Two Dimensional Viscous Flow inTurbomachines Using the Advection Upstream SplittingMethod (AUSM)
Wolfgang Hohn, Torsten FranssonDepartment of Energy Technology, KTH
Introduction
The design of more efficient turbomachines leads to higher loaded bladeswith increased flow temperatures and velocities.
Moreover, improved lighter blade materials for turbo-engines are in-troduced as well as more slender blades in order to increase the perfor-mance and decrease the weight. This is of important interest, especiallyfor aircraft engines.
Long blades in compressors or in the last stage of turbines there-fore become more sensitive to flow induced vibrations. Consequently,aeroelasticity is an important discipline as the combination of the aero-Aeroelasticity is an important
discipline as the combination ofthe aerodynamic and thestructural dynamics of the bladein turbomachines.
dynamic and the structural dynamics of the blade in turbomachines.Different kinds of aeroelastic phenomena are defined in the literature
(see [Forsching, 1974]). One can divide them in static and dynamicappearances. The last one can be divided in forced vibrations and selfexited vibrations, usually called flutter.
For realistic modern flow configurations nonlinear and viscous effectsare far from negligible, especially in the vicinity of shocks as well as forshock boundary layer interaction. Due to that the aerodynamic work ofthe fluid on the structure can be strongly influenced by separated flowsituations in compressors and by shocks occurring in turbine cascades.
Therefore, the presented numerical method accounts for unsteady, vis-cous, fully turbulent flow around cascaded blades towards a better un-derstanding of the above mentioned flow situations.
Computational Method
An unsteady, compressible, two dimensional Navier Stokes solver is usedto predict the flow around cascaded vibrating blades. The presentedThe presented method applies
the “Advection UpstreamSplitting Method”
method applies the “Advection Upstream Splitting Method” (AUSM)for the discretization of the convective terms [Wada and Liou, 1994] andcentral differences for the diffusive terms. The AUSM scheme is basedon the idea of the van Leer’s flux vector splitting method. Turbulenceis modeled by using the Baldwin-Lomax turbulence model. The timeaccurate integration of the governing equations is performed by applyingan explicit four stage Runge-Kutta scheme.
Advantages of the method are its simple implementation in compar-ison to for instance flux difference splitting methods and that there isno need to specify numerical dissipation parameters as for example for“central schemes”.
The blade flutter phenomena is simulated by imposing a motion on the
62 Computational Fluid Dynamics

Figure 5.9. Mesh used for standardconfiguration 5, 120× 100 meshpoints.
blade, which consists of harmonic body translation in two directions androtation, allowing an interblade phase angle between two neighboringblades. The studied test cases apply either a bending or a torsionalmotion. No combined motion, i.e. bending and torsional motion, hasbeen investigated.
In the first step the solution for the steady state flow is calculated,which is then used as initial condition for the unsteady analysis, in whichthe Navier-Stokes equations are solved in a time accurate manner. Inorder to simulate the blade motion the computational mesh has to bedeformed. To account for this mesh motion extra terms arise in the gov-erning equations. The simulation of non-zero interblade phase angles ishandled by storing the computed flow variables at the periodic boundarynodes and applying the stored quantities at a later time on the oppositeperiodic boundary [Erdos et al., 1977]. In this way the computationaldomain only has to include one blade passage.
The code was validated by flat plate cases for laminar and turbulentflow at different Reynolds numbers, laminar flow around a 2D cylinder,different turbine and a compressor cascade test cases.
Computational Fluid Dynamics 63

Table 5.3. Steady state flow param-eters, international standard configu-ration 5.
Experiments INSTHPT
Mainlet 0.5 0.51Inlet flow angle 63.3 63.3Maoutlet 0.47Outlet flow angle 60.7Angle of incidence 4.0 4.0
Emphasis is made on the investigation of the unsteady inviscid andEmphasis is made on theinvestigation of the unsteadyinviscid and viscous flowsituations in cascaded flow
viscous flow situations in cascaded flow for three standard configurations(see [Bolcs and Fransson, 1986]), i.e. a turbine and a compressor test case,and is performed on the parallel computer IBM SP-2 at KTH, using MPI
as message passing system.
Results
As an example, the results for a compressor cascade (standard configu-ration 5 [Bolcs and Fransson, 1986] are shown.
This two-dimensional subsonic cascade configuration has been testedin a rectilinear cascade air tunnel at the Office National d’Etudes et deRecherches Aerospetiale (ONERA).
Figure 5.9 shows the cascade geometry and the mesh used for thecalculations of the program INSTHPT with 80 points on the blade onthe upper and the lower side, respectively and 120× 100 meshpoints intotal.
Table 5.3 shows the flow parameters of the calculations and the ex-perimental data. The Reynolds number based on the inlet velocity andthe chord length is 1 400 000 for this flow case [Fransson, 1993]. Y + isabout 1.5 close to the leading edge for the calculations conducted withINSTHPT.
The cascade is forced into a pure torsional vibration mode of a fre-quency of 550 Hz and a amplitude of 0.1 with an interblade phase angleof 180. The used steady state initial solution is characterized by an in-cidence angle of 4 and an inlet Mach number of 0.5. As the Figures 5.10and 5.11 show the results for the unsteady amplitude and phase basedon the frequency of the blade motion of the of the surface pressure dis-tribution are in reasonable agreement with experiments done by [Bolcsand Fransson, 1986]. The results are shown for the pressure side (LS)and the suction side (US) of the blade.
64 Computational Fluid Dynamics

Figure 5.10. Amplitude of the un-steady pressure over chord for stan-dard configuration 5, interblade phaseangle of 180: comparison AUSM -experiments.
Figure 5.11. Phase of the unsteadypressure over chord for standard con-figuration 5, interblade phase angleof 180: comparison AUSM - experi-ments.
Computational Fluid Dynamics 65

66 Computational Fluid Dynamics

6 Applications in Physics
6.1 An Universal Scaling Law for Atomic Diffusion inCondensed MatterMikhail DzugutovCenter for Parallel Computers, KTH
Atomic diffusion in condensed matter has so far eluded a unifying quan-titative description. Although explicit expressions have been obtainedfor the transport coefficients of the dense fluid of hard spheres, theirconsistent generalization to the rich variety of atomic structures aris-ing at high densities remains a formidable challenge for kinetic theory.Atomic dynamics in condensed phases is dominated by the so-called cageeffect whereby the diffusive atomic motions are coupled to the structuralrelaxations. Due to the pronounced structural correlations, each atomfinds itself in a cage formed by the immediate neighbors, and its dif-fusive motion is effected by local density fluctuations transforming thesurrounding atomic configuration. The kinetic theory description of thisdiffusion mechanism represent a generalization of the Enskog theory forthe dense hard-sphere fluid; to apply this description to a real system,a hard-sphere model is required. However, the structural diversity ofcondensed atomic phases, and the dependence of this diversity on thedetails of interatomic interactions, impose a fundamental limitation onthe range over which the hard spheres can adequately describe real sys-tems.
In this study, molecular dynamics (MD) simulation was employed totest a new approach which is based on the following two arguments.
(i) The time-scale of atomic dynamics at high densities is defined bythe Enskog frequency of binary collisions:
ΓE = 4σ2g(σ)ρ√
πkBT/m (6.1)
where m and σ are the atomic mass and the hard sphere diameter,respectively; g(σ), the value of the radial distribution function at thecontact distance, represents the density of the immediate neighbors (σ isdefined as the position of the first maximum of g(r)). Using σ and Γ−1
E ,respectively, as natural units of length and time, the diffusion coefficientD can be expressed in a dimensionless form as D∗ = DΓ−1
E σ−2.(ii) The frequency of the local structural relaxations, which defines
the rate of the cage diffusion, is obviously proportional to the numberof accessible configurations (per atom). In an equilibrium system, thisscales as eS , where S is the excess entropy; hence, eS and D∗ must beconnected by a universal linear relationship.
Applications in Physics 67

Figure 6.1. Three liquid models examined in the Molecular Dynamics simulation.(Top left) The pair potentials. (Top right) Arrhenius plot for constant-density diffusionvariations in IC, HX and LJ liquids. (Bottom) radial distribution functions, as calculatedat the reduced density ρ = 0.84 and the temperature T = 0.7. Dashed line, the Lennard-Jones system (LJ). Solid line, IC liquid, possessing a predominantly icosahedral localorder. Chain-dotted line, HX liquid, where local order is topologically related to theprimitive hexagonal lattice.
68 Applications in Physics

Figure 6.2. The scaled diffusion co-efficient D∗ = Γ−1
Eσ−2, for various
models, as a function of the excessentropy, in the pair approximation,Equation 6.2 where ΓE is the Enskogcollision frequency, Equation 6.1), andσ is the effective hard-sphere diame-ter. Dashed line, Equation 6.3; chain-dotted line, Enskog result for hardspheres.
We also assume here that S can be restricted to the two-particle ap-proximation:
S2 = −2πρ
∫ ∞
0
g(r)ln[g(r)]− [g(r) − 1]r2dr (6.2)
We tested three systems which represent distinct prototypes of liq-uid structure and exhibit dramatic variations in the atomic diffusivities(Figure 6.1). Other systems examined were two liquid metals, Cu andPb, as well as the hard-sphere fluid. Figure 6.2, shows that for all theseliquids diffusivity can be described by a simple scaling law:
D∗ = 0.049 eS2 (6.3)
This scaling law was also found to be valid for a two-component LJliquid, as well as for the diffusivity of Ag+ in solid ionic conductor α−AgI.
We conclude that the relationship between D and g(r), as expressedby Equations (6.1) to (6.3), is universal for equilibrium condensed atomicsystems, both liquid and solid, regardless of the structures, interatomicinteraction potentials or the microscopic dynamical mechanisms involved.D can thus be calculated from the diffraction data in those cases where itsdirect measurement is not possible, or inferred from a structural model.A more general conclusion is that the rate of exploration of the con-
Applications in Physics 69

figurational space is controlled by the excess entropy. For details see[Dzugutov, 1996c] and [Dzugutov, 1996b].
This study was supported by the Swedish Natural Science ResearchCouncil (NFR).
6.2 Atomic Kinetics and Dynamical Phason Disorder in aQuasicrystal
Mikhail DzugutovCenter for Parallel Computers, KTH
Quasicrystals possess a generic form of structural relaxation dynamicsassociated with incommensurate or phason degrees of freedom. A spa-tially uniform shift along a phason coordinate results in a set of configu-rations which belong to the same local isomorphism class as the originalconfiguration. Therefore, such shift represents a continuous macroscopicsymmetry, and its breaking by introducing a non-uniform variation inthe phase space generates associated dynamical modes (phasons). Butthe microscopic mechanisms of the phason dynamics are still unclear. Ifone postulates that a quasicrystal relaxes the phason strain by the virtueof energy minimization, a virtually infinite range of interatomic interac-tions has to be assumed. Alternatively, the phason dynamics can arise inthe entropic scenario as postulated by random tiling model. It assumesthat phason flips connect energetically degenerate structural units, thusproducing a large configurational entropy with the maximum at zerophason strain. This process can stabilize the quasicrystal long-rangeorder as long as the rate of phason dynamics is high enough.
An important aspect of phason dynamics is that the local atomic mo-tions involved give rise to a novel form of diffusion, which, due to smallactivation energy of a phason flip, is expected to be much faster than theconventional vacancy driven diffusion in crystals and glasses. An intel-lectual appeal of this phenomenon is in that the transparent geometry ofphason fluctuations provides a clear interpretation of the relevant modesin terms of local atomic motion. In this study, phason mediated struc-tural relaxations as well as the related atomic diffusion were observed ina realistic 3D model of a dodecagonal quasicrystal simulated by Molecu-lar Dynamics (MD). The model is based on a short-range pair potential,conceived to favor icosahedral local order in the first coordination shell.The quasicrystal has been formed by this model from the liquid stateas it was undercooled at constant density ρ = 0.84 below its apparentmelting point at T = 0.5 (the Lennard-Jones reduced units are adoptedin this simulation). It represents a uniaxial stacked layered structurewith 12-fold symmetry. Figure 6.3 depicts the projected configuration ofa structural layer; It is composed of CN14 blocks (hexagonal antiprisms)which are seen at the projection as dodecagonal rings. By connecting theadjacent centers of these rings, a characteristic tiling with 12-fold sym-
70 Applications in Physics

metry is produced. Besides squares and triangles, characteristic of therelated Frank-Kasper phases, it includes 30 rhombi and 3-fold hexagons(shields). The structure observed demonstrates a close consistency withthe real dodecagonal phases formed by Ni-Cr and V-Ni-Si alloys.
Figure 6.3 presents the dynamics which the model displays at reducedtemperature T = 0.48, while remaining in apparent thermodynamicalequilibrium. The principal observation is a considerable rate of sponta-neous local structural rearrangements resulting in tile flips, which canbe seen as mutual transformations of the rhombi and the shields. Al-though changing the tiling dramatically, this dynamics does not violateits global 12-fold symmetry. These flips can be analyzed by compar-ing with the perfect 12-fold tiling patterns as produced by projectionmethod. This analysis associates the rhombus-shield flip with a fluctu-ation in the boundary of the acceptance region, defined in the phasonspace. Thus, the transformations observed may be interpreted as pha-son dynamics. Figure 6.4 demonstrates that the two structures shown inFigure 6.3 are entirely coherent and possess the same long-range order.
We also observe that the phason dynamics is coupled with the dy-namics of vacancies the presence of which one can see in Figure 6.3. Theprohibitingly high energy cost of the vacancy creation implies that thephason dynamics must preserve their number. Note that both of thetwo structural blocks connected by the phason flip contain an octahe-dral configuration. In the transformation observed, this element, whichmay be regarded as a defect in otherwise tetrahedrally packed structure,is topologically moved from its location in the center of the rhombus tothe center of the shield. Thus, the flip, preserving both vacancies andoctahedra, is energetically degenerate.
The phason flips described recurrently involve each atom in an uncor-related hopping, which gives rise to the unbounded diffusion. For suf-ficiently large times, the atomic motion is a random walk with asymp-totically linear mean square displacement. The temperature variationof the estimated diffusion coefficient demonstrates Arrhenius behaviorin the temperature domain that corresponds to the stable quasicrystalphase. This can be regarded as an indication that the activation energyfor the diffusion mechanism involved does not change with temperature. This result is the first
observation of phason dynamicsin a 3D quasicrystal
This result is the first observation of phason dynamics in a 3D qua-sicrystal. It provides important insight into the microscopic mechanismof this phenomenon. The energetically degenerate phason dynamics ob-served indicates that quasicrystals represent a special phase of condensedmatter where the long-range order is stabilized by the entropy. For de-tails see [Dzugutov, 1996a], [Dzugutov and Phillips, 1995] and [Dzugutov,1995].
Applications in Physics 71

Figure 6.3. Two configurations ofa structural layer separated by 106
timesteps. Tiling is produced by con-necting the adjacent centers of appar-ent dodecagonal rings.
Figure 6.4. Two sets of symbolsrepresent superposition of the twoconfigurations of a layer depicted inFigure 6.3
72 Applications in Physics

6.3 Electric and Magnetic Non-Linear Properties Obtainedwith Response Theory
Patrick Norman, Dan Jonsson, Olav Vahtras, Hans AgrenDepartment of Physics, Linkoping University
The basic goal of our current research is to relate the appearance of thestrong non-linearity with both electronic and geometric structures ofmaterials, with the ultimate goal in mind to design optically active andconducting devices through the use of molecular modeling and computa-tions. We focus on quantum first-principle methods, since their inherentfulfillments of rigorous computational criteria are very useful for pin-pointing specific properties and functions of particular chemical groupsand substituents. The response theory methods have been developedin a broad Scandinavian collaboration and is now routinely applied to anumber of non-linear properties, be it magnetic and electric, internal andexternal, time-dependent and time-independent, etc. Some of these areexotic, others have a very strong potential for technical applications andmaterial science. Our efforts are collected into the dalton [Helgakeret al., 199X] quantum chemistry program, which has been used for allthe presented calculations. In Linkoping we have, so far, focused ourapplications on the following three non-linear effects.
• Materials with strong second and third harmonic generations, SHGand THG. Such materials can be used for doubling, respectively,tripling of laser frequencies, introducing laser technology into the blueand near-UV wavelength regions. The SHG and THG capabilities aredirectly connected with hyperpolarizability tensors that we now cancompute for polymeric compounds, metal-polymer interfaces, buckymolecules and solid charge transfer complexes, all with exceptionalproperties in this area. The industrial impact of UV lasers in the elec-tronic industry is obvious, only to mention the possibility to manufac-ture extremely compact storage disks (CDs). We use here the doubledirect random-phase approximation (RPA) and also the quadratic andcubic response extensions of RPA.
• Electro-optic and magneto-optic Kerr effects. These effects, connectedto the electric, respectively magnetic, hyperpolarizabilities and suscep-tibilities, describe the action of external fields (electric or magnetic)on the polarization directions of light. A switch (or not) of the polar-ization plane gives an efficient representation of binary 0:s or 1:s, andKerr compounds, like, probably, some first row transition metal alloys,therefore hold great promises as materials in future optical computers.
• Strong charge transfer complexes with potential use as optical switches.Simulations of 1-dimensional charge transfer complex for which astrong in-plane longitudal excitation dominates the hyperpolarizabil-ity, are now being extended to 2- and 3-dimensional charge-transfer
Applications in Physics 73

compounds with several donors and/or acceptors connected to thering systems (so-called quadrupolar and octopolar molecules). Dueto competing in-plane orthogonal excitations and ”phase-matching”these are suitable non-linear materials. With reaction field responsemodel calculations the critical role of the surrounding solvent canbe monitored. The calculations of non-linear electric properties havemostly focussed on hyperpolarizabilities that connect directly to mea-sured non-linear susceptibilities. These quantities play a key role inthe understanding of non-linear optical response of molecules. Themolecular systems that we have accessed fall largely into three cate-gories; small systems, such as neon isoelectronic hydrides, for whichextensive computational tests on electron correlation, basis sets, roleof frequency dependence and vibrational dependence have been ac-complished; oligomer sequences, in particular polyenes and polyenesfor which the length dependence and convergence to the polymer valueof the hyperpolarizability is of interest, and; special donor-acceptorcompounds, in particular disubstituted benzenes, for which the chargetransfer character of the HOMO-LUMO (highest occupied to lowestunoccupied molecular orbital) excitations implies large polarizabilitiesand hyperpolarizabilities.
Why do we need parallel computing?
The development of ab initio methods is driven by on one hand thetheoretical improvements and on the other hand the development of morepowerful computing resources and is aiming at an improved descriptionof large scale systems. Solving the Schrodinger equation for a moleculeat the ab initio level forces us to compute a vast number of integrals forthe two-electron Coulomb operator. Traditionally a quantum chemistrycalculation is preceded by computing all the needed integrals and storingthem on disk. However, since the number of integrals grows as thenumber of basis functions to the fourth power we soon end up with aproblem of storage. As the speed of computers has drastically increasedwe have been lead to a different (direct) strategy, namely to recomputethe integrals whenever needed, for which the efficiency is determined bythe ratio of I/O and computing speed. The former method is at presentfaster but as mentioned it suffers from the disk space deficiency. Thus byBy combining direct methods
with parallel computing, we notonly avoid the bottleneck of diskspace but also drasticallyimprove the speed of large-scalecalculations
combining direct methods with parallel computing, we not only avoid thebottleneck of disk space but also drastically improve the speed of large-scale calculations. Furthermore, the CPU demanding tasks are stronglylocalized to a few subroutines so that our parallel implementation isrelatively easy to perform and, in addition, will be very effective, cfTable 6.1. Recently, we have presented this technique by calculatingthe polarizability and second hyperpolarizability at the RPA (RandomPhase Approximation) level for a number of π-conjugated compounds.
74 Applications in Physics

Table 6.1. Parallel efficiency for thepolyacene calculation described be-low. The number of nodes is the totalnumber of nodes (including the mas-ter), and the number of slaves is thisnumber minus one.
# rings # nodes Slave efficiency Total efficiency Theoretical
1 9 98.5 85.2 88.92 8 99.1 86.8 87.53 9 99.0 87.5 88.94 8 99.1 86.5 87.55 8 99.2 86.6 87.56 10 98.9 88.8 90.0
As a selection of recent publications we would like to refer to [Agrenet al., 1993, Norman et al., 1996b, Norman et al., 1996a, Jonsson et al.,1996]. More information can be found at our web site:http://www.ifm.liu.se/Compphys/html/publicat.html
Recent results with parallel computations
Trans-polyenes
Polarizability and hyperpolarizability calculations of the first excited Bu
state are carried out as a first choice for polyenes, since the 1Bu state,determining the energy gap, presents the main feature of the absorptionspectrum and plays a key role in understanding the mechanism of theoptical linearity and nonlinearity. A good description of the 1Ag→1Bu
transition is a requirement for reliable polarizability calculations and itis therefore important to compare calculated excitation energies withexperiment. It has been shown that the excitation energies of the 1Bu
states for the short polyenes (from C2H2 to C8H10) can be accurately de-termined at the RPA level using optimized geometries. But we see fromFigure 6.5 that also polymeric geometries predict excitation energies inexcellent agreement with the experimental data (included as crosses) forthose molecules as well as for C10H12 and C12H14. We observe that thelength dependence of the energy gap is well described by a power law,here with Eg∝N−0.4, cf. Figure 6.5.
A power dependence with α1Buxx ∝N1.8 is found for the excited state
polarizability. Compared to the ground state polarizability, α1Agxx , an en-
hancement of approximately a factor of 2 is found for all members of thepolyenes. This appears as an additive shift in the logarithmic plot, seeFigure 6.5. It is known that for polyenes α
1Agxx is dominated by the vir-
tual transition from the ground state to the excited 1Bu state. Althoughsuch a transition is still of importance for the excited state polarizabil-ity, α1Bu
xx , it would only provide a negative contribution to the final valueof α1Bu
xx due to the negative transition energy, cf. Equation (6.5). Thelarge positive values for α1Bu
xx thus indicate that the transition momentsbetween the reference 1Bu state and excited nAg states are of the sameorder as that between 1Ag and 1Bu. A major contributor to the ground
Applications in Physics 75

Figure 6.5. Gap energy (upper) andpolarizabilities (lower) versus numberof ethene units.
0
0.5
1
1.5
2
2.5
3
3.5
4
2 4 6 8 10 12 14 16 18
Fig.1. Ion-ion radial distribution functions for 0.5 NaCl aqueous solution
Na-Cl Na-Na
Cl-Cl
2 3 4 5 6 7 8 9
102
103
104
105
106
pola
rizab
ility
/sec
ond
hype
rpol
ariz
abili
ty (
a.u.
)
number ethene units
76 Applications in Physics

state hyperpolarizability is the transition route
1Ag → 1Bu → mAg → 1Bu → 1Ag. (6.4)
All the transition channels contributing to α1Buxx are included here and
since the RPA method already has provided ground state polarizabilityand hyperpolarizability values for polyenes that are in excellent agree-ment with experimental gas phase data we believe that the excited statepolarizability, α1Bu
xx , also should be well described at this level.
αr0,r1(ω0; ω1) = P (0, 1)∑f 6=0
µr00fµr1
f0
ωf0 − ω1(6.5)
Also the ground state hyperpolarizability is shown in Figure 6.5 dis-playing a power form dependence of γ
1Agxxxx∝N4.2.
Polyacenes
Much theoretical work have been devoted to linear conjugated systemsfor which the size dependence of non-linear response and the relationshipbetween the optical properties and electronic and geometrical structureparameters have been of special interest. Although the gap in size be-tween systems that are manageable for theoretical investigations andthose of technical interest has been narrowing, the applicability of abinitio calculations of non-linear optical responses is still restricted bythe rather large basis sets needed. Because of the size of the constitut-ing units, the polyacenes belong to the category of interesting systems,which, except for the first three members, has been out of reach for abinitio calculations of its non-linear properties. This is unfortunate fromthe point of view that many promising optically active materials containbenzene rings as building blocks, often connected by special bridge unitsand terminated by groups of donor/acceptor character. It is thereforedesirable to investigate further the polyacenes as model compounds andcompare, for example, with the linear polyenes for which a great dealalready has been learned.
We here demonstrate that with an effective parallel implementationof non-linear response theory at the random phase approximation level,calculations of polarizabilities and hyperpolarizabilities can be applied Calculations of polarizabilities
and hyperpolarizabilities can beapplied to systems that aresufficiently large to be oftechnical interest
to systems that are sufficiently large to be of technical interest. Apartfrom directly predicting properties, these calculations make it possibleto calibrate trends from already established semi-empirical techniques.The polarizability and the second hyperpolarizability of the moleculesin the polyacene series, chosen here for illustration, were found to scaleas N1.4 and N3.5, respectively, where N is the number of benzene units,see Figure 6.6. These scalings are weaker than those predicted for thelinear polyenes in terms of ethylene units.
Applications in Physics 77

Figure 6.6. Gap energy (upper) andpolarizabilities (lower) versus numberof benzene units.
1 2 3 4 5 610
0
102
104
106
108
number benzene units
pola
rizab
ilitie
s (a
.u.)
1 2 3
4
5
6
number benzene units
ener
gy g
ap (
eV)
6.4 Finite Element Modeling of Acoustic Emission
Anna SundstromDepartment of Solid Mechanics, KTH
As a part of an ongoing research project directed into analysis of AcousticEmission as a method for quantitative measurements of damage evolu-tion in structural materials, a Masters Thesis project [Sundstrom, 1996]was carried out on finite element modeling of wave propagation in com-posite laminates.
Acoustic emission is the term used to describe the spontaneous releaseof transient elastic waves in solids caused by sudden localized changesin stress. In order to determine the wave propagation characteristicsthat result from micro crack initiation in composite laminates, accuratenumerical models must be developed. In the present work two differ-ent models for transverse micro crack initiation in composite laminateshave been investigated, one with a crack through the middle layers ofthe composite and the other one with an edge crack. The calculationshave been carried out by the Finite Element program Spectrum on theIBM SP-2. The numerical results have been analyzed in terms of wavepropagation modes and frequency content.
78 Applications in Physics

The finite element code Spectrum
Spectrum is a commercial finite element solver designed for the analysisof multiple and interacting physical phenomena. It supports static andtransient solutions, linear and nonlinear structures, a comprehensive setof material models, compressible and incompressible flows, turbulencemodels and ALE fluid mesh movement.
One of the most important objectives of the Spectrum program isto develop a capability for large-scale engineering simulations. In addi-tion to the multiphysics capabilities, the Spectrum Solver is designed tomake maximal use of high-performance parallel computer systems. Thesame architecture that supports multiple physics simulation naturallyand cleanly supports independent and parallel computation.
To enable higher levels of parallelism and to achieve better load bal-ancing of the parallel computation, Spectrum also incorporates an au-tomatic domain decomposition feature. Individual regions can be sub-divided into subdomains to any user specified level. Spectrum employsa spatial decomposition algorithm called Recursive Spectral Bisection(RSB). Simply stated, each physical region (or subdomain thereof) canbe run in parallel on separate processors. Therefore, the entire work The entire work loads of each
subdomain are run in parallelloads of each subdomain are run in parallel, not just part of the compu-tations (i.e. not just the linear equation solver).
6.5 An Exact Absorbing Boundary Condition for 3D ThinStructuresJiasu Cao, Sailing HeDepartment of Electromagnetic Theory, KTH
In many scattering computations (in particular, for time-domain three-dimensional scattering), it is essential to use a mesh of limited size andapply proper boundary conditions on the boundaries of the mesh. Allthe widely used absorbing boundary conditions are approximate condi-tions. They may give perfect absorption at a certain angle of incidence,but they are far from perfect for many other angles, in particular, nearthe grazing angle. In some scattering situations, such as a point sourceclosely above a thin structure, the accuracy of the absorbing boundaryconditions is crucial, and a local approximation of the absorbing bound-ary condition may not give a reliable numerical result. Thus, an exactabsorbing boundary condition is desirable in these situations. This hasbeen demonstrated by numerical examples.
The exact absorbing boundary condition is in fact a by-product of thethree-dimensional wave-splitting formalism for time-domain scatteringproblems. Wave-splitting is the decomposition of the total field into twocomponents which propagate in opposite directions in a homogeneousregion. The two opposite propagating waves obey down-going and up-going wave conditions respectively, which are exact absorbing boundary
Applications in Physics 79

conditions, because so called down-going, or up-going, means propagat-ing without any reflection. By formal Taylor expansion, different ordersof local approximations can be obtained from the exact absorbing bound-ary condition.
We have implemented the exact absorbing boundary condition on theConnection Machine CM200 and conducted several numerical simula-tions for both non-dispersive and dispersive thin structures. The resultsshow that using the exact conditions can bring remarkable improve-ment, comparing using the conventional second order local approxima-tion, though it’s more time consuming to use the exact conditions. Forfurther details see [Cao and He, 1996].
6.6 The Continuation of Transient Data for a HyperbolicEquation in a 3D Inhomogeneous Half-Space
Jiasu Cao, Sailing HeDepartment of Electromagnetic Theory, KTH
For any time-domain layer-stripping approach to an inverse problem,one has to propagate the transient wave field (the Dirichlet data) andits normal derivative (the Neumann data) to the next layer below (layerby layer) starting from the surface data which can be obtained fromexperimental measurements. In the present project we treat such a datacontinuation problem for the second order hyperbolic equation.
We have considered the ill-posed problem of the time-domain datacontinuation for a second order hyperbolic equation in a 3D inhomo-geneous half-space. Two different approaches, namely the local con-tinuation approach and the wave-splitting approach, have been used topropagate the surface data (the fields and their normal derivatives) tothe data at deeper planes. A local continuation theorem has been given,and its finite-difference form has been used for the data continuation. Toobtain a stable continuation result, a regularization process at each timeat each plane is necessary in the local continuation approach. The wave-splitting approach uses larger transverse spatial domain of dependence,and gives reasonably stable results even without any additional smooth-ing process. Both methods have been implemented on the ConnectionMachine CM200. Also comparison has been made between the local con-tinuation approach, the wave-splitting approach, and the finite differencetime domain method by several numerical simulations of acoustic wavepropagation. For further details see [Cao and He, 199X].
80 Applications in Physics
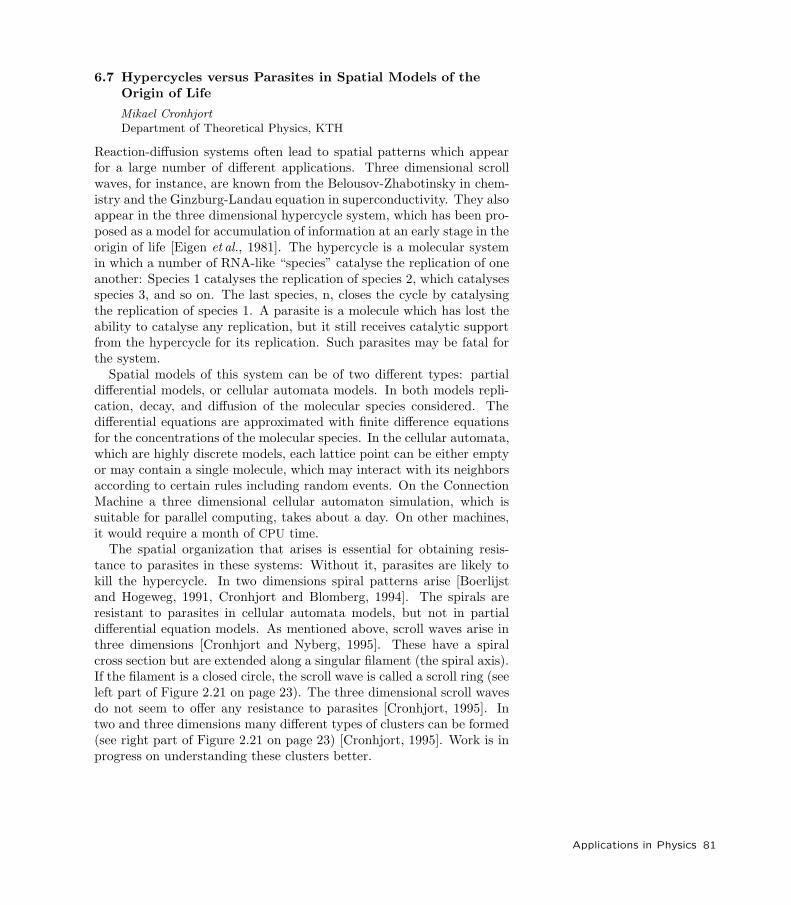
6.7 Hypercycles versus Parasites in Spatial Models of theOrigin of Life
Mikael CronhjortDepartment of Theoretical Physics, KTH
Reaction-diffusion systems often lead to spatial patterns which appearfor a large number of different applications. Three dimensional scrollwaves, for instance, are known from the Belousov-Zhabotinsky in chem-istry and the Ginzburg-Landau equation in superconductivity. They alsoappear in the three dimensional hypercycle system, which has been pro-posed as a model for accumulation of information at an early stage in theorigin of life [Eigen et al., 1981]. The hypercycle is a molecular systemin which a number of RNA-like “species” catalyse the replication of oneanother: Species 1 catalyses the replication of species 2, which catalysesspecies 3, and so on. The last species, n, closes the cycle by catalysingthe replication of species 1. A parasite is a molecule which has lost theability to catalyse any replication, but it still receives catalytic supportfrom the hypercycle for its replication. Such parasites may be fatal forthe system.
Spatial models of this system can be of two different types: partialdifferential models, or cellular automata models. In both models repli-cation, decay, and diffusion of the molecular species considered. Thedifferential equations are approximated with finite difference equationsfor the concentrations of the molecular species. In the cellular automata,which are highly discrete models, each lattice point can be either emptyor may contain a single molecule, which may interact with its neighborsaccording to certain rules including random events. On the ConnectionMachine a three dimensional cellular automaton simulation, which issuitable for parallel computing, takes about a day. On other machines,it would require a month of CPU time.
The spatial organization that arises is essential for obtaining resis-tance to parasites in these systems: Without it, parasites are likely tokill the hypercycle. In two dimensions spiral patterns arise [Boerlijstand Hogeweg, 1991, Cronhjort and Blomberg, 1994]. The spirals areresistant to parasites in cellular automata models, but not in partialdifferential equation models. As mentioned above, scroll waves arise inthree dimensions [Cronhjort and Nyberg, 1995]. These have a spiralcross section but are extended along a singular filament (the spiral axis).If the filament is a closed circle, the scroll wave is called a scroll ring (seeleft part of Figure 2.21 on page 23). The three dimensional scroll wavesdo not seem to offer any resistance to parasites [Cronhjort, 1995]. Intwo and three dimensions many different types of clusters can be formed(see right part of Figure 2.21 on page 23) [Cronhjort, 1995]. Work is inprogress on understanding these clusters better.
Applications in Physics 81

Figure 6.7. In the figure, the sys-tem spontaneously forms a two cellconvection. The lattice size is actu-ally 128 × 64 sites, and the length ofeach arrow is proportional to the linearmomentum averaged over several sites.
6.8 A Coupled Map Lattice Model of Self-Propelling Particles
Jan HemmingssonDepartment of Physics, Linkoping University
Inspired by the spatial patterns formed by organisms in nature, we havetried to design a toy model that would be able to reproduce some ofthese effects. Examples of such collective behavior where the patternsare much larger than the participating particles range from birds flyingin formation to swimming microorganisms [Childress, 1981].
Our starting point is systems of granular media on air table, wherethe energy is actually dissipated in the collisions. Our numerical modelis a coupled map lattice and resembles the popular lattice gas modelsthat have been widely used the last few years [Frisch et al., 1986, Frischet al., 1987]. Instead of simulating discrete particles, the model treatsdensities of mass. It has three parameters; viscosity, acceleration anddispersion. Since energy is really dissipated in the collisions, energy hasto be reintroduced by acceleration. The acceleration of each particle istaken to be in the direction of its velocity, and can be motivated bythe disordered energy input by shaking or stirring of granular media.However, our approach is purely phenomenological, and we do not in-tend to simulate any specific system. For details of the model, pleasesee [Hemmingsson, 1995].
The simulations were performed on a triangular lattice, and to makethe reflecting boundaries as symmetric as possible, they were given ahexagonal shape. What happens after the system has been randomlyinitiated, is that convection can be found, see Figure 6.7. Above someenergy input, the convection seems to be instable, just as one wouldexpect.
This project was supported by the Swedish Institute and the SwedishNatural Research Council (NFR).
82 Applications in Physics

6.9 Monte Carlo Studies of the Dynamics of Re-Entrant IsingSpin Glasses
Jan-Olov AnderssonNordita, DenmarkTomas Jonsson, Johan MattssonSolid State Physics, Centre of Technology, Uppsala University
Background
Spin glasses are magnetic system with two fundamental properties: ran-domness and frustration. Randomness in the sense that the interactionsbetween the magnetic moments (the ’spins’) of the magnetic atoms, i.e.can be either ferromagnetic or antiferromagnetic in a random fashion.Frustration can be illustrated by the fact that for three spins with an an-tiferromagnetic coupling there is no way to satisfy all bonds at the sametime. This leads to a nontrivial energy landscape. For a spin glass theenergy landscape gets extremely complicated which leads to very slowdynamics. The slow dynamics is seen by the fact that the magnetizationis different when cooling in an external magnetic field, the field cooled(fc) procedure, from cooling in a zero field and then apply the field, thezero field cooled (zfc) procedure.
Spin glass behavior has been found experimentally for a number of ma-terials, but basically there are two major types of spin glasses. Metallicspin glasses consists of a small concentration of magnetic atoms (like Fe,Cr or Mn) in a nonmagnetic host (like Cu, Ag or Au). The randomnessis due to the random positions of the spins and the RKKY interactionbetween the spins. The RKKY interaction oscillates with distance Rbetween the spins and the magnitude of the oscillation decays as R−3.In insulating spin glasses the magnetic moments are positioned regularlybut by using a mixture of magnetic atoms, e.g. Fe and Mn, the interac-tions are different for Fe-Fe, Fe-Mn and Mn-Mn, which can lead to spinglass behavior.
The standard model for a spin glass, the Edwards-Anderson (EA)model [Edwards and Anderson, 1975] leaves out the microscopic details,but still captures the essential points of the physics in question. TheHamiltonian considered is
H = −12
∑i,j
JijSiSj + H∑
i
Si, (6.6)
where Jij is the interaction between spin i and spin j. The simplificationin the model is (a) to put the spins onto the sites of a regular latticeand (b) to introduce the disorder by choosing a suitable distributionP (Jij) of exchange interactions. EA’s choice is a Gaussian bond distri-bution P (Jij) = (1/
√2πJ) exp(−J2
ij/J2) with zero mean and varianceJ2. Normally, for practical reasons, the variance is set equal to 1. Theinteractions can be either long or short ranged. In the latter case, only
Applications in Physics 83

nearest-neighbor interactions are considered. For insulating spin glassesthe ’±J ’ probability distribution , i.e. the bonds are +J with a proba-bility p (normally p = 0.5) or −J with the probability 1 − p, is slightlymore realistic.
The mean field (MF) solution, based on the EA model, turned out tobe very far from trivial and was solved around 1980. Since MF is onlycorrect for high spatial dimensions (above 8 in the spin glass case) somequalitative understanding can be gained from it. In order to study thebehavior at physical dimensions numerical methods have to be used.
Less is known about the behavior in low dimensions. No exact solutionexists in two or three dimensions, but renormalization group arguments[McMillan, 1984, Bray and Moore, 1985] supported by numerical resultsare the basis for the droplet model [Fisher and Huse, 1988, Koper andHilhorst, 1988] which in contrast to the mean field solution has onlytwo thermodynamical states, related by a global spin reversal and as aconsequence there exists no spin glass phase in non-zero magnetic fieldaccording to this model.
When considering competition between spin glass and ferromagneticor antiferromagnetic order even less is known. In the SK model, forIsing spins with a Gaussian bond distribution with J0/J < 1 one hasa spin glass state without spontaneous magnetization Ms. For J0/J1,the system goes with decreasing temperature first into ferromagneticstate and then into a spin glass state with replica symmetry breaking.Since this state has a non-zero spontaneous magnetization it is sometimescalled a ’mixed’ state or a ’magnetized spin glass’
Whether the ’mixed’ phase exists for low-dimensional samples is notentirely clear. Neutron-scattering results on several re-entrant ferromag-nets have shown that, within experimental resolution, the ferromagneticBragg scattering, present in the ferromagnetic phase, disappears at lowtemperatures [Maletta et al., 1982]. It can from this be concluded thattrue reentrance may occur in low-dimensional magnets. Recently it wasshown for a re-entrant ferromagnet that there exists a linear responseregion at low temperatures and a dynamic scaling analysis in that regionindicate a transition to a spin glass phase [Jonason et al., 1996, Jonasonet al., 199X]. However, neutron depolarization experiments on reentrantferromagnets suggest a randomly canted ferromagnet rather than a purespin glass at low temperatures [Mirebeau et al., 1990].
Several experimental observations of re-entrance have been obtainedduring the last years, but the results have in some cases been attributedto long range interactions or from transverse spin components [Regerand Young, 1989]. Our purpose has therefore been to show that thequalitative features found in the experiments are evident also as theresults of numerical simulations on the CM200 of a nearest-neighborinteraction Ising model.
84 Applications in Physics

Ac field dependence of the Ac susceptibility
We first studied the ac- and dc-field dependence (Ha = Hdc+Hacsin(ωt))of the ac susceptibility. In the case of Hdc = 0, the results were foundto be in agreement with corresponding zfc simulations and in qualitativeagreement with experimental results. Although similar results have beenobtained in earlier simulations this shows that the results are reasonableand that therefore the new results are also reliable. At high temperaturesχ(T ) follows a Curie law behavior, with χ′(T ) = 1/T and χ′′(T ) = 0 andχ being independent of frequency, indications of equilibrium. As thetemperature is lowered, χ′ departs from Curie behavior and χ′′ starts togrow. The temperature at which 1/ω = teq , where teq is the equilibrationtime, defines a freezing temperature Tf(ω) and can be identified fromeither the peak in χ′(T ) or the inflection point in χ′′(T ). Tf decreaseswith decreasing ω, just as can be expected from critical slowing down,t ∝ (T − Tg)−zν . Using our data, we find Tg ≈ 1.0 and zν ≈ 9.1,which is in reasonable agreement with earlier determinations of transitiontemperature and exponents using other numerical methods consideringour relatively limited frequency range.
The equilibrium susceptibility is never strictly linear, but is alwaysnonlinear to some extent. However, the non-linearity depends on thetemperature, which implies that for any field there will be an interme-diate field region where the non-linearity is relatively strong and a high-temperature region where the non-linearity is negligible within the statis-tical accuracy. However, for any temperature above the phase transitionor rather any temperature above the freezing temperature correspond-ing to the longest time scale reachable in a simulation or experiment,there is a low-field regime for which linear response almost applies. Onthe other hand, at low temperatures, equilibrium is never reached andin this case the magnetic response is limited by the dynamics whichleads to a time scale dependent linear response regime. In the inset wecan observe the dynamics-limited linear-response regime at low temper-atures and we can also observe that although the susceptibility is neverexactly field independent its field dependence is within the statisticalresolution of our results. The strongest field dependence can be foundnear the freezing temperature, where there is a transition between thedifferent regions. It is interesting to observe the Hac-dependence seen forHac = 0.4, where we clearly observe the effect of the nonlinearity. Sincethe equilibrium susceptibility decreases with field it is not surprisingthat the observed susceptibility is lower than the low-field susceptibilityat high temperatures. However, for low temperatures, the behavior isthe opposite: the susceptibility is higher than the low-field susceptibil-ity. Although at first surprising, this can be understood from the factthat the dynamics-limited susceptibility after its linear regime increaseswith field. Only when Nmc is larger than the equilibration time teq,equilibrium is reached in the simulation and the result is the equilib-
Applications in Physics 85

rium ac susceptibility. However, χ(ω, T ) is close to its quasi equilibriumdynamics value when Nmc >> P .
Dc field dependence of the ac susceptibility
The results in the nonzero Hdc case show a remarkable qualitative agree-ment with experimental results [Mattsson et al., 1993a]. The reason forthe interest in using a non-zero Hdc is that in this way it is possibleto study the quasi equilibrium behavior within a linear response regimeat a non-zero field by using a small Hac to probe the system. At hightemperatures, the susceptibility is independent of frequency but a rela-tively strong Hdc-dependence is seen. The differential field cooled (fc)susceptibility χFC = dMFC/dH can be found to coincide with the acsusceptibility in this region. Not too surprisingly, it can be observed thatthe susceptibility seems to become independent also of Hdc within theexperimental resolution for very large temperatures. More interesting isthe crossover from the frequency-independent susceptibility region to afrequency-dependent and Hdc-independent region.
The results can be understood in the following way. At high temper-atures 1/ω teq and the system has sufficient time find the equilibriumsusceptibility. On the other hand, at low temperatures, 1/ω teq andthe system is unaware of any dc-field which results in a ω-dependentbut Hdc-independent susceptibility. As 1/ω = teq defines the freezingtemperature Tf both components of χ obey χ(Hdc, T, ω) = χ(Hdc =0, T, ω) for T < Tf(Hdc, ω) and χ(Hdc, T, ω) = χ(Hdc, T, ω → 0) forT > Tf (Hdc, ω). In the figures the crossover is seen as a crossover round-ing in the vicinity of Tf (Hdc, ω). However, a much better way is to obtainTf(Hdc, ω) as the crossing between χ(Hdc = 0, ω) and χFC(Hdc).
Aging behavior in a non-zero Hdc
The results of this kind of simulations for Hdc = 0 were presented inearlier papers [Andersson et al., 1992, Andersson et al., 1994]: an inflec-tion point in m(t, tw) and a corresponding maximum in ∂m/∂ log(t) isfound at a time t ≈ tw. We also show that the applicability of thefluctuation-dissipation theorem (see e.g. [Binder and Young, 1986]) onlyto short times t < tw gives evidence for aging behavior being a transi-tion from quasiequilibrium to nonequilibrium behavior. Since the autocorrelation function can only be related to the equilibrium susceptibil-ity in the symmetric bond, zero field case, we do not present the autocorrelation function at all in this paper.
Clearly the aging behavior can still be observed for non-zero Hdc andthe aging behavior is not very much influenced by the field. The ob-served weak Hdc-dependence agrees well with the fact that the ac sus-ceptibility is nearly Hdc-independent at low temperatures, although theHdc-dependence is somewhat stronger in the aging behavior than in theac susceptibility.
86 Applications in Physics

Competition between spin-glass and ferromagnetic order
As was already mentioned, there is a strong non-linearity of the mag-netic response on the applied field (due to the ferromagnetic ordering),even though there exists a low-field region at low temperatures whereχ does not depend on the probing field. Thus ac-susceptibility or zerofield cooled magnetization measurements can reveal inherent zero-fielddynamics of re-entrant ferromagnets at low temperatures, provided thatthe probing field is chosen to be sufficiently small. It also implies thatcare had to be taken in our simulations to ensure that a small enoughHac was used. A cusp in χ′(T ) at relatively high temperatures signalsthe ferromagnetic phase Well below the maxima in χ′(T ) and χ′′(T ),both components of χ(T ) are independent of Hac just as is found inexperiments [Jonason et al., 1996, Jonason et al., 199X]. In other words,for a specific temperature T , there exists a linear response regime suchthat χ is independent of Hac for Hac < Hmax (within the simulationaccuracy of χ). Interestingly enough, the curves for Hac < 0.10 show asecond maximum in χ′′(T ). This is clear evidence of glassy dynamics atlow temperatures but whether these features are evidence of a true spinglass phase cannot be determined from these dynamical data.
Clearly, the maximum is even more evident for lower frequencies, butthe range of time scales available is too small for us to be able to say any-thing about the existence of an equilibrium transition. What can be saidis that the qualitative features of the simulation results are rather simi-lar to the experimental results. There is a very strong Hdc-dependencenear the peaks corresponding to the ferromagnetic transition while theHdc-dependence at low temperatures looks more like the correspondingdependence in the pure spin glass case. Again, this is not a proof fora true spin glass transition, but it is yet another qualitative agreementwith the behavior of experimental spin glasses.
Another typical feature of ordinary spin-glass dynamics is the agingbehavior. The susceptibility is found to have a clear tw-dependence, butin contrast to the ordinary aging behavior there is no inflection pointand no corresponding maximum in the relaxation rate at t ≈ tw.
Competition between spin-glass and antiferromagnetic order
In the antiferromagnetic case, a maximum in the in-phase component χ′
can be identified just as easily as in the J0 = 0 case and in contrast tothe ferromagnetic case, this maximum is not plagued by a very strongnon-linear field dependence. The peak is found at a temperature of theorder 40% (J0/J = −0.7) and 60% (J0/J = −0.8) higher than the peaktemperature found for J0 = 0. The anti-ferromagnetic transition canalso be identified in a small peak in the out-of-phase component χ′′ ata temperature slightly lower than the in-phase peak temperature). Thepeak is clearly visible in the case J0/J = −0.7 while it for J0/J = −0.8is only barely visible due to the rather small signal-to-noise ratio.
Applications in Physics 87

More interesting is the fact that a second peak in χ′′ appears at lowertemperatures, much lower than the in-phase peaks. This can be seenin both cases, a clear signature of the antiferromagnetic to spin-glassre-entrant transition. Just as in the ferromagnetic case, this is of coursenot evidence for an equilibrium transition. In contrast to the resultsin the ferromagnetic case, the normal aging results with a maximum inS(t, tw) at t ≈ tw are found.
6.10 Code Porting and Cluster-Finding Experiences on theIBM SP-2 and the CM200Lawrence V. Thomas1
Department of Numerical Analysis and Computing Science, KTH
Introduction
We describe the initial experiences in porting a code designed mainly forstatistical mechanics problems from the CM200 machine to the IBM SP-2.We also present some early results gleaned from the cluster-finding pro-cess embedded within that code.
It is seldom that a program is so simple that it contains only one typeof parallel computation. The more complex the task of the program, themore likely it contains data, functional (or task) and/or master/slaveparallel computation [Koelbel et al., 1994] in some combined form. Thus,it may be useful to know how a given machine runs programs whichcontain several types of parallel computations.
Another goal of the project is to get code which was originally writ-ten in CM Fortran for the CM200 converted to High Performance Fortran(HPF) to be used on the IBM SP-2 machine. To do so will give some in-sights into the probable difficulties which potential users of the IBM SP-2machine may face when porting their code or writing code for the ma-chine.
The CM200 and the IBM SP-2 may perform quite differently concern-ing processor-to-processor communications. Therefore, this aspect ofthe study will focus on how an interpretation of the multigrid algorithm[Brower et al., 1994] performs on the respective machines.
Software
The CoffeePot program is a statistical mechanics program which hasbeen used to perform simulations for supersymmetry in CHC theory[Klein and Batrouni, 1990]. Its main objective is to simulate manybody systems, such as Ising or Heisenberg magnets, and analyze theirproperties [Thomas, 199X]. Such systems can also be evolved over time
1I would like to thank Jesper Oppelstrup of NADA for all the input and help hehas and continues to provide to this project. Also, a thanks must go out to HelenaStrumpel for all her help and input.
88 Applications in Physics

via Metropolis algorithms [Gould and Tobochnik, 1985, Metropolis andet al., 1953] and exposed to various conditions after their creation, suchas chemical potentials or magnetic fields. These systems are then ana-lyzed for insights into their properties. The CoffeePot program is usedin this study [Thomas, 199X] because of its ability to scale lattices andloops, independently and simultaneously.
A major part of the CoffeePot code is the cluster finding routine. Fig-ure 2.1 on page 11 shows lattices before and after cluster-finding. Itdepicts a system which is typically generated and analyzed by the Cof-feePot program. The program must first find all the clusters of isolated“material”. Then the clusters must be labeled so that they are distinc-tive. Finally the sites within the system can be analyzed for informationpertaining to their various properties.
Results and Analysis
The porting of the code from the CM200 to the IBM SP-2 was successfullycompleted. The code was translated to HPF with a minimal amount ofchanges. Thus, nearly identical codes now run on both machines withno apparent problems. The main task involved in the port was to ridthe CM code of all machine dependent calls (especially libraries) so thatit consisted only of standard Fortran90 code. Besides the “purification”of the code, the typical CM Fortran declarations had to be modified tofit the HPF syntax.
The results generated by the cluster-finder revealed that the costsof communications on smaller Ising model lattices can be said to beminimal-to-negligible (see Figures 6.8 and 6.9). If the communicationscaused by the cluster-finding were more expensive, a greater fall off inthe speedup times presented in Figure 6.8 would be expected.
Conclusions
Programs in standard Fortran 90 can be easily ported from the CM200machine to the IBM SP-2. The task becomes more difficult when thetranslation of libraries are involved. The SP-2 performed better thanexpected for the CoffeePot code which contains a complex mix of dif-ferent data structures and operations. When the timing results fromthe cluster-finding routine were examined, the predicted communicationcost [Koelbel et al., 1994, TMC, 1994, Brower et al., 1994] were not foundto be too expensive. This bodes well for HPF programs running on theIBM SP-2 architecture.
Applications in Physics 89

Figure 6.8. The speedup in thecluster-finding operations on the IBMSP-2 and CM200. The speedup is de-fined as the ratio of the time to per-form operations on the least amountof processors (sequencers) by the timesit takes to perform the same processon increasing amounts of processors(sequencers). Note that, although theCM200 actually performed better interms of overall time to complete a sim-ulation, it seemed to have no speedupwhen going from one sequencer to two.Also, the speedup graph suggests thatthe performance of the algorithm doesnot particularly suffer despite the factthat it is communication intensive onthe IBM SP-2 (as was expected).
Figure 6.9. Timings for the Cof-feePot code for different lattice sizes.It can be seen that for this particu-lar code and implementation we needapproximately 64 nodes of the IBMSP-2 to reach the performance of theCM200.
90 Applications in Physics

6.11 Electronic Structure Calculations for the Physics andChemistry of Surfaces
Lennart Bengtsson, Thomas Mattsson, Johan Stromqvist,Mats Persson, Goran WahnstromDepartment of Applied Physics, CTH
Over the recent years considerable progress has been made in the devel-opments of techniques for the ab initio calculations of the total energyof solids, surfaces and molecules. Plane-wave, pseudopotential methods,based on density functional theory, have now progressed to the pointwhere accurate and reliable calculations can be performed on systemscontaining tens to hundreds of atoms. These methods will have an in-creasing impact on our understanding of the physics and chemistry ofsurfaces. For instance, this expectation has already been confirmed inthe field of surface reaction dynamics by groups in Denmark and UnitedKingdom. They have demonstrated that it is possible to calculate po-tential energy surfaces (PES) for the dissociation of hydrogen moleculeson metal surfaces [Hammer et al., 1994, White et al., 1994]. In partic-ular, this work has provided an answer to the question: “Why Gold isthe noblest metal ?” [Hammer and Norskov, 1995]. We are presentlyapplying these electronic structure methods to the calculation of PESsfor atom- and molecule-surface interactions on the IBM SP-2 machineat PDC. This work is done in close contact and collaboration with thegroup headed by Nørskov at DTU in Denmark.
Before discussing our currents projects concerning surface reactiondynamics and quantum diffusion on surfaces, we will first present somedetails behind the plane-wave pseudopotential method and its imple-mentation. This method calculates the total energy of a many-atomsystem in a super cell geometry by solving iteratively the one-electronKohn-Sham equations in density functional theory using the conjugategradient method in a plane wave basis [Payne et al., 1992]. The ion-core interactions are represented by a pseudopotential and the exchange-correlation energy is treated within the local density approximation. Ourserial version of the code, obtained from Hammer at DTU in Denmark,originates from an effective implementation of the plane-wave pseudopo-tential method that has been developed by Payne and collaborators inCambridge. Based on this serial version of the code, we have developeda coarse-grained parallel version over k-points in the Brilloiun zone usingthe parallel virtual machine (PVM) software. PVM enables us to makemost of the developments of the code on a local cluster of SPARCstationswhile the production runs are done on SP-2. The CPU and primary mem-ory requirements of the calculation are determined essentially by threefactors; number of valence electrons, the high-energy cut-off and thenumber of k-points in the Brillouin zone. Specific examples will be givenbelow.
Applications in Physics 91
Surface Reactions: Eley-Rideal Dynamics
Lennart Bengtsson, Johan Stromqvist, Mats Persson
For more than 70 years gas-surface reactions have generally been classi-fied in terms of two idealized mechanisms. This classification has beenbased on the speculation that an impinging atom or molecule can reactdirectly upon striking an adsorbed species in a process that is referredto as an Eley-Rideal (ER) mechanism or in a process that is referredto as a Langmuir-Hinschelwood (LH) mechanism in which the reactionoccur between species that have become fully accommodated to the sur-face. Already in 1922, Irwin Langmuir stated that “With our increas-ing knowledge of the structure of solid bodies and of the atoms andmolecules which they are built we should now ... gradually begin to gaina clear insight into mechanisms of surface reactions.” But only mostrecently have we begun to gain the expected insight into mechanismsof surface reactions. This progress has been made possible both by thedevelopments of dynamical measurements that goes beyond structuraland kinetic measurements and by the aforementioned development ofcalculational schemes of accurate and reliable PESs that can be used indynamics calculations.
The Eley-Rideal mechanism for the recombinative reaction betweenhydrogen atoms on a Cu surface provides an interesting model case suit-able for a fruitful interplay between experimental and theoretical stud-ies. In collaboration with Bret Jackson, University of Massachusetts,Amherst, Persson have studied the dynamics of this reaction by propa-gating wavepackets in a realistic model where PDC has been crucial forthe success of these calculations, see Section 6.12 on page 94. Thesecalculations have so far been based on empirical PESs and electronicstructure calculations are in progress to construct more convincing andreliable models of the PES. For instance, in order to answer a questionlike: Is the exothermicity in the PES in the entrance channel as theempirical PESs suggest? This project will include an interesting exten-sion of these methods to include spin-polarization in order to treat theformation of the bond between the incoming open shell hydrogen atomwith the adsorbed hydrogen atom.
At this stage, we have calculated the total energy for a (1×1) overlayerof H-atoms adsorbed on a (111) face of a Cu slab with 5 atoms. Thiscalculation takes about 6 minutes per iteration on 10 processors includingthe master with one k-points on each slave and is converged after about40 iterations. Some parts of the program have not yet been parallelizedand the speed-up is so far about a factor 2 below the theoretical value.However, this preliminary calculations makes us confident that we willbe able to handle a larger slab with 12 Cu atoms that is necessary forthe interactions between the periodic images of the H atoms to be small.
92 Applications in Physics

Quantum Tunneling
Thomas Mattsson, Goran Wahnstrom
Hydrogen diffusion on metal surfaces has been subject of great theoret-ical effort over the years with a renewed interest due to recent experi-ments on hydrogen diffusion on nickel surfaces in the low-temperatureregime [Lin and Gomer, 1991, Zhu et al., 1992]. Mainly two differenttechniques have been used and some very recent experimental results byCao, Wong and Zhu [Cao et al., 1996] for H on Ni(111) seem to contradictthe earlier experimental data. The need for highly accurate calculationsis therefore even more important than before.
From a basic physical point of view possible quantum effects are infocus but an improved understanding of metal-hydrogen systems is alsoimportant in more applied oriented areas; as for instance in materialsscience (hydrogen embrittlement and nickel-hydride batteries) and inchemical physics (the behavior of hydrogen in different catalysts).
Our recent work [Mattsson et al., 1993b, Mattsson and Wahnstrom,1995] has successfully shown that it is possible to gain qualitative un-derstanding of the quantum behavior of hydrogen diffusion on metalsurfaces, especially concerning the transition from semi-classical diffu-sion to quantum tunneling when lowering the temperature. However,fundamental questions still remain unsolved, in particular the experi-mentally observed absence of a pronounced isotope effect. Both thetransition temperature between semi-classical and quantum behavior aswell as the magnitude for the diffusion constant in the quantum regimeare found to be similar for both hydrogen and deuterium, but from sim-plified theoretical arguments a large difference is expected due to thedifference in mass between the two isotopes.
The path-centroid formulation for quantum tunneling appears verypromising and presently the main shortcoming is the lack of detailedinformation about the PES. Tunneling behavior is very sensitive to thePES, which makes it crucial to have good knowledge of the potential alsoin regions where experimentally derived information is often both limitedand indirect. The natural way to proceed is first-principles electronstructure calculations. Our calculations [Mattsson et al., 1996] have beenperformed on a dense (1×1) overlayer on a 5 layer slab with one Ni atomin each layer (see Figure 2.22 on page 24). The calculations for the hollowsite have been performed on a single processor using the serial versionwhile the larger number of k-point for the bridge site makes it morebeneficial to use the parallel version. This latter calculation is runningon 14 processors including the master with 2 k-points on each slave.The description of Ni metal involves half-filled d-bands which makes thecalculation more demanding than for instance Cu.
The quantum diffusion calculations performed using the new potentialagrees excellently with experimental results at high temperatures. The
Applications in Physics 93

transition to tunneling diffusion occurs at a diffusion rate of D ≈ 10−15
cm2/s [NAT, 1996], which should be compared with the experimentalvalue D ≈ 10−12 cm2/s [Lin and Gomer, 1991]. Tunneling, as mentionedbefore, is very sensitive to details both in theory and experiments andthe agreement is therefore quite reasonable. The quantum diffusion cal-culations are made in parallel over 32 nodes which makes it possible tocompute the data for four different temperatures simultaneously.
These projects are supported by NFR and by NUTEK/NFR interdisci-plinary materials consortium: Theoretical and Computational MaterialsPhysics and are gratefully acknowledged.
6.12 Quantum Wavepacket Studies of Dynamical Processes atSurfacesMats PerssonDepartment of Applied Physics, CTH
The detailed mechanisms behind a wide variety of important surfacephenomena like surface chemical reactions in heterogeneous catalysis,are most convincingly revealed by dynamical studies of elementary pro-cesses on an atomistic scale. The rapid advances and developments inexperimental methods for the study of such processes like, for instance,state-to-state molecular beam scattering makes this field into a timelysubject for theoretical studies.
In many cases a quantum mechanical description is needed and theassociated complexity makes it often necessary to perform computer sim-ulations of simplified models. We have an ongoing project where westudy elementary dynamical processes at surfaces using pseudospectralmethods for time-dependent propagation of multi-dimensional wavepack-ets on the Connection Machine. In these methods the multi-dimensionalwavefunction is represented on a grid and in each timestep the action ofthe kinetic part of the Hamiltonian on the wavefunction is handled bydiscrete Fourier transform of the wave-function [Rev, 1991]. The lim-iting factors in the computations are then determined by the primarymemory needed to represent the wave function and the speed of the fastFourier transform subroutines. A parallel machine like CM200 is foundto be very well suited to handle these factors.
In collaboration with Bret Jackson at Department of Chemistry, Uni-versity of Massachusetts, I am studying a prototype catalytic surfacereaction which proceeds via an Eley-Rideal pathway; the formation ofhydrogen molecules by the direct reaction of an incoming hydrogen atomwith an adsorbed hydrogen atom on a copper surface. This theoreti-cal study is motivated by recent dynamic measurements of this reac-tion [Rettner, 1992, Rettner and Auerbach, 1995] and its dynamics isof interest, for instance, in understanding the formation of hydrogenmolecules in interstellar space and also for plasma-wall interactions infusion reactors.
94 Applications in Physics

Figure 6.10. Experimental and theo-retical vibrational distributions of theHD product. P (ν) is the probabilityto find the HD molecule in a vibra-tionally excited state ν as the resultof the reaction of an incident D atomwith an adsorbed H atom on the (111)face of Cu. The experimental data,crosses, are taken from [Rettner andAuerbach, 1995] and the circles are theresult from our theory.
0 1 2 3 4 5ν
0.0
0.2
0.4
P(ν
)
We have a developed a flat-surface quantum mechanical model of theEley-Rideal reaction that gives full rovibrational product distributionsand reactive cross-sections [Persson and Jackson, 1995a]. The model isbased on a flat surface approximation for our model potential energysurface which reduces all six degrees of freedom for the two atoms to atractable three-dimensional problem in curvilinear coordinates by intro-ducing three conserved quantities. Our extensive computational stud-ies include the different isotopic combinations of hydrogen and considerthe dependence of the reactive cross-section and the product distribu-tions on the shape of the model potential energy surface, on the stateof the incident atom and on the vibrational state of the adsorbed atom.These results have, for instance, demonstrated the importance of thezero-point motion of the adsorbed reactant on the product rovibrationaldistributions. In particular, our predictions for the isotope effects onthe rovibrational distribution of the HD product [Persson and Jackson,1995b, Jackson and Persson, 1995] have recently been confirmed by astate-to-state molecular beam study by Rettner and Auerbach. Thisconfirmation is demonstrated in Figure 6.10.
The code is written in CM Fortran and we use a CMSSL subroutinefor the time-consuming discrete fast Fourier transform (FFT). For the
Applications in Physics 95

isotopic studies, the grid size of 128×128×256 being used for the H atomsis not sufficient and we are forced to use a grid size of 256×256×256. Thecalculations using this larger grid size requires a bigger machine than the16K CM200 available at PDC. Thanks to the assistance by Dianne Lynchat Thinking Machines Inc. in Cambridge, USA, these calculations couldbe performed on a 64-node CM5 machine with 128 Mbyte on each nodewhereas the final state analysis were readily done at PDC. A typical runfor the isotopes involves 6000 time steps, takes about 9 1/2 hours withabout half the time spent in the fast Fourier transforms subroutines andrequires about 5 Gbyte of primary memory.
In summary, computational studies of dynamical processes at sur-faces using multi-dimensional quantum wave packets are well-suited fora data parallel machine like CM200 and CM5 and are computationallyvery demanding , in particular, with respect to primary memory. Theavailability of a 64-node CM5 machine, through contacts arranged viaPDC, have made it possible for us to study isotope effects using a realis-tic model for an Eley-Rideal surface reaction involving hydrogen atoms.In fact, this model is the first realistic quantum mechanical model ofa full surface reaction. Our predictions about the isotope effects onthe product rovibrational distributions have recently been confirmed bystate-to-state molecular beam experiments.
6.13 First-Principles Modeling Defects in Semiconductors:Oxygen in Silicon
Sven ObergDepartment of Mathematics, Lulea University
Oxygen is the primary impurity in commercially grown silicon, and isable to form a great many electrically active defect complexes, bothalone and in combination with other light element impurities. The mostimportant of these are electrically active thermal donors, a family of de-fects which despite intensive study for over forty years, still leave us withelementary questions such as the nature of their atomic structure. Pointdefects such as these have been identified as one of the primary restric-tions on Si chip speed in the near future. However many light elementdopants such as oxygen, hydrogen and nitrogen are deliberately addedto silicon to strengthen the wafers and improve other bulk properties.Therefore there is a greater need now than ever to fully understand theway in which oxygen precipitates in silicon, so that careful processingcan maximize the benefits from point defects and minimize the damagethat they cause. Crucial to an understanding of point defect interactionsin silicon is the role of silicon self-interstitials, silicon atoms which havebeen forced out of their normal lattice sites and have to share a lat-tice site with a second silicon atom. They are able to diffuse extremelyrapidly and it has been suggested that they mediate many of the de-
96 Applications in Physics

fect formation processes in silicon, and may even lie in the core of thethermal donors. Our recent work casts into doubt many of the commonassumptions in this field.
We have been studying light element defects in silicon using a localdensity functional scheme, applied to atomic clusters. The program hasbeen used and developed in collaboration with others [Jones, 1992], inmany successful applications to a wide variety of molecular and semi-conductor problems. The code models clusters of atoms in real space. Itcan therefore be directly applied to molecules, and for the simulation ofdefects in bulk, large hydrogen terminated clusters. It determines manyphysical properties, including total energies, structure and symmetry,energy surfaces and vibrational frequencies on an ab initio level. Sincethere is no experimental input this maximizes the predictive capabilityof the code.
Much work has been put into efficiently parallelizing the code, andincorporation of the block algorithm SCALAPACK routines. These rou-tines take full advantage of massively parallel architectures. The codecan run with comparable efficiency across a variety of platforms includingparallel machines (such as the IBM SP-2 and CRAY T3D), workstationclusters, and single workstations (e.g. SGI, IBM, DEC and HP machines).The code effectively load balances and routinely achieves very high scale-up efficiency with increasing number of nodes. Efficiency for the calcula-tions reported here using 16 nodes is about 90% (speedup of about 14).Most of the oxygen defect work described here was performed using theSP-2 at PDC.
Cluster methods employing localized basis sets are important for study-ing impurities such as O and N in Si. The localized nature of the basisallows an increase in basis size around atoms such as O or H which haverapidly varying charge density. Moreover clusters are easily constructedaround aggregates, making this method ideal for their study. One ofthe problems with oxygen is that many of its associated defects causelong range relaxation in the Si lattice, so large clusters are required toaccurately model their structure. This is particularly important whenmodeling diffusion processes where long range relaxations can signifi-cantly alter the energy barrier to diffusion. Thus most of the clustersused for these calculations contain between 100–150 atoms with manybasis functions required to accurately model the point defect; such large Such large calculations can only
be realistically tackled withpowerful machines such as theSP-2
calculations can only be realistically tackled with powerful machines suchas the SP-2.
Oxygen-vacancy complexes
We initially tackled the problem of oxygen–vacancy (OV) complexes.Normally oxygen sits in a bond centred (BC) site, forming interstitialoxygen, Oi. However irradiating Si creates many vacancies, which cantrap Oi, initially forming the so-called off-site substitutional oxygen, Os.
Applications in Physics 97

However the subsequent annealing behavior is complex. A-centres breakdown at around 300C and a transient, intermediate defect is createdbefore the formation of a stable defect characterized by a local vibrationalmode (LVM) at 889 cm−1 [Corbett et al., 1964]. At higher temperaturesthis too breaks down and a variety of other LVMs are formed.
From our calculations, we have determined that the transient centrearises from OiOs, where a normal bond centred oxygen atom sits next toan A centre. This is then able to reconstruct into V(Os)2 (a ‘di-oxygenvacancy’ complex, where two oxygen atoms share the same vacancysite), with a calculated O stretch mode close to 889 cm−1. Although aV(Os)2 model has been proposed before, there was no explanation of theapparent lack of coupling between the oxygen atoms, or of the formationmechanisms involved. Our calculated LVMs are in excellent agreementwith experiment [Ewels et al., 1995], and our predictions of the symmetryhave since been experimentally verified [Neilsen et al., 1996]. We havealso examined the way in which further oxygen atoms add to this defect,performing calculations for various VO3 models. J. L. Lindstrom and T.Hallberg at Linkoping University are currently performing further ex-perimental work [Hallberg and Lindstrom, 1992] to determine the LVMsof large vacancy–oxygen clusters. We are working closely with them tocompare the theoretical models with the new experimental results, andthis work is leading to a comprehensive understanding of the dynamicprocess of oxygen aggregation at vacancy sites in irradiated Si.
Oxygen diffusion in silicon
We are currently examining oxygen diffusion and complexing in silicon,one of the longest running and hardest problems in defect physics. Dif-fusion is an extremely important process in solids, affecting both theiratomic structure and stability. However it is a difficult problem to han-dle theoretically for several reasons. Firstly there are many possiblechannels for diffusion, including simple atomic exchange, interstitial orvacancy controlled diffusion, and diffusion catalysed by other impurities.Secondly, diffusion involves non-equilibrium structures, and requires theaccurate determination of saddle point structures. These are the struc-tures possessing the highest energy along a particular diffusion path.The energy difference between this and the equilibrium structure is theenergy barrier that must be overcome for diffusion to occur along thatpath.
Isolated interstitial oxygen can hop from site to site at temperaturesabove 380C (from bond centre D-B to bond centre D-C, see the leftpart of Figure 2.28 on page 26), and the barrier will occur at someintermediate point as bonds A-B and C-D are broken, and new bondsform between A-C and B-D. Our calculations, when unconstrained, leadto equilibrium ground state stable structures. Therefore to obtain saddlepoint energies it is necessary to constrain the problem in some way. The
98 Applications in Physics

energy of the diffusion barrier is crucially dependant on which bondsare required to break / form, and so we constrain the problem by fixingimportant bond lengths to a given length. For Oi diffusion these are theO-Si lengths, shown in the left part of Figure 2.28 on page 26 as A-Band A-C. The rest of the structure is allowed to relax to equilibriumsubject to these constraints. The saddle point occurs when A-B = A-C.In practise it is also necessary to constrain the bonds D-B and D-C, sincethere is also a Si-Si bond between D-C which has to break and a bondbetween D-B which forms during one diffusion hop. By varying thesetwo constraints we obtain an ‘energy surface’, from which the saddlepoint energy can be directly found through interpolation.
The experimental barrier for Oi diffusion is 2.54 eV [Stavola et al.,1983], and using the method described above we obtain a calculatedvalue of 2.6 eV, in excellent agreement. However, this means interstitialoxygen diffuses too slowly to explain the formation kinetics of thermaldonors. It has therefore been proposed that there may be an alternativefaster diffusion mechanism for oxygen. One possible solution is oxygenmigrating in interstitial pairs, and with this in mind we modeled a centreconsisting of two Oi in adjacent bond centres, (Oi)2 (see the right part ofFigure 2.28 on page 26). This is more stable than two isolated Oi atomsby ≈ 0.7 eV. We then examined possible (Oi)2 diffusion mechanisms,and found that it can diffuse more easily than isolated Oi via concertedmotion [Ewels et al., 1996a]. As Oi moves from one bond centre to thenext it passes through a central point where it has two very dilatedSi-O bonds (A-B and C-B). However the presence of an adjacent Oi
compresses these dilated bonds and lowers their energy, lowering theoverall energy barrier to diffusion by ≈ 1 eV. This means that oxygenpairs should diffuse much more rapidly than isolated Oi, and is close tothe observed thermal donor formation energies.
Nitrogen – Oxygen defects
We have previously shown that N in Si primarily exists in the form of(Ni)2 pairs [Jones et al., 1994a]. More recently we showed the primaryN—O defect to be (NN)O, consisting of Oi neighboring a (Ni)2 pair[Jones et al., 1994b]. Many experimental groups have observed a familyof shallow thermal donors (STDs) in Si that contains both O and N. Ourcalculations predict that a defect consisting of a single Ni surrounded bytwo Oi acts as a STD [Ewels et al., 1996b] (see the left part of Figure 2.29on page 26). Isolated Ni possesses a deep donor state localized on aneighboring Si. However in Ni(Oi)2 this donor level is electrostatically‘squeezed’ by the Oi, which pushes it towards the conduction band toform the observed shallow level (see the right part of Figure 2.29 onpage 26). The mechanism is not restricted to Ni based defects and canalso be produced from a defect core of (C-H)i-O2i.
Applications in Physics 99

One of the fascinating aspects of this model is that this is a newmechanism for the formation of shallow donor levels, and only initiallyrequires a defect with a deep level state. There are many implicationsof this work beyond the direct attempt to determine the structure ofSTDs. This mechanism could explain the source of shallow donor levelsin a wide range of materials, including commercially important shallowdonors in diamond [Prins, 1995]. Ultimately it may even be possible toattempt ‘defect level engineering’, treating a material in such a way asto produce defects with energetically ‘squeezed’ levels lying at preciselythe energies required for device design.
Carbon – Oxygen defects and the Thermal Donors
We are currently investigating the role of carbon in silicon, and its in-teractions with other point defects such as oxygen. Carbon can existin either a substitutional (Cs) or interstitial (Ci) form and is able tointeract with many other impurities (indeed, these two can even com-plex together, leading to defects such as the ‘T-line’ defect, CsCiH[Safonov et al., 1996]) Carbon behavior is particularly relevant to thestudy of oxygen since carbon is known to suppress thermal donor for-mation. The mechanism has, until now, been explained in terms ofsilicon self-interstitials. Substitutional carbon can trap these througha ‘kick-out’ mechanism, where the carbon swaps places with the sili-con interstitial to become Ci. This soaks up the silicon interstitials andsince carbon suppresses thermal donor formation this has been used asevidence to suggest that silicon interstitials exist in the thermal donors.
However, our latest results suggest that this may not be the case, andcarbon could suppress thermal donors through a much simpler mecha-nism. Many defects have been assigned to Ci-On, 0 < n < 4 complexesdue to their high vibrational modes (Ci is more compressed than Cs andso vibrates at higher frequencies). However we find that the presence ofneighboring oxygen compresses Cs until it gives vibrational modes of asimilar frequency. Therefore the defect complexes supposed to be Ci-On
could, in fact, be due to Cs-On, and carbon is then simply suppressingthermal donors by ‘mopping up’ the oxygen so there is insufficient leftto form thermal donors. Current experimental work by Lindstrom andHallberg to provide data on the isotopic shifts of these modes, coupledwith theoretical modeling currently underway should help to confirm ordeny this idea.
Alongside this work we have started examining larger oxygen aggre-gates, in order to find out how this clustering occurs and ultimatelydetermine the structures of the thermal donors (TDs). Over 40 yearsof research has led to a bewildering wealth of experimental data on thethermal donors, much of it conflicting, and together painting a pictureof very complicated kinetics and thermodynamics. Thermal donors area family of double donor defects (there are 17 reported TDs) that form
100 Applications in Physics

in silicon during low temperature anneals (450C). The later TDs areknown to have C2v symmetry (a reflection plane and a 2-fold rotationaxis) and they all have oxygen present in the defect core. In addition,the first two TDs are bistable, sharing a common electrically inactiveform as well as their respective donor structures.
We have examined structures consisting of three Oi atoms and foundthat they can form either electrically inactive ‘linear chains’ or morecomplex structures which do indeed exhibit donor activity. In additionwe are currently examining structures of four Oi atoms which demon-strate many of the required properties of the later thermal donors. Fur-ther modeling is required to test whether these are indeed the correctstructures for thermal donors. These structures can adopt many possibleconfigurations and it is essential to ensure that our models are the moststable. In addition they must be carefully correlated with the availableexperimental data [Lindstrom and Hallberg, 1995]. Again, the latestwork by Lindstrom and Hallberg on the isotopic shifts of thermal donorvibration will be essential in this respect.
6.14 Fluctuations in Atomic Collision CascadesRoumiana Chakarova, Imre PazsitDepartment of Reactor Physics, CTH
Particle cascade processes are described most often by mean values.However a thorough understanding of the fluctuations in collision pro-cesses can give more insight into the physics of the particle transport andthe properties of the material in which the transport takes place. Therelative variance of the sputtering yield is a monotonically increasing(i.e. diverging) function of the energy of the bombarding particle withboth constant cross sections and hard sphere potential as well as Lind-hard and power law cross section. Some other collision processes, suchas ion pair production or total number of defects in an infinite medium,on the other hand, have relative variances that are asymptotically con-stant with the bombarding energy and much less than unity (i.e. deeplysub-Poisson).
To understand the reason of such a difference an extensive study of theenergy and spatial correlations has been performed using Monte Carlomethod. The algorithm employs constant cross sections and the modelof Khinchin and Pease for the defect creation mechanism. It was foundthat in half-spaces, unlike in infinite media, the relative variance of de-fects becomes over-Poisson and increasing with increasing bombardingenergy. The structure of the correlation functions was indeed helpfulin understanding the behavior of the variance in various cases, see Fig-ure 6.11 from [Pazsit and Chakarova, 1996].
Most of the quantities calculated (energy and depth distributions ofthe origin of sputtered particles, depth distributions of vacancies and
Applications in Physics 101

Figure 6.11. Depth correlation func-tion of vacancies created in a semi-infinite medium. Particles with en-ergy Eo are injected at X1=X2= 0mfp. X1 and X2 are depth variables.U = ln(Eo/Ed) = 8, where Ed is theatomic displacement energy.
interstitials, energy and depth correlations), are of the density type.Obtaining results with a satisfactory accuracy required long CPU time onthe Sun SPARCstation at the Department. This was especially true forthe correlations. The complete mapping of a correlation function over thetwo dimensional domain of interest turned out to be a very demandingtask. Therefore the Monte Carlo program was parallelized on the basis ofthe MPI library and implemented on the IBM SP-2 machine. The CPU
speedup was estimated by running a test problem on the Sun stationand IBM SP-2 when using different number of processors. Figure 6.12shows the advantage and applicability of the SP-2 parallel architectureto Monte Carlo particle transport problems.
Test calculations with the parallel code were performed as well as us-ing the MPICH portable version of the MPI library installed on the “Sunnetwork” of the Department. It includes three workstations. The effi-ciency of the MPICH utilization was restricted by the limited numberof stations available, the differences in their characteristics and partic-ular occupation. The MPICH was considered to be most useful whendeveloping a parallel algorithm.
102 Applications in Physics

Figure 6.12. Scaled CPU speedup ofthe parallel Monte Carlo code basedon the CPU time for a single SunSPARCstation.
6.15 Transport Simulation of Electrons Reflected Elasticallyfrom SolidsImre Pazsit, Roumiana ChakarovaDepartment of Reactor Physics, CTHFredrik HedmanCenter for Parallel Computers, KTH
The energy spectrum of reflected electrons is an information carrier ofthe material properties. Theoretical investigations of the spectrum inthe vicinity of the elastic peak involve decoupling of the spatial andangular transport from the energy degradation process. This is achievedby considering all scattering events as being elastic and determining thepath-length distribution of the reflected particles. The latter is thenconvoluted with the energy loss function in order to obtain the energyspectrum.
The path length distribution can be determined from an energy in-dependent, angle-, depth- and time-dependent transport equation, sincethe path length of the electrons is proportional to their flight time in themedium. However, standard transport theory solution methods, suchas the P1 or DP1 methods, fail to give correct results, due to the freesurface, a singular source term and the complicated angular dependenceof the scattering kernel. Therefore an analog Monte Carlo model hasbeen applied to simulate electron elastic scattering. Path-length and
Applications in Physics 103

Figure 6.13. Number of 1 keV elec-trons vs path-length and depth theypenetrate before being reflected elas-tically from aluminum. The distribu-tions are non monotonic. Zero mfpcorresponds to aluminum surface.
Figure 6.14. Depth distribution of1 keV electrons reflected from alu-minum after a fixed number of colli-sions. Electrons suffering one and twointeractions have monotonic distri-bution. A maximum appears for thosewith three collisions. It moves to largerdepth values with increasing the colli-sion number (the electrons penetratedeeper into the medium).
104 Applications in Physics

depth distributions as well as angular distributions of reflected electronshave been calculated for several elements and energies in the range 0.4–20keV. It was found that the path-length and depth distributions are notmonotonous for selected elements (e.g. aluminum, carbon and copper),for certain energies, see Figures 6.13 and 6.14. This behavior was relatedto the structure of the differential elastic scattering cross section [Pazsitand Chakarova, 1994].
Statistical analysis of the Monte Carlo results was based on the num-ber of particles scored in each depth or angular bin. A large numberof electron histories needed to be simulated in order to achieve goodstatistical accuracy which led to long running times of the serial code.The problem was solved by implementing the model on the ConnectionMachine CM200. A parallel code was written that allows simultaneoussimulation of the penetration of up to 200 000 particles. The numberof the source electrons was not limited by the number of the processorsattached because of the virtual processor capability of CM200.
Test comparison between the sequential and parallel algorithms wascarried out on a Sun SPARCstation and 8K CM200 respectively. It wasfound that the CM200 outperforms the workstation by a factor of 17. Theparallel algorithm can be optimized to achieve higher CPU speedup.
6.16 One-Group Radiation Transport Benchmarks forAnisotropically Scattering Medium
Roumiana Chakarova, Imre PazsitDepartment of Reactor Physics, CTH
Radiation transport calculations are performed by user developed codesor by standard packages linked to user written routines. It is essentialto test the codes against high quality data in order to establish theiraccuracy and proper work. Selection of benchmarks is preferable whichare valid for situations closely related to that of the particular problem.Therefore the generation of a wide variety of benchmarks remains anactual task. Analytical, numerical or experimental results may serve asa test as well as calculations by Monte Carlo method. Advantage of theMonte Carlo method is the capability to handle complex configurationsand scattering kernels. However the requirement of high accuracy maylead to long running times. One way of reducing CPU times is to applyparallel computing techniques.
We have calculated neutron flux and current distributions in an aniso-tropically scattering subcritical medium with a parallel Monte Carlo codeon the Connection Machine CM200. Both monodirectional and isotropicsources were considered at the surface of a semi-infinite, slab or cylin-drical medium. The code is based on a detailed Monte Carlo simulationwith variance reduction technique. An exponential transform is includedto enhance the efficiency for the deep penetration cases. The particle is
Applications in Physics 105

represented by its position coordinates and direction of motion. Its tra-jectory in the medium is constructed as a series of successive interactionevents. The parallel procedure is described briefly below.
Each particle characteristic is an element of a certain array whose di-mensions are not restricted by the number of processors because of thevirtual processor capability of CM200. Operations simulating particlehistories are performed here on 500000 dimensional arrays. The currentstate of i-th particle is determined by the i-th element of each character-istic array. A flux or current scoring array for a certain interface containsthe particle contributions to the score. The update of the i-th elementsof the characteristic and scoring arrays comprises the i-th history. Arrayelements belonging to particles absorbed or escaped from the mediumare marked and ignored by the scoring procedure. The computation con-tinues until all element positions are marked. The total flux or currentvalue for a certain interface is obtained by summing the elements of thecorresponding array. This completes the simulation of the particles ofone statistical batch.
The code is written in CM Fortran. The CPU time for a run (500 000histories) on 8K CM200 varied from 10 to 180 seconds depending on theabsorption probability parameter. Because of the short running time, itwas possible to simulate the transport of hundred millions source neu-trons for each case and to keep the statistical error between 0.1 and 2.5%.More details can be found in [Chakarova and Pazsit, 1995].
6.17 Modified Artificial Viscosity in Smooth ParticleHydrodynamics on the CM200
Magnus SelhammarUppsala Astronomical Observatory, Uppsala University
Smooth Particle Hydrodynamics (SPH) is a gridless Lagrangian hydro-dynamic method, and instead of a grid to discretize the fluid one usesparticles. The method is often efficient in astrophysical applications, andthe particle representation makes SPH suitable to implement in three di-mensions and to include gravitation. The method is first described byLucy 1977, and independently by Gingold and Monaghan also in 1977.
The particles represent the model’s density distribution, where a spe-cific particle has a finite extension in space by a radius of two smoothinglengths, 2h, which is specific or each particle. This makes hydrodynamicinteraction with other particles, called neighbors, possible within thisradius. To maintain similar resolution throughout the model despitedensity variations over time, h is updated every iteration to keep thenumber of neighbors constant.
Artificial viscosity forms shocks and broadens them to a few smooth-ing lengths, which is the resolution of the model. It also damps the postshock oscillations and to prevent that particles penetrate each other. The
106 Applications in Physics

artificial viscosity consists of two terms. The bulk viscosity that scalesas the particle velocity times the sound speed, and the von Neumann-Richtmeyer viscosity that scales as the quadrate of the particle velocity.In the supersonic region the von Neumann-Richtmeyer viscosity dom-inates to form shocks, but with subsonic particle velocities the bulkviscosity becomes important to damp the post shock oscillations. Bothterms prevent particle penetration in their velocity regions respectively.
The artificial viscosity gives erroneous results because it damps desir-able velocity differences among the particles and heats the model, mainlydue to the poor spatial resolution. The effect is particularly prominent ingravitational collapses, which are common in astrophysical SPH models.
To delimit these problems the von Neumann-Richtmeyer viscosity isrestricted to supersonic velocities only. The bulk viscosity is modified tointeract, not with each neighbor separately, but a weighted mean of theparticles. Comparisons with standard tests show comparable or betterresults than with standard artificial viscosity. The results are submittedto Astronomy and Astrophysics.
6.18 Reduction of Impurity Scattering from Correlation ofDonorsThomas PalmDepartment of Electronics, KTH
Scattering from donors is a serious problem for devices based on ballisticelectron transport. Using modulation doping where an undoped spacerlayer is placed between the donors and the electrons reduce this prob-lem, but for a random donor distribution the remaining remote impurityscattering still ruins the performance of studied devices.
It has been suggested that since usually only a fraction (around 70%)of the donors are ionized in a realistic structure, the ionized donors wouldform a more regular pattern to minimize electrostatic energy. This wouldreduce scattering.
To find this distribution, a random donor distribution was created. Afraction of these were initially selected to be ionized and the resultingpotential was calculated. In the next step the donors located at pointswith lowest potential were selected to be ionized and the potential wasrecalculated. This was iterated until no further change was seen. Inaddition, a Fermi-distribution was added to model a finite temperaturein the distribution of ionization.
For the chosen parameters the change of ionization at one point madea large difference in potential at neighboring donors. In initial attemptsthe solution therefore tended to oscillate wildly rather than converge. Aform of under-relaxation where only a small (10%) of the donors wereallowed to change ionization state at each iteration was therefore in-troduced. This improved stability, but several hundred iterations were
Applications in Physics 107

Figure 6.15. Contour lines of the po-tential of a Y-branch under symmetricbias. The thick line shows the Fermi-level. Above this level each contourrepresents 50 mV potential difference.Below the Fermi-level screening re-duces the fluctuations and the contourlines have been drawn at 2 mV dis-tance. The left device is without donorcorrelations, the right include these.
needed to reach an equilibrium, which was made possible by the largeMade possible by the largecapacity of the ConnectionMachine
capacity of the Connection Machine CM200 at PDC.This crude algorithm was not able to reach a true thermal equilibrium
for temperatures below approximately 500 K, and the resulting potentialwas therefore an upper limit to the amount of scattering expected in realdevices (assuming the underlying model is correct). Nevertheless, scat-tering was reduced to a point where ballistic transport appears possible,see Figure 6.15 [Palm, 1995].
6.19 A Monte Carlo Model for Radionuclide Transport inFractured MediaMarlene Andersson, Bruno Mendes, Antonio Pereira2
Department of Physics, Stockholm University
Geological deposition is, in many countries with nuclear power produc-tion, the main alternative to handle long-term risks associated withstocks of high-level nuclear waste. Underground repositories can be em-bedded in different geological environments such as clay, salt domes andgranitic rocks.
2Since this project is related to parallel computing developments in the field ofhigh-level nuclear waste two of the authors (B. Mendes and A. Pereira) thank theEuropean Commission for financial support in the frame of the GESAMAC project.
108 Applications in Physics

Figure 6.16. In the CRYSTAL3Dmodel the pathways are formed byseries of connected fractures.
The application of Monte Carlo methods is very useful in the estima-tion of long-term radiological risks. This project is a feasibility study ofgeosphere transport modeling in fractured media, to be used in uncer-tainty and sensitivity analysis of Monte Carlo simulations.
Granitic rock environment is typically a fractured media exhibitingstrong heterogeneity. Transport codes actually in used in Monte Carloassessments of high-level nuclear waste do not included heterogeneity,probably to keep the total number of needed simulations manageable.In the CRYSTAL3D model, now under development, the heterogeneityof fractured media has been introduced, which magnifies the compu-tational burden with two orders of magnitude. Therefore, our model,first developed in a serial environment had to be ported to a parallelcomputer. The code has been implemented recently on the IBM SP-2 atPDC, using the Message Passing Interface, MPI.
CRYSTAL3D is an extension of the CRYSTAL model [Worgan andRobinson, 1992] to three dimensions. Our conceptual model is showschematically in Figure 6.16: in CRYSTAL3D, the transport pathwaysthat connect the source of radionuclides (at inlet area A) to the biosphereis model-led by a series of connected fractures ending at the outlet areaB, which can be a fracture zone in direct contact with the biosphere.Physical, chemical and geological properties can vary from fracture tofracture reflecting the heterogeneity of the media. The input parametersdescribing these properties can be sampled from several PDFs. Thefractures are generated stochastically within the volume defined by theinlet and outlet areas.
In our first tests we have simulated the transport of one nuclide withno decays chains. Although the number of simulations was limited, somevery interesting results have been obtained. In fact, the mean value ofrelease rates to biosphere decrease by one order of magnitude if comparedwith results from the option in which heterogeneity is not taken intoaccount (in manuscript). The variance of the output distribution hasalso decreased. Figure 6.17 shows an output distribution obtained usingcirca 100 000 transport simulations [Worgan and Robinson, 1992].
Applications in Physics 109

Figure 6.17. This figure shows theoutput distribution of peak release rateof 243Am.
Future work
Model development will continue. Also the performance of the code willbe studied to optimize it. A detailed study of the impact of heterogeneityon release rates to biosphere will be done, which implies the need ofvarying other input parameters that were kept constant during the firsttests and also of monitoring a significantly higher number of Monte Carlorealizations.
110 Applications in Physics

7 Applications in Geophysics
7.1 Numerical Experiments on Gravitational Instability ofGeostructuresAli T. Ismail-Zadeh, Boris M. NaimarkIIEPTMG, Russian Academy of Sciences, Moscow, Russia
The problems of gravitational instability involving distinct chemical lay-ers are challenging in geophysical fluid dynamics. Motions of materialinterfaces separating geomaterials of differing material properties are es-sential to subduction of lithospheric slabs, ascending of mantle plumes,sinking of heavy bodies in the asthenosphere, salt diapirism, and manyothers. We have examined the models of salt diapir evolution with later-ally homogeneous and inhomogeneous overburdens of sediments and alsomodels of descending slab in attempt to explain the observed distribu- Attempt to explain the observed
distributions of intermediate-depth earthquakes
tions of intermediate-depth earthquakes. To compute these models, wesolved the 2D Stokes equation, represented in terms of the stream func-tion, and the transfer equations for density and viscosity. The numericalmethod used in this study combines a Galerkin-spline technique witha method of interface tracking to represent discontinuous variations ofmaterial parameters. We analyze models where a viscous incompressiblefluid filling a square box is divided into layers by advected boundaries,across which density and viscosity change discontinuously. Free slip con-ditions are assumed at the model sides. The numerical approach, beingEulerian, avoids the difficulties due to material discontinuities at inter-mediate boundaries, like Moho or the earth’s surface, and is also freefrom the deficiencies of the Lagrangian approach always resulting inmesh distortion. Special algorithms and codes were developed for theseaims. The 2D models were solved numerically on IBM SP-2 by using oneof its nodes. Here we present a model of salt motions in the presence oflaterally asymmetrical loading and show the evolution of the resultantsalt structure, see Figures 7.1(a)–(f). The nappe of sediments was im-posed on the overburden with the growing symmetrical diapir (a). Thevelocity of nappe sinking in the overburden is greater than the rate ofthe diapiric growth. This is clearly seen from velocities presented in (a)and (b). Figure (b) demonstrates also how the shape of the diapir be-comes slightly asymmetrical. When the nappe attains its equilibrium,the rate of diapiric penetration increases (c). Subsequent phases of di-apiric evolution are shown in (d) and (e). It is seen that the diapirremains asymmetric only slightly. However, even this minor asymme-try leads to a quite asymmetric shape of the diapir in its subsequentevolution (f).
For further details see [Naimark and Ismail-Zadeh, 1995] and [Naimarket al., 1996].
Applications in Geophysics 111

Length, km
(a)
Dep
th, k
m
.2980 cm/yr
0.0 2.5 5.0 7.5 10.0 12.5 15.0
-2.5
0.0
Length, km
(b)
Dep
th, k
m
.1054 cm/yr
0.0 2.5 5.0 7.5 10.0 12.5 15.0
-2.5
0.0
Length, km
(c)
Dep
th, k
m
.0342 cm/yr
0.0 2.5 5.0 7.5 10.0 12.5 15.0
-2.5
0.0
Length, km
(d)
Dep
th, k
m
.0499 cm/yr
0.0 2.5 5.0 7.5 10.0 12.5 15.0
-2.5
0.0
Length, km
(e)
Dep
th, k
m
.0148 cm/yr
0.0 2.5 5.0 7.5 10.0 12.5 15.0
-2.5
0.0
Length, km
(f)
Dep
th, k
m
.0082 cm/yr
0.0 2.5 5.0 7.5 10.0 12.5 15.0
-2.5
0.0
Figure 7.1. Evolution of salt diapirs under the effect of laterally inhomogeneous sedi-mentary loads. Viscosities and densities are the following: 1018 Pa s and 2.2×10³ kg m−3
(salt, heavy shading); 1020 Pa s and 2.3×10³ kg m−3 (overburden, grey); 1020 Pa s and1.9× 103 kg m−3 (nappe of sediments, light grey). Flow velocities are shown by arrows.Velocity scale is given at the top of each figure. (a) t = 0, (b) t = 0.3 Myr; (c) t = 3.3Myr; (d) t = 6.4 Myr; (e) t = 10.2 Myr; (f) t = 30.5 Myr.
112 Applications in Geophysics

7.2 Molecular Dynamic Study of Melting of Earth’s Materials
Anatoly B. BelonoshkoInstitute of Earth Sciences, Uppsala University
Our knowledge of the Earth’s composition comes mainly from the cosmicabundances of the elements. Based on these data in combination withphase equilibria in such materials and seismic data the Earth is viewedas being composed mostly of silica and a MgSiO3-perovskite mantle, andan iron liquid outer and solid inner core. The range of pressures relevantto studies of the Earth materials is from 1 to more than 3.5 millionatmospheres. Naturally, experimental studies are extremely difficult atsuch a high pressure, especially in combination with high temperature.The problem of melting is of particular importance for the Earth science,because there are a number of factors which critically dependent onmelting temperatures. Theoretical studies allow us to get insight into themechanism of melting at very high pressures and provide very reasonableestimates of melting temperatures.
We have studied the melting of SiO2 (stishovite and quartz), MgSiO3
(perovskite), NaCl (B1 and B2 phases - as a test), MgOFe (bcc, fcc, andhcp phases) using the molecular dynamic method and the IBM SP-2 com-puter, [Belonoshko and Dubrovinsky, 1995], [Belonoshko and Dubrovin-sky, 1996], [Belonoshko and Ahuja, 199X] and [Belonoshko, 1994]. Apartfrom the problem of description of interatomic interaction, the simula-tion of melting requires adequate choice of simulation technique becauseof the well known phenomenon of overheating in MD simulation of melt-ing. To avoid overheating, the so called two-phase simulation have beencarried out. An initial computational cell was composed of a solid anda liquid portion put together as shown in Figure 2.19(a) on page 22.Starting from such an initial configuration simulations have been per-formed at a given temperature and pressure. If the sample became acrystal (Figure 2.19(b) on page 22) then in the next run temperaturewas increased and simulations were repeated raising temperature untilthe sample became molten (Figure 2.19(c) on page 22). In such a way itwas possible to determine an exact position of the melting temperatureat a given pressure. The use of parallel computers are crucial in such The use of parallel computers
are crucial in such simulation,because the choice oftemperature in the next rundepends on the results of theprevious one
simulation, because the choice of temperature in the next run depends onthe results of the previous one. Therefore, the runs can not be performedindependently and require a fast computer. The use of the two-phasesimulation method was demonstrated to be equivalent to the method offree energy calculations and allows us to calculate melting temperaturesof modeled systems very precisely.
Because of significant experimental problems of ultra-high pressure-temperature experiments, computer simulation becomes equal copartnerof experimental studies. For example, MD computer simulations of ex-periments employing diamond anvil cell technique with laser heatinghave allowed to reveal the importance of thermal stress. A typical com-
Applications in Geophysics 113

Figure 7.2. Geological model used inproducing the synthetic seismogramsin Figure 7.3. See Table 7.1 for theelastic parameters used in the finitedifference modeling.
putational cell in those studies is shown in Figure 2.20 on page 23. Aperfect MgO crystal was pressurized by Argon. However, different pres-sures were applied to different faces of the MgO crystal. When the dif-ference in pressure reaches a critical value, recrystallization is observed.This has allowed to solve the experimental problem of systematically toolow melting temperatures when the diamond anvil cell technique withlaser heating is employed.
The size and time scale of simulation is out of reach of serial com-puters. Without distributed calculations these studies will hardly befeasible.
114 Applications in Geophysics

7.3 Finite Difference Modeling of Seismic Wave Propagationin Heterogeneous Media
Christopher Juhlin, Lena FrenjeSolid Earth Physics, Department of Geophysics, Uppsala University
Our research over the last years has focused on modeling seismic wavepropagation in three types of media. These are (1) 2D elastic anisotropicmedia [Juhlin, 1995], (2) 2D acoustic seismic modeling of geologicalstructures associated with oil exploration and (3) 2D and 3D randomlyvarying media.
Elastic wave propagation in 2D anisotropic media
The original code written in 1992 for the CM200 is still being used exten-sively for modeling geological structures where anisotropy is important.An example is the use of modeling in understanding borehole seismicdata from coal fields in Australia. The coal seams are located at about The coal seams are located at
about 500m depth and it iscrucial that they be imagedproperly using the seismicmethod prior to mining
500m depth and it is crucial that they be imaged properly using the seis-mic method prior to mining. A possible geological model developed atUppsala University which explains the events observed on the boreholeseismic records from a typical area is shown in Figure 7.2. The elasticproperties of the rocks are given in Table 7.1 and use the nomenclatureof Thomsen [Thomsen, 1986] to define the anisotropy.
From several modeling runs it was found necessary to include thetwo gas pockets in the model and the two fault zones where the elasticproperties differ markedly from the surrounding rock. Three crossholesynthetic seismic shot gathers were generated for the model (Figure 7.3)using the approach of Juhlin [Juhlin, 1995]. The algorithm uses thestress-velocity formulation of the elastic equations on a staggered gridfor hexagonal anisotropic heterogeneous media. Modeling parameterswere, Dx and Dz = 1 m, Dt = 0.15 ms, a Ricker wavelet source with90% of its energy below 150 Hz and absorbing boundary conditions on allsides. The shot gathers were generated at source depths of 30, 240 and470 m, corresponding to the depths for the real data shown in Figure 7.4.The synthetic data in Figure 7.3 have many of the characteristics of thereal data in Figure 7.4. Generation of synthetic data which did notinclude the gas pockets and the fault zones do not show many of thesecharacteristics.
Seismic modeling of geological structures
In cooperation with the Institute of Earth Sciences at Uppsala Univer-sity, geological models relevant to petroleum exploration and tectonicinterpretation are being modeled seismically using 2D acoustic methods(an example is shown in the PDC Progress Report 1993). Since realisticsituations are being modeled, the models tend to be large and a greatdeal of core memory is required. Therefore, we have been limited to 2D
Applications in Geophysics 115

Figure 7.3. Synthetic vertical com-ponent seismograms from the modelshown in Figure 7.2 with shots locatedat (a) 30 m, (b) 240 m and (c) 470 mdepth. The receiver spacing is 6 m.
0.0
0.1
0.2
0.3
0.4
100 200 300 400
Depth (m)
Shot at 30 m
(a)
0.0
0.1
0.2
0.3
0.4
100 200 300 400
Depth (m)
Shot at 240 m
(b)
0.0
0.1
0.2
0.3
0.4
Tim
e (s
)
100 200 300 400
Depth (m)
Shot at 470 m
(c)
Table 7.1. Elastic parameters usedin the finite difference modeling. Thenomenclature of Thomsen [Thomsen,1986] is used to define the anisotropy.
Media Vp (m/s) Vs (m/s) e d* g rho (g/cc)
UpperSandstone 3346 1907 0.25 0.056 0.0 2.5LowerSandstone 3464 1925 0.133 0.032 0.0 2.5Coal 2400 1200 1.4 0.0 0.0 1.4Gas 1 2645 1907 0.137 0.55 0.0 2.5Gas 2 3033 1925 0.152 0.05 0.0 2.5Fault Zones 3464 1000 0.133 0.032 0.0 2.4
acoustic modeling, rather than 3D acoustic or elastic modeling. How-ever, the 2D acoustic results have been useful in interpreting real seismicdata and in relating these data to geological structures.
Seismic modeling of 2D and 3D random media
Research has shown that there is often a random or stochastic compo-nent in geological structures, but that this component can be quantifiedby fractal parameters. We are currently using sonic velocities measuredin boreholes to generate 2D and 3D models which have the same stochas-tic properties as the sonic logs that have been acquired in the boreholes.Figure 7.5 shows an example of 2D random media generated in this man-ner. Future work will involve propagating seismic waves through modelssuch as this and comparing the results with observed data. Through thiswe hope to be able to extract the stochastic properties of the rock thatthe seismic waves have propagated through.
116 Applications in Geophysics

Figure 7.4. Typical real raw shotgathers from the crosshole survey withshots located at (a) 30 m, (b) 240 mand (c) 470 m depth. The receiverspacing is 6.7 m.
0.0
0.1
0.2
0.3
0.4
100 200 300 400
Depth (m)
Shot at 30 m
(a)
0.0
0.1
0.2
0.3
0.4
100 200 300 400
Depth (m)
Shot at 240 m
(b)
0.0
0.1
0.2
0.3
0.4
Tim
e (s
)
100 200 300 400
Depth (m)
Shot at 470 m
(c)
Summary
The speed of the CM200 allows us to seismically model realistic geologicstructures much faster than on our Sun SPARCstations. Modeling which Modeling which would require
overnight runs on the Sun arecompleted in 15 minutes on theCM200
would require overnight runs on the Sun are completed in 15 minuteson the CM200. In addition, the large core memory allows us to modelgeological structures which we are not able to model on a workstation.However, to model realistic 3D structures, we require access to evenlarger amounts of core memory.
Applications in Geophysics 117

Figure 7.5. A self-similar random2D velocity model based on sonic ve-locity data from the deep Gravberg-1borehole in the Siljan Ring area ofSweden.
118 Applications in Geophysics

8 Applications in Chemistry
8.1 A Conformational Free Energy Landscape of ApApAfrom Molecular Dynamics Simulations
Jan Norberg, Lennart NilssonCenter for Structural Biochemistry, Karolinska Institutet
Investigations of molecular conformational states and substates are es-sential for understanding the relationship between structure and func-tion. Nucleic acids are highly flexible molecules and one of the mainforces stabilizing their three dimensional structure is stacking of the pla-nar bases [Saenger, 1988]. Solvents are known to influence the confor-mational stability of nucleic acids, with stacked structures being favoredin aqueous solution, but the stacking mechanism is not yet completelyunderstood.
We have determined a conformational free energy landscape of the sin-gle stranded ribotrinucleoside diphosphate adenylyl-3’,5’-adenylyl-3’,5’-adenosine (ApApA) [Norberg and Nilsson, 1995a]. This free energy land-scape was constructed from potential of mean force calculations, whichwere based on umbrella sampling in 324 molecular dynamics simulationsof the ApApA trimer in aqueous solution, using the distances betweenthe glycosidic base nitrogen atoms of neighboring bases as reaction coor-dinates. The total simulation time was 7.168 ns including the equilibra-tion periods. All calculations were carried out using a parallel version ofthe program CHARMM [Brooks et al., 1983].
A large number of very different conformations was obtained, rang-ing from a compact conformation with all three bases stacked to moreextended conformations with all three bases unstacked, but also inter-mediates between these categories were observed.
The conformational free energy landscape of the ApApA trimer ispresented in Figure 2.3 on page 12. The global minimum correspondsto a structure, which has the three bases stacked on top of each other.Local minima were obtained for structures having two bases stacked andone unstacked.
A contour map of the conformational free energy is presented in theleft part of Figure 8.1. This is used to visualize the height of the tran-sition barriers for the stacking-unstacking process of the three bases inthe trimer. As a measure of the solvent influence on the conformationalstability of the ApApA trimer we determined its solvent accessible sur-face area as shown in a contour map in the right part of Figure 8.1.The solvent accessible surface area of the global minimum structure wasabout 900 A2, and this increased by 300-400 A2 when all bases wereunstacked.
Applications in Chemistry 119

Figure 8.1. These contour mapsshow the conformational free energyand the accessible surface area of theApApA trimer by using the reactioncoordinates R12 and R23.
4 6 8 10 124
5
6
7
8
9
10
11
12
R12 (Å)R
23 (
Å)
Free Energy (kcal/mol)
1.5 3 4.5 6 7.5
3
1.5
4.5
4.5
6
6
7.5
7.5
9
9 10.5
4 6 8 10 12
4
5
6
7
8
9
10
11
12
R12 (Å)
R23
(Å
)
Accessible Surface Area (Å^2)
1000
950 900
1000
1050
1050
1050
1100
1150
1150
1200
In summary, we have by comparing the calculated 2D PMF surfaceof ApApA stacking with previous calculations of ApA stacking [Norbergand Nilsson, 1995b] found indications that stacking of the terminal basedepends both on the length of the oligonucleotide on which it stacks,and also that the stack is somewhat more stable on the 5’ side of thetrimer.
8.2 Dynamics of Hydrogen Atoms in Strong External Fields
Hans O Karlsson, Osvaldo GoscinskiDepartment of Quantum Chemistry, Uppsala University
Research on hydrogenic atoms in strong external electric and magneticfields has attracted much attention recently. The presence of an magneticfield, the Zeeman effect, allows for a comparison between an quantum(highly excited) state and a classical system with chaotic behavior, andthe addition of an electric field, the Stark effect, give rise to interestingresonance features in, e.g. photo ionization cross sections.
With the use of an efficient parallel implementation of a direct re-cursive residue generation method (D-RRGM) on the CM200 [Karlssonand Goscinski, 1994, Karlsson and Goscinski, 1993] we have studied thephoto ionization cross section σ for an hydrogen atom in different combi-nations of crossed electric and magnetic fields. The matrix sizes neededvaried from N = 20000 to N = 45000. The purpose was to test whetherthe auto-correlation function
C(ε) =1σ2
∫ E2
E1
[σ(E + ε)− σ][σ(E)− σ]dE (8.1)
(σ is the average cross section) could be used as a measure when com-paring the quantum system with classical chaotic systems. It was foundthat such a comparison is non-trivial and that supplementary methods
120 Applications in Chemistry

are needed [Karlsson and Goscinski, 1994, Karlsson and Goscinski, 1993,Karlsson and Goscinski, 1995].
The D-RRGM approach was also used to study the time-evolution of ahydrogenic wave packet in the presence of crossed electric and magneticfields. Highly excited hydrogenic wave packets mimic closely classical Highly excited hydrogenic wave
packets mimic closely classicalparticles and are thus anexcellent prototype forcomparison between classicaland quantum physics
particles and are thus an excellent prototype for comparison betweenclassical and quantum physics. We calculated the density-of-states fromwhich the survival probability
P (t) = | < Ψ(0)|Ψ(t) > |2 (8.2)
is given via a Fourier transform. By changing the magnitude and direc-tion of the external fields, the shape and lifetime of the wave packet canbe studied. We found that an increase in electric field strength mightlead to a wave packet with longer lifetime. The survival probability wasfound to be an insufficient measure in comparing with classical chaoticsystems [Karlsson, 1994].
8.3 Parallel Molecular Dynamics Simulations of DNASystems
Aatto Laaksonen, Alexander P. LyubartsevDepartment of Physical Chemistry, Arrhenius Laboratory,Stockholm University
Computer simulation methods, such as, Molecular Dynamics (MD) andMonte Carlo (MC) have now become important techniques to studyfluids and solids. These methods provide a link between theory andexperiment and they are also the only way to study complex many-bodysystems when both experimental techniques and analytical theories areunavailable.
The MD method provides a numerical solution of classical (Newton’s)equations of motion:
mi(d2ri/dt2) = Fi(r1, . . . , rN ) (8.3)
The most time-consuming part (sometimes up to 99% of CPU time) ofthe MD simulations is the calculations of the forces Fi(r1, . . . , rN ). Ina typical case of pair interactions the CPU time may scale with numberof particles N between O(N2) and O(N) depending on the algorithmand the type of interaction potential (note, that scaling as O(N) maybe reached only at a very large N and for systems with short-rangeinteractions).
Now it is a standard routine procedure to simulate molecular systemsconsisting of 100–1000 particles, which in some cases (e.g. simple liquids)is sufficient to obtain a good description of corresponding macrosystem.For other systems, a larger number of particles is needed in order to de-scribe them in a realistic way. Complex bio- and organic molecules (e.g.
Applications in Chemistry 121

proteins, nucleic acids, membranes, carbohydrates, etc. ) immersed intoa solvent increase the number of atoms to be involved into a simulationone to two or more orders. Also, the larger the molecular systems grow,the longer simulations are needed to follow low-amplitude motions andslow conformational transitions. It is clear that the rate of the progresstowards more complex molecular models is set, to a large extent, byadvances in microprocessor technology and computer architecture.Computer simulations of
many-particle systems are verywell suited for parallel computersystems
Computer simulations of many-particle systems are very well suitedfor parallel computer systems. The basic reason for this is that theforces acting on each particle can be calculated independently in differentprocessors. However, the most optimal parallel scheme for a particularproblem depends both on the hardware in hand and on the system underinvestigation (size, type of interaction, etc. ). Electrostatic interactions,fast intramolecular motions due to explicit modeling of hydrogens, angleand torsional angle forces of macromolecules - all these kinds of forcesrequire a special treatment to create an effective parallel code. Thepresent project has the aim to develop a software to simulate systemsof complex molecules (including DNA solutions) with number of atomsin the order of 103–104 during a possibly longer time (up to severalnanoseconds) using several or several dozens connected processors.
The Molecular Dynamics Algorithm
General organization
Complex molecular systems are often described by force fields like AM-BER [Weiner et al., 1986] or Gromos [van Gunsteren and Berendsen,199X]. These force fields contain terms for following interactions:
1. atom-atom short-range interactions (Lennard-Jones potential)
2. atom-atom electrostatic interactions
3. intramolecular interactions: covalent bonds, covalent angles andtorsional angles.
In principle, calculations of atom-atom interactions require a doublesum over all the atom pairs. The application of a cut-off radius for thenon-bonded interactions allows to considerably reduce the CPU time forcalculation of atom-atom interactions, by effectively setting the interac-tions between particles separated by distances larger than the cut-off tozero.
Two problems, however, emerge here. First, the electrostatic interac-tions are long-ranged, and strictly, no cut-off without a special treatmentcan be applied. Second, in order to decide whether to calculate the forcesbetween a given atom pair or not, one still should know the distancesbetween all atomic pairs, or at least to have a list of atom pairs withdistances less than the cut-off (list of neighbors).
122 Applications in Chemistry

One of the most effective and popular methods of treatment of electro-static interactions is the Ewald summation method [Ewald, 1921]. TheEwald method splits up the total force into a long-range and short rangecomponent. The long-range part is calculated in the reciprocal spacewhile the short-range part is treated alongside with the Lennard-Jonesforces. The convergence of the two parts of the Ewald sum is regulatedby a parameter. The optimal choice of the convergence parameter leadsto scaling of the CPU time as O(N3/2).
Creation of the neighbor lists is another problem. In liquids this listshould be updated periodically. In the linked-cell method the search ofneighboring pairs can be limited only by the current and the touchingcells; this leads to an O(N) algorithm. However the true O(N) algorithmis achieved only at very large N ; for the “average size” systems of 103–104 particles periodical (e.g. each 10 MD steps) update of neighbors listby looking through all the atom pairs occurs effective enough. ThoughCPU time of this block is scaled as O(N2), the coefficient is small, andfor example in a test run with 2000 H2O molecules (6000 atoms) thispart of the program consumes about 6% of the CPU time.
Calculations of intramolecular forces due to covalent bonds, anglesand torsional angles are straightforward, although the the resulting ex-pressions may be complicated.
Irrespectively to the parallelization, an essential saving of CPU time An essential saving of CPU timemay be achieved by applying themultiple time scale algorithm
may be achieved by applying the multiple time scale algorithm. Dif-ferent kinds of forces in the system fluctuate at different, characteristictime scales. In systems with explicit treatment of hydrogens, covalentbond forces, Lennard-Jones and electrostatic interactions at short dis-tances between atoms require an updated force calculation after 0.2–0.4 fs, whereas long range parts of Lennard-Jones and electrostatic inter-actions, which consume most of the CPU time, may be calculated after2–4 fs. In the present program the two time scale algorithm is applied[Tukerman et al., 1992]. The covalent forces and atom-atom forces foratoms closer than 5 A are calculated at every short time step. Forcesbetween atoms with distance from 5 A to cut-off and reciprocal part ofthe Ewald sum are calculated at every long time step. Correspondingly,two lists of neighbors are calculated in the program— for fast and forslow forces.
In the present project a SIMD scheme (Single Instruction MultipleData) is applied. All nodes have the same program code, but it is exe-cuted on different data. The “core” of the MD algorithm: preparationof the initial state, moving of particles, average collection, output— thattakes only a minor CPU time — is executed on one (master) node. Aftereach MD step new coordinates and velocities of particles are transferedto the other nodes for force calculations.
Applications in Chemistry 123

Parallelization of specific parts of the program
For an effective parallelization the whole list of atom pairs (I, J =1, . . . , N, I < J) should be uniformly divided between the available num-ber of nodes. The condition I < J is set to avoid a double count,but it makes it difficult to divide equally the atom pairs between thenodes. To avoid this, the following scheme was applied. All particles aredivided equally between processors (loop do I = TASKID,N,NUMTASK,where TASKID is the node number, NUMTASK is the total number of avail-able nodes). For each I we have an inner loop over J with the followingcondition: I − J is even for I > J and J − I is odd for I < J . So theatom pairs occur uniformly distributed between nodes and each one istreated only once. Then for each node lists of close (r < 5A) and far(5 < r < Rcut) neighbors are calculated. These lists are local for eachnode and are recalculated after about 10 long time steps. They are usedfor Lennard-Jones and electrostatic (real space part) force calculations.
Parallelization of the reciprocal part of the Ewald sum is more or lessstraightforward. This contribution is expressed as a sum over reciprocalspace vectors. Each node calculates force contributions due to a certain(fixed for this node) group of reciprocal vectors.
Calculations of forces due to covalent bonds, angles and torsions canbe done independently for each bond, angle, or dihedral angle. They areeasily distributed among available nodes for parallel calculations.
Forces acting on each particle from other particles are summed up oneach node separately. After completing the calculation they are trans-fered to the “master” node, which executes moving of the particles ac-cording to a chosen integration scheme (in the present project threeversions of MD are implemented: constant energy (NVE), constant tem-perature (NVT) and constant pressure and temperature (NPT) molec-ular dynamics). The new positions and velocities of particles are thentransfered back to the other nodes.
Program timing
In the presented algorithm the CPU time for force calculations scaled as1/n with the number of processors n, while the time for the data transferbetween processors is proportional to n. As a results of this the speedupis not linear as the number of processors is increased. The increasingoverhead due to the growing data transfer slows down the speed of thecalculations as the number of processors is increased.
The test calculations showed that a maximum speed is achieved for12–18 nodes, giving a factor about 6–9 in time gain comparatively to therun on a single processor (these values are slightly dependent on numberof particles and some parameters of the MD algorithm). For 8–10 nodesthe gain may be of factor 5–6, that can be considered as an optimalnumber of nodes in our applications.
124 Applications in Chemistry

Next step
At present the work is focusing on an alternative parallelization algo-rithm which should reduce greatly the data transfer between nodes andmake the program suitable for parallel computations with a much largernumber of processors. The basic idea is to split the whole simulation cellinto subcells, each corresponds to separate processor. In this case mostof interactions (first of all “fast” forces recalculated at each small timestep) act between particles in the same subcell, and can be calculatedon the same processor. Data transfer would be needed only to calculateinter-cell interactions and in cases when a particle leaves one subcell foranother. The dependence of data transfer on the number of processorwould still be mainly linear, but with a much smaller coefficient.
Simulation results
During the first half of 1995 the parallel algorithm was under develop-ment and testing. Simultaneously a MD simulation of a real molecularsystem have been carried out: aqueous ionic (NaCl) solution. The sim-ulations was carried out on the IBM SP-2 computer at PDC.
Studies of electrolyte solutions have a great practical interest both intechnological and biological applications. Simulation of ionic solution are Studies of electrolyte solutions
have a great practical interestboth in technological andbiological applications
complicated by the fact that the long-range electrostatic interactions areessential and often have a decisive role in the behavior of such systems.In this connection is important to make simulation in sufficiently largesimulation cell to check size effects. On the other hand, the exists veryslow processes in this system (e.g. creation and dissociation of ionic pairs)with characteristic time scale of about 100 ps. That is why simulationson a long time scale are needed.
We have carried out simulation of system with 1960 water molecules(flexible SPC model) and 20 Na+ and Cl− ions (that corresponds to0.5M solution). The total number of atoms was 5920 and the simula-tion box size was about 39 A. The constant temperature and constantpressure MD algorithm was used. The system was simulated during 1 nsafter 200 ps of equilibration. Running on 8 nodes the program execute1 ps of MD simulation (500 large time steps) in about 50 minutes. Themain objective of this study was to calculate radial distribution functions(RDF) of ions and to compare with RDF obtained for smaller systems(256 and 512 water molecules) calculated before. The result is presentedin Figure 8.2. Other structural and thermodynamical properties wereobtained in this study.
Perspective
At present we are planning to use the program for molecular dynamicssimulation of DNA in water solution in presence of ions. The availablesoftware makes it possible to use realistic flexible models of water and
Applications in Chemistry 125

Figure 8.2. Ion–ion radial distribu-tion functions for 0.5 NaCl aqueoussolution.
0
0.5
1
1.5
2
2.5
3
3.5
4
2 4 6 8 10 12 14 16 18
Na-Cl Na-Na
Cl-Cl
DNA molecules. This in conjunction with constant-pressure MD wouldallow us to study conformational properties of DNA at different saltconcentrations. Obtaining of RDF in these simulations gives a way toconstruct effective potentials of effective ion–DNA interactions whichcould be used for further study in simplified (without water) models[Lyubartsev and Laaksonen, 1995]. The program can be used for studyof interaction of DNA with other biologically important molecules.
8.4 Molecular Dynamics Simulation of a Poly(EthyleneOxide) Surface
Alvo Aabloo, John O. ThomasInstitute of Chemistry, Uppsala University
Potentials developed earlier for crystalline and amorphous bulk PEOsystems have been used for the MD simulation of a PEO surface model.The surface comprises the outer region of a 122 A thick sheet of PEOin which the PEO, -(CH2-CH2-O)n-, chains run obliquely across thecell, and are terminated by C2H5 ethyl groups. The atoms on one sideof the sheet are tethered to facilitate a satisfactory Ewald summation.The sheet expands from its ”crystalline” width of 122 A to 128 A in thesimulated model. Simulations were performed at three temperatures:300K, 400K and 500K. Different behavior in the surface layer was foundcompared to that in the bulk. The structural and dynamical propertiesof the surface were analyzed at each temperature. These calculationswere performed using the IBM SP-2. For further details see [Aabloo andThomas, 199Xa].
126 Applications in Chemistry

8.5 Molecular Dynamics Simulation of Ion Mobility in theCrystalline Poly(Ethylene Oxide) Surface
Alvo Aabloo, John O. ThomasInstitute of Chemistry, Uppsala University
Potentials developed earlier for crystalline and amorphous bulk PEOsystems have been used subsequently to perform MD simulation of aPEO surface. This same model has then been extended to probe thebehavior of ions in this surface compared to that in the bulk of the poly-mer. Neodymium ions have first been inserted to test the performanceof the program, with chlorine as counter ions. The ions were found toconcentrate in a 7 A thick surface layer, and not penetrate further into The ions were found to
concentrate in a 7 A thicksurface layer
the bulk. Evidence is found for a number of different ion associationmodes. Nd – Cl distances were between 1.5 and 1.7 A, and Cl – Cl dis-tances in the range 2.7 to 2.9 A. The polymer structure was much likethat of the ion-free system. Structural and dynamical properties of theion-containing surface have been analyzed. These calculations were per-formed using the IBM SP-2. For further details see [Aabloo and Thomas,199Xb].
8.6 An Integral Direct, Distributed-Data, Parallel MP2Algorithm
Martin Schutz, Roland LindhDepartment of Theoretical Chemistry, Lund University
Introduction
In recent years, advances in computer technology together with sub-stantial improvements in quantum chemical algorithms have enabled abinitio electronic structure calculations on chemical systems of increas-ingly complexity. Common to all of these ab initio algorithms whichaim at large scale problems is that they are integral direct in the sensethat the electron repulsion integrals (ERIs) are reevaluated wheneverneeded, rather than computed once, stored on disk and read from diskwhen required. Hence, the bottleneck of storing the ERIs (formally N4,where N denotes the number of basis functions), which precluded manyapplications, is avoided. Furthermore, the heavy input/output (I/O)load inflicted by conventional algorithms is also avoided. On the otherhand, the CPU time required for a given problem, increases drastically.However, it was also recognized, that the number of ERIs one has to re-compute can be reduced substantially using proper integral prescreeningtechniques, i.e. by estimating the maximal size of a batch of ERIs priorto evaluation, and eventually omitting the evaluation of the ERI batch.
Integral direct methods were first used in SCF theory (“direct SCF”approach by [Almlof et al., 1982], but have since been extended to meth-ods which include electron correlation [Taylor, 1987, Sæbø and Almlof,
Applications in Chemistry 127

1989, Head-Gordon et al., 1988]. In contrast to the SCF method, wherethe ERIs over atomic orbitals (AOs), i.e. the basis functions) are imme-diately contracted to the Fock matrix in AO basis, and only AO integralsare needed, correlated methods are usually formulated in terms of ERIsover molecular orbitals (MOs). This means in practice, that an inte-gral transformation of the ERIs in AO basis to the MO basis is requiredas an intermediate step. A full 4-index transformation, carried out asfour quarter transformations has a flop count that scales as O(N5) andhas O(N4) storage requirements. At a first sight these memory require-ments seem to rule out any integral direct implementation of a correlatedmethod. Fortunately enough, however, most correlated methods can bereformulated in terms of AO ERIs and a reasonably small subset of MOintegrals. Such MO integral subsets typically have two indices restrictedto the occupied orbital space of dimension O, which is usually muchsmaller than N . For example, the computation of the MBPT(2) energyonly requires the exchange integrals (ia | jb) (Mulliken notation with i,j denoting occupied, and a, b virtual orbitals). The memory necessaryto hold such a subset of MO integrals then is O(O2N2). The memoryrequirements can further be reduced to O(ION2) by paging over the firsttransformation index and multipassing over the ERI list: here, I denotesthe size of the segment of the first transformation index, while O/I isthe corresponding number of integral passes.
Integral direct methods are especially powerful in combination withefficient parallelization strategies, moving problems of biochemical in-terest within reach of quantum chemical methods. Here we describeIntegral direct methods are
especially powerful incombination with efficientparallelization strategies, movingproblems of biochemical interestwithin reach of quantumchemical methods
a scalable, distributed-data parallel implementation of direct integraltransformation for a restricted set of MO indices. The code is capable ofdealing with chemical systems beyond 1000 basis functions and 200 cor-related electrons, including low-symmetry cases. Molecular symmetry isexploited by symmetry-adapting the AO ERIs prior to the transforma-tion. Highly superlinear speedups were observed due to efficient use ofboth the compute power and the bulk memory of the MPP system. Thealgorithm is currently implemented in an MP2 code [Schutz and Lindh,199Xb], yet it is easily adopted for other electron correlation methods,where only MO integrals with two indices in the virtual orbitals space arerequired: actually, distributed-data parallel implementations for MP2-R12 [Schutz and Klopper, 199X] and CASSCF, based on the same trans-formation code, are currently under development. In what follows, wewill describe very superficially the computational problem and the par-allel implementation of the MP2 code. For example, the handling of themolecular symmetry and ERI prescreening is omitted completely in thisletter. For a more thorough discussion we refer to [Schutz and Lindh,199Xb].
128 Applications in Chemistry

Computational problem
The MBPT(2) contribution to the correlation energy for a closed shellsystem can be written in spin-free formalism as
E(2) =∑
i,j,a,b
(ia | jb)2 + 12 [(ia | jb)− (ib | ja)]2
εi + εj − εa − εb(8.4)
where i, j and a, b denote occupied and virtual, canonical MOs, respec-tively, and εi, εj, εa, εb the corresponding eigenvalues of the Fock matrix.The MO exchange integrals (ia | jb) are computed from a transformationof the AO or SO ERIs over restricted MO index ranges, i.e.
(ia | jb) =∑
µ,ν,λ,σ
CµiCνaCλjCσb(µν | λσ) (8.5)
where, in the present context, µ, ν, λ and σ denote SOs, and the MOcoefficient matrix C transforms from the SO to the MO basis. In orderto keep the flop count as low as possible the integral transformation usu-ally is carried out in four subsequent steps, with one index transformedafter the other. In the following we will refer to the transformation ofthe 1st, 2nd, 3rd and 4th index as the Q1, Q2, Q3 and Q4 step, respec-tively. Accordingly, the Q1 block contains the integrals (iν | λσ), the Q2block the integrals (ia | λσ), and so on, while the SO block comprisesthe untransformed SO integrals (µν | λσ). Using this notation the Q1step, scaling as O(ON4) with the problem size, dominates the integraltransformation. The evaluation of the SO ERIs requires O(N4) float-ing point operations. Antisymmetrization and summation according toequation (8.4) are all O(O2N2) and not rate limiting.
The main obstacle in direct integral transformation schemes is the vastamount of memory, which is necessary to hold the partially transformedERIs. For example, the Q1 block after full completion of the Q1 step The main obstacle in direct
integral transformation schemesis the vast amount of memory,which is necessary to hold thepartially transformed ERIs
requires O(ON3) memory. In direct transformations with two indiceslimited to the occupied orbital space as for MBPT(2) energy calcula-tions, this can be reduced to O(O2N2), if the Q2 and Q3 steps alreadyare carried out, before all SO integrals for the Q1 step are generated.[Head-Gordon et al., 1988, Sæbø and Almlof, 1989]. Furthermore, if theavailable memory still is exceeded, it is possible to segment the 1st MOindex range with the limiting case of a single i and the correspondingmemory requirement of O(ON2). However, this implies multiple passesthrough the integral list (worst case: O), thus it is desirable to have aslarge segments of i as possible.
Parallel algorithm
The memory requirements are dominated by the Q3 and Q4 integralblocks (both O(ION2)). These blocks therefore are distributed over
Applications in Chemistry 129

the aggregate memory of the MPP system using the concept of globalarrays. The SO, Q1 and Q2 blocks on the other hand only containthe ERIs for a fixed quadruplet or doublet of symmetry-unique shellsand hence are much smaller (O(S4) and O(INS2), where S denote thesize of a shell). These blocks thus are kept local and are private toeach computational node, together with the MO coefficients, which arereplicated. The underlying communication framework to access remotepatches of global arrays is built on top of the Global Array (GA) toolkitof [Nieplocha et al., 1994, Bernholdt et al., 1995]. This toolkit providesa virtual “shared memory” programming model for two-dimensional ar-rays, yet nonuniform memory access is not hidden from the applicationprogram. One-sided access to remote patches without any need for coop-eration between the computational threads on the data-requesting andthe data-owning nodes is provided either by forking a shared-memorydataserver on each node, or by installing a data serving interrupt han-dler, as is the case on the IBM SP-2, which allows for interrupt drivenmessage-passing. One-sided access of remote data eliminates unneces-sary synchronization between nodes, implying enhanced performance rel-ative to conventional message-passing schemes.
ERI generation and transformation up to the Q3 step are split upinto individual tasks, which are distributed over the computational nodesand executed in parallel. If an ERI batch (µν | λσ) is defined by thesymmetry-unique shell quadruplet M, N, Λ, Σ, then a single task cor-responds to the shell doublet Σ, Λ ≤ Σ, looping over all shells N, M ≤ N.Hence, if the number of symmetry-unique shells Σ is denoted by nΣ,then the number of individual tasks is equal to nΣ(nΣ +1)/2, and growsquadratically with increasing size of the chemical system under study.Even for systems of only moderate size, the number of tasks is usuallyEven for systems of only
moderate size, the number oftasks is usually sufficient toensure reasonable load balancingon a fair number of nodes
sufficient to ensure reasonable load balancing on a fair number of nodes.Before the actual k4 loop for ERI evaluation and transformation is
entered, each node creates a private task list by enumeration of all sym-metry-unique shell doublets Σ, Λ ≤ Σ. This task list is sorted afterwardswith respect to a task criterion, which depends (i) on the assessed tasklength (i.e. long tasks have high priority, while short tasks are used forpadding towards the end), and (ii) on the locality of each task.
The individual task length is estimated by the number of primitivepairs that belong to the corresponding Σ, Λ ≤ Σ shell doublet. Since theprescreening of ERIs is based on primitive pair entities, and is alreadyaccomplished at that point (see [Schutz and Lindh, 199Xb] for furtherdetails), the estimate of the task length is actually based on the genuinenumber of primitive pairs that remain after the prescreening. The tasklocality on the other hand is defined as the ratio of the summed upsizes of the local Q3 patches, and the total Q3 patches, which will beaccessed by a given task. The position of a given task in the list thenreflects its priority for a given node. Before a node finally executesa task, it has to register it on a global task list. The mechanism of
130 Applications in Chemistry

Figure 8.3. Observed and linearspeedup relative to two nodes, in therange of 2 to 48 SP-2 nodes. The filleddiamonds correspond to the timings,compiled in Table 8.1. The secondgraph displays the same data, butwith a more appropriate scaling of theordinate than the first one, which hasthe conventional scaling and yields thelinear speedup line at 45o.
0 50Number of Nodes
0
50
100
150
Effe
ctiv
e S
peed
up R
elat
ive
to 2
Nod
es
0 10 20 30 40 50Number of Nodes
0
50
100
150
reserving individual tasks in a specific order on a global task list allowsfor dynamic load balancing in a “self-service” way, without any need fora special master or control process. Moreover, giving the tasks a priorityrelative to the locality of the data, which will be accessed, renders savingsin interprocessor communications.
After all tasks are executed, the complete set of Q3 ERIs is availablein global memory. Prior to the Q4 step the Q3 blocks are transposedand the Q4 step is performed completely local.
Performance
The parallel efficiency of the algorithm is demonstrated by calculationson the phenantrene molecule (C2v symmetry, with 762 primitive Gaus-sians, contracted to 412 basis functions). For molecular systems of this For molecular systems of this
size, integral direct methodsstart to become the only possibleroute
size, integral direct methods start to become the only possible route;hence this test case may have some practical significance, although it isstill small enough to be well suited for scalability measurements. Thenumber of symmetry-unique shells for this system is 31, forming 496individual tasks.
The calculations were performed on the IBM SP-2 at PDC. Perfor-mance data is tabulated in Table 8.1 and Figure 8.3 displays this datagraphically, comparing it with a linear speedup curve. The measuredwall clock time on 48 nodes is less than 15 minutes for this calculation,and the speedup relative to single node execution is estimated to 527.
Applications in Chemistry 131

Table 8.1. Wall clock times in sec-onds and speedup factors relative to 2nodes as a function of nodes.
# nodes Telapsed # passes speedup
2 122238 8 1.004 32045 4 3.818 8730 2 14.00
16 2510 1 48.6932 1315 1 92.9739 1109 1 110.2548 884 1 138.21
Speedup factors substantially above linear speedup are observed. On 48nodes, the observed speedup is 5.8 times larger than linear speedup (withreference to 2 nodes). This superlinear speedup is a result of exploitingboth the compute power and the aggregate memory of the parallel com-puter, reducing the number of necessary integral passes and hence savingnot only wall clock but CPU time relative to single node execution. Out-side of the superlinear regime, i.e. between 16 and 48 nodes when only asingle pass is necessary, the algorithm still shows satisfying performance,with a parallel efficiency on 48 vs 16 nodes of 95%. Calculations in ex-cess of 1000 basis functions with reasonable elapsed times are possiblewith our code. The largest calculations performed so far comprised 1266primitives contracted to 702 basis functions, and 82 correlated electrons.On 64 SP-2 nodes, each with 128 Mbyte memory, this calculation tookabout 90 minutes in wall clock time, and two integral passes [Schutz andLindh, 199Xa].
Applications
Currently, two application projects based on the new integral direct,parallel MP2 code are in progress at PDC:
1. Weakly bound van der Waals complexes between aromatic moleculesand rare gas atoms
Solvent clusters M-Rn between aromatic molecules (M) and rare-gasatoms (R) have become prototype systems for the investigation ofsolvation at the microscopic level. The combination of molecularbeam techniques, laser and mass spectroscopy enables the synthesisof such clusters in collisionless environment, and their mass-specificdetection and spectroscopy. Recently, the stimulated emission pump-ing/resonant two-photon ionization (SEP-R2PI) method was intro-duced, [Droz et al., 1995], a novel spectroscopic technique, which al-lows for the mass-selective determination of vdW binding energies ofsuch systems in the ground and 1st electronically excited state withvery high accuracy. On the theoretical side, ab initio calculations onsuch system are very demanding, since in order to model the predom-inant dispersive interactions properly, large basis sets have to be used.
132 Applications in Chemistry

In the present PDC project the intermolecular potential energy sur-faces (IPES) of the anthracene-Ar (cf. Figure 2.23 on page 24) andanthracene-Ar2 vdW complexes are studied at the MP2 level, employ-ing large ANO basis sets, i.e. 700 basis functions and more. Differentbonding sites of the Ar atom on top of the catacondensed aromatic ringsystem are investigated. The computed ab initio IPES will be usedlater to construct an analytical model potential for the M-R solute-solvent interaction, which in turn can be employed in Monte Carloand dynamics studies to investigate microsolvation effects, occuringin larger anthracene-Arn (n = 10, . . . , 40) and similar clusters.
2. The significance of the trigger reaction of the calicheamicin anti cancerdrug
The new enediyne class of anti cancer drugs acts by cleaving the DNAstrand after undergoing a Bergman like autoaromatization and form-ing a highly reactive biradical. This autoaromatization process is initi-ated by a so called trigger reaction. The calicheamicin (cf. Figure 2.23on page 24) is a molecule of this class, which all have in common theenediyne moiety. Whereas the formation of the biradical is fully un-derstood, the significance of the preceding trigger reaction still needsto be investigated. The favored hypothesis is that the effect of thetrigger reaction is to alter the enediyne structure itself, leading to adecrease in the activation barrier of the biradical formation. Anothertheory is that the trigger reaction enables the biradical formation bysaturating a double bond in the vicinity of the enediyne moiety. Thepresence of this double bond would make the biradical formation ener-getically unfavorable. i.e. the trigger reaction is reducing the reactionenergy of the biradical formation. The present study investigates thelatter hypothesis at the MP2 level of theory employing small to largeANO basis sets (400–800 basis functions). The calculations are ex-tremely expensive since the molecules under study are large and donot have any symmetry.
8.7 The Structure of the Blue Copper Proteins
Mats Olsson, Ulf Ryde, Bjorn RoosDepartment of Theoretical Chemistry, Lund UniversityJan der Kerpel, Kristin PierlootDepartment of Chemistry, University of Leuven, Belgium
Blue copper proteins are a group of electron-transfer proteins that arecharacterized by an intense blue color, unusually high reduction poten-tials and unique electron spin resonance spectroscopic features [Adman,1991, Sykes, 1990]. They all contain a copper ion that changes betweenthe oxidation states +I and +II during electron transfer. A typicalexample is plastocyanin, a water-soluble protein with a key role in pho-tosynthesis. The crystal structure of plastocyanin is known [Guss et al.,
Applications in Chemistry 133

1992, Adman, 1991] and shows an unusual ligand geometry around thecopper atom: the copper atom is coordinated to three ligands at shortdistances, one thiolate group from a cysteine residue and two histidinenitrogen atoms. At a longer distance there is a fourth ligand, a methio-nine thioether sulphur atom. The ligands form a distorted tetrahedron,something which is rarely found in small inorganic Cu(II) complexes.Some blue copper proteins, e.g. azurin, have an additional fifth ligand,an amide oxygen from the protein backbone, coordinated at a long dis-tance to the metal atom.
These unique chemical properties of the blue copper proteins early ledto the suggestion that Cu(II) is forced by the protein into a strained con-formation, namely to a geometry similar to the one prefered by Cu(I).In this way the protein would facilitate the electron transfer by minimiz-ing the reorganization energy. This idea was later developed into moregeneral hypotheses regarding protein function, the “induced rack” and“entatic state” theories [Malmstrom, 1994, Williams, 1995].
We have started a project on the blue copper proteins, where weWe intend to test the strainhypotheses and try to explainthe extraordinary properties ofthe protein using theoreticalmethods
intend to test the strain hypotheses and try to explain the extraordinaryproperties of the protein using theoretical methods. Naturally, the entireproteins are far too large for high-level quantum chemical calculations.Therefore smaller model systems are investigated, typically[Cu(imidazole)2SCH3S(CH3)2]+.
In order to test the strain hypotheses, the model systems are optimizedin vacuum using a density functional method (B3LYP as implementedin the IBM quantum chemical software Mulliken [Rice et al., 1995]). Inthis way, we can study the intrinsic coordination preferences of the metalion and its ligands without the protein. If the optimized structure of themodel system is similar to the structure found in the protein then thestrain hypotheses probably have to be revised. In fact, this turns outto be the case, see Figure 2.24 on page 25; it seems that the unusualproperties of the blue copper protein should rather be attributed to thethe chemical properties of the ligands [Ryde et al., 1996].
Why is the copper ion quasi-tetrahedrally coordinated in the proteinwhile most Cu(II) complexes assume a tetragonal (square-planar or oc-tahedral) structure? We have tried to answer this question by optimizinga large number of small copper complexes with different ligands.
The geometry of a copper complex is governed by the ligand-ligandrepulsion, the ligand-metal attraction and the ligand-field stabilization.The ligand-field theory provides simple rules that give a qualitative pic-ture of the structure of metal complexes. For Cu(II) complexes, whichhave a d9 configuration (i.e. four filled and one half filled d-orbitals), itpredicts a tetragonal structure with the ligands in the direction of thelobes of the energetically highest (singly) occupied d-orbital. This is inagreement with the optimized structure of [Cu(NH3)4]2+ which has aslightly distorted square-planar geometry, as can be seen in Figure 2.25on page 25.
134 Applications in Chemistry

If an ammonia ligand is replaced by a thiolate ion ([Cu(NH3)3SH]+),the ground state is still tetragonal, but there is also a trigonal (see Fig-ure 2.26 on page 25) state only 13 kJ/mole higher in energy. This iswithin the error limits of the method. In this state the thiolate lig-and forms a three-electron S 3p-Cu 3d π-bond to the metal atom. Thiscan be viewed as a special case of a square-planar structure, where thelobes of the sulphur 3p-orbital occupy two coordination positions, seeFigure 2.26 on page 25.
It is interesting to note that for the best blue copper protein model,[Cu(NH3)2SHSH2]+, the trigonal state is in fact the ground state, inaccordance with the protein structure, see Figure 2.27 on page 25. How-ever, the energy difference is only 4 kJ/mole, i.e. so small that bothstructures may be populated at ambient temperature.
In conclusion, the unusual structure of the blue copper proteins seems The unusual structure of theblue copper proteins seems to bean effect mainly of the cysteinethiolate ligand
to be an effect mainly of the cysteine thiolate ligand, which due to itssize may form a strong π-bond to the copper ion. The role of the proteinis probably to provide appropriate ligands and to exclude water from theactive site.
8.8 Ab Initio and DFT Investigations of SolutionTautomerism of DNA BasesAnders Broo, Anders HolmenDepartment of Physical Chemistry, CTH
The structure and prototropic tautomeric equilibria of the nucleic acidbases have received much attention ever since the determination of thestructure of the nucleic acids by Watson and Crick. Experimentally,structural data have been obtained from X-ray and neutron-diffractionstudies of the individual nucleic acid bases. The tautomeric equilibriahave been studied mainly by various spectroscopic techniques, both influid solution and in rigid rare-gas matrices.
The use of quantum chemical methods to calculate the equilibriumgeometries and energies of molecules of the size of the DNA bases posessome problems due to the high cost of accurate calculations. Geometriesobtained with semi-empirical or Hartree-Fock ab initio methods havebeen found to differ significantly from geometries obtained experimen-tally. Thus, there is a need for computational methods that include someof the electron correlation.
We have used the Gaussian94 set of programs to determine the ge-ometry and relative energies of several purine and purine derivativesincluding the DNA base adenine. The 7,9 H tautomerism is exemplified The IBM SP-2 computer have
offered a suitable platform forthe most expensive calculationsin this study
in Figure 8.4. This type of calculations are very computer resource de-manding, both on CPU power and I/O capacity. The IBM SP-2 computerhave offered a suitable platform for the most expensive calculations inthis study.
Applications in Chemistry 135
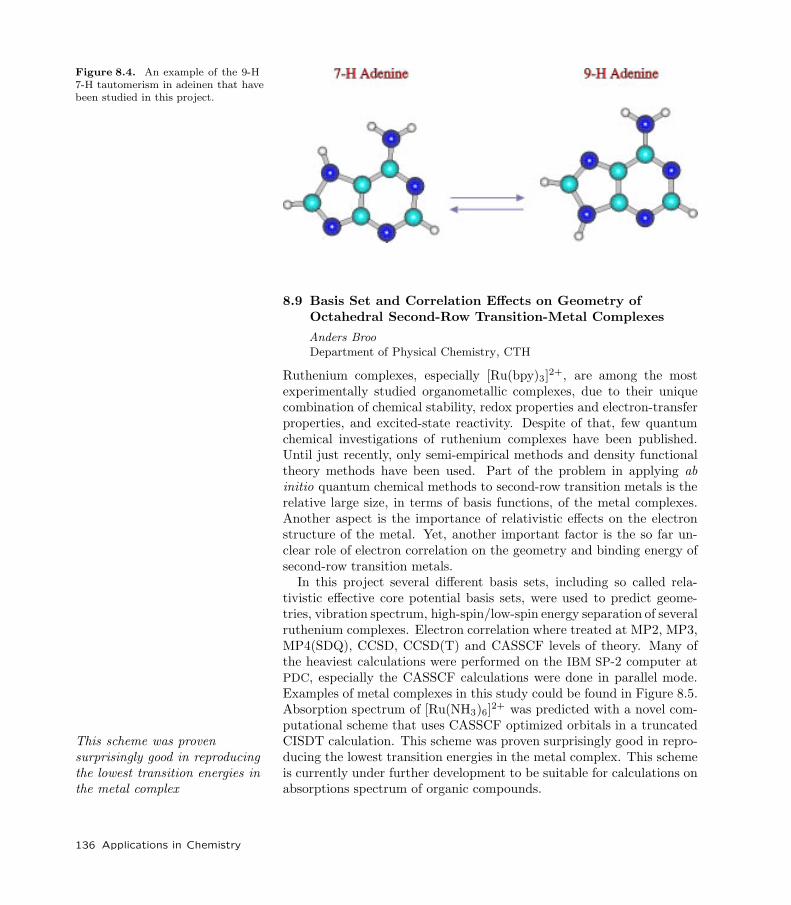
Figure 8.4. An example of the 9-H7-H tautomerism in adeinen that havebeen studied in this project.
8.9 Basis Set and Correlation Effects on Geometry ofOctahedral Second-Row Transition-Metal Complexes
Anders BrooDepartment of Physical Chemistry, CTH
Ruthenium complexes, especially [Ru(bpy)3]2+, are among the mostexperimentally studied organometallic complexes, due to their uniquecombination of chemical stability, redox properties and electron-transferproperties, and excited-state reactivity. Despite of that, few quantumchemical investigations of ruthenium complexes have been published.Until just recently, only semi-empirical methods and density functionaltheory methods have been used. Part of the problem in applying abinitio quantum chemical methods to second-row transition metals is therelative large size, in terms of basis functions, of the metal complexes.Another aspect is the importance of relativistic effects on the electronstructure of the metal. Yet, another important factor is the so far un-clear role of electron correlation on the geometry and binding energy ofsecond-row transition metals.
In this project several different basis sets, including so called rela-tivistic effective core potential basis sets, were used to predict geome-tries, vibration spectrum, high-spin/low-spin energy separation of severalruthenium complexes. Electron correlation where treated at MP2, MP3,MP4(SDQ), CCSD, CCSD(T) and CASSCF levels of theory. Many ofthe heaviest calculations were performed on the IBM SP-2 computer atPDC, especially the CASSCF calculations were done in parallel mode.Examples of metal complexes in this study could be found in Figure 8.5.Absorption spectrum of [Ru(NH3)6]2+ was predicted with a novel com-putational scheme that uses CASSCF optimized orbitals in a truncatedCISDT calculation. This scheme was proven surprisingly good in repro-This scheme was proven
surprisingly good in reproducingthe lowest transition energies inthe metal complex
ducing the lowest transition energies in the metal complex. This schemeis currently under further development to be suitable for calculations onabsorptions spectrum of organic compounds.
136 Applications in Chemistry

Figure 8.5. A picture of some ofthe studied metal complexes in thisproject, together with a schematicpicture of the molecular orbital (MO)diagram of the metal centered MO’s.
Applications in Chemistry 137

8.10 A First Principles Study of the Dehydroxylation of2M1-MuscoviteMichael OdeliusDepartment of Physical Chemistry, Uppsala UniversityMarco BernasyyconiMax-Planck Institut fur Festkorperforschung, Stuttgart, GermanyMichele ParrinelloDipartimento di Fisica, Universita di Milano, Italy
2M1-Muscovite, KAl2(Al,Si3)O10(OH)2, is a hydroxyl containing layeredmineral (see Figure 8.6), which at elevated temperatures looses its hy-droxyl groups, i.e. the hydroxyl groups react with each other to formwater, and a phase transition to a metastable dehydroxylated form of2M1-Muscovite occurs.
This work aims at determining the mechanism for the dehydroxylationof 2M1-Muscovite by means of first principle Car-Parrinello moleculardynamics (MD) simulations.
The dehydroxylation of 2M1-Muscovite and other micas have beencarefully studied by many different experimental techniques, which havebeen successful in characterizing the difference between the 2M1-Musco-vite crystal and its dehydroxylated form. However, the detailed mecha-nism for the reaction is still under debate. It is difficult to reach fromthe experimental information to a fully described mechanism.
It has been shown by X-ray diffraction and Mossbauer spectroscopyon dehydroxylated 2M1-Muscovite that the coordination in the “octa-hedral” layer is changed from six to five. The reaction occurs in a widetemperature range (800–1220K), which has been interpreted as evidenceboth for the influence of the Al substitutions and for an inhibiting effectof the five coordinated Al3+ on neighboring reaction sites.
In IR studies the OH line has been observed to shift with the temper-ature before disappearing, suggesting that an intermediate state existsfor the hydroxyl group. Also shifts in the vibrational spectra of K+ hasbeen observed. Electrical conductivity indicate that the ions diffuse be-fore forming water, and the activation energy for the proton diffusionis determined. Thus, a solid experimental ground exists for the study,and still valuable information on the mechanism of dehydroxylation islacking, motivating the theoretical study.
Car-Parrinello [Car and Parrinello, 1985] has developed an ab initiomethod to perform MD simulations for classical nuclei, based on densityfunctional theory. It enables us to calculate accurate quantum mechani-cal forces on the nuclei, as an alternative to the use of model potentials.The method is very suitable for studying crystals, since it is based on aplane wave description and periodic boundary conditions. This excludesan explicit treatment of the core electrons, but with ab initio pseudopotentials and gradient corrections to the energy functional we get adescription comparable to MP2 calculations.
138 Applications in Chemistry

Figure 8.6. In the 2M1-Muscovitestructure, a layer of octahedrally co-ordinated Al3+ ions is sandwichedbetween two tetrahedral silicate lay-ers, with vertices pointing towards theoctahedral layer. The buckled basalplane of the tetrahedra forms distortedhexagonal rings of oxygens. Aluminumis randomly substituted for silicon witha ratio of 1:3, and for charge compensa-tion potassium counterions are presentat the center of all the hexagonal rings.The hydroxyl groups are located in thejunction between the octahedral andtetrahedral layers, under the rings,and they form long hydrogen bonds tooxygens in the rings. The highlightedregion contains a schematic picture ofthe dehydroxylation: 2 OH− ⇒ H2O+ O2−.
Applications in Chemistry 139

It offers a large number of possibilities for analyzing the dehydroxyla-tion process, since both the dynamics and the electron structure can bestudied. We have seen in earlier structure calculations of 2M1-Muscovite[Odelius et al., 199X] that the bond lengths and orientations of the hy-droxyl groups depend strongly on the presence of the Al substitutionsites, which will effect the reaction path way.
In the study we will perform MD simulations at increasing tempera-tures, in order to study the motion of the hydroxyl groups, the releaseof the protons and the transformation to the dehydroxylated form of2M1-Muscovite.
140 Applications in Chemistry

9 Miscellaneous Projects
9.1 Multi-Disciplinary Parallel Optimization
Dan HolmALFGAM Optimering AB
The Swedish government has decided that a new Swedish marine vessel(YS2000) shall be developed. In the first round two ships are to bebuilt. FMV, the Swedish Defense Material Administration, has givenKarlskrona Varvet (KkrV) the task to construct and to manufacture thetwo vessels. At the request of, and in collaboration with, KkrV and FMVALFGAM Optimering AB is responsible for the structural optimizationof the hull of the vessel.
The vessel, which is 71 meters long, will be built using compositesandwich technique. Sandwich structures have the advantage, comparedto traditional steel structures, that it is possible to build an as stiff andtough structure to a lesser weight. This weight reduction can either beused to lower the fuel consumption or to increase performance.
Demands exist on the performance of the vessel (such as speed andwave height etc. ) and it is necessary that the structure meets the stateddemands to a minimum weight and/or cost. If the problem is reduced toan optimization problem, it can be formulated as follows: chose materialsand dimensions of the core and face so the weight of the structure isminimized with constraints on stress, stiffness and cost. Accordingly, theprimary goal with the structural analysis was to calculate and optimizethe core and face materials as well as dimensions (i.e. chose thicknessand quality of the foam core and thickness, material and lay up of theface composite laminates).
The constraints can be split into different parts: each sandwich panelmust meet the regulations from DNV (Den Norske Veritas), local partsof the model must stand the pressure from local slamming loads, thewhole model must be able to handle the global stress condition originatedfrom global sea loads and the sandwich must stand declared impactcriterions. Each of these mechanisms put demands on the core and faceconfiguration.
OCTOPUS is an optimization program, developed at ALFGAM Op-timering AB, that enables multi-disciplinary optimization. OCTOPUSuses MMA (Method of Moving Asymptotes) as optimization algorithm.OCTOPUS can handle criterions from different analyses and, based onthem, perform a global optimization. The different analyses must notnecessarily be structural. Every property that can be calculated can beused as a criterion in the analysis. The different analyses can also be
Miscellaneous Projects 141

Figure 9.1. The Swedish Marine’snew vessel YS2000.
run on different computers. OCTOPUS can handle analyses running onup to 100 different processors and is therefore very well suited to run ona parallel computer such as Strindberg.
In this particular case four “part analyses” models were developed.One panel analysis due to DNV rules, one FEM model analyzing localslamming, one FEM model analyzing the global stress conditions due tosea loads and one analysis controlling the impact. These analyses wererun in parallel on different nodes on the Strindberg IBM SP-2 computer.For each iteration of the optimization process one analysis of the partanalyses must be carried out. OCTOPUS administrates the collecting ofcriterions from the different part analyses and the distribution of variablevalues to the different part analyses. Using OCTOPUS and parallel op-timization enables a solution which meet all the demands and criterionsput on the structure to a minimum weight.
Parallel optimization problems like this are well suited to run on paral-lel computers like Strindberg. The total optimization problem can easilybe split into different, independent part. The different part analyses canbe run on different processors and OCTOPUS enables them to take partin the same global optimization. This cuts the total analysis time in thevery time consuming optimization process. Figure 9.1 highlights someof the principles behind the construction of YS200.
142 Miscellaneous Projects

9.2 Simulation and Prediction of Real and Artificial FinancialSystems
Erik Aurell, Per OsterCenter for Parallel Computers, KTHJesper OppelstrupDepartment of Numerical Analysis and Computing Science, KTHMats NordahlInstitute of Theoretical Physics, CTH
In the last ten years the word market (in Swedish “marknad”) has be-come one of the most frequently cited in the media, and the phenomenonit describes has risen to a dominating importance. Our interest stemsfrom the fact that a market, as an object of scientific discourse, is stillvery poorly understood. The traditional viewpoint of economic theoryis that market behavior can be understood in terms of equilibrium the-ory, but, as is evident from everyday life, real markets are dynamic andvolatile, and speculation bubbles are not uncommon.
The objective of this project is to bring methods from modern theoret-ical physics, scientific computing and nonlinear dynamics to bear on theevolution, predictability and possibly prediction of markets. The seniormembers of the project are Erik Aurell and Per Oster at PDC, JesperOppelstrup at NADA and Mats Nordahl at the Institute of Theoreti-cal Physics of Chalmers University of Technology in Goteborg. Severaldiploma students work in the project. The project is supported by aNUTEK grant.
Results
1. A new theory of pricing of risky options, a generalization of the stan-dard Black-Scholes theory, see [Aurell and Zyczkowski, 1995].
A second paper on the same subject, in collaboration with Jean-Philippe Bouchaud of CEA-Saclay in France is in preparation.
2. An implementation of a genetic programming model to develop tech-nical trading rules. Application has been made to one year of currencyexchange data on the interbank market, purchased from Olsen & As-sociates in Zurich, Switzerland, see [Madjidi, 1996].
A second paper by Mats Nordahl, Hakan Jonsson and Payam Madjidiis in preparation.
3. Implementation of a model of an artificial market, originally proposedby Ken Steiglitz in Princeton. The study has so far not been pushedmuch further than in Steiglitz’ paper.
4. An analysis using wavelet techniques, looking for periodicities andcross-correlations in the high-frequency data of Olsen & Associates.A report by Denis Galyagin is in preparation.
Miscellaneous Projects 143

9.3 Burgers’ Equation with Noisy Initial Data
Erik AurellCenter for Parallel Computers, KTHSergey N. Gurbatov, Sergey I. SimdyankinUniversity of Nizhny, Novgorod, Russia
This project is a collaboration between Erik Aurell, Uriel Frisch of Ob-servatoire de Nice, France, and Sergey Gurbatov and Sergey Simdyankin,of the Radiophysics department at the University of Nizhny, Novgorod,Russia.
The problem studied is the statistical properties of solutions to Burg-ers’ equation, vt + vvx = νvxx, for large times, when the initial ve-locity and its potential are stationary Gaussian processes. The initialpower spectral density at small wave numbers follows a steep power-lawE0(k) ∼ |k|n where the exponent n is greater than one. Burgers initiallyproposed his equation as a mathematical model of hydrodynamic turbu-lence. It has later turned out to be not quite adapted to this purpose,but the equation is anyhow simple and natural enough to crop up inmany diverse physical systems.
The particular situation here, with these initial conditions, is relevantto the propagation and late decay of high-amplitude acoustic noise.
The great advantage of Burgers’ equation from the numerical andtheoretical point of view, is that it follows from a variational principle,and so can be integrated by a fast procedure, going directly from initialto final data.
Our first objective was to compare, in the special case of n greaterthan two, results of numerical simulations with dimensional predictions,and with asymptotic analytical theory. This theory, which has quitea long and distinguished history, predicts self-similarity of statisticalcharacteristics of turbulence, and also leads to a logarithmic correctionto the law of energy decay in comparison with dimensional analysis.We confirmed numerically the existence of self-similarity for the powerspectral density, and the existence of a logarithmic correction to thedimensional predictions.
Our second objective was to extend the theory to the case when theexponent n is between one and two. In this case the spectrum for largetimes is no more self-similar, but exhibits several ranges. In particular, atsufficiently large spatial scales, the correlations present in the initial dataare preserved, an instance of the general phenomena of the permanenceof large eddies. We extended the theory by a sort of cluster expansionto get a hold of subleading terms, which give the correlation functionsat large times.
We verified numerically the existence of several scaling ranges in thespectrum, and the locations of the breakpoints [Aurell and et al., 1996].
144 Miscellaneous Projects

9.4 PDC++ and Parade — C++ Class Library andVisualizer for Data Parallel Programming
Erik Wallin1
Center for Parallel Computers, KTHMattias Sandstrom, Micael Bergerholm, Mattias Lofstedt, Patrik NilssonFredrik Ruda, Jakob Sellgren, Ludvig Karlsson, Lars Persson2
Department of Numerical Analysis and Computing Science, KTH
Object oriented programming is becoming more and more common insolving complex problems. The most important advantages are informa-tion hiding and abstraction. These two techniques together provide forreusability, portability and improved structure of programs.
So far, no object oriented tools have been available for the CM200 andonly a few are available for data parallel programming in general. Theseall involve a modified compiler. We have developed a C++ class libraryand a visualization/debugging tool that runs on the CM200. The libraryis general enough to be possible to port to other architectures of bothSIMD and MIMD type. It does not require any compiler modifications,and is thus easier to port. This also improves the stability, since stableC++ compilers and development tools are readily available.
Although portable, programs written using the library may not exe-cute equally efficient on all architectures. This depends on what featuresof the library that are used, and on how the problem at hand has beenparallelized. The important thing is that the program will work on anymachine where the library has been ported. It may then be optimizedfor that particular machine by using different features of the library.
The new language called PDC++ is inspired by C*, the parallel ex-tension to C developed by TMC. It contains a number of classes fordeclaring and manipulating parallel arrays. These can be allocated indifferent dimensions, and with integer, real or complex types. Commu-nication and arithmetic operations are implemented and overloaded onthe regular mathematical operators.
The library also improves the language construction in several ways,by removing some of the restrictions of C*. The most important one isthat the programmer does not have to keep track of what the currentshape is. This is handled automatically by the library. It is also possibleto utilize the capability to use variable precision integers on the CM200.For example 5-bit integers.
The current implementation on the CM200 is built as a class librarywrapper around C/Paris. This makes it possible to utilize low-levelCM200 functions, while maintaining a high level of abstraction. It is forexample not necessary to keep track of how many bits are allocated fora particular integer array.
1Developed PDC++, initiated and supervised the development of Parade.2Developed Parade as part of their M.Sc. program.
Miscellaneous Projects 145

Figure 9.2. A prototype showing onepart of the user interface.
Another improvement is a more standardized addressing of the arrays,by using the same syntax for parallel arrays as in serial arrays. It is alsopossible to create an array of parallel pointers. This enables commoncommunication patterns to be stored once, and then reused.
All data parallel programming requires powerful debugging and visu-alization tools. Our approach to this problem is to develop a genericvisualization tool. It can present array data with any number of di-mensions. The data can be displaying in graphical form, as well as rawnumbers. See Figure 9.2.
The visualizer is independent of the debugger used, and runs withinthe application being debugged. Thus it is possible to utilize other welltested and stable tools for the actual debugging. We considered it im-portant for the visualizer (and the C++ library) to be independent ofthe choice of compiler and debugger. The visualizer could of course beintegrated into the debugger for a particular implementation.
The code for the visualizer is independent both of the debugger andthe implementation of the library. It should therefore run on any archi-tecture without modification.
We hope to port the library to other MPP architectures in the future.It is of course also possible to port it to ordinary workstations for devel-opment and educational purposes. It could also prove to be an efficienttool for solving problems suited for data parallel programming even ona sequential computer.
146 Miscellaneous Projects

Bibliography
[Aabloo and Thomas, 199Xa] Aabloo, A. and Thomas, J. O. (199Xa).Molecular Dynamics Simulation of a Poly(Ethylene Oxide) Surface. Sub-mitted for publication in Computational Polymer Science. 126
[Aabloo and Thomas, 199Xb] Aabloo, A. and Thomas, J. O. (199Xb).Molecular Dynamics Simulation of Ion Mobility in the CrystallinePoly(Ethylene Oxide) Surface. Submitted for publication in J. Elec-trochim. Acta. 127
[Adman, 1991] Adman, E. T. (1991). Copper Protein Structures. Adv. Prot.Chem. 42: 145–197. 133, 134
[Agren et al., 1993] Agren, H., Vahtras, O., Koch, H., Jørgensen, P.,
and Helgaker, T. (1993). Direct Atomic Orbital Based Self-Consistent Field Calculations of Non-linear Molecular Properties. Ap-plication to the Frequency Dependent Hyperpolarizability of Para-Nitroaniline. Journal of Chemical Physics 98: 64. 75
[Almlof et al., 1982] Almlof, J., K. Faegri, J., and Korsell, K. (1982).J. Comput. Chem. 3: 385. 127
[Alund et al., 1994] Alund, A., Lotstedt, P., and Ryden, R. (1994).Computational fluid dynamics on a workstation cluster in industrial en-vironments. In: PARA94, number 879 in Lect. Notes in Comp. Science.Springer-Verlag, 1994. 51, 52
[Alund et al., 1995] Alund, A., Lotstedt, P., and Sillen, M. (1995). So-lution of Compressible Flow Problems in Parallel with Static Load Bal-ancing. Technical Report L-0-1 R159, Saab Military Aircraft, Linkoping,Sweden. Also available as Technical Report 1995:2, ITM, Goteborg. 51
[Alund and Ryden, 1994] Alund, A. and Ryden, R. (1994). Solving theNavier-Stokes Equations with Combustion on a Cluster of Workstationsin an Industrial Environment. Technical Report 1994:1, ITM, ChalmersScience Park, 412 88 Goteborg, Sweden. 52
[Alund and Sunderam, 1993] Alund, S. W. A. and Sunderam, V. S.
(1993). The NAS Parallel Benchmarks on Virtual Parallel Machines.Technical Report 1993:7, ITM. 39
[Andersson et al., 1992] Andersson, J.-O., Mattsson, J., and
Svedlindh, P. (1992). Phys. Rev. B 46: 8297. 86
Bibliography 147

[Andersson et al., 1994] Andersson, J.-O., Mattsson, J., and
Svedlindh, P. (1994). Phys. Rev. B 49: 1120. 86
[Andersson and Ledfelt, 1995] Andersson, U. and Ledfelt, G. (1995).Solving the Maxwell equations with a 2D Finite Volume Methodon the CM200. To appear in Proceedings from workshop on ap-proximations and numerical methods for the solution of the Maxwellequations, Oxford university computing laboratory. Also available athttp://www.nada.kth.se/na/publications. 36
[Aurell and et al., 1996] Aurell, E. et al, (1996). TRITA-PDC Report 1996:2,submitted to Physics of Fluids. A more thorough report to be submittedto J Fluid Mech is in preparation. 144
[Aurell and Zyczkowski, 1995] Aurell, E. and Zyczkowski, K. (1995). Op-tion Pricing and Partial Hedging: Theory of Polish Options. Technicalreport, PDC. TRITA-PDC Report 1995:1. 143
[Bech et al., 1995] Bech, K., Tillmark, N., Alfredsson, P., and Ander-
sson, H. (1995). An Investigation of Turbulent Couette Flow at LowReynolds Numbers. J Fluid Mech. 286: 291–372. 47
[Belonoshko, 1994] Belonoshko, A. (1994). Molecular Dynamics of MgSiO3
Perovskite at High Pressures: Equation of State, Structure and MeltingTransition. Geochimica et Cosmochimica Acta 58: 4039–4047. 113
[Belonoshko and Ahuja, 199X] Belonoshko, A. and Ahuja, R. (199X).Embedded-Atom Study of Iron Melting. Submitted to High PressureResearch. 113
[Belonoshko and Dubrovinsky, 1995] Belonoshko, A. and Dubrovin-
sky, L. (1995). Molecular Dynamics of Stishovite Melting. Geochimicaet Cosmochimica Acta 59: 1883–1889. 113
[Belonoshko and Dubrovinsky, 1996] Belonoshko, A. and Dubrovin-
sky, L. (1996). Molecular Dynamics of NaCl (B1 and B2) and MgO(B2) Melting: Two Phase Simulation. American Mineralogis 81: 303–316. 113
[Bergman and Sawley, 1993] Bergman, C. and Sawley, M. (1993). TheUse of the Message Passing Programming Model on Distributed Net-works for Computational Fluid Dynamics. EPFL Supercomputing Re-view . 37, 38, 38
[Bernholdt et al., 1995] Bernholdt, D., Apra, E., Fruchtl, H.,
Guest, M., Harrison, R., Kendall, R., Kutteh, R., Long, X.,
Nicholas, J., Nichols, J., Taylor, H., Wong, A., Fann, G., Lit-
tlefield, R., and Nieplocha, J. (1995). Int. J. Quantum Chem.:Quantum Chem. Symp. 29: 475. 130
148 Bibliography

[Binder and Young, 1986] Binder, K. and Young, A. P. (1986). Rev. Mod.Phys. 58: 801. 86
[Boerlijst and Hogeweg, 1991] Boerlijst, M. C. and Hogeweg, P. (1991).Spiral Wave Structure in Pre-Biotic Evolution: Hypercycles StableAgainst Parasites. Physica D 48: 17–28. 81
[Bolcs and Fransson, 1986] Bolcs, A. and Fransson, T. H. (1986). Aeroe-lasticity in Turbomachines, Comparison of Theoretical and Experimen-tal Cascade Results. Communication de Laboratoire de Thermique Ap-pliquee et de Turbomachines 1, EPFL, Switzerland. 64, 64, 64
[Bott, 1989a] Bott, A. (1989a). A Positive Definite Advection Sheme Ob-tained by Nonlinear Renormalization of the Advective Fluxes. Mon.Wea. Rew. 117: 1006–1015. 42
[Bott, 1989b] Bott, A. (1989b). Reply. Notes and Correspondance. Mon.Wea. Rew. 117: 2626–2633. 42
[Bray and Moore, 1985] Bray, A. and Moore, M. A. (1985). Phys. Rev. B31: 631. 84
[Brooks et al., 1983] Brooks, B. R., Bruccoleri, R. E., Olafson, B. D.,
States, D. J., Swaminathan, S., and Karplus, M. (1983). J.Comp. Chem. 4: 187–217. 119
[Brower et al., 1994] Brower, R. C., Tamayo, P., and York, B. (1994). AParallel Multigrid Algorithm for Percolating Clusters. Technical report.88, 89
[Cao et al., 1996] Cao, G. X., Wong, A., and Zhu, X. D. (1996). In:Bulletin of the American Physical Society, volume 41. NY: APS, p. 421.93
[Cao and He, 1996] Cao, J. and He, S. (1996). An Exact Absorbing Bound-ary Condition and its Application to Three-Dimensional Scattering fromThin Dispersive Structures. J. Acoust. Soc. Am. 99: 1854–1861. 80
[Cao and He, 199X] Cao, J. and He, S. (199X). An Ill-Posed Problem of theContinuation of Transient Data for a Hyperbolic Equation in a Three-Dimensional Inhomogeneous Half-Space. J. Math. Phys. , In press. 80
[Car and Parrinello, 1985] Car, R. and Parrinello, M. (1985). Phys. Rev.Lett 55: 2471. 138
[Chakarova and Pazsit, 1995] Chakarova, R. and Pazsit, I. (1995). In:Proceedings of International Conference on Mathematics and Compu-tations, Reactor Physics and Environmental Analyses, volume 2, 1995,p. 1195. 106
Bibliography 149

[Childress, 1981] Childress, S. (1981). Mechanics of Swimming and Flying.University Press. 82
[Corbett et al., 1964] Corbett, J. W., Watkins, G. D., and Donald, R.
S. M. (1964). New Oxygen Infrared Bands in Annealed IrradiatedSilicon. Phys. Rev. B 135: A1381. 98
[Cronhjort, 1995] Cronhjort, M. (1995). Models and Computer Simulationsof Origins of Life and Evolution. PhD thesis, KTH, Stockholm. 81, 81
[Cronhjort and Blomberg, 1994] Cronhjort, M. and Blomberg, C.
(1994). Hypercycles versus Parasites in a Two-Dimensional Partial Dif-ferential Equations Model. J. theor. Biol. 169: 31–49. 81
[Cronhjort and Nyberg, 1995] Cronhjort, M. and Nyberg, A. (1995). 3DHypercycles have no Stable Spatial Structure. Physica D 88. 81
[Drew, 1983] Drew, D. (1983). Mathematical Modeling of Two-phase Flow.Ann. Rev. Fluid Mech. 15: 261–291. 59
[Droz et al., 1995] Droz, T., Burgi, T., and Leutwyler, S. (1995). J.Chem. Phys. 103: 4035. 132
[Dzugutov, 1995] Dzugutov, M. (1995). Phason Dynamics and AtomicTransport in an Equilibrium Dodecagonal Quasi-crystal. Europhys. Lett.31: 95–100. 71
[Dzugutov, 1996a] Dzugutov, M. (1996a). Atomic Kinetics and DynamicalPhason Disorder in a Quasicrystal. In: MRS Proceedings, volume 407,1996, p. 319. 71
[Dzugutov, 1996b] Dzugutov, M. (1996b). Entropy and Atomic Transport inCondensed Matter. Technical Report TRITA-PDC 1996:1, PDC, KTH,Stockholm, Sweden. 70
[Dzugutov, 1996c] Dzugutov, M. (1996c). A Universal Scaling Law forAtomic Diffusion in Condensed Matter. Nature 381. 70
[Dzugutov and Phillips, 1995] Dzugutov, M. and Phillips, J. C. (1995).Structural Relaxation in an Equilibrium Quasicrystal. Journ. Non-Cryst. Solids 192-193: 397–400. 71
[Edwards and Anderson, 1975] Edwards, S. F. and Anderson, P. W.
(1975). J. Phys. F 5: 965. 83
[Eigen et al., 1981] Eigen, M., Gardiner, W., Schuster, P., and
Winkler-Oswatitsch, R. (1981). The Origin of Genetic Informa-tion. Sci. Am. 78–94. 81
150 Bibliography

[Erdos et al., 1977] Erdos, J., Alzner, E., and McNally, W. (1977).Numerical Solution of Periodic Transonic Flow through a Fan Stage.AIAA Journal 15: 1559–1568. 63
[Ewald, 1921] Ewald, P. (1921). Ann. Phys. 64: 253. 123
[Ewels et al., 1995] Ewels, C. P., Jones, R., and Oberg, S. (1995). FirstPrinciples Investigation of Vacancy Oxygen Defects in Si. Mat. Sci.Forum 196-201: 1297–1302. 98
[Ewels et al., 1996a] Ewels, C. P., Jones, R., and Oberg, S. (1996a).Oxygen-Carbon, Oxygen-Nitrogen and Oxygen-Dimer Defects in Silicon.NATO ARW ‘Oxygen ’96’, Exeter , In press. 99
[Ewels et al., 1996b] Ewels, C. P., Jones, R., Oberg, S., et al. (1996b).Shallow Thermal Donor Defects in Silicon. Phys. Rev. Lett. 77: 865. 99
[Fisher and Huse, 1988] Fisher, D. S. and Huse, D. A. (1988). Phys. Rev.B 38: 373 and 386. 84
[Forsching, 1974] Forsching, H. (1974). Aeroelastizitat. Berlin-Heidelberg:Springer Verlag. 62
[Fransson, 1993] Fransson, T., (1993). Aeroelasticity in Axial-Flow Turbo-machines. Lecture Notes, KTH. 64
[Frisch et al., 1987] Frisch, U., d’Humieres, D., Hasslacher, B.,
P. Lallemand, Y. P., and Rivet, J. (1987). Complex Systems1: 649. 82
[Frisch et al., 1986] Frisch, U., Hasslacher, B., and Pomeau, Y. (1986).Phys. Rev. Lett. 56. 82
[Fristedt and Bergman, 1994] Fristedt, E. and Bergman, M. (1994). TheUse of Workstation Farms for Industrial CFD Computations. Submittedto Journal of Distrubuted Computing. 37, 39, 40
[Gould and Tobochnik, 1985] Gould, H. and Tobochnik, J. (1985). Intro-duction to Computer Simulations, Part 2. Addison-Wesley PublishingCo. Inc. 89
[Gradin and Ledfelt, 1995] Gradin, U. and Ledfelt, G. (1995). Compu-tational Electromagnetics in 2D. Technical Report TRITA-NA-E9338,NADA, KTH, Stockholm, Sweden. 36
[Guss et al., 1992] Guss, J. M., Bartunic, H. D., and Freeman, H. C.
(1992). Accuracy and Precision in Protein Crystal Structure Analysis:Restrained Least-Squares Refinement of the Crystal Structure of PoplarPlastocyanin at 1.33 A Resolution. Acta Cryst. B48: 790–807. 25, 134
Bibliography 151

[Hallberg and Lindstrom, 1992] Hallberg, T. and Lindstrom, J. L.
(1992). Enhanced Oxygen Precipitation in Electron-Irradiated Silicon.J. Appl. Phys. 72: 5130. 98
[Hammarlund and Ekeberg, 1996] Hammarlund, P. and Ekeberg, O.,(1996). Large Neural Network Simulations on Multiple Hardware Plat-forms. (Submitted.). 27
[Hammer and Norskov, 1995] Hammer, B. and Norskov, J. (1995). WhyGold is the Noblest of All the Metals. Nature 376: 238. 91
[Hammer et al., 1994] Hammer, B., Scheffler, M., Jacobsen, K., and
Nørskov, J. (1994). The Potential Energy Surface for H2 Dissocationover Cu(111). Phys. Rev. Lett. 73: 1400. 91
[Harlow and Amsden, 1975] Harlow, H. and Amsden, A. (1975). Numer-ical Calculation of Multiphase Flow. J. Comp. Phys. 17: 19–52. 60
[Head-Gordon et al., 1988] Head-Gordon, M., Pople, J., and Frisch, M.
(1988). Chem. Phys. Letters 153: 503. 128, 129
[Helgaker et al., 199X] Helgaker, T., Jensen, H., Jørgensen, P.,
H. Koch, J. O., Agren, H., Bak, K., Bakken, V., Chris-
tiansen, O., Dahle, P., Dalskov, E., Enevoldsen, T.,
Halkier, A., Heiberg, H., Hettema, H., Jonsson, D., Kir-
pekar, S., Kobayashi, R., de Meras, A., Mikkelsen, K., Nor-
man, P., Packer, M., Ruud, K., Taylor, P., and Vahtras, O.
(199X). DALTON, an ab initio Electronic Structure Program, 199X. 73
[Hemmingsson, 1995] Hemmingsson, J. (1995). J. Phys. A: Math. Gen.28: 4245. 82
[Jackson and Persson, 1995] Jackson, B. and Persson, M. (1995). Ef-fects of Isotopic Substitution on Eley-Rideal Reactions and Adsorbate-Mediated Trapping. (J. Chem. Phys. accepted) . 95
[Jonason et al., 1996] Jonason, K., Mattsson, J., and Nordblad, P.
(1996). Phys. Rev. B 53: 6507. 84, 87
[Jonason et al., 199X] Jonason, K., Mattsson, J., and Nordblad, P.
(199X). Preprint. 84, 87
[Jones, 1992] Jones, R. (1992). Ab initio Cluster Calculations of Defectsin Solids. Philosophical Transactions of the Royal Society, London, A341: 351. 97
[Jones et al., 1994a] Jones, R., Oberg, S., Rasmussen, F. B., et al.(1994a). Identification of the Dominant Nitrogen Defect in Silicon. Phys.Rev. Lett. 72: 1882. 99
152 Bibliography

[Jones et al., 1994b] Jones, R., Ewels, C., Oberg, S., et al. (1994b). The-oretical and Isotopic Infrared-Absorption Investigations of Nitrogen-Oxygen Defects in Silicon. Semicond. Sci. Tech. 9: 2145–2148. 99
[Jonsson et al., 1996] Jonsson, D., Norman, P., and Agren, H. (1996).Cubic Response Functions in the Multiconfiguration Self-ConsistentField Approximation. The Journal of Chemical Physics 105. 75
[Juhlin, 1995] Juhlin, C. (1995). Finite-Difference Elastic Wave Propaga-tion in 2D Heterogeneous Transversely Isotropic Media. GeophysicalProspecting 43: 843–858. 115, 115
[Kallberg, 1989] Kallberg, P. (ed.). (1989). HIRLAM Forecast Model Level1 Documentation Manual, S-601 76 Norrkoping, Sweden, 1989. SMHI.41
[Karlsson, 1994] Karlsson, H. O. (1994). Dynamics of Hydrogenic WavePackets in Electric and Magnetic Fields. Physical Review A 50: 3787–3792. 121
[Karlsson and Goscinski, 1993] Karlsson, H. O. and Goscinski, O.
(1993). A Direct Recursive Residue Generation Method, PDC ProgressReport 1993. p. 66–67. 120, 121
[Karlsson and Goscinski, 1994] Karlsson, H. O. and Goscinski, O.
(1994). A Direct Recursive Residue Generation Method. Applicationto Photoionization of Hydrogen in Static Electric Fields. Journal ofPhysics B 27: 1061–1072. 120, 121
[Karlsson and Goscinski, 1995] Karlsson, H. O. and Goscinski, O.
(1995). Autocorrelation Functions in the Photoionization of Hydrogenin Electric and Magnetic Fields. Physical Review A 51: 1154–1158. 121
[Klein and Batrouni, 1990] Klein, W. and Batrouni, G. G. (1990). Su-persymmetry in Cahn-Hilliard Cook Theory. Technical report. 88
[Koelbel et al., 1994] Koelbel, C., Loveman, D., Schreiber, R.,
Steel Jr., G., and Zosel, M. (1994). The High Performance FortranHandbook. MIT Press. Cambridge MA. 88, 89
[Komminaho, 1995] Komminaho, J. (1995). Numerical Simulation of theNavier Stokes Equations on Massively Parallel Computers. TRITA-MEK, KTH. 47
[Komminaho et al., 1995a] Komminaho, J., Lundbladh, A., and Johans-
son, A. (1995a). Determination of the Transition Reynolds Number inPlane Couette Flow through Study of Relaminarization. Submitted toPhys. Fluids . 47
Bibliography 153

[Komminaho et al., 1995b] Komminaho, J., Lundbladh, A., and Johans-
son, A. (1995b). Very Large Structers in Plane Turbulent Couette Flow.J Fluid Mech. 320: 259–285. 47
[Koper and Hilhorst, 1988] Koper, G. J. M. and Hilhorst, H. J. (1988).J. Phys. France 49: 429. 84
[Lansner, 1991] Lansner, A. (1991). A Recurrent Bayesian ANN capable ofExtracting Prototypes from Unlabeled and Noisy Example. In: Artifi-cial Neural Networks (Proc. of ICANN-91), edited by T. Kohonen et al,volume 1, 1991, p. 247–254. 29
[Lansner and Ekeberg, 1989] Lansner, A. and Ekeberg, O. (1989). AOne-Layer Feedback Artificial Neural Network with a Bayesian LearningRule. Int. J. of Neural Systems 1: 77–87. 29
[Levin, 1995] Levin, B. (1995). On Extensions, Parallel Implementation andApplications of a Bayesian Neural Network. PhD thesis, Royal Instituteof Technology, Stockholm, Sweden. 30
[Leyland et al., 1995] Leyland, P., Vos, J. B., van Kemenade, V., and
Ytterstrom, A., (1995). NSMB: A Modular Navier Stokes multiblockcode for CFD. AIAA Paper 95-0568. 48
[Liljenstrom, 1991] Liljenstrom, H. (1991). Modeling the Dynamics of Ol-factory Cortex using Simplified Network Units and Realistic Architec-ture. Int. J. Neural Systems 2: 1–15. 33
[Liljenstrom, 1995] Liljenstrom, H. (1995). Autonomous Learning withComplex Dynamics. Int. J. Neural Systems 10: 119–153. 32
[Lin and Gomer, 1991] Lin, T. S. and Gomer, R. (1991). Diffusion of 1Hand 2H on the Ni(111) and (100) Planes. Surf. Sci. 255: 41. 93, 94
[Lindblad, 1995] Lindblad, M. (1995). VolMoP V1 User’s Guide. TechnicalReport 9970-1221, Volvo Aero Corporation, 461 81 Trollhattan, Sweden.52
[Lindstrom and Hallberg, 1995] Lindstrom, J. L. and Hallberg, T.
(1995). Vibrational Infrared-Absorption Bands Related to the ThermalDonors in Silicon. J. Appl. Phys. 77: 2684. 101
[Ljungquist et al., 1993] Ljungquist, J., Renulf, F., and Akermo, M.
(1993). Losning av Eulers Ekvationer pa ett kluster av arbetstationer.Technical Report 1993:6, TDB, Uppsala University. 37
[Lotstedt and Alund, 1994] Lotstedt, P. and Alund, A. (1994). MultigridSolution of the Euler and Navier-Stokes Equations on a WorkstationCluster in an Industrial Environment. Technical Report L-0-1 R150,Saab Military Aircraft, Linkoping, Sweden. Also available as TechnicalReport 1994:3, ITM, Goteborg. 51, 51
154 Bibliography

[Lotstedt and Sillen, 1993] Lotstedt, P. and Sillen, M. (1993). MultigridMultiblock Solver of the Stationary Euler and Navier-Stokes Equations.Technical Report L-0-1 R148, Saab Military Aircraft, Saab Military Air-craft, Linkoping, Sweden. 50
[Lyubartsev and Laaksonen, 1995] Lyubartsev, A. P. and Laaksonen, A.
(1995). Phys. Rev. E, (in press). 126
[Madjidi, 1996] Madjidi, P. (1996). Genetic Programming and Analysis ofHigh-Frequency Financial data. Technical report, PDC. TRITA-PDCReport 1996:3. 143
[Maletta et al., 1982] Maletta, H., Aeppli, G., and Shapiro, S. M.
(1982). Phys. Rev. Lett. 21: 1490. 84
[Malmstrom, 1994] Malmstrom, B. G. (1994). Rack-Induced Bonding inBlue-Copper Proteins. Eur. J. Biochem. 223: 711–718. 25, 134
[Mattsson et al., 1993a] Mattsson, J., Jonsson, T., Nordblad, P., Ka-
tori, H. A., and Ito, A. (1993a). Phys. Rev. Lett. 74: 4305. 86
[Mattsson et al., 1993b] Mattsson, T. R., Engberg, U., and Wahn-
strom, G. (1993b). H Diffusion on Ni(100): A Quantum Monte CarloSimulation. Phys. Rev. Lett. 71: 2615. 93
[Mattsson and Wahnstrom, 1995] Mattsson, T. R. and Wahnstrom, G.
(1995). Quantum Monte Carlo Study of Surface Diffusion. Phys. Rev.B 51: 1885. 93
[Mattsson et al., 1996] Mattsson, T. R., Wahnstrom, G., Bengts-
son, L., and Hammer, B. (1996). Quantum Mechanical Calculationof H on Ni(001) Using a Model Potential Based on First Principles Cal-culations. Applied Physics Report 96-39 , To be subitted to Phys. Rev.B. 93
[McMillan, 1984] McMillan, W. L. (1984). J. Phys. C 17: 3179. 84
[Metropolis and et al., 1953] Metropolis, N. et al. (1953). Equations of StateCalculations by Fast Computing. Journal of Chemical Physics 21: 1087–1092. 89
[Mirebeau et al., 1990] Mirebeau, I., Itoh, S., Mitsuda, S., Watan-
abe, T., Endoh, Y., Hennion, M., , and Rapoular, R. (1990).Phys. Rev. B 41: 405. 84
[Mohammadi, 1994] Mohammadi, B. (1994). Fluid Dynamics Computationwith NSC2KE. Technical Report RT-0164, INRIA, France. 57
Bibliography 155

[Naimark and Ismail-Zadeh, 1995] Naimark, B. and Ismail-Zadeh, A.
(1995). Numerical Models of Subsidence Mechanism in IntracratonicBasin: Application to North American Basins. Geophys. J. Int.123: 149–160. 111
[Naimark et al., 1996] Naimark, B., Ismail-Zadeh, A., and Jacoby, W.
(1996). Numerical Approach to Problems of Gravitational Instability ofGeostructures with Advected Material Boundaries. Geophys. J. Int. , inpress. 111
[NAT, 1996] NATO-ASI. (1996). Quantum Diffusion Calculations of H onNi(001) Using a Model Potential Based on First Principles Calculations,New-York, 1996. Plenum. 94
[Neilsen et al., 1996] Neilsen, B. B., Lisby, T., and Nielsen, K. B. (1996).Uniaxial Stress Measurements on Oxygen-Implanted Silicon: the 889cm-1 Local Mode. NATO ARW ‘Oxygen ’96’ , In press. 98
[Nieplocha et al., 1994] Nieplocha, J., Harrison, R., and Little-
field, R., (1994). Global Arrays: A Portable ”Shared Memory” Pro-gramming Model for Distributed Memory Computers, page 330, IEEE.130
[Norberg and Nilsson, 1995a] Norberg, J. and Nilsson, L. (1995a). J.Phys. Chem. 7: 2550–2554. 119
[Norberg and Nilsson, 1995b] Norberg, J. and Nilsson, L. (1995b). J.Am. Chem. Soc. 117: 10832–10840. 120
[Norman et al., 1996a] Norman, P., Jonsson, D., Agren, H., Dahle, P.,
Ruud, K., Helgaker, T., and Koch., H. (1996a). Efficient ParallelImplementation of Response Theory: Calculation of the Second Hyper-polarizability of the Polyacenes. Chemical Physics Letters 253: 1. 75
[Norman et al., 1996b] Norman, P., Jonsson, D., Vahtras, O., and
Agren, H. (1996b). Non-Linear Electric and Magnetic Properties Ob-tained from Cubic Response Functions in the Random Phase Approxi-mation. Chemical Physics 203: 23. 75
[Odelius et al., 199X] Odelius, M., Bernasconi, M., and Parrinello, M.
(199X). A First Principles Study of the Structure of 2M1-Muscovite. Tobe published. 140
[Olowsom and Almstedt, 1990] Olowsom, P. and Almstedt, A. (1990).Influence of Pressure and Fluidization Velocity on the Bubble Behaviourand Gas Flow Distribution in a Fluidized Bed. Chem. Engin. Sci.45: 1733–1741. 60
156 Bibliography

[Ozen, 1993] Ozen, A. (1993). Data Mapping Algorithms For DistributedMemory MIMD Machines. Technical Report TRITA-NA-E9326, NADA,KTH. 37
[Palm, 1995] Palm, T. (1995). Effects of Remote Impurity Scattering Includ-ing Donor Correlations in a Branching Electron Wave Guide. Phys RevB 52: 11284. 108
[Payne et al., 1992] Payne, M. C., Teter, M. P., Allan, D. C.,
Arias, T. A., and Joannopoulos, J. D. (1992). Iterative Mini-mization Techniques for ab initio Total-Energy Calculations: MolecularDynamics and Conjugate Gradients. Rev. Mod. Phys. 64: 1045. 91
[Persson and Robertson, 1990] Persson, C. and Robertson, L. (1990). AnOperational Eulerian Dispersion Model Appliable to Different Scales.In: Proceedings of the 18th Technical Meeting of NATO-CCMS on AirPollution Modelling and Its Applications, Vancouver, Canada. 41
[Persson, 1995] Persson, I. (1995). Performance Analysis of a CFD-code onthe IBM-SP2. Technical Report T-95-16, IMHEF, EPFL, Switzerland.56, 56
[Persson and Ytterstrom, 1996] Persson, I. and Ytterstrom, A. (1996).Computations on an Inviscid Supersonic Flow Case with Structured andUnstructured Methods Using Serial and Parallel Computers. TechnicalReport TRITA-NA-96XX, C2M2, KTH, Sweden. 58
[Persson and Jackson, 1995a] Persson, M. and Jackson, B. (1995a). AFlat Surface Model Study of Eley-Rideal Dynamics of RecombinativeDesorption of Hydrogen on a Metal Surface. J. Chem. Phys. 102: 1078.95
[Persson and Jackson, 1995b] Persson, M. and Jackson, B. (1995b). Iso-tope Effects in the Eley-Rideal Dynamics of the Recombinative Desorp-tion of Hydrogen on a Metal Surface. Chem. Phys. Lett. 237: 468. 95
[Prins, 1995] Prins, J. F. (1995). Ion-Implanted N-type Diamond —Electrical Evidence. Diamond and Related Materials 4: 580–585. 100
[Pazsit and Chakarova, 1994] Pazsit, I. and Chakarova, R. (1994). Phys.Rev. B 50: 13953. 105
[Pazsit and Chakarova, 1996] Pazsit, I. and Chakarova, R. (1996). Vari-ance and Correlations in Sputtering and Defect Distributions. TransportTheory and Statistical Physics , In press. 101
[Reger and Young, 1989] Reger, J. D. and Young, A. P. (1989). J. Phys.Condens. Matter 1: 915. 84
Bibliography 157

[Rettner, 1992] Rettner, C. (1992). Dynamics of the Direct Reaction ofHydrogen Atoms Adsorbed on Cu(111) with Hydrogen Atoms Incidentfrom the Gas-Phase. Phys. Rev. Lett. 69: 383. 94
[Rettner and Auerbach, 1995] Rettner, C. and Auerbach, D. (1995). Dy-namics of the Eley-Rideal Reaction of D Atoms with H Atoms Adsorbedon Cu(111): Vibrational and Rotational State Distribution of the HDProduct. Phys. Rev. Lett. 74: 4551. 94, 95
[Rev, 1991] (1991). Time-Dependent Methods for Quantum Dynamics. Comp.Phys. Comm. 63. 94
[Rice et al., 1995] Rice, J. E., Horn, H., Lengsfiels, B. H.,
McLean, A. D., Carter, J. T., Replogle, E. S., Barnes, L. A.,
Maluendes, S. A., Lie, G. C., Gutwski, M., Rude, W. E.,
Sauer, S. P. A., Lindh, R., Andersson, K., Chevalier, T. S.,
Widmark, P.-O., Bouzida, D., Pacansky, G., Singh, K.,
Gillan, C. J., Carnevali, P., Swope, W. C., and Liu, B.
(1995). MullikenTM Version 2.25b, internal release. IBM Corporation,Almaden, USA, 1995. 134
[Rudgyard et al., 1994] Rudgyard, M., Schonfeld, T., Struijs, R., Au-
demar, G., and Leyland, P. (1994). A Modular Approach for Com-putational Fluid Dynamics. In: ECCOMAS 94, 1994. 55
[Ryde et al., 1996] Ryde, U., Olsson, M. H. M., and Roos, B. O. (1996).The Cupric Geometry of Blue Copper Proteins is not Strained. J. Mol.Biol. 261: 586–596. 134
[Ryden, 1995] Ryden, R. (1995). VolSol V2 User’s Manual. Technical Report9970-1161, Volvo Aero Corporation, 461 81 Trollhattan, Sweden. 52
[Sæbø and Almlof, 1989] Sæbø, S. and Almlof, J. (1989). Chem. Phys.Letters 154: 83. 128, 129
[Saenger, 1988] Saenger, W. (1988). Principles of Nucleic Acid Structure.New York: Springer-Verlag. 119
[Safonov et al., 1996] Safonov, A. N., Lightowlers, E. C., Davies, G.,
Leary, P., Jones, R., and Oberg, S. (1996). Interstitial-CarbonHydrogen Interaction in Silicon. Submitted to Phys. Rev. Letters. 100
[Sawley and Bergman, 1994] Sawley, M. and Bergman, C. (1994). A Com-parative Study of the Use of the Data-parallel Approach for CompressibleFlow Calculations. Journal of Parallel Computing . 37
[Sawley and Tegner, 1994] Sawley, M. and Tegner, J. (1994). A Data-Parallel Approach to Multi-Block Flow Computations. Int. J. Numer.Meth. in Fluids 19: 707–721. 40
158 Bibliography

[Sawley and Tegner, 1995] Sawley, M. and Tegner, J. (1995). A Compari-son of Parallel Programming Models for Multiblock Flow Computations.J. Comp. Phys. 122: 280–290. 41
[Schutz and Klopper, 199X] Schutz, M. and Klopper, W. (199X).An Integral-Direct, Distributed-Data Parallel MP2-R12 Algorithm.Manuscript in preparation. 128
[Schutz and Lindh, 199Xa] Schutz, M. and Lindh, R. (199Xa). To bepublished. 132
[Schutz and Lindh, 199Xb] Schutz, M. and Lindh, R. (199Xb). AnIntegral-Direct, Distributed-Data Parallel MP2 Algorithm. Acceptedfor publication in Theor. Chim. Acta. 128, 128, 130
[Stavola et al., 1983] Stavola, M., Patel, J. R., et al. (1983). Diffusivityof Oxygen in Silicon at the Donor Formation Temperature. Appl. Phys.Lett. 42: 73. 99
[Sundstrom, 1996] Sundstrom, A. (1996). FE-modellering av Akustisk Emis-sion i kompositlaminat. Master’s thesis, KTH, Department of Solid Me-chanics. 78
[Sykes, 1990] Sykes, A. G. (1990). Active-Site Properties of the Blue CopperProteins. Adv. Inorg. Chem. 36: 377–408. 133
[Taylor, 1987] Taylor, P. (1987). Int. J. Quantum Chem. 31: 521. 128
[Thi, 1993] Thinking Machines Corporation, Cambridge, MA. (1993). Usingthe CMAX Converter, July 1993. 42
[Thomas, 199X] Thomas, L. V. (199X). Simulations for Supersymmetry inCHC Theory. In progress. 88, 89
[Thomsen, 1986] Thomsen, L. (1986). Weak Elastic Anisotropy. Geophysics51: 1954–1966. 115, 116
[TMC, 1994] TMC. (1994). CM Fortran User’s Guide Version 2.1, January1994. 89
[Tukerman et al., 1992] Tukerman, M., Berne, B. J., and Mar-
tyna, G. J. (1992). J. Chem. Phys. 97: 1990. 123
[van Gunsteren and Berendsen, 199X] van Gunsteren, W. F. and
Berendsen, H. J. C. (199X). Gromos Library Manual. Biomos,Nijenborgh 16, Groningen, The Netherlands, 199X. 122
[Vos et al., 1995] Vos, J. B., Leyland, P., Lindberg, P. A., Keme-
nade, V. v., and Gacherieu, C., (1995). NSMB Handbook 3.3.ESPRIT Project 8421, Work Package WP6.1, RD21. 48
Bibliography 159

[Wada and Liou, 1994] Wada, Y. and Liou, M. S., (1994). A Flux SplittingScheme with High-Resolution and Robustness for Discontinuities. AIAAPaper 94-0083. 62
[Weiner et al., 1986] Weiner, S. J., Kollman, P. A., Ngyuen, D. T., and
Case, D. A. (1986). J. Comput. Chem. 7: 230. 122
[White et al., 1994] White, J., Bird, D., Payne, M., and Stich, I. (1994).Surface Corrugation in the Dissociative Adsorption of H2 on Cu(100).Phys. Rev. Lett. 73: 1404. 91
[Wilhelmsson, 1995] Wilhelmsson, T. (1995). Simulating the Dynamics ofOlfactory Cortex on a Connection Machine. Master’s thesis, LinkopingInstitute of Technology, Linkoping, Sweden. LiTH-ISY-EX-1336. 32
[Williams, 1995] Williams, R. J. P. (1995). Energised (Entatic) States ofGroups and of Secondary Structures in Proteins and Metalloproteins.Eur. J. Biochem. 234: 363–381. 25, 134
[Worgan and Robinson, 1992] Worgan, K. and Robinson, P. (1992). Tech-nical Report 91:13, SKI, Stockholm, Sweden. 109
[Ystrom, 1993] Ystrom, J. (1993). On Convective Effects in Sedimentation ofConcentrated Suspensions with High Effective Gravity. Technical ReportTRITA-NA-931, NADA, KTH. 61
[Ystrom, 1996] Ystrom, J. (1996). On the Numerical Modeling of Concen-trated Suspensions and of Viscoelastic Fluids. PhD thesis, KTH. TRITA-NA-9603. 61
[Zhu et al., 1992] Zhu, X., Lee, A., Wong, A., and Linke, U. (1992).Surface Diffusion of Hydrogen on Ni(100): An Experimental Observationof Quantum Tunneling Diffusion. Phys. Rev. Lett. 68: 1862. 93
160 Bibliography

IndexAabloo, Alvo, 126, 127ABB Corporate Research, 37, 52,
54Aerospatiale, 47, 49AFS, see Andrew File SystemAlfgam Optimering, 141Alund, Anders, 8, 39Andersson, Jan-Olov, 83Andersson, Marlene, 108Andersson, Ulf, 35Andrew File System, 9ANN, see Artificial Neural Net-
worksArrhenius Laboratory, 121Artificial Neural Networks, 30Aurell, Erik, 8, 143, 144AVBP, 54–56
Barth, Harald, 8Belgium, 133Belonoshko, Anatoly B., 113Bengtsson, Lennart, 91, 92Bergerholm, Micael, 145Bergman, Magnus, 37–39Bernasyyconi, Marco, 138Biology, 27–34
3D brain data, 34airplane pilot dynamics, 30hippocampus, 32large neural networks, 27neural network clustering for
remote sensing, 29olfactory cortex, 32
Bodelsson, Berith, 8Broo, Anders, 135, 136
C2M2, see Center for Computa-tional Mathematics and Me-chanics
Cao, Jiasu, 79, 80Carlsson, Peter, 8CEM, see Computational Elec-
tromagnetics
Center for Computational Math-ematics and Mechanics, 35,37–39, 54, 57, 60
Center for Parallel Computers,1, 2, 7–10, 27, 29, 37, 40,41, 47, 50, 53, 67, 70, 91,92, 96, 97, 103, 108, 109,115, 125, 131–133, 136, 143–145
Center for Structural Biochem-istry, 119
CERFACS, 47, 48, 54CFD, see Computational Fluid
DynamicsChakarova, Roumiana, 101, 103,
105Chalmers University of Technol-
ogy, 10, 59, 91, 94, 101, 103,105, 135, 136, 143
Department of Applied Physics,91, 94
Department of Energy Conver-sion, 59
Department of Physical Chem-istry, 135, 136
Department of Reactor Physics,101, 103, 105
Department of Thermo and FluidDynamics, 59
Institute of Theoretical Physics,143
CHARMM, 119Chemistry, 119–140
2M1-Muscovite, 138blue copper proteins, 133conformational free energy land-
scape, 119DNA systems, 121hydrogen atoms in strong fields,
120integral direct MP2 algorithm,
127
Index 161

poly(ethylene oxide) surface,126, 127
solution tautomerism of DNAbases, 135
transition-metal complexes, 136CMAX, 42CMSSL, 95Computational Electromagnetics,
35, 36, 35–36Computational Fluid Dynamics,
35, 37, 38, 39, 50, 51, 52,53, 54, 56, 37–64
adaptiva unstructured grids, 57afterburner, 52air pollution dispersion, 41aircraft design, 47compressible flow, 50concentrated suspensions, 60distributed CFD, 38fluidized beds, 59flutter analysis of turbomachines,
62multi-block computations, 40NAS parallel benchmarks, 39parallel CFD at C2M2, 37parallel CFD on SP-2, 54supersonic inviscid flow, 57turbulent Couette flow, 45
Connection Machine, 35, 89CM200, 7, 9, 29, 32–37, 40–
43, 45, 47, 80, 84, 88, 89,94, 96, 105, 106, 108, 115,117, 120, 145, 148
CM5, 41, 96Convex, 48CRAY, 10, 27, 39, 50, 58
CRAY J90, 7, 9, 10, 48, 58CRAY T3D, 41, 48, 97CRAY Y-MP, 38, 39, 48, 51
Cronhjort, Mikael, 81CSB, see Center for Structural
BiochemistryCTH, see Chalmers University
of Technology
Danielsson, Johan, 8
Data Migration Facility, 10DataVault, 9DEC, see Digital EquipmentDenmark, 83Digital Equipment, 37–40, 45, 97DMF, see Data Migration Facil-
ityDzugutov, Mikhail, 8, 67, 70
Ecole Polytechnique Federal deLausanne, 37, 38, 40, 47, 48
Engquist, Bjorn, 2, 8Engstrom, Jonas, 8ESPRIT, 37, 48EUROPORT, 10, 48, 49
Fast Fourier Transform, 34, 95FDDI, 9, 37FFT, see Fast Fourier TransformFortran
CM Fortran, 88, 89, 95, 106Fortran 77, 41, 42, 44, 45, 55Fortran 90, 41, 42, 44, 45, 89HPF, 88, 89
France, 47, 143Fransson, Torsten, 62Frenje, Lena, 115Fristedt, Erland, 38, 39FRN, see Swedish Council for
Planning and Coordinationof Research
Gaussian, 135Geophysics, 111–117
gravitational instability of geo-structures, 111
melting of Earth’s materials,113
seismic wave propagation, 115Germany, 138Goscinski, Osvaldo, 120Gurbatov, Sergey N., 144
Hogskolan Gavle/Sandviken, 10Hammarlund, Per, 8, 27He, Sailing, 79, 80
162 Index
Hedman, Fredrik, 8, 103Hedstrom, P. G., 8Hemmingsson, Jan, 82Hewlett Packard, 38, 97Hierarchial Storage
Management, 10HiPPI, 9HIRLAM, 41, 44Holm, Dan, 141Holmen, Anders, 135HP, see Hewlett PackardHPDR, see Swedish Council for
High Performance Comput-ing
HPF, see FortranHSM, see Hierarchial Storage
ManagementHohn, Wolfgang, 62
IBM, 10, 48, 88, 97, 134SP-1, 48SP-2, 1, 7–10, 27, 40, 41, 47,
48, 50, 51, 53–56, 60, 64,78, 88, 89, 91, 97, 102, 109,111, 113, 125–127, 130–132,135, 136, 142
Ihren, Johan, 8IIEPTMG, see International In-
stitute of Earthquake Pre-diction Theory and Mathe-matical Geophysics
IMHEF, see Institut de MachinesHydrauliques et de Mecaniquedes Fluides
Institut de Machines Hydrauliqueset de Mecanique des Fluides,38, 40, 47
Intel, 39Paragon, 41, 48
International Institute of Earth-quake Prediction Theory andMathematical Geophysics, 111
Ismail-Zadeh, Ali T., 111Italy, 138ITM, see Swedish Institute of Ap-
plied Mathematics
Jonsson, Nils, 8Jackson, Bret, 92, 94Johansson, Arne, 45Johnsson, S. Lennart, 8Jonsson, Dan, 73Jonsson, Tomas, 83Juhlin, Christopher, 115
KALLSUP, 7, 9Karlsson, Hans O, 120Karlsson, Ludvig, 145Karolinska Institutet, 34, 119
Center for Structural Biochem-istry, 119
Department of Neuroscience,34
Kemenade, Vincent van, 47Kerpel, Jan der, 133KI, see Karolinska InstitutetKomminaho, Jukka, 45Kreiss, Heinz-Otto, 60KTH, see Royal Institute of Tech-
nology
Laaksonen, Aatto, 121Langner, Joakim, 41Lansner, Anders, 30Ledfelt, Gunnar, 35Levin, Bjorn, 29Liljenstrom, Hans, 32Lindh, Roland, 127Linkoping University, 73, 82
Department of Physics, 73, 82Lofstedt, Mattias, 145Lofstrand, Hans, 59Lotstedt, Per, 50Lulea University, 96
Department of Mathematics,96
Lund University, 127, 133Department of Theoretical
Chemistry, 127, 133Lundbladh, Anders, 45Lyubartsev, Alexander P., 121
Malinowsky, Lars, 8
Index 163

MasPar, 42, 43, 45MP-1, 40–43, 45MP-2, 42, 43, 45
MATCH, 41, 42, 45Mattsson, Johan, 83Mattsson, Thomas, 91, 93Max-Planck Institut fur Festkorper-
forschung, 138Meiko, 48Mendes, Bruno, 108Message Passing Interface, 27,
40, 60, 64, 102, 109MIMD, 8, 37, 145Miscellaneous, 141–146
Burgers’ equation, 144class library and visualizer, 145financial systems, 143parallel optimization, 141
Molecular dynamics simulation,113, 119, 121, 126, 127
MPI, see Message Passing Inter-face
Naimark, Boris M., 111NAS, see Numerical Aerospace
Simulation FacilityNational Science Foundation, 1Neural Modelling, see BiologyNFR, see Swedish Natural Sci-
ence Research CouncilNilsson, Lennart, 119Nilsson, Patrik, 145Norberg, Jan, 119Nordahl, Mats, 143Nordita, 83Norman, Patrick, 73NSF, see National Science Foun-
dationNSMB, 48, 49Numerical Aerospace Simulation
Facility, 39, 40NUTEK, see Swedish National
Board for Industrial and Tech-nical Development
Oberg, Sven, 96
Odelius, Michael, 138Office National d’Etudes et de
Recherches Aerospetiale, 51,54, 55, 64
Olsson, Mats, 133ONERA, see Office National d’Etudes
et de Recherches AerospetialeOppelstrup, Jesper, 143Oster, Per, 8, 143
Palm, Thomas, 107Parallel and Scientific Comput-
ing Institute, 1, 2Parallel Virtual Machine, 27, 37,
39, 40, 48, 51, 52, 55, 91PARMACS, 48Parrinello, Michele, 138Pazsit, Imre, 101, 103, 105PDC, see Center for Parallel Com-
putersPeirano, Eric, 59Pereira, Antonio, 108Persson, Ingemar, 54, 57Persson, Lars, 145Persson, Magnus, 39Persson, Mats, 91, 92, 94PET, see Positron Emission To-
mographyPhysics, 67–110
3D thin structures, 79acoustic emission, 78atomic collision cascades, 101atomic diffusion in condensed
matter, 67cluster-finding, 88continuation of transient data,
80defects in semiconductors, 96elastic reflection of electrons,
103electric and magnetic non-linear
properties, 73electronic structure of surfaces,
91Ising spin glasses, 83origin of life, 81
164 Index

quantum wavepacket, 94quasicrystal, 70radiation transport benchmarks,
105radionuclide transport, 108self-propelling particles, 82Smooth Particle Hydrodynam-
ics, 106Pierloot, Kristin, 133Poinsot, Thierry, 47Positron Emission Tomography,
34PSCI, see Parallel and Scientific
Computing InstitutePVM, see Parallel Virtual Ma-
chine
Rizzi, Arthur, 47Robertson, Lennart, 41Roos, Bjorn, 133Rosenlund, Magnus, 30Royal Institute of Technology, 1,
7–10, 27, 29, 30, 32, 35, 37–41, 45, 47, 48, 54, 57, 60,62, 64, 67, 70, 78–81, 88,103, 107, 143–145, 160
Department of Aeronautical En-gineering, 47
Department of ElectromagneticTheory, 79, 80
Department of Electronics, 107Department of Energy Tech-
nology, 62Department of Mechanics, 45Department of Numerical Anal-
ysis and Computing Science,27, 41, 88, 143, 145
Department of Solid Mechan-ics, 78
Department of TheoreticalPhysics, 81
Ruda, Fredrik, 145Russia, 111, 144Russian Academy of Sciences, 111Ryde, Ulf, 133Ryden, Roland, 52
Saab, 47, 49Saab Aerospace, 37Saab Military Aircraft, 50, 52,
54Sandstrom, Mattias, 145SANS, see Studies of Artificial
Neural SystemsSawley, Mark, 38, 40Schutz, Martin, 127Selhammar, Magnus, 106Sellgren, Jakob, 145SGI, see Silicon Graphics IncSilicon Graphics Inc, 9, 38, 48,
97Sillen, Mattias, 50SIMD, 9, 29, 42, 123, 145Simdyankin, Sergey I., 144SMHI, see Swedish Meteorolog-
ical and Hydrological Insti-tute
SPARC, 91, 102, 105, 117SPLIT, 27–29Stockholm University, 108, 121
Arrhenius Laboratory, 121Department of Physical Chem-
istry, 121Department of Physics, 108
Stromqvist, Johan, 91, 92Studies of Artificial Neural Sys-
tems, 29, 30, 32Sun, 38, 102, 105, 117Sundstrom, Anna, 78SUNET, see Swedish University
NetworkSvensson, Britta, 8Svensson, Gert, 8Swedish Council for High Per-
formance Computing, 1, 7–9
Swedish Council for Planning andCoordination of Research, 8,9
Swedish Institute of Applied Math-ematics, 39, 50, 52, 54
Swedish Meteorological and Hy-
Index 165

drological Institute, 41, 42,44
Swedish National Board for In-dustrial and Technical De-velopment, 1, 8, 9, 37, 48,52, 54, 94, 143
Swedish Natural Science ResearchCouncil, 70, 82, 94
Swedish University Network, 9Switzerland, 38, 40, 47
Tegner, Jon, 40Thinking Machines Inc, 42, 145Thomas, John O., 126, 127Thomas, Lawrence V., 88TMC, see Thinking Machines Inc
United States of America, 1, 60Universita di Milano, 138
Dipartimento di Fisica, 138University of California, Los An-
geles, 60University of Leuven, 133
Department of Chemistry, 133University of Massachusetts, 92,
94University of Nizhny, 144UNIX, 37Uppsala University, 83, 106, 113,
115, 120, 126, 127, 138Astronomical Observatory, 106Centre of Technology, 83Department of Geophysics, 115Department of Physical Chem-
istry, 138Department of Quantum Chem-
istry, 120Institute of Chemistry, 126, 127Institute of Earth Sciences, 113
USA, see United States of Amer-ica
Vahtras, Olav, 73VAST, 42, 45Volvo Aero Corporation, 52, 54Volvo Data, 37
Vos, Jan, 47
Wahnstrom, Goran, 91, 93Wallin, Erik, 145Wilhelmsson, Tomas, 27, 32, 41
Ystrom, Jacob, 60Ytterstrom, Anders, 47
166 Index