progress on · 2019-03-27 · progress, un-water produced the sdg 6 synthesis report 2018 on water...
TRANSCRIPT
Progress on Water-use Efficiency
Global baseline for SDG indicator 6.4.1
2018


Progress on Water-use Efficiency
Global baseline for SDG indicator 6.4.1
FOOD AND AGRICULTURAL ORGANIZATION OF THE UNITED
NATIONS AND UNITED NATIONS WATER
Rome, 2018
2018

Required citation: FAO. 2018. Progress on water use efficiency - Global baseline for SDG 6 Indicator 6.4.1 2018. Rome. FAO/UN-Water. 56 pp. Licence: CC BY-NC-SA 3.0 IGO.
The designations employed and the presentation of material in this information product do not imply the expression of any opinion whatsoever on the part of the Food and Agriculture Organization of the United Nations (FAO) concerning the legal or development status of any country, territory, city or area or of its authorities, or concerning the delimitation of its frontiers or boundaries. The mention of specific companies or products of manufacturers, whether or not these have been patented, does not imply that these have been endorsed or recommended by FAO in preference to others of a similar nature that are not mentioned.
The views expressed in this information product are those of the author(s) and do not necessarily reflect the views or policies of FAO.
ISBN 978-92-5-130988-9© FAO, 2018
Some rights reserved. This work is made available under the Creative Commons Attribution-NonCommercial-ShareAlike 3.0 IGO licence (CC BY-NC-SA 3.0 IGO; https://creativecommons.org/licenses/by-nc-sa/3.0/igo/legalcode).
Under the terms of this licence, this work may be copied, redistributed and adapted for non-commercial purposes, provided that the work is appropriately cited. In any use of this work, there should be no suggestion that FAO endorses any specific organization, products or services. The use of the FAO logo is not permitted. If the work is adapted, then it must be licensed under the same or equivalent Creative Commons license. If a translation of this work is created, it must include the following disclaimer along with the required citation: “This translation was not created by the Food and Agriculture Organization of the United Nations (FAO). FAO is not responsible for the content or accuracy of this translation. The original [Language] edition shall be the authoritative edition.
Disputes arising under the licence that cannot be settled amicably will be resolved by mediation and arbitration as described in Article 8 of the licence except as otherwise provided herein. The applicable mediation rules will be the mediation rules of the World Intellectual Property Organization http://www.wipo.int/amc/en/mediation/rules and any arbitration will be in accordance with the Arbitration Rules of the United Nations Commission on International Trade Law (UNCITRAL).
Third-party materials. Users wishing to reuse material from this work that is attributed to a third party, such as tables, figures or images, are responsible for determining whether permission is needed for that reuse and for obtaining permission from the copyright holder. The risk of claims resulting from infringement of any third-party-owned component in the work rests solely with the user.
Sales, rights and licensing. FAO information products are available on the FAO website (www.fao.org/publications) and can be purchased through [email protected]. Requests for commercial use should be submitted via: www.fao.org/contact-us/licence-request. Queries regarding rights and licensing should be submitted to: [email protected].
Cover photograph: IWRM AIO SIDS/Creative Commons
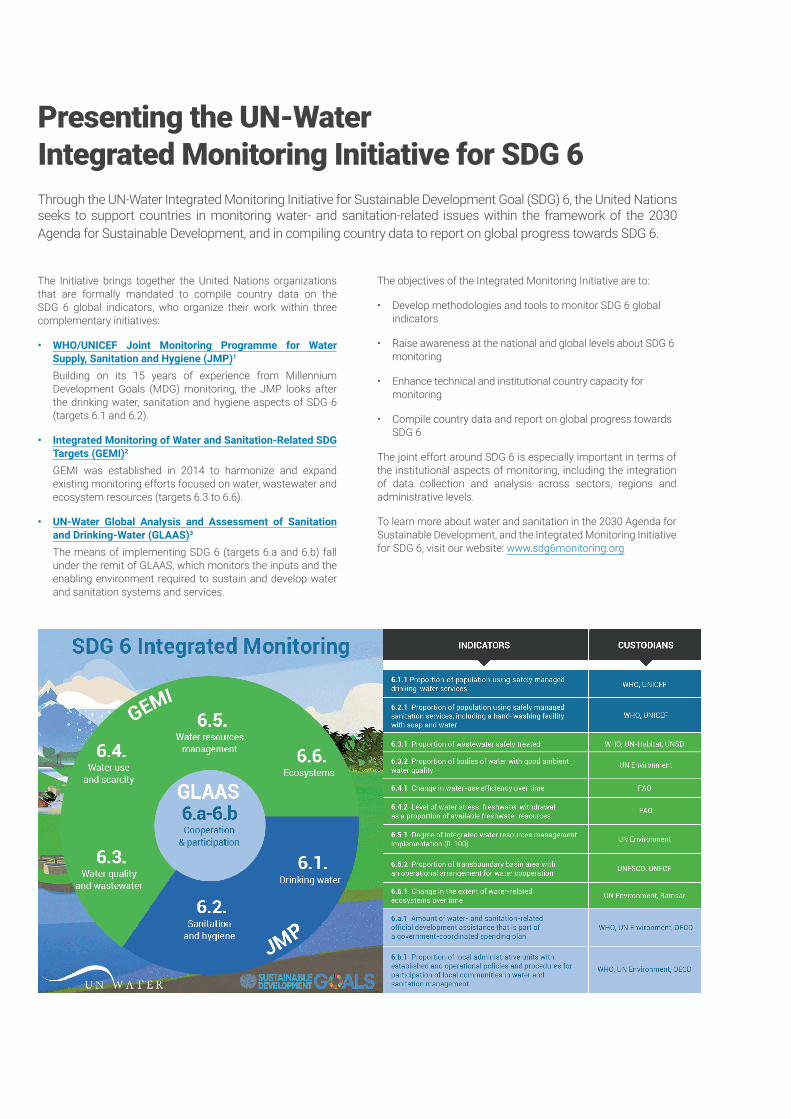
Presenting the UN-Water Integrated Monitoring Initiative for SDG 6
The Initiative brings together the United Nations organizations that are formally mandated to compile country data on the SDG 6 global indicators, who organize their work within three complementary initiatives:
• WHO/UNICEF Joint Monitoring Programme for Water Supply, Sanitation and Hygiene (JMP)1
Building on its 15 years of experience from Millennium Development Goals (MDG) monitoring, the JMP looks after the drinking water, sanitation and hygiene aspects of SDG 6 (targets 6.1 and 6.2).
• Integrated Monitoring of Water and Sanitation-Related SDG Targets (GEMI)2
GEMI was established in 2014 to harmonize and expand existing monitoring efforts focused on water, wastewater and ecosystem resources (targets 6.3 to 6.6).
• UN-Water Global Analysis and Assessment of Sanitation and Drinking-Water (GLAAS)3
The means of implementing SDG 6 (targets 6.a and 6.b) fall under the remit of GLAAS, which monitors the inputs and the enabling environment required to sustain and develop water and sanitation systems and services.
The objectives of the Integrated Monitoring Initiative are to:
• Develop methodologies and tools to monitor SDG 6 global indicators
• Raise awareness at the national and global levels about SDG 6 monitoring
• Enhance technical and institutional country capacity for monitoring
• Compile country data and report on global progress towards SDG 6
The joint effort around SDG 6 is especially important in terms of the institutional aspects of monitoring, including the integration of data collection and analysis across sectors, regions and administrative levels.
To learn more about water and sanitation in the 2030 Agenda for Sustainable Development, and the Integrated Monitoring Initiative for SDG 6, visit our website: www.sdg6monitoring.org
Through the UN-Water Integrated Monitoring Initiative for Sustainable Development Goal (SDG) 6, the United Nations seeks to support countries in monitoring water- and sanitation-related issues within the framework of the 2030 Agenda for Sustainable Development, and in compiling country data to report on global progress towards SDG 6.
Foreword VIby Gilbert F. Houngbo, UN-Water Chair and President of the International Fund for Agricultural Development
Foreword VIIby René Castro-Salazar, Assistant Director-General of the Climate, Biodiversity, Land and Water Departmentof the Food and Agriculture Organization of the United Nations (FAO)
Acknowledgements IX
Executive summary X
Key messages and recommendations XIII
1. Introduction and background 2
2. Method and process 52.1. Methodology 6
2.1.1. About the methodology developed by GEMI 72.1.2. Applying and testing the methodology in the five pilot countries 92.1.3. The monitoring ladder 11
2.2. Stakeholders and sources of data 122.2.1. Stakeholders involved 122.2.2. Sources of data 12
2.3. Data-collection process 162.3.1. Approach 162.3.2. Use of international data sources 172.3.3. Challenges and opportunities 18
CONTENTS
3. Results and analysis 203.1. Global and regional estimates for indicator 6.4.1 213.2. Considerations about data availability at the global level 23
4. Conclusions 26
References 30
Annex 1. Water-use efficiency (WUE) in USD/m3 by country 31Annex 2. Country data for the water-use efficiency (WUE) indicator 33Annex 3. Countries in regions 37Annex 4. International Standard Industrial Classification of All Economic Activities (ISIC), Rev. 4 40
Learn more about progress towards SDG 6 42
©FAO
/UN Photo/M
artine Perret
VIII
FOREWORD
Water is the lifeblood of ecosystems, vital to human health and well-being and a precondition for economic prosperity. That is why it is at the very core of the 2030 Agenda for Sustainable Development. Sustainable Development Goal 6 (SDG 6), the availability and sustainable management of water and sanitation for all, has strong links to all of the other SDGs.
In this series of progress reports under the UN-Water Integrated Monitoring Initiative for SDG 6, we evaluate progress towards this vital goal. The United Nations organizations are working together to help countries monitor water and sanitation across sectors and compile data so that we can report on global progress.
SDG 6 expands the Millennium Development Goal focus on drinking water and basic sanitation to include the management of water and wastewater and ecosystems, across boundaries of all kinds. Bringing these aspects together is an essential first step towards breaking down sector fragmentation and enabling coherent and sustainable management, and hence towards a future where water use is sustainable.
This report is part of a series that track progress towards the various targets set out in SDG 6 using the SDG global indicators. The reports are based on country data, compiled and verified by the responsible United Nations organizations, and sometimes complemented by data from other sources. The main beneficiaries of better data are countries. The 2030 Agenda specifies that global follow-up and review “will be primarily based on national official data sources”, so we sorely need stronger national statistical systems. This will involve developing technical and institutional capacity and infrastructure for more effective monitoring.
To review overall progress towards SDG 6 and identify interlinkages and ways to accelerate progress, UN-Water produced the SDG 6 Synthesis Report 2018 on Water and Sanitation. It concluded that the world is not on track to achieve SDG 6 by 2030. This finding was discussed by Member States during the High-level Political Forum on Sustainable Development (HLPF) in July 2018. Delegates sounded the alarm about declining official development aid to the water sector and stressed the need for finance, high-level political support, leadership and enhanced collaboration within and across countries if SDG 6 and its targets are to be met.
To achieve SDG 6, we need to monitor and report progress. This will help decision makers identify and prioritize what, when and where interventions are needed to improve implementation. Information on progress is also essential to ensure accountability and generate political, public and private sector support for investment. The UN-Water Integrated Monitoring Initiative for SDG 6 is an essential element of the United Nations’ determination to ensure the availability and sustainable management of water and sanitation for all by 2030.
Gilbert F. HoungboUN-Water Chair and President of the International
Fund for Agricultural DevelopmentRené Castro-Salazar

IX
FOREWORD It is my pleasure to present this report, which sets the baseline for monitoring indicator 6.4.1 – Change in water-use efficiency over time – in the context of the Sustainable Development Goals (SDGs) global report.
The 2030 Agenda for Sustainable Development stresses the importance of “leaving no one behind”. This can only by achieved if the interlinkages between its 17 SDGs are adequately understood and appropriate actions are undertaken to bring them together for the benefit of all, including addressing socioeconomic and gender inequalities.
Within this framework, SDG target 6.4 is particularly relevant as it focuses on ensuring that water resources are sufficient for all users, and that such availability is the outcome of a deliberate management of these resources. The Food and Agriculture Organization (FAO), in coordination with other agencies through UN-Water, is committed to supporting countries in implementing this target, through direct actions in agricultural and environmental fields and by supporting the assessment of progress towards achieving it.
To this end, FAO has joined the Integrated Monitoring Initiative, which has gathered experiences and resources aimed at ensuring a coherent monitoring framework for water and sanitation by 2030. Such a framework will help countries achieve progress through well-informed decision-making on water, based on harmonized, comprehensive, timely and accurate information.
As few countries have the natural and financial resources to continue increasing water supplies, the alternative is to make better use of available resources. This report addresses the importance of increasing water-use efficiency, which is used as a measure of the value of water to the economy and society in units of value added per cubic metre of water used.
The indicator on water-use efficiency addresses the economic component of target 6.4. It is defined as the value added per volume of water withdrawn in all water-using sectors. The global average for water-use efficiency is USD 15/m3, but values range from as little as USD 2/m3 for countries whose economies largely depend on agriculture, to over USD 1,000/m3 in highly industrialized, service-based economies. As this is a new indicator, adequate time series data are not available to analyse trends. As Member States advance in using the efficiency indicator, additional indicators detailing water-use efficiency levels in various sectors would help support decision makers.
FAO, predominantly through its AQUASTAT database, remains committed to improving the quality and quantity of data produced and analysed, in close partnership with the relevant authorities of our Member States. This report is an important step towards a more widespread and operational knowledge of the status of water resources and the sustainability of their use.
René Castro-Salazar
Assistant Director-GeneralClimate, Biodiversity, Land and Water Department
Food and Agriculture Organization of the United Nations (FAO)


XI
This report was prepared by Alba Martinez Salas, FAO Consultant, with the supervision of Riccardo Biancalani and the collaboration of Lucie Chocholata of the FAO Land and Water Division.
The authors wish to acknowledge Paul Glennie (UN Environment) and Andrei Jouravlev (ECLAC) for their valuable com-ments on the draft report.
They are also grateful for the valuable oversight, guidance and inputs to this report provided by other FAO staff, including Olcay Unver, Jippe Hoogeveen, Marlos De Souza and Dorian Kalamvrezos Navarro.
The authors wish to recognize the work done in the five pilot countries (Jordan, the Netherlands, Peru, Senegal, Uganda) during the development of the technical methodology described in this report.
Thanks are also extended to Virginie Gillet, FAO-AQUASTAT Consultant, and Ghaieth Ben Hamouda, FAO Consultant, for their contributions to the data processing.
Financial support was provided by the Swiss Agency for Development and Cooperation (SDC), the German Federal Mi-nistry for Economic Cooperation and Development (BMZ), the Dutch Ministry of Infrastructure and Water Management, and the Swedish International Development Cooperation Agency (Sida), through the GEMI programme.
This report was produced as part of a series of reports on SDG indicators 6.3.1, 6.3.2, 6.4.1, 6.4.2, 6.5.1, 6.5.2 and 6.6.1, coordinated by UN-Water through the GEMI programme.
Required citation: FAO. 2018. Progress on water use efficiency - Global baseline for SDG 6 Indicator 6.4.1 2018. Rome. FAO/UN-Water. 56 pp. Licence: CC BY-NC-SA 3.0 IGO.
ACKNOWLEDGEMENTS
XIIProgress on Water-use Efficiency
EXECUTIVE SUMMARY
Access to safe water and sanitation and sound mana-gement of freshwater ecosystems are at the very core of sustainable development. This is the aim of Sustai-nable Development Goal 6 (SDG 6), which further en-hances Millennium Development Goal 7 (MDG 7) by including approaches to water management, such as environmental flow requirements, international coope-ration, capacity-building and stakeholder participation.
SDG target 6.4 addresses water-use efficiency and wa-ter stress, aiming by 2030, to “substantially increase water-use efficiency across all sectors and ensure sustainable withdrawals and supply of freshwater to address water scarcity and substantially reduce the number of people suffering from water scarcity”.
Two indicators were developed to track progress for this target:
6.4.1 Change in water-use efficiency over time
6.4.2 Level of water stress: freshwater wit-hdrawal as a proportion of available freshwater resources
For each indicator, monitoring methodologies and other support tools were developed and tested in five pilot countries, namely, Jordan, the Netherlands, Peru, Senegal and Uganda. These were chosen based on the countries’ expression of interest and to ensure a good representa-tion of global regions.
This report describes the methodology testing process for indicator 6.4.1 in the five pilot countries and presents the global baseline period (2015–2018) for this indicator.
Methodology testing
Indicator 6.4.1 had not previously been monitored worldwide as part of the MDGs and was newly intro-duced into the SDG process. As such, an entirely new methodology had to be built to monitor the indicator. In addition, since no previous data existed for the indica-tor, new computations and interpretation of gathered
data were required. The indicator has been defined as the value added per unit of water used, expressed in USD/m3, over time of a given major economic sector: agriculture (A), industry (M, from MIMEC, as explained in section 2.1) and services (S).
It is calculated as the sum of water-use efficiency (WUE) of each of these three sectors (Awe, Mwe, Swe), weighted according to the proportion of water used by each sector over the total uses (PA, PM, PS), using the formula:
WUE=Awe×PA+Mwe×PM+Swe×PS
Though the indicator had not previously been mo-nitored, statistical data were generally available and updated from governmental sources for the variables included in the methodology. Data were taken from in-ternational sources, such as the World Bank or United Nations Food and Agricultural Organization (FAO) in those cases where information was lacking.
To implement and test the methodology, each of the pi-lot countries established working groups with relevant stakeholders to gather the required expert knowledge. A national institution was appointed in each country to lead the groups in the process of compiling the indica-tor, coordinating the review of all the national, subna-tional and basin data sources, such as maps, reports, yearbooks and articles. This collection focused on the most recent data available, without excluding any po-tential sources of information. Partial data (with res-pect to time or area) were also collected, such as data produced by local projects. Meetings with all institu-tions involved were held throughout 2016 to track pro-gress, share findings and endorse the results obtained.
A United Nations organization was designated to coor-dinate activities, acting as a custodian agency. In the case of indicator 6.4.1, FAO provided technical and/or logistical support to the countries that requested it.
XI
Even though the data-collection process was feasible for all pilot countries, certain problems were encountered that should be considered for future reference, which most no-tably include handling economic data, data inconsistencies among various sources, weak monitoring by country institu-tions, varied reference years, different parameters when de-fining variables, outdated data, weak reporting into interna-tional databases and potential double counting data. These problems are described in detail in the following text.
Global data
Water-use efficiency is a little over USD 15/m3 worldwide, though there are significant differences among countries and regions. Lowest regional water-use efficiencies are USD 2/m3 in Central and Southern Asia, around USD 7/m3 in sub-Saha-ran Africa and almost USD 8/m3 in Northern Africa and Western Asia. The highest values are USD 50/m3 in Oceania and USD 38/m3 in Europe and Northern America. Average va-lues are found in Eastern and South-Eastern Asia (around USD 15/m3) and Latin America and the Caribbean (about USD 13/m3).
Deeper analysis shows that 75 countries have efficiencies of less than USD 10/m3 (of those, 10 countries are below USD 1/m3). Fifty-six countries have water-use efficiencies between USD 10/m3 and USD 40/m3, 17 countries between USD 40/m3 and USD 80/m3 and 20 countries above USD 80/m3.
This first assessment at the global and regional levels was based on nationally and internationally available data sets suggested by the methodology. Figures were available for 168 countries. The FAO AQUASTAT database was used to pro-vide data on water use for agriculture, industry (MIMEC) and services. Economic data on gross value added in each of the three major economic sectors (agriculture, industry and ser-vices), were acquired from national statistical departments or other relevant national government agencies and international sources, such as the World Bank, United Nations Statistics Division (UNSD) and Organisation for Economic Co-operation and Development (OECD). These data sources follow the set of concepts, definitions, classifications and accounting rules recommended in the System of National Accounts (SNA). This allows countries’ data and economic performances to be com-pared internationally.

XIIIProgress on Water-use Efficiency
To date, the Inter-agency Expert Group on SDG indica-tors (IAEG-SDG) has not defined a framework for data collection on global indicators to provide guidance to Member States and custodian agencies. At present, the only clear indication is that countries should retain ownership of their data and of the monitoring process in general. The IAEG-SDG is expected to agree on a standardized reporting framework at its next meeting in autumn 2018. The establishment of such a framework will help to improve and rationalize significantly the data-collection process of the SDG global indicators, clarifying the roles and responsibilities of both national institutions and custodian agencies.
To implement the SDG methodologies further, specific national data should be collected to compute the indi-cator, including greater disaggregation of data for major subsectors. Countries should therefore take ownership of the process and be mindful of the importance of quality, timely and reliable disaggregated data and their accessibility, to ensure well-informed decision-making. Custodian United Nations organizations should create awareness among countries on this matter and support them in this process. Organizations could launch a com-munication campaign to help achieve this.
Countries should have a good understanding of the me-thodology and an awareness of the issues to consider when using the indicator’s formula (i.e. not to include water used for hydropower, currency conversion, gross domestic product (GDP) deflator, etc.). This is also a task for custodian United Nations organizations when explaining the methodology. An e-learning course is being developed to facilitate this understanding.
To enable data comparison, countries should provide the relevant metadata when submitting their data in order to record how the information was obtained and
which reference years and units of measurement were used, etc. The AQUASTAT questionnaire offers gui-dance to countries on how to prepare metadata. Mo-reover, FAO provides a calculation sheet to help coun-tries maintain consistency when compiling their data.
The pilot process has proven that monitoring a given in-dicator at the country level calls for the involvement of a varied number of stakeholders and institutions. The lead institution plays a key role in coordinating these stakeholders, who should have a clear understanding of their role in the process, the actions they should im-plement and the support available. Custodian United Nations organizations should focus their efforts on building strong relationships with lead agencies. Consi-dering that this indicator includes economic variables, country teams should involve at least one economist in the process.
The two target 6.4 indicators are strongly linked and offer complementary information: indicator 6.4.1 is an economic indicator, assessing to what extent a country’s economic growth is dependent on the use of water resources. Indicator 6.4.2 is an environmental indicator, tracking the physical availability of freshwa-ter resources. Decision makers can combine the in-formation from these indicators to understand how increasing water use affects the availability of water resources and to define a tipping-point target to aim at for decoupling water use from economic growth. Such information would enable countries to adequately fol-low-up on target 6.4.
Countries are advised to consider a reporting period of no more than two years, as this will allow them to identify early trends, helping them detect any poten-tial issues.
KEY MESSAGES AND RECOMMENDATIONS

1Introduction and
background
©FAO
/UN Photo/ H
arandane Dicko

2Progress on Water-use Efficiency
In September 2015, Heads of State from all around the world adopted the 2030 Agenda for Sustainable Development, consisting of 17 Sustainable Develop-ment Goals (SDGs) with 169 targets. The 2030 Agen-da includes a goal on water and sanitation (SDG 6) that sets out to “ensure availability and sustainable management of water and sanitation for all” (UNGA, 2015).
Access to safe water and sanitation and the sound ma-nagement of freshwater ecosystems are at the very core of sustainable development. Not only does SDG 6 have strong linkages with all the other SDGs, it is essen-tial to achieving them. In other words, the successful im-plementation of the 2030 Agenda will strongly depend on meeting SDG 6 (CBS, 2016).
SDG 6 expands the focus of Millennium Development Goal 7 (MDG 7) on drinking water and sanitation to the entire water cycle, including the management of water, wastewater and ecosystem resources (UNGA, 2015). It also addresses other approaches to water management such as international cooperation, capacity-building and stakeholder participation. This is reflected by the num-ber of water-related targets set under SDG 6, which has increased from two as part of MDG 7 to eight (Box 1).
Target 6.4 deals with water scarcity, aiming to ensure there is sufficient water for the population, the economy and the environment by increasing water-use efficiency across socioeconomic sectors. Two indicators have been defined to track progress for this target:
6.4.1 Change in water-use efficiency over time
6.4.2 Level of water stress: freshwater withdrawal as a proportion of available freshwater resources
Indicator 6.4.1 had never been monitored or reported at the global level and therefore required the development of an entirely new methodology. Since there were no previous data for the indicator, new computation and the related interpretation had to be undertaken.
Indicator 6.4.1 is particularly important as it allows coun-tries to assess to what extent their economic growth de-pends on the use of their water resources. An interesting feature of this indicator is that it adds a time dimension to the measurements, thus tracking the change in wa-ter-use efficiency. When the indicator’s measurements are compared over time, the change in countries’ wa-ter-use efficiency becomes visible, providing a com-plete picture of their situation. The water-use efficiency concept differs from the concept of water productivity as it does not consider the productivity of water used in a given activity as an input to a production. Instead, this indicator shows the level of decoupling of econo-
Indicator 6.4.1 allows countries to assess how much their economic growth depends on water resources.
SDG 6 expands the focus of Millennium Development Goal 7 (MDG 7) on drinking water and sanitation to the entire water cycle.
KEY FACTS
3
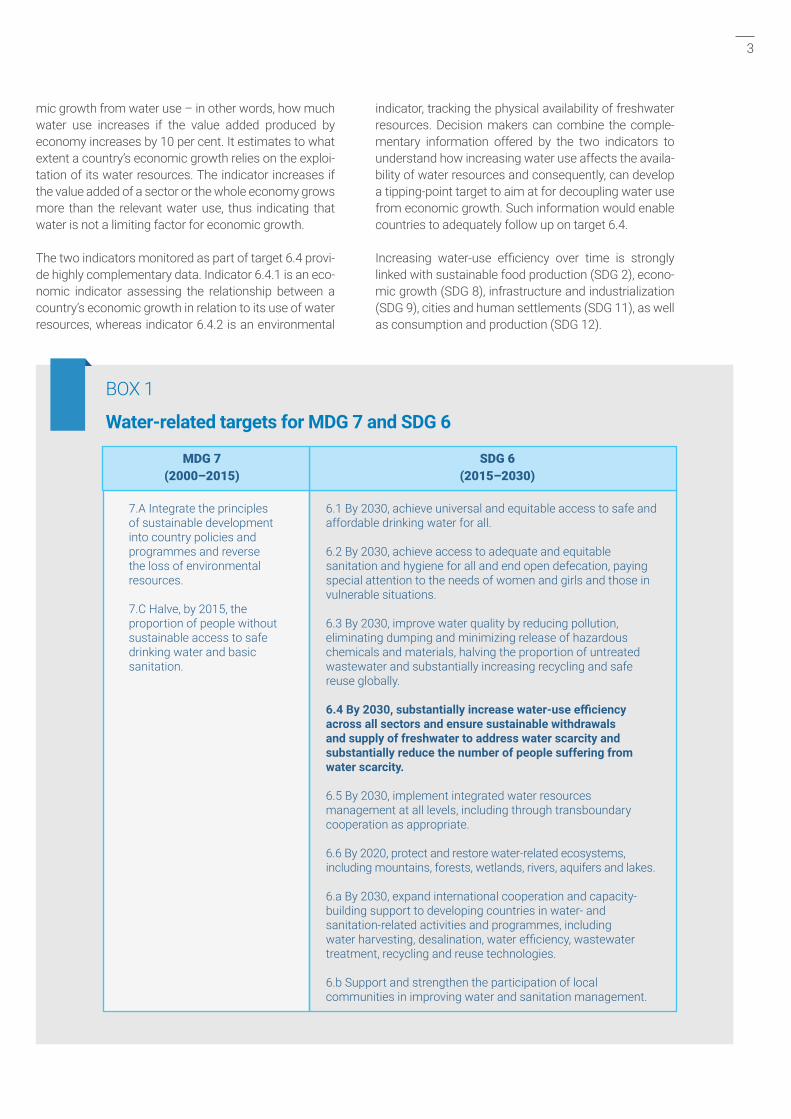
BOX 1
Water-related targets for MDG 7 and SDG 6
MDG 7 (2000–2015)
SDG 6 (2015–2030)
6.1 By 2030, achieve universal and equitable access to safe and affordable drinking water for all.
6.2 By 2030, achieve access to adequate and equitable sanitation and hygiene for all and end open defecation, paying special attention to the needs of women and girls and those in vulnerable situations.
6.3 By 2030, improve water quality by reducing pollution, eliminating dumping and minimizing release of hazardous chemicals and materials, halving the proportion of untreated wastewater and substantially increasing recycling and safe reuse globally.
6.4 By 2030, substantially increase water-use efficiency across all sectors and ensure sustainable withdrawals and supply of freshwater to address water scarcity and substantially reduce the number of people suffering from water scarcity.
6.5 By 2030, implement integrated water resources management at all levels, including through transboundary cooperation as appropriate.
6.6 By 2020, protect and restore water-related ecosystems, including mountains, forests, wetlands, rivers, aquifers and lakes.
6.a By 2030, expand international cooperation and capacity-building support to developing countries in water- and sanitation-related activities and programmes, including water harvesting, desalination, water efficiency, wastewater treatment, recycling and reuse technologies.
6.b Support and strengthen the participation of local communities in improving water and sanitation management.
7.A Integrate the principles of sustainable development into country policies and programmes and reverse the loss of environmental resources.
7.C Halve, by 2015, the proportion of people without sustainable access to safe drinking water and basic sanitation.
mic growth from water use – in other words, how much water use increases if the value added produced by economy increases by 10 per cent. It estimates to what extent a country’s economic growth relies on the exploi-tation of its water resources. The indicator increases if the value added of a sector or the whole economy grows more than the relevant water use, thus indicating that water is not a limiting factor for economic growth.
The two indicators monitored as part of target 6.4 provi-de highly complementary data. Indicator 6.4.1 is an eco-nomic indicator assessing the relationship between a country’s economic growth in relation to its use of water resources, whereas indicator 6.4.2 is an environmental
indicator, tracking the physical availability of freshwater resources. Decision makers can combine the comple-mentary information offered by the two indicators to understand how increasing water use affects the availa-bility of water resources and consequently, can develop a tipping-point target to aim at for decoupling water use from economic growth. Such information would enable countries to adequately follow up on target 6.4.
Increasing water-use efficiency over time is strongly linked with sustainable food production (SDG 2), econo-mic growth (SDG 8), infrastructure and industrialization (SDG 9), cities and human settlements (SDG 11), as well as consumption and production (SDG 12).
4Progress on Water-use Efficiency
1 Indicators 6.1 and 6.2 are covered by the Joint Monitoring Programme for Water Supply, Sanitation and Hygiene (JMP) developed by WHO and UNICEF.
As acknowledged by the United Nations General As-sembly (UNGA, 2015), quality, accessible, timely and reliable disaggregated data are needed to help measure SDG progress and ensure that no one is left behind in the process. Access to reliable data is also essential for well-informed decision-making.
To support the data-collection process, UN-Water launched the inter-agency Integrated Monitoring of Wa-ter and Sanitation-Related SDG Targets Initiative (GEMI), which aims to establish and manage a coherent moni-toring framework for the implementation of SDG targets 6.3 to 6.6.1 It was established in 2014 as a partnership between the Food and Agriculture Organization of the United Nations (FAO), UN Environment, the United Na-tions Human Settlements Programme (UN-Habitat), the United Nations Economic Commission for Europe (UNE-CE), the United Nations Educational, Scientific and Cultu-ral Organization (UNESCO), the United Nations Children’s Fund (UNICEF), the World Health Organization (WHO) and the World Meteorological Organization (WMO).
The first phase of GEMI implementation (2015–2018) has focused on developing monitoring methodologies and other support tools for the indicators related to the aforementioned targets. This has included pilot testing the monitoring methodologies in five countries: Jordan, the Netherlands, Peru, Senegal and Uganda. These were chosen based on the countries’ expressions of interest and to ensure a good representation of global regions (sub-Saharan Africa, Europe, Latin America and the Ca-ribbean and Northern Africa/the Middle East). Asia was originally represented by Bangladesh but the process experienced a significant slowdown due to the country’s complex institutional environment.
In addition, GEMI has worked on establishing a global baseline for SDG targets 6.3 to 6.6.
This report describes the methodology testing pro-cess in the five pilot countries (section 2) and pre-sents the global baseline 2015–2018 for indicator 6.4.1 (section 3).
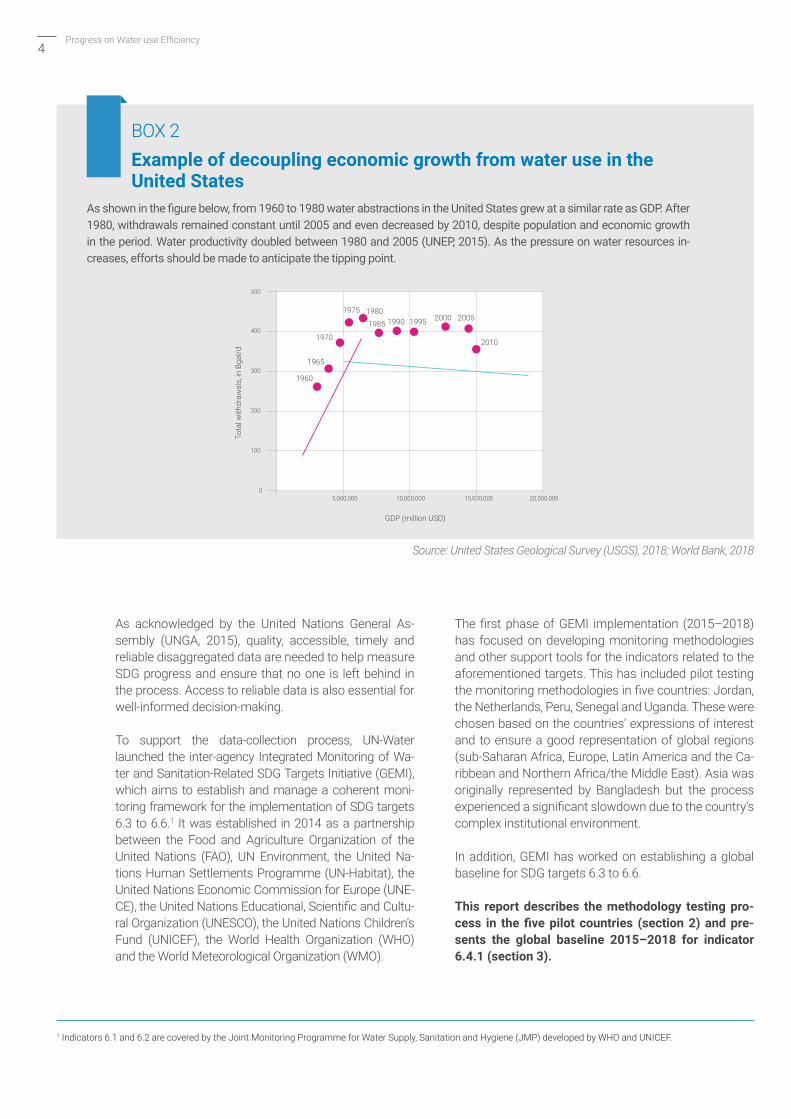
As shown in the figure below, from 1960 to 1980 water abstractions in the United States grew at a similar rate as GDP. After 1980, withdrawals remained constant until 2005 and even decreased by 2010, despite population and economic growth in the period. Water productivity doubled between 1980 and 2005 (UNEP, 2015). As the pressure on water resources in-creases, efforts should be made to anticipate the tipping point.
BOX 2Example of decoupling economic growth from water use in the United States
GDP (million USD)
5,000,000 10,000,000 15,000,000 20,000,000
100
0
200
300
400
500
1960
1965
1970
1975 19801985 1990 1995 2000 2005
2010
Tota
l with
draw
als,
in B
gal/d
Source: United States Geological Survey (USGS), 2018; World Bank, 2018
Method and process2
©FAO
/UN Photo/Albert González Farran
6Progress on Water-use Efficiency
2.1. Methodology
2.1.1. About the methodology
developed by GEMI
Indicator 6.4.1 has been defined as the change in water-use efficiency over time (CWUE) which is formulated as the value added per unit of water used, expressed in USD/m3, of a given major economic sector (showing the trend in water-use efficiency). Following International Stan-dard Industrial Classification of all Economic Activities (ISIC) Rev. 4 codes (annex 4), sectors are considered as:
1. Agriculture (ISIC A, excluding forestry and fishing)
2. Mining and quarrying, manufacturing, electricity, gas, steam and air conditioning supply, and construc-tions – MIMEC (ISIC B, C, D and F)
3. All the service sectors (ISIC E and G to T)
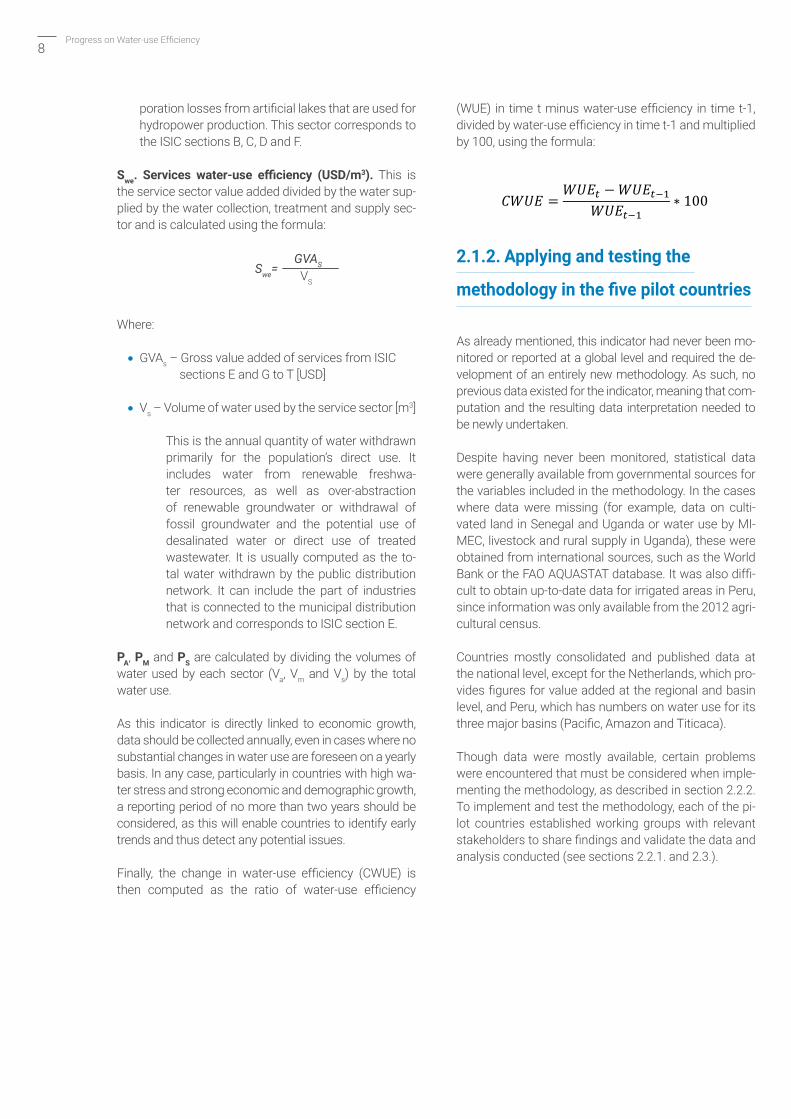
Water-use efficiency (WUE) is calculated as the sum of these three sectors, weighted according to the propor-tion of water used by each sector over the total uses, following the formula:
WUE=Awe×PA+Mwe×PM+Swe×PS
Where:
• WUE – Water-use efficiency [USD/m3]
• Awe – irrigated agriculture water-use efficiency [USD/m3]
• Mwe – MIMEC water-use efficiency [USD/m3]
• Swe – Services water-use efficiency [USD/m3]
• PA – Proportion of water used by the agricultural sector over the total use
• PM – Proportion of water used by the MIMEC sector over the total use
• PS – Proportion of water used by the service sector over the total use
The formula’s most difficult component to obtain was the proportion of agricultural gross value added from rain-fed agriculture (Cr).
Stakeholder engagement is vital for implementing the monitoring methodology.
The involvement of different agencies in the process has helped to strengthen institutional relationships that will improve indicator monitoring and other aspects of water management at the national level.
KEY FACTS

7
It is important to note that only run-off water and groundwater (so-called blue water) should be considered when computing the indicator. This is particularly important regarding water use for the agricultural sector. For this reason, a specific parameter (Cr) has been introduced in the formula to extract the amount of agricultural production carried out in rainfed conditions. For the same reason, the value added of subsectoral productions that largely use non-abstracted water should not be included when calculating the sector’s overall value added.
The computing of each sector is as follows:
Awe. Irrigated agriculture water-use efficiency (USD/m3). This is calculated as the agriculture value added per agri-culture water use and is used as a proxy indicator for the agriculture sector’s water-use efficiency. It is determined using the formula:
Awe=GVAal+GVAaa+[GVAai ×(1-Cr )]) ــــــــــــــــــــــــــــــــــــــــــــــــــــــــــــــــــــــــ
Va
Where:
• GVAal – Gross value added of the livestock subsector [USD]
• GVAaa – Gross value added of the freshwater aquaculture subsector [USD]
• GVAai – Gross value added of the irrigated cultivations subsector [USD]
The gross value added of these three subsectors is calcu-lated by adding all outputs and subtracting intermediate inputs, without deducting the depreciation of fabricated assets or depletion and degradation of natural resources.
Forestry and fishing values should not be included in the calculation, with the exception of forest tree nurseries and freshwater aquaculture. In terms of ISIC codes, the sectors to consider are:
01 Crop and animal production, hunting and related service activities
0210 Silviculture and other forestry activities0322 Freshwater aquaculture
• Va – Volume of water used by the agricultural sector [m3]
This is the annual quantity of self-supplied water used for irrigation, livestock (watering, sanitation, cleaning, etc.) and aquaculture purposes. It corresponds to the ISIC sec-tions A [1–3], but excludes forestry and fishing. It includes
water from renewable freshwater resources, as well as water from over-abstraction of renewable groundwater or abstraction of fossil groundwater, direct use of agricultu-ral drainage water, (treated) wastewater and desalinated water.
• Cr – Proportion of agricultural gross value added produced by rainfed agriculture
If disaggregated data on value added of rainfed and irri-gated agriculture are not reported in national accounts, it can be calculated from the proportion of irrigated land on the total cultivated land, using the formula:
𝐶𝐶𝑟𝑟 =1
1 + 𝐴𝐴𝑖𝑖(1 − 𝐴𝐴𝑖𝑖) ∗ 0.375
Where:
• Ai – Proportion of irrigated land on the total cultivated land, in decimals
• 0.375 – Generic default ratio between rainfed and irrigated yields
Mwe. MIMEC water-use efficiency (USD/m3). This is the va-lue added per unit of water used by mining and quarrying, manufacturing, electricity, gas, steam, air conditioning supply and constructions, calculated using the formula:
Mwe= GVAm
ــــــــــــــــــــــــ
Vm
Where:
• GVAm – Gross value added of MIMEC (including energy) [USD]
It is computed by adding the value added of each of the four MIMEC sectors as defined in ISIC codes B, C, D and F.
• Vm – Volume of water used by MIMEC (including energy) [m3]
This is the annual quantity of water withdrawn for industrial uses. It includes water from renewable freshwater resources, as well as over-abstraction of renewable groundwater or withdrawal of fossil groundwater and potential use of desalinated water or direct use of (treated) wastewater. This sector re-fers to self-supplied industries that are not connected to the public distribution network. It includes cooling for thermoelectric plants but excludes hydropower. However, water use for this sector should include eva-
8Progress on Water-use Efficiency
poration losses from artificial lakes that are used for hydropower production. This sector corresponds to the ISIC sections B, C, D and F.
Swe. Services water-use efficiency (USD/m3). This is the service sector value added divided by the water sup-plied by the water collection, treatment and supply sec-tor and is calculated using the formula:
Swe= GVAS
ــــــــــــــــــــــــ
VS
Where:
• GVAs – Gross value added of services from ISIC sections E and G to T [USD]
• Vs – Volume of water used by the service sector [m3]
This is the annual quantity of water withdrawn primarily for the population’s direct use. It includes water from renewable freshwa-ter resources, as well as over-abstraction of renewable groundwater or withdrawal of fossil groundwater and the potential use of desalinated water or direct use of treated wastewater. It is usually computed as the to-tal water withdrawn by the public distribution network. It can include the part of industries that is connected to the municipal distribution network and corresponds to ISIC section E.
PA, PM and PS are calculated by dividing the volumes of water used by each sector (Va, Vm and Vs) by the total water use.
As this indicator is directly linked to economic growth, data should be collected annually, even in cases where no substantial changes in water use are foreseen on a yearly basis. In any case, particularly in countries with high wa-ter stress and strong economic and demographic growth, a reporting period of no more than two years should be considered, as this will enable countries to identify early trends and thus detect any potential issues.
Finally, the change in water-use efficiency (CWUE) is then computed as the ratio of water-use efficiency
(WUE) in time t minus water-use efficiency in time t-1, divided by water-use efficiency in time t-1 and multiplied by 100, using the formula:
𝐶𝐶𝐶𝐶𝐶𝐶𝐶𝐶 = 𝐶𝐶𝐶𝐶𝐶𝐶𝑡𝑡 −𝐶𝐶𝐶𝐶𝐶𝐶𝑡𝑡−1𝐶𝐶𝐶𝐶𝐶𝐶𝑡𝑡−1
∗ 100
2.1.2. Applying and testing the
methodology in the five pilot countries
As already mentioned, this indicator had never been mo-nitored or reported at a global level and required the de-velopment of an entirely new methodology. As such, no previous data existed for the indicator, meaning that com-putation and the resulting data interpretation needed to be newly undertaken.
Despite having never been monitored, statistical data were generally available from governmental sources for the variables included in the methodology. In the cases where data were missing (for example, data on culti-vated land in Senegal and Uganda or water use by MI-MEC, livestock and rural supply in Uganda), these were obtained from international sources, such as the World Bank or the FAO AQUASTAT database. It was also diffi-cult to obtain up-to-date data for irrigated areas in Peru, since information was only available from the 2012 agri-cultural census.
Countries mostly consolidated and published data at the national level, except for the Netherlands, which pro-vides figures for value added at the regional and basin level, and Peru, which has numbers on water use for its three major basins (Pacific, Amazon and Titicaca).
Though data were mostly available, certain problems were encountered that must be considered when imple-menting the methodology, as described in section 2.2.2. To implement and test the methodology, each of the pi-lot countries established working groups with relevant stakeholders to share findings and validate the data and analysis conducted (see sections 2.2.1. and 2.3.).

9
The development of the methodology to compute this indicator has been a complex process that included several months of discussions among experts, with various changes, amendments and even turns along the way.
To provide an answer to the indications expressed in the text of target 6.4 on increasing water-use efficiency across all sectors, the discussion started with trying to define water-use efficiency in the various sectors, including agriculture, irrigation, industry, energy and municipal.
At first, it appeared that different sectors require their own definition of water-use efficiency, including different mea-surement units. For example, water-use efficiency in agriculture could be measured as value per cubic metre consu-med, but also as nutritional value per cubic meter, while the volume could be measured either as water consumed or water abstracted.
Similarly, water-use efficiency in the energy sector could be based on the quantity of energy produced in MW, again per water consumed or abstracted. On another hand, water-use efficiency in irrigation is usually measured in cubic metres of water delivered to plants over cubic metres of water abstracted, while at the municipal level a possible parameter would be the number of households per volume of water used.
While each of these possible parameters has its own advantages and disadvantages, it became clear after some discussion that merging some or all of them would have resulted in a hybrid indicator, or more aptly, an index, which would have been difficult to interpret and not in line with the SDG monitoring framework requirements, which stipu-lates indicators rather than indexes.
To reduce this complexity, monetary value was chosen as the metric, in terms of the gross value added of production over the volume of water used, as it is understandable, universal and data are relatively available.
The volume of water used by each sector was defined as the water abstracted, for two main reasons: (i) using water consumption would have extremely reduced the water allocated to industries and services, not considering the high impact that these users have on the availability of water resources; and (ii) to align the indicator to the definition of Sys-tem of Environmental-Economic Accounting for Water (SEEA-Water), which defines water use as the water abstracted by a given economic sector or received from another sector.
This definition is also the reason for considering reused treated water, drainage water and desalinated water, in addi-tion to freshwater directly abstracted from its source.
Finally, a parameter was introduced in the indicator’s formula to separate the irrigated agriculture value from the rain-fed agriculture value in order to be able to assess the economic pressure on the renewable water resources. Including the water directly used from precipitation in the indicator would have largely increased the quantities, making them more difficult to estimate, which in turn, would have provided decision makers with misleading information on the potential of their water sources. Thus, the indicator focusses on “blue water” rather than “green water”.
BOX 3Methodological development of indicator 6.4.1
10Progress on Water-use Efficiency
2.1.3. The monitoring ladder
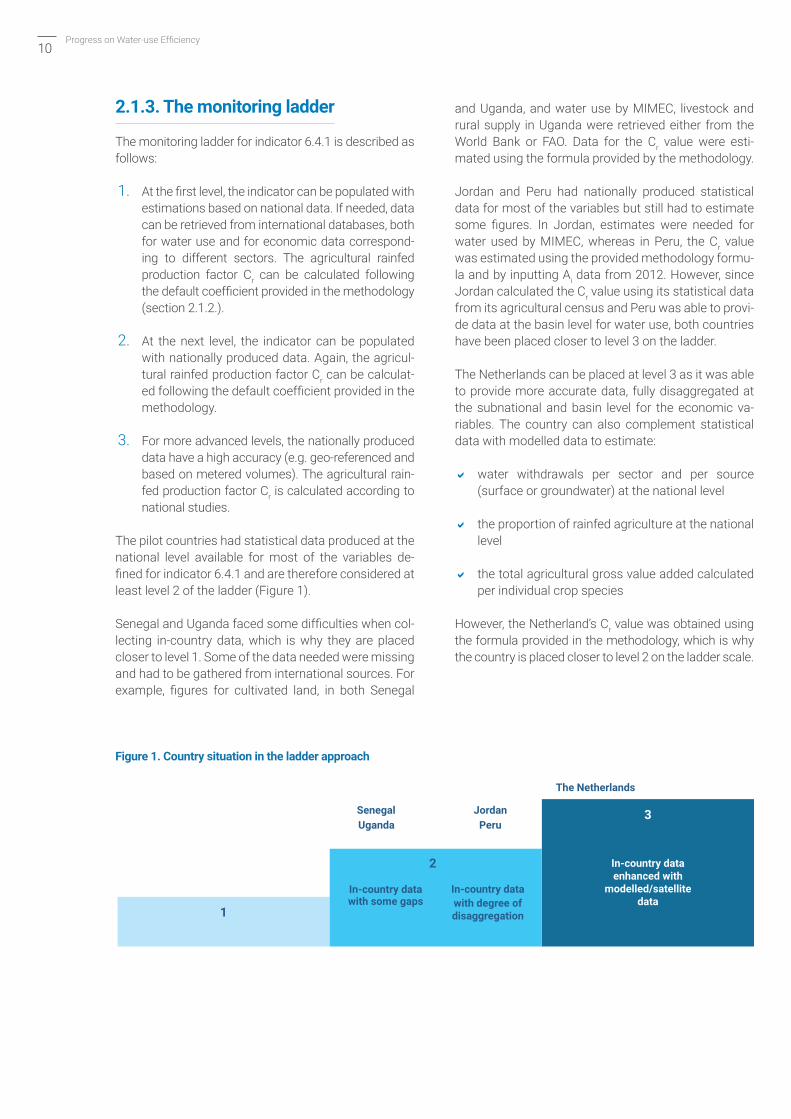
The monitoring ladder for indicator 6.4.1 is described as follows:
1. At the first level, the indicator can be populated with estimations based on national data. If needed, data can be retrieved from international databases, both for water use and for economic data correspond-ing to different sectors. The agricultural rainfed production factor Cr can be calculated following the default coefficient provided in the methodology (section 2.1.2.).
2. At the next level, the indicator can be populated with nationally produced data. Again, the agricul-tural rainfed production factor Cr can be calculat-ed following the default coefficient provided in the methodology.
3. For more advanced levels, the nationally produced data have a high accuracy (e.g. geo-referenced and based on metered volumes). The agricultural rain-fed production factor Cr is calculated according to national studies.
The pilot countries had statistical data produced at the national level available for most of the variables de-fined for indicator 6.4.1 and are therefore considered at least level 2 of the ladder (Figure 1).
Senegal and Uganda faced some difficulties when col-lecting in-country data, which is why they are placed closer to level 1. Some of the data needed were missing and had to be gathered from international sources. For example, figures for cultivated land, in both Senegal
and Uganda, and water use by MIMEC, livestock and rural supply in Uganda were retrieved either from the World Bank or FAO. Data for the Cr value were esti-mated using the formula provided by the methodology.
Jordan and Peru had nationally produced statistical data for most of the variables but still had to estimate some figures. In Jordan, estimates were needed for water used by MIMEC, whereas in Peru, the Cr value was estimated using the provided methodology formu-la and by inputting Ai data from 2012. However, since Jordan calculated the Cr value using its statistical data from its agricultural census and Peru was able to provi-de data at the basin level for water use, both countries have been placed closer to level 3 on the ladder.
The Netherlands can be placed at level 3 as it was able to provide more accurate data, fully disaggregated at the subnational and basin level for the economic va-riables. The country can also complement statistical data with modelled data to estimate:
water withdrawals per sector and per source (surface or groundwater) at the national level
the proportion of rainfed agriculture at the national level
the total agricultural gross value added calculated per individual crop species
However, the Netherland’s Cr value was obtained using the formula provided in the methodology, which is why the country is placed closer to level 2 on the ladder scale.
Figure 1. Country situation in the ladder approach
1
2
3
In-country data with some gaps
Uganda
The Netherlands
SenegalPeru
Jordan
In-country data with degree of disaggregation
In-country data enhanced with
modelled/satellite data

11
The Inter-agency and Expert Group on SDG Indicators (IAEG-SDG) was established by the United Nations Statistical Commission to develop and implement the SDG global indicator framework and targets of the 2030 Agenda. It com-prises United Nations Member States, with regional and international agencies participating as observers.
This global indicator framework was agreed upon in March 2017. Now, the IAEG-SDG’s work will entail finalizing a framework for indicator monitoring and reporting and reviewing and refining the indicator framework and its imple-mentation on an ongoing basis. The group is expected to agree on a standardized reporting framework during its next meeting, in autumn 2018. The establishment of such a framework will help improve and rationalize the data-collection process for the SDG global indicators, clarifying the roles and responsibilities of national institutions and custodian agencies alike.
BOX 4What next for IAEG-SDG?
Bentiu, South Sudan. Photo: UN Photo/JC McIlwaine
2.2. Stakeholders and sources of data
2.2.1 Stakeholders involved
All the pilot countries engaged relevant institutions in the SDG 6 process to provide data and endorse the metho-dology and the results obtained. Table 1 provides a com-parative summary of the institutions and organizations involved in each country.
The main institutions involved were water-related mi-nistries and agencies and departments of statistics. In the Netherlands, a research institution (Deltares) and consultancy (eLEAF) participated in launching a project to show which data could be compiled for the country and what could be compiled to support other countries.
2.2.2. Sources of data
This section provides an overview of the different sources consulted in each of the pilot countries for the methodology’s main components: (1) gross value added by sector; and (2) volume of water used by sector (Table 2).
©FAO
/UN Photo/JC M
cIlwaine

12Progress on Water-use Efficiency
Main data-collectingagencies
Ministry of Water and IrrigationDepartment of Statistics (DOS)Ministry of AgricultureMinistry of Planning and International Cooperation
Statistics Netherlands (CBS)
National Water Authority (ANA)Ministry of Agriculture and IrrigationNational Institute for Statistics and Informatics (INEI)
Ministry of Water and SanitationWater Utilities AssociationStatistics and Demography Agency (ANSD)
Ministry of Water and EnvironmentNational Water and Sewerage Corporation Ministry of Gender, Labour and Social DevelopmentUganda Bureau of StatisticsUganda PrisonsFAO and United Nations Forum on Forests (UNFF) Buganda Kingdom
Other government bodies/institutions involved
Environment StatisticsDivision (DOS), FAO
Deltares, eLEAFUniversity of TwenteWater Footprint NetworkUtrecht UniversityIHE Delft Institute for Water EducationNetherlands Water Partnership Netherlands IHP-HWRP Committee
Water Resources Management Unit (ANA), Water Resources Planning and Conservation Unit (ANA), FAO
Ministry of Agriculture, Animal Industry and FisheriesMinistry of Trade, Industry and Cooperatives (Department of Industry and Technology)Ministry of Finance, Planning and Economic Development
Generalcoordination
Ministry of Water and Irrigation
Ministry of Foreign Affairs
National WaterAuthority (ANA)
Ministry of Water and Sanitation(Water Resources Management and Planning Unit)
Ministry of Water and Environment (MWE) (Water for Production Department and Water Resource Planning & Regulation Department)
Jordan
The Netherlands
Peru
Senegal
Uganda
Source: National reports ANA, 2016; Abu Zahra, 2016; DGPRE, 2016; MWE, 2016; CBS, 2016
Table 1. Stakeholders involved in testing the indicator 6.4.1 methodology in the pilot countries
13
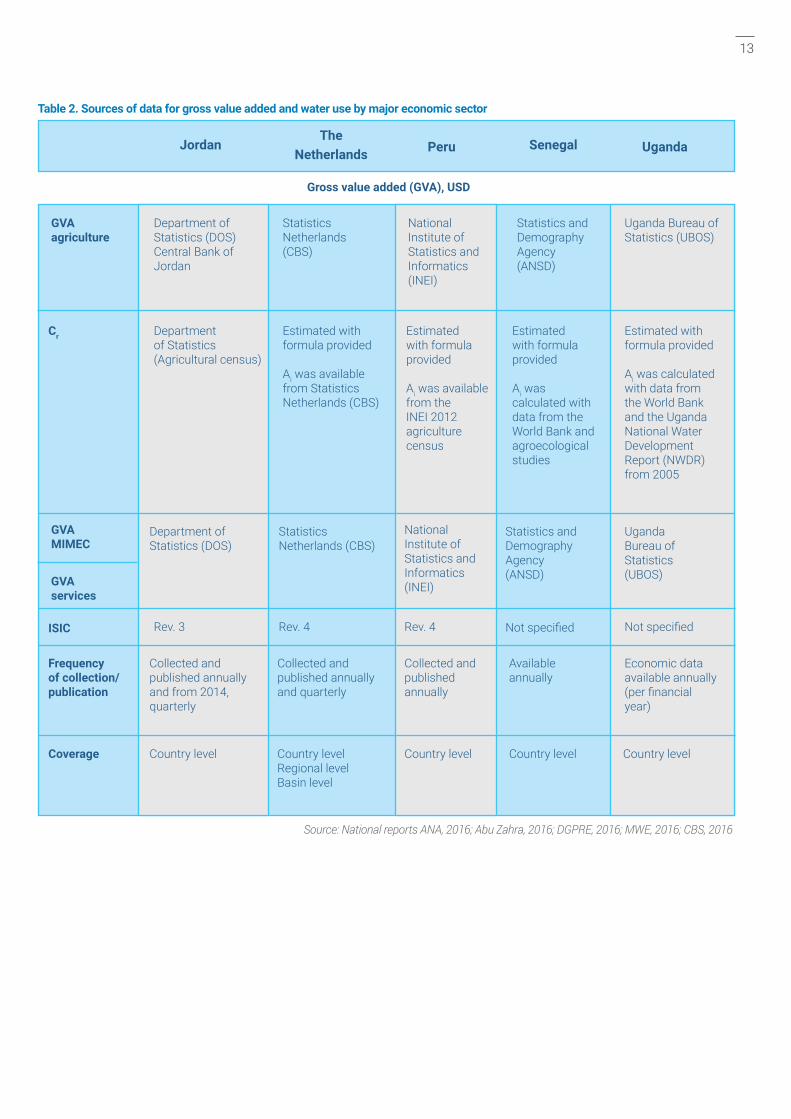
Table 2. Sources of data for gross value added and water use by major economic sector
Jordan
GVA agriculture
Cr
GVA MIMEC
GVA services
ISIC Rev. 3 Rev. 4 Rev. 4 Not specified Not specified
Frequencyof collection/ publication
Country levelCoverage
Department of Statistics (DOS)Central Bank of Jordan
Department of Statistics (Agricultural census)
Collected and published annually and from 2014, quarterly
Collected and published annually and quarterly
Country levelRegional levelBasin level
Collected and published annually
Country level
Available annually
Country level
Economic data available annually(per financial year)
Country level
Department of Statistics (DOS)
Statistics Netherlands (CBS)
National Institute of Statistics and Informatics (INEI)
Statistics and Demography Agency (ANSD)
Uganda Bureau of Statistics (UBOS)
Estimated with formula provided
Ai was available from the INEI 2012 agriculture census
Estimated with formula provided
Ai was calculated with data from the World Bank and agroecological studies
Estimated with formula provided
Ai was calculated with data from the World Bank and the Uganda National Water Development Report (NWDR) from 2005
Uganda Bureau of Statistics (UBOS)
Statistics Netherlands (CBS)
National Institute of Statistics and Informatics (INEI)
Statistics and Demography Agency (ANSD)
Estimated with formula provided
Ai was available from Statistics Netherlands (CBS)
Gross value added (GVA), USD
TheNetherlands Peru Senegal Uganda
Source: National reports ANA, 2016; Abu Zahra, 2016; DGPRE, 2016; MWE, 2016; CBS, 2016

14Progress on Water-use Efficiency
Jordan
Water use by major economic sector (m3)
TheNetherlands Peru Senegal Uganda
Agriculturefreshwaterwithdrawal(Wa)
Industryfreshwaterwithdrawal(Wm)
Servicesfreshwaterwithdrawal(Ws)
Frequencyof collection/ publication
Coverage
Ministry of Water and Irrigation (Water Balance Reports 2010–2014)
Ministry of Water and Irrigation and Department of Statistics
Department of Statistics (DOS) (Environment Statistics Reports 2010–2014)
Data gaps were estimated using intermediate consumption
Collectedannually, published every four years
Country level
Country levelSubnational levelBasin level
WaterResourcesManagementUnit (ANA)(from localoperators)
Collectedannually
Country levelBasin level Country level Country level
Not specified
Wa: less thanevery 5 yearsWm: Every 5 years (AQUASTAT)Ws: annually
Organizations in charge of water supply
Statistics andDemographyAgency (ANSD)
AQUASTAT(figure for 2008)
Ministry of Water and Environment (MWE)*Water for livestock estimated based on livestock population
Urban supply:National Waterand SewerageCorporationMWE (databasefor Small TownsWater Supply)Rural supply:Estimated basedon ruralpopulation
Statistics Netherlands (CBS)
LEI research institute (for area under irrigation)
Statistics Netherlands (CBS)(annual environmental reports, national groundwater register)
Association of Dutch Water Companies(Vewin)
Collected biennially(by economic activity), annually (total withdrawls)
Source: National reports ANA, 2016; Abu Zahra, 2016; DGPRE, 2016; MWE, 2016; CBS, 2016
Table 2. Sources of data for gross value added and water use by major economic sector (cont.)

15
The data gathering process indicated that statistical data were generally available from governmental sources for the variables included in the methodology. Where data were missing – for example, cultivated land in Senegal and Uganda or water use by MIMEC in Uganda – these were either taken from international sources such as the World Bank, Organisation for Economic Co-operation and Development (OECD) and United Nations Statistics Division (UNSD) (for the economic variables) or the FAO AQUASTAT database (for the water use variables). It was also difficult to obtain up-to-date data for irrigated land in Peru, since there was only information from the 2012 agricultural census.
Economic data are gathered through national ac-counts. These accounts are generally built using the internationally agreed System of National Accounts (SNA) recommendations prepared under the auspices of the United Nations, the European Commission, the OECD, the International Monetary Fund (IMF) and the World Bank Group. National statistics departments or agencies are responsible for collecting, consolidating and publishing this type of data, which is usually com-pleted annually.
The set of concepts, definitions, classifications and accounting rules in the SNA recommendations allow for the international comparison of data and economic performance among countries. Essentially, three ap-proaches (output, expenditure and income) are used to compile economic data in national accounts. The “output approach” – which is used in the indicator 6.4.1 methodology – provides sectoral value added data fol-lowing the ISIC Rev. 3 or 4 coding. The Netherlands and Peru are following ISIC 4, while Jordan is using ISIC 3; Uganda does not specify whether data are collected according to those standards.
Among all economic components of the formula, the most difficult to obtain was the proportion of agricultu-ral gross value added of rainfed agriculture (Cr). Except for Jordan, which has annual figures from its agricul-tural census since the year 2000, the remaining pilot countries had to estimate the value using the metho-dology formulas, where Cr is derived from the propor-tion of irrigated land over the total cultivated land (Ai). Ai data were statistically available for the Netherlands and Peru, though for the latter they were only updated to 2012. Senegal estimated its Cr value using figures on total cultivated land from the World Bank database and figures on irrigated areas from studies on agroe-cological areas of the Senegal River Valley, the Senegal River Delta and the Casamance and Niayes regions. Uganda used figures on cultivated land from the Wor-ld Bank (though these were only updated to 2011) and data on irrigated land from the Uganda National Water Development Report (NWDR), prepared jointly by the
Ministry of Water and Environment (through its Direc-torate of Water Development) and the World Water As-sessment Programme (WWAP) in 2005.
As for data on water use, these were generally updated to 2016, 2015 or 2014. In Jordan, the Netherlands and Peru, figures are reported annually or biennially, as recommended by the GEMI methodology. However, Senegal and Uganda have not specified how regularly they collect and publish their data.
Countries mostly consolidate and publish data at the country level, except for the Netherlands, which provi-des figures economic data at regional and basin level, and Peru which has figures on water use for its three major basins (Pacific, Amazon and Titicaca).
Even though sources of data were largely available, pro-blems were encountered that countries should address when collecting data, as detailed in section 2.3.3.
2.3. Data-collection process
2.3.1. Approach
As previously mentioned, to implement and test the me-thodology, each of the pilot countries established wor-king groups with relevant stakeholders (section 2.2.1) to gather the required expert knowledge.
The pilot countries appointed national institutions to lead the process of compiling the indicator data (Table 1). These institutions coordinated the review of all the rele-vant national, subnational and basin unit data sources, such as maps, reports, yearbooks and articles. Though the collection primarily focused on the most recent data, it included all potential sources of information and any partial data (by time or area), such as those produced by local projects.
In-country meetings with all the involved institutions were held throughout 2016 to track progress, share findings and endorse the results obtained. In addition, the Netherlands hosted a Work in Progress workshop in September 2016 that gathered key representatives of all pilot countries and experts of GEMI-Target Teams from United Nations organizations. The aim of this meeting was to (1) discuss proof of concept process for GEMI
16Progress on Water-use Efficiency
indicators (6.3.1, 6.3.2, 6.4.1, 6.4.2, 6.5.1, 6.5.2 and 6.6.1); (2) share feedback, lessons learned and experiences on the proposed methods and indicators; and (3) iden-tify additional activities to be undertaken to overcome challenges.
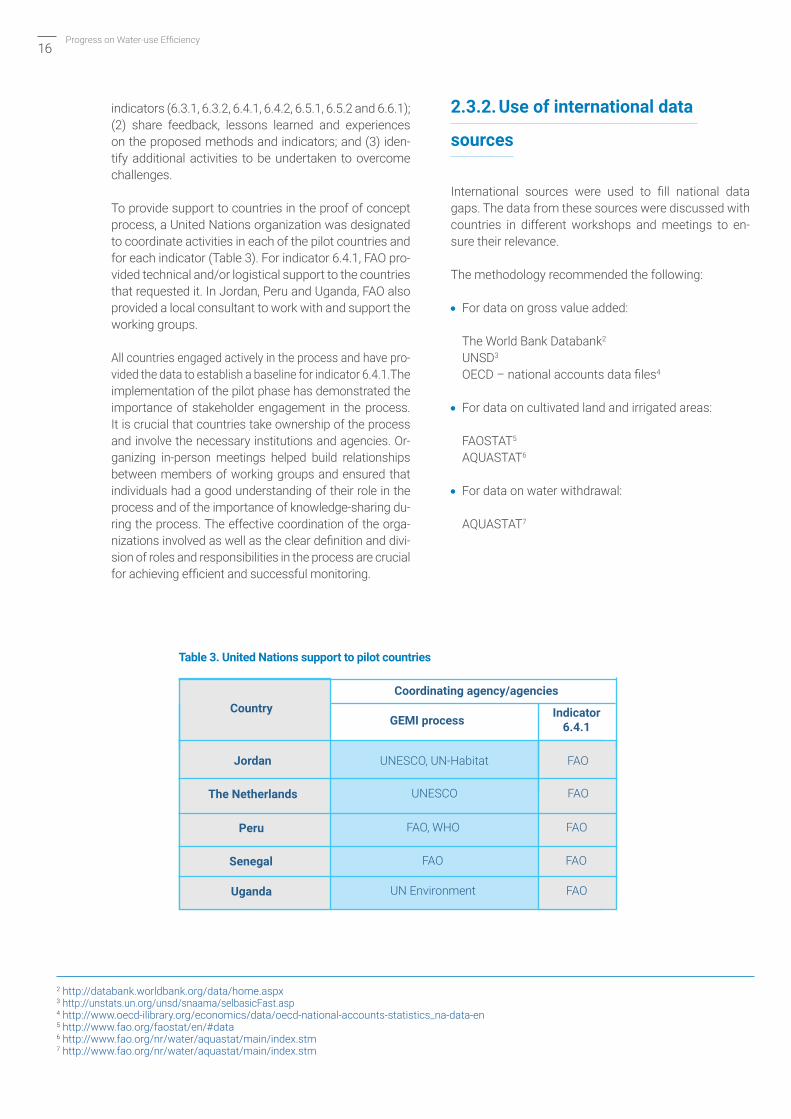
To provide support to countries in the proof of concept process, a United Nations organization was designated to coordinate activities in each of the pilot countries and for each indicator (Table 3). For indicator 6.4.1, FAO pro-vided technical and/or logistical support to the countries that requested it. In Jordan, Peru and Uganda, FAO also provided a local consultant to work with and support the working groups.
All countries engaged actively in the process and have pro-vided the data to establish a baseline for indicator 6.4.1.The implementation of the pilot phase has demonstrated the importance of stakeholder engagement in the process. It is crucial that countries take ownership of the process and involve the necessary institutions and agencies. Or-ganizing in-person meetings helped build relationships between members of working groups and ensured that individuals had a good understanding of their role in the process and of the importance of knowledge-sharing du-ring the process. The effective coordination of the orga-nizations involved as well as the clear definition and divi-sion of roles and responsibilities in the process are crucial for achieving efficient and successful monitoring.
2.3.2. Use of international data
sources
International sources were used to fill national data gaps. The data from these sources were discussed with countries in different workshops and meetings to en-sure their relevance.
The methodology recommended the following:
• For data on gross value added:
The World Bank Databank2 UNSD3
OECD – national accounts data files4
• For data on cultivated land and irrigated areas:
FAOSTAT5 AQUASTAT6
• For data on water withdrawal:
AQUASTAT7
2 http://databank.worldbank.org/data/home.aspx3 http://unstats.un.org/unsd/snaama/selbasicFast.asp 4 http://www.oecd-ilibrary.org/economics/data/oecd-national-accounts-statistics_na-data-en5 http://www.fao.org/faostat/en/#data6 http://www.fao.org/nr/water/aquastat/main/index.stm7 http://www.fao.org/nr/water/aquastat/main/index.stm
Table 3. United Nations support to pilot countries
Country
Uganda
The Netherlands
Senegal
Peru
Jordan
Coordinating agency/agencies
UN Environment
FAO
UNESCO
FAO, WHO
UNESCO, UN-Habitat
FAO
FAO
FAO
FAO
FAO
GEMI process Indicator 6.4.1

17
During this pilot phase, Senegal used international data to determine the proportion of irrigated land on the total cultivated land (Ai ). Data on cultivated land were taken from the World Bank database and figures for irrigated areas were found in studies on the country’s agroeco-logical areas. In Uganda, the most recent data on the proportion of irrigated land on total cultivated were the World Bank’s 2011 figures.
2.3.3. Challenges and opportunities
The proof of concept process conducted in the five pilot countries highlighted a number of challenges and op-portunities that should be considered when implemen-ting the methodology.
The challenges identified are as follows:
• Handling economic data
The methodology’s economic variables are based on the economic activities classification of ISIC Rev. 4. However, some countries (i.e. Jordan) may still collect information based on ISIC Rev. 3. This could lead to inconsistent data aggregations of the major economic sectors. Thus, it is important to understand the different industrial classification systems and adjust possible aggregation inconsistencies before using the “sectoral gross value added” for computing the water-use effi-ciency for each sector.
Another important issue regarding economic data is the base year (GDP deflators) used to convert “current or nominal” data to “real or constant” data. Ideally, coun-tries should all use the same base year, though there can be exceptions for countries that already have an es-tablished base year for their statistics.
In addition, the conversion from national currency to US dollars would have to be based on an exchange rate that is calculated in the same way for all countries. The prevai-ling exchange rate at the base year should be used for the conversion.
When compiling economic data, some countries use financial years which usually do not correspond to calendar years (June 2016 to May 2017 rather than Ja-nuary to December 2016). In these cases, it is necessary to explain how the conversion to calendar years was made. The methodology recommends using the figure of a given financial year for the calendar year corresponding to the last part of the period (for example, the 2016/17 figure for 2017).
• Data inconsistency among various sources
The availability of different sources of information for the same variable could potentially be problematic, since figures could be different depending on the source consulted. This was an issue in Uganda, when estimating agricultural water withdrawals.
In such cases, the differences stem either from the refe-rence years considered (long term averages versus an-nual data) or the factors taken into account for the calcu-lations. For example, in some cases, water for livestock/aquaculture/silviculture is not included as an agricultural withdrawal, which is particularly relevant in countries where the agricultural non-crop production sector is im-portant.
To address this challenge, the factors that led to the diffe-rences must be understood and the data harmonized or the value with the reference that best matches the defini-tion stated in the indicator’s methodology taken. It is also important to keep the same data source over time.
• Weak monitoring by country institutions
While data were generally available, these were not always in the format or the quality, quantity and frequen-cy required. For example, data on industry withdrawals in Uganda or irrigated land in Peru were not sufficiently up to date.
In some cases, certain parameters were not being mo-nitored or were weakly monitored, such as rural water consumption in Uganda and agriculture water wit-hdrawals in Senegal respectively.
It is crucial to support countries in strengthening their national capacity and mobilizing resources to implement the methodology. Efficient cooperation and sharing of responsibilities among the institutions involved in mo-nitoring the indicator at the national level remain key to success of the whole process.
• Reference years/periods
Although data were generally up to date, reference years or periods can vary between variables and countries. For example, the latest available values on water withdrawals can differ significantly from country to country. It is the-refore highly important to always specify the reference years used.

18Progress on Water-use Efficiency
• Parameters to take into account when defining va-riables
To define figures for the indicator 6.4.1 variables, several factors must be considered, as specified in the metho-dology. During the pilot process, certain difficulties were noted for some components, including aspects related to agriculture value added, sectoral water use, and pro-portion of irrigated land over the total cultivated land, as explained below.
When calculating agriculture value added and water use, forestry and fishing subsectors must not be included.
Regarding water use for the MIMEC sector, water used for hydropower should not be included in the calculation, as it is removed from the source for a very short time.
To calculate the proportion of irrigated land over the total cultivated land (Ai), the FAOSTAT definition of cultivated land – the sum of arable land and perma-nent crops – should be followed. This was the case in the Netherlands, where horticulture and forage sectors were not initially considered when calculating irrigated areas, as in the national statistics, these two sectors are not classified as arable land. Since this may be the case for other countries, attention should be given to include all forms of crop production under the category of culti-vated land.
As for irrigated land, the AQUASTAT definition of “total harvested irrigated crop area” should be used, which refers to crops grown under full control irrigation. It is important to note that areas under double irrigated crop-ping (same area cultivated and irrigated twice a year) are counted twice. Thus, the total area may be larger than the full or partial control equipped area, which gives an indi-cation of the cropping intensity.
• Outdated data
In the event that up-to-date data are not available (from in-country or international sources), efforts should be made to provide the most accurate estimate possible. This was
an issue for industrial water withdrawals in Uganda. The most recent data were from 2008, which was the figure used for 2016, despite the industrial value added increa-sing by more than 20 per cent in the past decade. Similar-ly, in Peru, the most recent data available for irrigated land were from 2012.
• Weak reporting from country institutions into interna-tional databases
It was noted that international databases such as AQUASTAT (which are repositories of data provided by countries) did not have the latest figures available in some cases. Countries should therefore endeavour to share their data with these international sources to ensure that they are regularly updated.
When reporting the data, it is very important that coun-tries reference all the sources used and the years consi-dered for data collection or estimations, as well as the type of data collected (statistical, modelled, remote sen-sing). While this is essential to ensuring the quality of the process, it was noted that not all of the pilot countries pro-vided such information for all of the indicator’s variables.
• Double counting
There is a potential risk of double counting data when computing water use by the different sectors.
This pilot exercise was an opportunity to further improve data collection and estimations in each of the countries and furthermore, to improve the way water resources are managed. In Senegal, for example, testing the methodo-logy has led to a proposal of an action plan for the water and sanitation sector.
The necessary involvement of different agencies in this process has helped to strengthen institutional relations and build or consolidate networks of professionals which will help improve the monitoring of the indicator and, most likely, other aspects of water management at the national level.

19
How does the efficiency concept used for indicator 6.4.1 differ from productivity concept?
Although these have similar measurement units, the present indicator aims to establish a link between the total output of all economic sectors and the country’s use of water resources, considered as part of the natural resource base. It therefore does not consider the actual specific output produced by a single water unit used in the various sectors. Rather, it identifies the relation between economic development and exploitation of water resources.
Why use the water abstraction category rather than water consumption?
Consumption is a concept that is more so linked to productivity and mostly applies to the agricultural sector. In fact, industrial plants and cities do not consume much water, yet they use huge amounts of the resource. Though most of this water returns to the environment, this does little to reduce the impact they have on the resource. If it did, cities would never suffer from water scarcity, which is clearly not the case.
Why is rainfed agricultural production excluded?
The indicator aims to identify the economic pressure on water resources. In other words, it focuses on “blue water” rather than “green water”. Including water directly used from precipitation into the indicator would largely increase the quantities, making them more difficult to estimate and misleading decision makers about the potential of their water sources.
Rainfed value could be added without adding the rainwater used – why was this not done?
If this approach were taken, the indicator would be distorted and would not give indications on the need to improve wa-ter management. Moreover, such an indicator would be biased “against” irrigation, as it would automatically decrease if more water was used for irrigation.
Why choose economic value as the assessment unit when other choices were also possible, such as calories in agricul-ture or megawatts in energy production?
Expressing the indicator in such a way (calories in agriculture or megawatts in energy production) would have had two main disadvantages: (i) it would have been oriented again towards production and productivity, which has been excluded as described above, and (ii) it would have been very complex to reduce all the values for the various sectors, expressed in different units, to one single indicator.
BOX 5Frequently asked questions
Results and analysis
3
©FA
O/U
N P
hoto
/Log
an A
bass
i

21
3.1. Global and regional estimates for indicator 6.4.1
After testing the methodology in the five pilot countries, a preliminary global analysis for indicator 6.4.1 was conducted using available databases from international organizations (see section 3.2.). The data from these sources are, in any case, being checked with a number of countries in order to ensure they are representative. From 2019, data will be crosschecked with all countries in two different ways: (1) the custodian agency collects the data and sends them to governments for endorsement or (2) countries send the data to custodian agencies directly.
The results of this analysis indicate that water-use efficiency is a little over USD 15/m3 worldwide, though si-gnificant differences exist among countries and regions. Figure 2 shows calculated regional values for water-use efficiency based on data from 168 countries (Annex 2). Some small countries did not have data, but these would have had little impact on regional and global values.
Lowest regional water-use efficiencies are about USD 2/m3 in Central and Southern Asia, around USD 7/m3 in sub-Saharan Africa, and almost USD 8/m3 in Northern Africa and Western Asia.
The highest values are USD 50/m3 in Oceania and USD 38/m3 in Europe and Northern America. When looking at these two broad regions more closely, the aforemen-tioned regional differences can be identified. In Oceania, figures are much higher for Australia and New Zealand than in the rest of the continent. In addition, Europe has a markedly higher average than in Northern America.
Average values for water-use efficiency are found in Eastern and South-Eastern Asia (around USD 15/m3) and Latin America and the Caribbean (about USD 13/m3).
The distribution of water-use efficiency resembles a logarithmic curve where most countries have ef-ficiencies in water use below USD 100/m3 – only a few countries surpass this value or even reach over USD 1,000/m3 (Figure 4).
Further analysis (Figure 3 and Table 4), reveals that 75 countries have efficiencies less than USD 10/m3 (of those, 10 countries are below USD 1/m3), 56 countries between USD 10/m3 and USD 40/m3, and 17 countries between USD 40/m3 and USD 80/m3. Finally, there are 20 countries with efficiencies above USD 80/m3.
Water-use efficiency is a little over USD 15/m3 worldwide, though significant differences exist among countries and regions.
The lowest water-use efficiency is in Central and Southern Asia at USD 2/m3.
The highest water-use efficiency is in Oceania at USD 50/m3.
75 countries have efficiencies less than USD 10/m3 (of those, 10 countries are below USD 1/m3), 56 countries between USD 10/m3 and USD 40/m3, and 17 countries between USD 40/m3 and USD 80/m3.
KEY FACTS

22Progress on Water-use Efficiency
Figure 2. Water-use efficiency by region (USD/m3), base year 2015
World
Oceania
Melanesia, Micronesia, Polynesia
Australia and New Zealand
Northern America and Europe
Northern America
Europe
Eastern Asia and South-Eastern Asia
Eastern Asia
South-Eastern Asia
Latin America and the Caribbean
Western Asia and Northern Africa
Western AsiaNorthern Africa
Sub-Saharan Africa
Central Asia and southern AsiaCentral Asia
Southern Asia
15.2
50.0
34.4 50.3
38.2 33.2 46.0
14.8
20.9
3.7
12.9
7.9 10.0 5.1
6.7
1.9
1.5
1.9
Figure 3. Water-use efficiency (USD/m3) by country, base year 2015
<10
10–40
40–80
>80
No data
WUE (USD/m³)
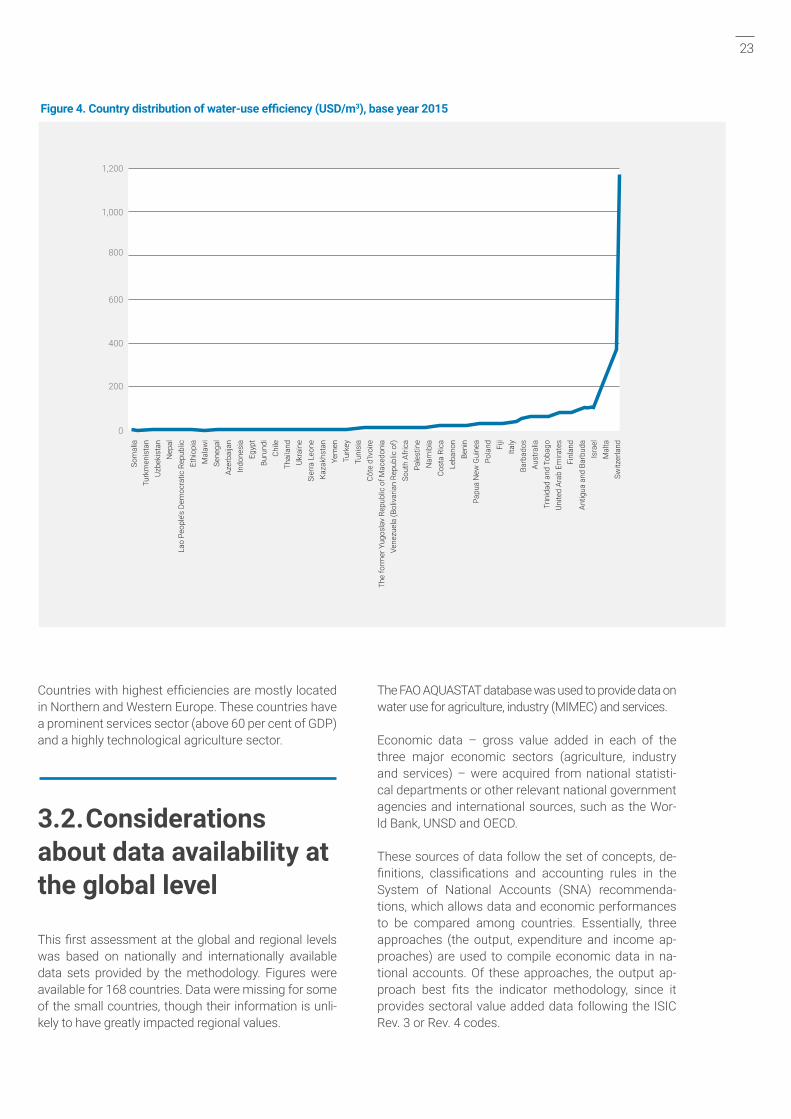
23
Figure 4. Country distribution of water-use efficiency (USD/m3), base year 2015
0
200
400
600
800
1,000
1,200
Som
alia
Turk
men
ista
nUz
beki
stan
Nep
alLa
o Pe
ople
’s De
moc
ratic
Rep
ublic
Ethi
opia
Mal
awi
Sene
gal
Azer
baija
nIn
done
sia
Egyp
tBu
rund
iCh
ileTh
aila
ndUk
rain
eSi
erra
Leo
neKa
zakh
stan
Yem
enTu
rkey
Tuni
sia
Côte
d’Iv
oire
The
form
er Y
ugos
lav
Repu
blic
of M
aced
onia
Vene
zuel
a (B
oliv
aria
n Re
publ
ic o
f)So
uth
Afric
aPa
lest
ine
Nam
ibia
Cost
a Ri
caLe
bano
nBe
nin
Papu
a N
ew G
uine
aPo
land Fi
jiIta
lyBa
rbad
osAu
stra
liaTr
inid
ad a
nd T
obag
oUn
ited
Arab
Em
irate
sFi
nlan
dAn
tigua
and
Bar
buda
Isra
elM
alta
Switz
erla
nd
Countries with highest efficiencies are mostly located in Northern and Western Europe. These countries have a prominent services sector (above 60 per cent of GDP) and a highly technological agriculture sector.
3.2. Considerations about data availability at the global level
This first assessment at the global and regional levels was based on nationally and internationally available data sets provided by the methodology. Figures were available for 168 countries. Data were missing for some of the small countries, though their information is unli-kely to have greatly impacted regional values.
The FAO AQUASTAT database was used to provide data on water use for agriculture, industry (MIMEC) and services.
Economic data – gross value added in each of the three major economic sectors (agriculture, industry and services) – were acquired from national statisti-cal departments or other relevant national government agencies and international sources, such as the Wor-ld Bank, UNSD and OECD.
These sources of data follow the set of concepts, de-finitions, classifications and accounting rules in the System of National Accounts (SNA) recommenda-tions, which allows data and economic performances to be compared among countries. Essentially, three approaches (the output, expenditure and income ap-proaches) are used to compile economic data in na-tional accounts. Of these approaches, the output ap-proach best fits the indicator methodology, since it provides sectoral value added data following the ISIC Rev. 3 or Rev. 4 codes.

24Progress on Water-use Efficiency
WUE (USD/m3)
< 10
40–80
10–40
> 80
Countries
Number of countries: 56
Algeria, Argentina, Belarus, Benin, Botswana, Brazil, Cabo Verde, Cameroon, Canada, Central African Republic, China, Colombia, Comoros, Costa Rica, Côte d’Ivoire, Cuba, Democratic Republic of the Congo, Estonia, Fiji, Greece, Guatemala, Hungary, Italy, Jamaica, Jordan, Kenya, Lebanon, Lesotho, Libya, Malaysia, Mexico, Mongolia, Montenegro, Namibia, New Zealand, Oman, Palestine, Panama, Papua New Guinea, Peru, Poland, Portugal, Puerto Rico, Republic of Korea, Romania, Russian Federation, Rwanda, Saudi Arabia, Slovenia, South Africa, Spain, the former Yugoslav Republic of Macedonia, Tunisia, Uganda, United States of America, Venezuela (Bolivarian Republic of)
Number of countries: 75
Afghanistan, Albania, Armenia, Azerbaijan, Bangladesh, Belize, Bhutan, Bolivia, Bulgaria, Burkina Faso, Burundi, Cambodia, Chad, Chile, Democratic People’s Republic of Korea, Dominican Republic, Ecuador, Egypt, El Salvador, Eritrea, Ethiopia, Eswatini, Gambia, Ghana, Georgia, Guinea, Guinea-Bissau, Guyana, Haiti, Honduras, India, Indonesia, Iran (Islamic Republic of), Iraq, Kazakhstan, Kyrgyzstan, Lao People’s Democratic Republic, Liberia, Madagascar, Malawi, Mali, Mauritania, Mauritius, Morocco, Mozambique, Myanmar, Nepal, Nicaragua, Niger, Nigeria, Pakistan, Paraguay, Philippines, Republic of Moldova, Senegal, Sierra Leone, Somalia, Sri Lanka, Sudan, Suriname, Syrian Arab Republic, Tajikistan, Thailand, Timor-Leste, Togo, Turkey, Turkmenistan, United Republic of Tanzania, Ukraine, Uruguay, Uzbekistan, Viet Nam, Yemen, Zambia, Zimbabwe
Number of countries: 17
Australia, Bahrain, Barbados, Belgium, Croatia, Czechia, France, Gabon, Germany, Iceland, Japan, Kuwait, Lithuania, Netherlands, Seychelles, Trinidad and Tobago, United Arab Emirates
Number of countries: 20
Angola, Antigua and Barbuda, Austria, Congo, Cyprus, Denmark, Equatorial Guinea, Finland, Ireland, Israel, Latvia, Luxembourg, Malta, Norway, Qatar, Singapore, Slovakia, Sweden, Switzerland, United Kingdom of Great Britain and Northern Ireland
Table 4. Countries according to levels of water-use efficiency (USD/m3), base year 2015
25
Most of the data from the international databases consulted were not up to date. For some countries, re-ference years dated back to the late 1990s. These da-tabases are informed by data produced or published by countries, making them useful tools for future assess-ments. However, without specific effort from coun-tries, no update, and consequently no monitoring can be done. Ideally, data should be updated every one or two years to track economic growth, even when there is little change in a country’s annual water use. A natio-nal institution should be tasked with coordinating and compiling the indicator, including reviewing all national and subnational sources of relevant data. Establishing this process may require additional institutional capa-city and coordination to collect and process data.
This indicator addresses three main aggregated eco-nomic sectors (agriculture; mining, manufacturing, construction and energy; and services), though further disaggregation would enable more detailed analysis of water-use efficiency for national planning and deci-sion-making. In particular, disaggregation of agricultu-re by subsectors may be needed to adequately cover water-use for livestock and aquaculture.
Thus, the main challenge for this indicator is to ob-tain enough information to demonstrate increases in value added per unit of water withdrawn, especially in the poorest regions. To achieve this objective, other challenges must be considered, such as how to reduce water withdrawal for agriculture, how to scale-up tech-nologies that reduce the use of water for all sectors and how to monitor and ensure the quality and quantity of water supplies.
Although the two indicators for target 6.4 monitor diffe-rent information, there are strong links between them and they need to be understood as complementary. Indicator 6.4.1 is an economic indicator that assesses to what extent a country’s economic growth relies on the use of water resources. Indicator 6.4.2 is an envi-ronmental indicator that tracks the physical availability of freshwater resources. Decision makers can use the complementary information offered by these two indi-cators to understand how increasing water use affects the availability of water resources and consequently, to define a tipping-point target to aim at for decoupling wa-ter use from economic growth. Such information would help countries to adequately follow-up on target 6.4.
Limitations of the present data set
As previously mentioned, indicator 6.4.1 introduces a time factor in water-use efficiency assessments, yet, data are still only available for specific periods of
time. This implies that the actual indicator, which is the change in water-use efficiency over time, cannot be computed. For that reason, the data presented in this report are labelled as preliminary.
In addition, given that this indicator has no previous history, it is not possible to propose interpretations beyond what has been described in this report, let alone produce actual analyses of the data. However, in terms of policy, the focus of the indicator is to identify the breaking point, after which the increase in water use – if any – is decoupled from the increase in the value added produced by the economy. While this may not be something that developing countries experience for some years, anticipating this point should be the focus of water policies in order to reduce the risk of countries overstretching their available resources.
More detailed analyses will be possible when more data tracking the change in water-use efficiency beco-me available.
Next steps in global data collection
As Box 4 details, the IAEG-SDG has not defined a framework for collecting global indicator data that Member States and custodian agencies can follow. The only clear indication is that countries should retain ownership of their data and of the monitoring process. Given the difficulties countries face in collecting spe-cific data, information from recognized international data sets has been used to compile the baseline global indicators that are the subject of this report.
To make this process more robust for the next rounds of data collection, two main steps will be undertaken, focusing on countries and the AQUASTAT database.
At the national level, all Member States will receive pre-compiled data-collection sheets by the end of 2018, which they will be required to revise, confirm or update with new data. This will encourage countries to take ownership of their data and assume responsibility for the quality of the information.
The AQUASTAT database is currently undergoing an overhaul, which will result in the establishment of a network of national correspondents who will ensure that countries produce regular and consistent relevant data.

4
Conclusions
©FA
O/U
NIC
EF E
thio
pia
27
Summary of findings
The methodology and pilot process
Indicator 6.4.1 was newly introduced by the SDG process and had never been monitored at a global level within the context of the MDGs. Thus, an entirely new methodolo-gy needed to be developed to monitor the indicator. This also meant that no previous data existed for the indicator, resulting in new data computations and related interpre-tation of the results.
Despite this, the proof of concept process tested in five pilot countries proved that statistical data were generally available – and reasonably up to date – from governmen-tal sources for the methodology’s variables.
In the cases where data were missing, international sources such as the World Bank or FAO were consulted for information. However, the data available from these sources were not always recent.
National statistics departments or agencies generally col-lect and publish economic data annually through their na-tional accounts. Jordan, the Netherlands and Peru follow ISIC recommendations, whereas Senegal and Uganda do not specify whether their data are collected according to these standards.
As regards data on water use, these were generally up-dated to 2016, 2015 or 2014. In the Netherlands and Peru, figures are reported annually or biennially, as the GEMI methodology recommends. However, for Jordan, Sene-gal and Uganda the consultant’s reports did not specify how regularly data are collected and published.
Each of the pilot countries consolidate and publish data at the national level. In addition, the Netherlands has se-parate economic data at the regional and basin level and Peru has information on water use for its three major ba-sins (Pacific, Amazon and Titicaca).
• Handling economic data. When collecting data for the economic variables, various issues have to be taken into account: (1) economic sectors should be aggregated based on ISIC Rev. 4; (2) data have to be converted from “current or nominal” to “real or constant” using the base year defined by the methodology; (3) local currency has to be converted to US dollars using the prevailing ex-change rate of the base year; (4) annual data have to be reported based on calendar years (sometimes financial years cover periods that include two calendar years).
• Data inconsistency among various sources. The avai-lability of different sources of information for the same variable could potentially be problematic, since figures could be different depending on the source consulted (due to years of reference considered or other compo-nents taken into account). To address this challenge, the factors that caused the differences must be un-derstood and the data harmonized or the value with the reference that best matches the definition stated in the indicator’s methodology taken. It is also important to keep the same data source over time.
• Weak monitoring by country institutions. While data were generally available, these were not always in the format, quality, quantity and frequency required. In other cases, certain parameters were not being mo-nitored or were weakly monitored. There is a need to improve countries’ capacity and resources for imple-menting the methodology, and to strengthen coope-ration and the sharing of responsibilities among the institutions involved in monitoring the indicator.
• Reference years/periods. Although data were gene-rally up to date, reference years or periods can vary between variables and countries. In this regard, it is very important to always specify the reference years used.
• Parameters to take into account when defining va-riables. To define a figure for each parameter conside-red in the indicator, certain points should be clear: (1) when calculating agriculture value added and water use, forestry and fishing subsectors should not be in-cluded; (2) regarding water use for MIMEC, hydropower should not be included in the calculation; and (3) when calculating the proportion of irrigated land over the to-tal cultivated land (Ai ), the definition of cultivated land to adhere to should be the one provided by FAOSTAT.
• Outdated data. In the event that up-to-date data are not available (from in-country or international sources), efforts should be made to provide the most accurate estimate possible.
• Weak reporting from country institutions into inter-national databases. It was noted that international databases such as AQUASTAT (which are repositories of data provided by countries) did not have the latest figures available in some cases. Countries should the-refore endeavour to share their data with these interna-tional sources to ensure that they are regularly updated.
• Double counting. There is a potential risk of double counting when computing water use by the different sectors.
To implement and test the methodology, the pilot coun-tries established working groups with relevant stakehol-
28Progress on Water-use Efficiency
ders to share findings and validate the data and analysis conducted. A national institution was appointed in each country to lead the process of compiling the indicator. These institutions coordinated the review of all the na-tional, subnational and basin unit sources of relevant data, such as maps, reports, yearbooks and articles. The collection focused on the most recent data, without excluding any potential sources of information. Partial data (by time or area) were also collected, such as data produced by local projects. Meetings with all the institu-tions involved were held throughout 2016 to track pro-gress, share findings and validate the results obtained.
Global data
The global average for water-use efficiency is a little over USD 15/m3, although significant differences exist among countries and regions. The lowest regional water-use effi-ciencies are USD 2/m3 in Central and Southern Asia, around USD 7/m3 in sub-Saharan Africa, and almost USD 8/m3 in Northern Africa and Western Asia. The highest values are USD 50/m3 in Oceania and USD 38/m3 in Europe and Nor-thern America. Average values are found in Eastern and South-Eastern Asia (around USD 15/m3) and Latin Ameri-ca and the Caribbean (about USD 13/m3).
This first assessment at the global and regional levels was based on nationally and internationally available data sets provided by the methodology. Figures were available for 168 countries.
The FAO AQUASTAT database was used to provide data on water use for agriculture, industry (MIMEC) and ser-vices. Economic data on the gross value added in these three major economic sectors was acquired from na-tional statistical departments or other relevant national government agencies and international sources such as the World Bank, UNSD and OECD. These sources of data follow the set of concepts, definitions, classifica-tions and accounting rules in the System of National Accounts (SNA) recommendations, allowing countries’ data and economic performances to be compared.
International databases are constantly updated with data produced or published by countries, making them useful tools for future assessments. Nonetheless, it is desirable that specific national data are collected to compute the indicator, such as further disaggregated data of major subsectors.
Recommendations and next steps
To date, the IAEG-SDG has not defined a framework for data collection on global indicators to provide guidance to Member States and custodian agencies alike – the only clear indication being that countries should retain ownership of their data and of the monitoring process in general. The IAEG-SDG is expected to develop and agree on a standardized reporting framework during its next meeting, in autumn 2018. The establishment of such framework will help significantly improve and rationalize the data-collection process for the SDG global indicators, clarifying the roles and responsibilities of both national institutions and custodian agencies.
To further implement SDG methodologies, specific na-tional data should be collected to compute the indicator. Countries should therefore take ownership of the process and be mindful of the importance of quality, timely and reliable disaggregated data as well as their accessibi-lity, to enable well-informed decision-making. Custodian United Nations organizations must endeavour to raise awareness of this point and support countries in this pro-cess. A communication campaign among institutions in-volved could be launched.
Setting up or strengthening the data-collection mecha-nisms at the national level is needed to ensure regular updating of the data sets used to compile the indicator. Ideally, this should be done every one or two years to track economic growth, even when there is little change in an-nual water use. A national institution should be appointed in each country to coordinate and compile the indica-tor, including the review of all national and subnational sources of relevant data. Establishing this process may require additional institutional capacity and coordination to undertake data collection and processing.
Country teams should develop a good understanding of the methodology, so that they are aware of the issues that require consideration when using the formula provided (for example, not including water used for hydropower, currency conversion, GDP deflators, etc.). This is also a task for custodian United Nations organizations when explaining the methodology. In fact, an indicator-specific e-learning course is being developed by FAO to facilitate this understanding.
29
Indicator 6.4.1 has been designed to assess the economic and social use of water resources in terms of the va-lue added when they are used in different sectors of the economy. Water-use efficiency is strongly influenced by a country’s economic structure, the proportion of water intensive sectors and any “real” improvements or deteriorations.
The indicator can help formulate water policy by focusing attention on sectors or regions with low water-use effi-ciency. This will guide countries in their efforts to improve water-use efficiency and help them to apply successful actions from sectors or regions with higher water-use efficiency levels to those with lower efficiency levels. Howe-ver, it should be noted that in most cases, it would be futile to try to devise policies that aim to move water from one economic sector to another to increase the value of water-use efficiency. If a country’s general development beco-mes unbalanced due to its use of water resources, other indicators will signal problems and the need for changes.
Increasing water-use efficiency over time means decoupling economic growth from water use across the main water-using sectors, which are agriculture, industry, energy and municipal water supply. This is strongly interlinked with sustainable food production (SDG 2), economic growth (SDG 8), infrastructure and industrialization (SDG 9), cities and human settlements (SDG 11) and consumption and production (SDG 15).
Since agriculture is by far the largest water consumer, this sector offers the greatest opportunities for water sa-vings. Saving just a fraction of the amount used can significantly alleviate water stress in other sectors, particularly in arid countries where agriculture consumes as much as 90 per cent of available water resources. Agricultural water savings can come in many forms, such as more sustainable and efficient food production (“more crop per drop”), through sustainable water management practices and technologies. Water consumption can be reduced by growing less water-intensive crops in water-scarce regions, and minimizing losses in municipal distribution networks and industrial and energy cooling processes can also make a difference.
The use of supplementary indicators at the country level, including the monitoring of irrigation, municipality networks, and industrial and energy cooling efficiencies would enhance the interpretation of this indicator.
BOX 6Using indicator 6.4.1 to achieve SDG 6 at the national level
To enable data comparisons, countries should detail how data were obtained and which reference years and units of measurement were used. To this end, the AQUASTAT questionnaire offers countries guidance in preparing this metadata. In addition, FAO provides countries with a calculation sheet in order to maintain consistency when compiling data.
The pilot process has proven that monitoring indicators requires the strengthening of current systems and in-volvement of various stakeholders and institutions. The lead institution plays a key role in coordinating these stakeholders, who should have a clear understanding of their role in the process, the actions they should imple-ment and the support available. Custodian United Na-tions organizations should focus their efforts on develo-ping strong bonds with lead agencies.
As this indicator includes economic variables, country teams should involve at least one economist in the process.
A reporting period of no more than two years is recom-mended, so that early trends can be identified and pos-sible issues detected in good time.
30Progress on Water-use Efficiency
References
Abu Zahra, S. H. 2016. Current Situation for the Target 6.4 of the Sustainable Development Goals (SDGs) in Jordan.
ANA (National Water Authority). 2016. GEMI – Segui-miento Integrado de las Metas de ODS relacionadas con Agua y Saneamiento. Informe Final. [GEMI – Integrated Monitoring of the SDG targets related to water and sanitation. Final Report]. Peru, ANA.
ANA. 2017. Síntesis del informe final del Proyecto Moni-toreo Integrado de las metas del ODS 6 relacionadas con agua y saneamiento (GEMI). [Summary of the final report on the integrated monitoring project for SDG 6 targets related to water and sanitation (GEMI)]. Peru, ANA.
CBS (Statistics Netherlands), Deltares, eLEAF. 2016. Sustainable Development Goals for water - SDG 6.4 - Three step approach for monitoring. https://cbs.nl/en-gb/background/2016/51/sdgs-for-water-three-step-approach-for-monitoring
Directorate of Water Development/WWAP (World Wa-ter Assessment Program). 2005. National Water Development Report. Uganda, Directorate of Water Development/WWAP.
DGPRE (Department of Water Resources Management and Planning). 2016. Rapport phase pilote du proces-sus de renseignement des indicateurs de l’ODD6 de l’initiative GEMI au Sénégal. [Report on the pilot phase testing of the GEMI SDG 6 indicators in Senegal]. Se-negal, DGPRE.
GEMI (Integrated Monitoring of Water and Sanita-tion-Related SDG Targets Initiative). 2017. Step-by-step monitoring methodology for indicator 6.4.1. http://unwater.org/publications/step-step-methodo-logy-monitoring-water-use-efficiency-6-4-1/
Ministry of Infrastructure and the Environment. 2016. GEMI proof of concept report. Pilot testing of the draft monitoring methodologies for SDG 6 global indica-tors. The Netherlands, Ministry of Infrastructure and the Environment. http://ihp-hwrp.nl/wp-content/uploads/2016/12/Netherlands-GEMI-Proof-of-Concept-Report-December-2016.pdf
MWE (Ministry of Water and Environment). 2016. Mo-nitoring of Sustainable Development Goals. Piloting SDG No. 6: Target 6.4. Report on data compilation for Indicators 6.4.1 and 6.4.2. Uganda, MWE.
MWE/UN-Water. 2016. Testing methodologies for Global Monitoring Indicators (GEMI) for SDG 6 on Water and Sanitation. Uganda Report. Uganda, MWE/UN-Water.
UNEP (UN Environment). 2015. Options for decoupling economic growth from water use and water pollution. A report of the Water Working Group of the Internatio-nal Resource Panel. http://idaea.csic.es/sites/default/files/Options_for_decoupling_economic_growth_from_water_use_and_water_pollution__A_report_of_the_Water_Working_Group_of_the_International_Re-source_Panel-20.pdf
United Nations Economic and Social Council. 2017. Progress towards the Sustainable Development Goals. Report of the Secretary-General. 2017 session, 28 July 2016–27 July 2017. https://unstats.un.org/sdgs/files/report/2017/secretary-general-sdg-re-port-2017--EN.pdf
UNGA (United Nations General Assembly). 2015. Trans-forming our world: the 2030 Agenda for Sustainable De-velopment. Resolution adopted by the General Assem-bly on 25 September 2015. http://un.org/ga/search/view_doc.asp?symbol=A/RES/70/1&Lang=E
USGS (United States Geological Survey). 2018. USGS water use data for the nation. https://waterdata.usgs.gov/nwis/wu
World Bank. 2018. DataBank – World Development Indica-tors. http://databank.worldbank.org/data/home.aspx

31
ANNEX 1. Water-use efficiency (WUE) in USD/m3 by country
# Country WUE # Country WUE
1 Afghanistan 0.3 44 Denmark 377.6
2 Albania 5.1 45 Dominican Republic 7.1
3 Algeria 15.5 46 Ecuador 6.7
4 Angola 108.7 47 Egypt 3.8
5 Antigua and Barbuda 91.2 48 El Salvador 9.2
6 Argentina 12.1 49 Equatorial Guinea 337.8
7 Armenia 2.5 50 Eritrea 4.7
8 Australia 56.1 51 Estonia 10.8
9 Austria 93.8 52 Ethiopia 1.9
10 Azerbaijan 2.9 53 Eswatini 2.1
11 Bahrain 45.1 54 Fiji 31.0
12 Bangladesh 3.0 55 Finland 81.0
13 Barbados 47.7 56 France 65.9
14 Belarus 31.5 57 Gabon 70.1
15 Belgium 65.3 58 Gambia 4.7
16 Belize 8.4 59 Georgia 4.8
17 Benin 24.8 60 Germany 66.2
18 Bhutan 3.2 61 Ghana 5.6
19 Bolivia (Plurinational State of) 9.1 62 Greece 23.9
20 Botswana 38.2 63 Guatemala 12.9
21 Brazil 21.2 64 Guinea 5.4
22 Bulgaria 4.0 65 Guinea-Bissau 2.4
23 Burkina Faso 5.2 66 Guyana 1.5
24 Burundi 4.5 67 Haiti 4.6
25 Cabo Verde 29.4 68 Honduras 6.2
26 Cambodia 3.5 69 Hungary 17.7
27 Cameroon 12.3 70 Iceland 78.1
28 Canada 30.7 71 India 1.9
29 Central African Republic 12.3 72 Indonesia 3.2
30 Chad 3.9 73 Iran (Islamic Republic of) 3.8
31 Chile 4.8 74 Iraq 1.3
32 China 16.7 75 Ireland 210.7
33 Colombia 15.5 76 Israel 103.9
34 Comoros 20.4 77 Italy 36.5
35 Congo 97.9 78 Jamaica 15.1
36 Costa Rica 19.7 79 Japan 51.5
37 Côte d’Ivoire 11.3 80 Jordan 26.5
38 Croatia 60.4 81 Kazakhstan 6.9
39 Cuba 11.5 82 Kenya 10.9
40 Cyprus 81.7 83 Kuwait 70.7
41 Czechia 62.0 84 Kyrgyzstan 0.5
42 Democratic People’s Republic of Korea 1.7 85 Lao People’s Democratic Republic 1.5
43 Democratic Republic of the Congo 23.8 86 Latvia 90.4

32Progress on Water-use Efficiency
# Country WUE # Country WUE
87 Lebanon 23.3 128 Romania 22.3
88 Lesotho 27.9 129 Russian Federation 10.7
89 Liberia 1.7 130 Rwanda 14.0
90 Libya 18.5 131 Saudi Arabia 19.4
91 Lithuania 52.0 132 Senegal 2.7
92 Luxembourg 1,157.9 133 Seychelles 55.0
93 Madagascar 0.5 134 Sierra Leone 6.5
94 Malawi 2.0 135 Singapore 85.0
95 Malaysia 16.8 136 Slovakia 107.1
96 Mali 0.8 137 Slovenia 30.5
97 Malta 184.6 138 Somalia 0.1
98 Mauritania 1.9 139 South Africa 14.9
99 Mauritius 7.6 140 Spain 30.9
100 Mexico 11.9 141 Sri Lanka 3.2
101 Mongolia 13.9 142 Sudan 1.6
102 Montenegro 15.0 143 Suriname 5.9
103 Morocco 7.1 144 Sweden 148.1
104 Mozambique 6.5 145 Switzerland 306.9
105 Myanmar 0.2 146 Syrian Arab Republic 2.8
106 Namibia 17.3 147 Tajikistan 0.4
107 Nepal 1.2 148 Thailand 5.3
108 Netherlands 61.0 149 The former Yugoslav Republic of Macedonia 12.2
109 New Zealand 28.9 150 Timor-Leste 0.4
110 Nicaragua 5.4 151 Togo 8.3
111 Niger 2.8 152 Trinidad and Tobago 63.9
112 Nigeria 6.7 153 Tunisia 10.8
113 Norway 103.3 154 Turkey 8.4
114 Oman 32.3 155 Turkmenistan 0.4
115 Pakistan 1.0 156 Uganda 14.4
116 Palestine 15.7 157 Ukraine 5.7
117 Panama 39.1 158 United Arab Emirates 69.8
118 Papua New Guinea 27.5 159 United Kingdom of Great Britain and Northern Ireland 281.1
119 Paraguay 6.9 160 United Republic of Tanzania 2.0
120 Peru 11.0 161 United States of America 33.4
121 Philippines 2.7 162 Uruguay 6.8
122 Poland 29.4 163 Uzbekistan 0.6
123 Portugal 16.0 164 Venezuela (Bolivarian Republic of) 13.7
124 Puerto Rico 25.2 165 Viet Nam 1.4
125 Qatar 233.9 166 Yemen 7.3
126 Republic of Korea 26.2 167 Zambia 4.3
127 Republic of Moldova 3.4 168 Zimbabwe 1.2

33
ANNEX 2. Country data for the water-use efficiency (WUE) indicator
Country WUE Agriculture
WUE MIMEC
WUE Services
P% Agriculture
P% MIMEC
P% Services WUE
Afghanistan 0.1 14.6 19.3 99 1 1 0.3
Albania 0.9 8.5 7.6 39 18 43 5.1
Algeria 0.7 172.8 18.2 59 5 36 15.5
Angola 0.2 205.2 86.1 21 34 45 108.7
Antigua and Barbuda 2.4 70.3 120.6 16 22 63 91.2
Argentina 0.2 35.5 53.3 74 11 15 12.1
Armenia 0.5 26.9 3.3 66 4 29 2.5
Australia 0.3 122.5 186.8 66 13 22 56.1
Austria 3.2 35.5 321.6 2 77 21 93.8
Azerbaijan 0.2 10.3 16.8 76 19 4 2.9
Bahrain 0.5 314.9 54.2 45 6 50 45.1
Bangladesh 0.4 38.6 17.8 88 2 10 3.0
Barbados 0.7 98.8 160.6 68 8 25 47.7
Belarus 0.1 43.4 49.0 32 32 36 31.5
Belgium 1.2 16.9 427.5 1 88 12 65.3
Belize 0.2 8.9 56.4 68 21 11 8.4
Benin 0.2 47.8 43.3 45 23 32 24.8
Bhutan 0.3 185.5 25.5 94 1 5 3.2
Bolivia (Plurinational State of) 0.2 256.2 75.7 92 2 7 9.1
Botswana 0.0 102.1 48.5 41 18 41 38.2
Brazil 0.3 34.5 53.8 55 17 28 21.2
Bulgaria 0.1 1.6 17.0 11 72 16 4.0
Burkina Faso 0.1 54.2 8.0 51 3 46 5.2
Burundi 0.2 22.4 17.5 77 6 17 4.5
Cabo Verde 0.3 417.7 386.9 93 1 6 29.4
Cambodia 0.3 85.2 43.0 94 2 4 3.5
Cameroon 0.0 71.3 43.3 76 7 17 12.3
Canada 0.4 12.1 147.6 6 80 14 30.7
Central African Republic 0.2 23.4 10.2 1 17 83 12.3
Chad 0.1 7.4 25.3 76 12 12 3.9
Chile 0.2 15.6 71.0 83 13 4 4.8
China 1.7 32.0 66.6 65 23 12 16.7
Colombia 0.6 29.1 36.1 54 19 27 15.5
Comoros 0.1 81.6 33.9 47 5 48 20.4
Congo 0.7 304.0 45.6 9 22 70 97.9
Costa Rica 0.8 40.7 45.7 57 11 32 19.7
Côte d’Ivoire 0.2 16.3 19.1 38 21 41 11.3
Croatia 7.6 85.4 55.1 1 20 79 60.4
1 P stands for “Proportion of water used by a given sector over the total use”.
1
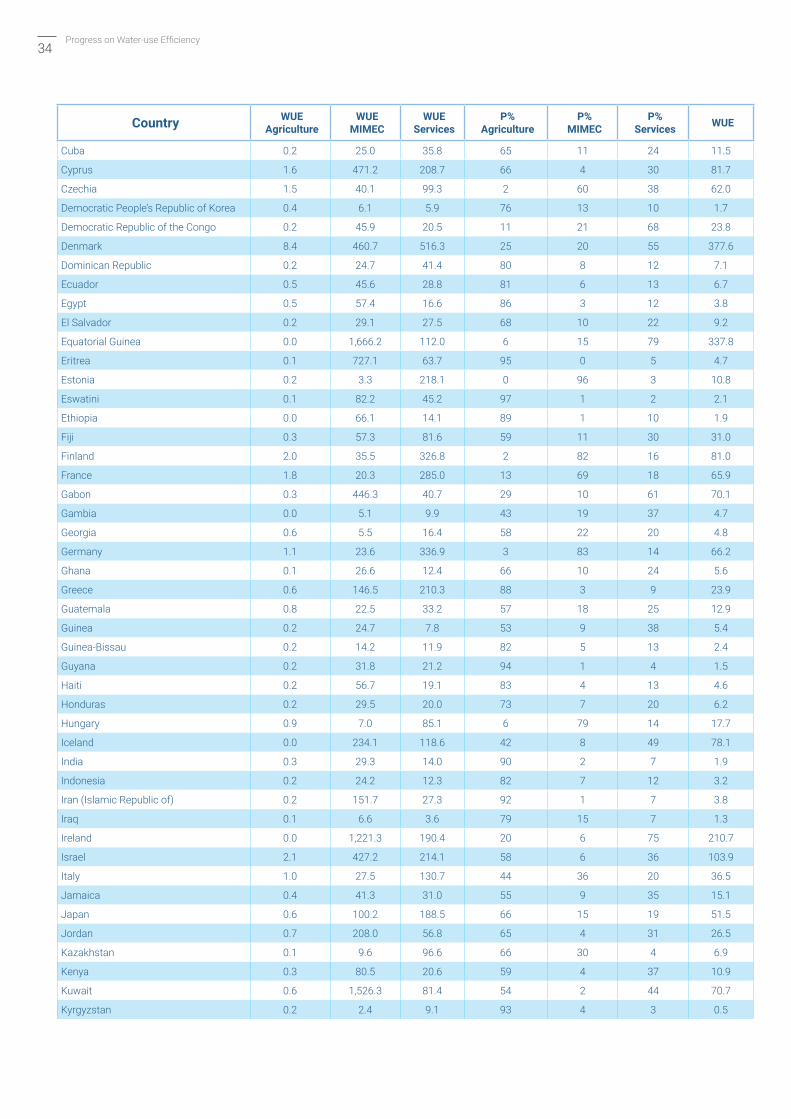
34Progress on Water-use Efficiency
Country WUE Agriculture
WUE MIMEC
WUE Services
P% Agriculture
P% MIMEC
P% Services WUE
Cuba 0.2 25.0 35.8 65 11 24 11.5
Cyprus 1.6 471.2 208.7 66 4 30 81.7
Czechia 1.5 40.1 99.3 2 60 38 62.0
Democratic People’s Republic of Korea 0.4 6.1 5.9 76 13 10 1.7
Democratic Republic of the Congo 0.2 45.9 20.5 11 21 68 23.8
Denmark 8.4 460.7 516.3 25 20 55 377.6
Dominican Republic 0.2 24.7 41.4 80 8 12 7.1
Ecuador 0.5 45.6 28.8 81 6 13 6.7
Egypt 0.5 57.4 16.6 86 3 12 3.8
El Salvador 0.2 29.1 27.5 68 10 22 9.2
Equatorial Guinea 0.0 1,666.2 112.0 6 15 79 337.8
Eritrea 0.1 727.1 63.7 95 0 5 4.7
Estonia 0.2 3.3 218.1 0 96 3 10.8
Eswatini 0.1 82.2 45.2 97 1 2 2.1
Ethiopia 0.0 66.1 14.1 89 1 10 1.9
Fiji 0.3 57.3 81.6 59 11 30 31.0
Finland 2.0 35.5 326.8 2 82 16 81.0
France 1.8 20.3 285.0 13 69 18 65.9
Gabon 0.3 446.3 40.7 29 10 61 70.1
Gambia 0.0 5.1 9.9 43 19 37 4.7
Georgia 0.6 5.5 16.4 58 22 20 4.8
Germany 1.1 23.6 336.9 3 83 14 66.2
Ghana 0.1 26.6 12.4 66 10 24 5.6
Greece 0.6 146.5 210.3 88 3 9 23.9
Guatemala 0.8 22.5 33.2 57 18 25 12.9
Guinea 0.2 24.7 7.8 53 9 38 5.4
Guinea-Bissau 0.2 14.2 11.9 82 5 13 2.4
Guyana 0.2 31.8 21.2 94 1 4 1.5
Haiti 0.2 56.7 19.1 83 4 13 4.6
Honduras 0.2 29.5 20.0 73 7 20 6.2
Hungary 0.9 7.0 85.1 6 79 14 17.7
Iceland 0.0 234.1 118.6 42 8 49 78.1
India 0.3 29.3 14.0 90 2 7 1.9
Indonesia 0.2 24.2 12.3 82 7 12 3.2
Iran (Islamic Republic of) 0.2 151.7 27.3 92 1 7 3.8
Iraq 0.1 6.6 3.6 79 15 7 1.3
Ireland 0.0 1,221.3 190.4 20 6 75 210.7
Israel 2.1 427.2 214.1 58 6 36 103.9
Italy 1.0 27.5 130.7 44 36 20 36.5
Jamaica 0.4 41.3 31.0 55 9 35 15.1
Japan 0.6 100.2 188.5 66 15 19 51.5
Jordan 0.7 208.0 56.8 65 4 31 26.5
Kazakhstan 0.1 9.6 96.6 66 30 4 6.9
Kenya 0.3 80.5 20.6 59 4 37 10.9
Kuwait 0.6 1,526.3 81.4 54 2 44 70.7
Kyrgyzstan 0.2 2.4 9.1 93 4 3 0.5
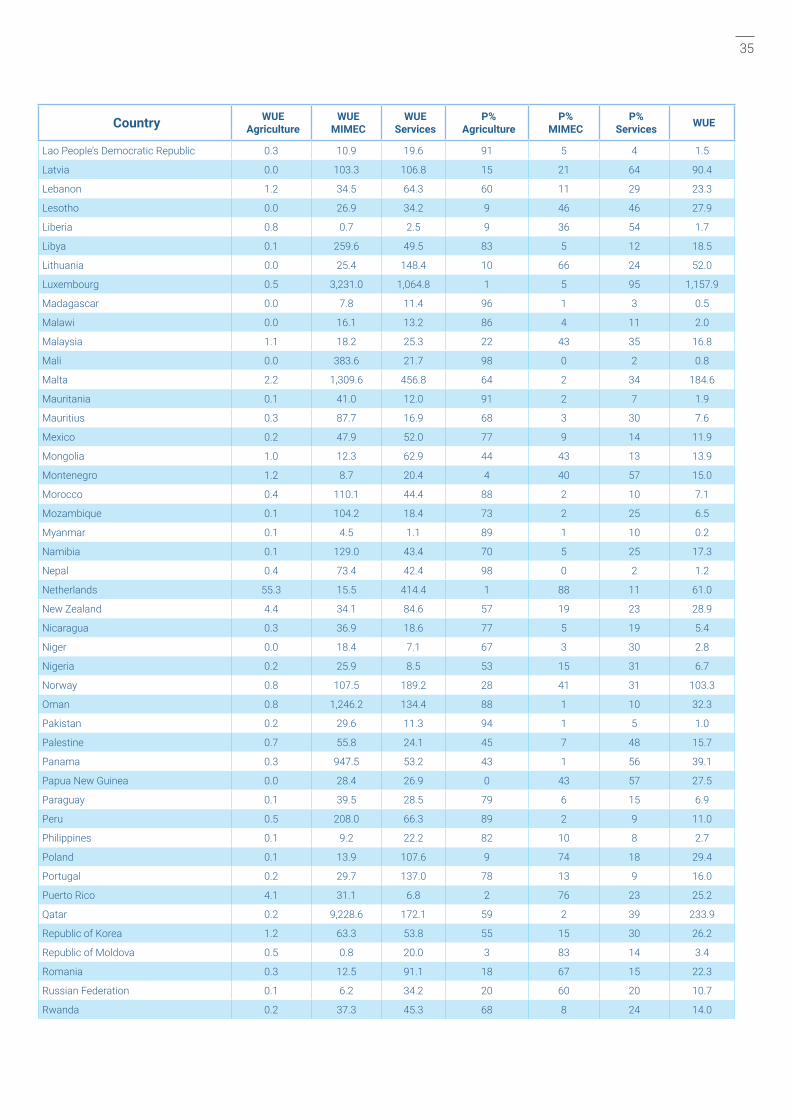
35
Country WUE Agriculture
WUE MIMEC
WUE Services
P% Agriculture
P% MIMEC
P% Services WUE
Lao People’s Democratic Republic 0.3 10.9 19.6 91 5 4 1.5
Latvia 0.0 103.3 106.8 15 21 64 90.4
Lebanon 1.2 34.5 64.3 60 11 29 23.3
Lesotho 0.0 26.9 34.2 9 46 46 27.9
Liberia 0.8 0.7 2.5 9 36 54 1.7
Libya 0.1 259.6 49.5 83 5 12 18.5
Lithuania 0.0 25.4 148.4 10 66 24 52.0
Luxembourg 0.5 3,231.0 1,064.8 1 5 95 1,157.9
Madagascar 0.0 7.8 11.4 96 1 3 0.5
Malawi 0.0 16.1 13.2 86 4 11 2.0
Malaysia 1.1 18.2 25.3 22 43 35 16.8
Mali 0.0 383.6 21.7 98 0 2 0.8
Malta 2.2 1,309.6 456.8 64 2 34 184.6
Mauritania 0.1 41.0 12.0 91 2 7 1.9
Mauritius 0.3 87.7 16.9 68 3 30 7.6
Mexico 0.2 47.9 52.0 77 9 14 11.9
Mongolia 1.0 12.3 62.9 44 43 13 13.9
Montenegro 1.2 8.7 20.4 4 40 57 15.0
Morocco 0.4 110.1 44.4 88 2 10 7.1
Mozambique 0.1 104.2 18.4 73 2 25 6.5
Myanmar 0.1 4.5 1.1 89 1 10 0.2
Namibia 0.1 129.0 43.4 70 5 25 17.3
Nepal 0.4 73.4 42.4 98 0 2 1.2
Netherlands 55.3 15.5 414.4 1 88 11 61.0
New Zealand 4.4 34.1 84.6 57 19 23 28.9
Nicaragua 0.3 36.9 18.6 77 5 19 5.4
Niger 0.0 18.4 7.1 67 3 30 2.8
Nigeria 0.2 25.9 8.5 53 15 31 6.7
Norway 0.8 107.5 189.2 28 41 31 103.3
Oman 0.8 1,246.2 134.4 88 1 10 32.3
Pakistan 0.2 29.6 11.3 94 1 5 1.0
Palestine 0.7 55.8 24.1 45 7 48 15.7
Panama 0.3 947.5 53.2 43 1 56 39.1
Papua New Guinea 0.0 28.4 26.9 0 43 57 27.5
Paraguay 0.1 39.5 28.5 79 6 15 6.9
Peru 0.5 208.0 66.3 89 2 9 11.0
Philippines 0.1 9.2 22.2 82 10 8 2.7
Poland 0.1 13.9 107.6 9 74 18 29.4
Portugal 0.2 29.7 137.0 78 13 9 16.0
Puerto Rico 4.1 31.1 6.8 2 76 23 25.2
Qatar 0.2 9,228.6 172.1 59 2 39 233.9
Republic of Korea 1.2 63.3 53.8 55 15 30 26.2
Republic of Moldova 0.5 0.8 20.0 3 83 14 3.4
Romania 0.3 12.5 91.1 18 67 15 22.3
Russian Federation 0.1 6.2 34.2 20 60 20 10.7
Rwanda 0.2 37.3 45.3 68 8 24 14.0
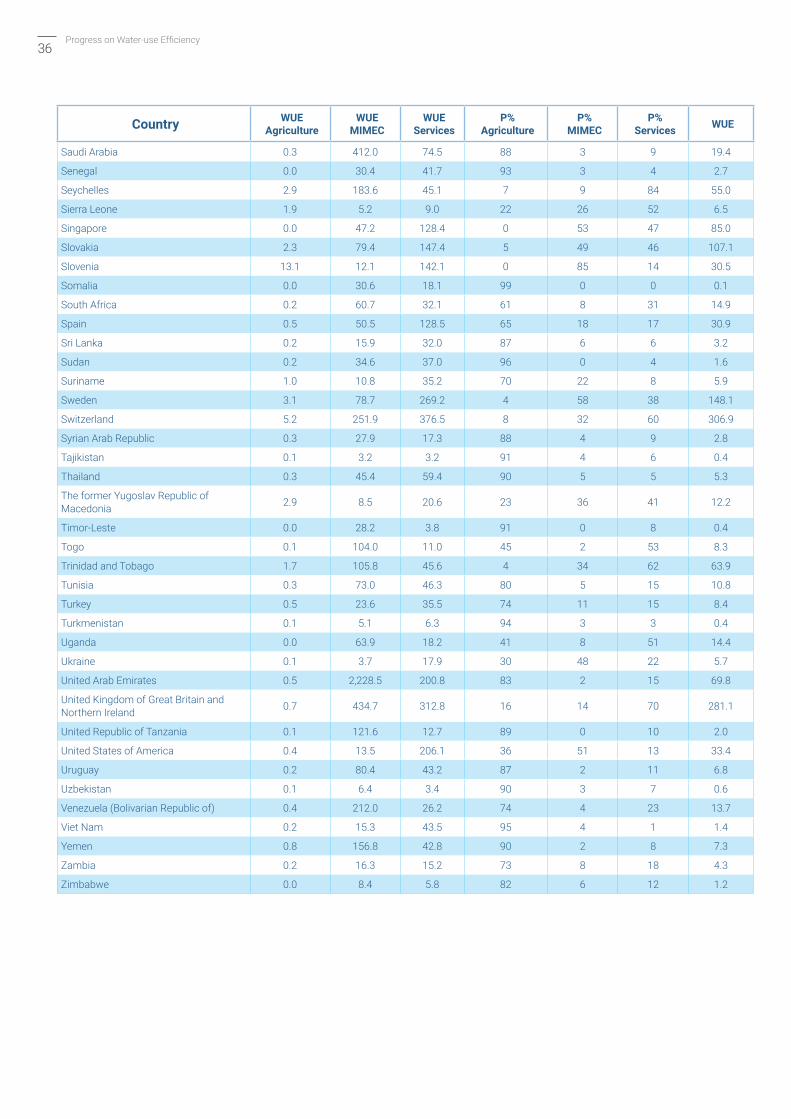
36Progress on Water-use Efficiency
Country WUE Agriculture
WUE MIMEC
WUE Services
P% Agriculture
P% MIMEC
P% Services WUE
Saudi Arabia 0.3 412.0 74.5 88 3 9 19.4
Senegal 0.0 30.4 41.7 93 3 4 2.7
Seychelles 2.9 183.6 45.1 7 9 84 55.0
Sierra Leone 1.9 5.2 9.0 22 26 52 6.5
Singapore 0.0 47.2 128.4 0 53 47 85.0
Slovakia 2.3 79.4 147.4 5 49 46 107.1
Slovenia 13.1 12.1 142.1 0 85 14 30.5
Somalia 0.0 30.6 18.1 99 0 0 0.1
South Africa 0.2 60.7 32.1 61 8 31 14.9
Spain 0.5 50.5 128.5 65 18 17 30.9
Sri Lanka 0.2 15.9 32.0 87 6 6 3.2
Sudan 0.2 34.6 37.0 96 0 4 1.6
Suriname 1.0 10.8 35.2 70 22 8 5.9
Sweden 3.1 78.7 269.2 4 58 38 148.1
Switzerland 5.2 251.9 376.5 8 32 60 306.9
Syrian Arab Republic 0.3 27.9 17.3 88 4 9 2.8
Tajikistan 0.1 3.2 3.2 91 4 6 0.4
Thailand 0.3 45.4 59.4 90 5 5 5.3
The former Yugoslav Republic of Macedonia 2.9 8.5 20.6 23 36 41 12.2
Timor-Leste 0.0 28.2 3.8 91 0 8 0.4
Togo 0.1 104.0 11.0 45 2 53 8.3
Trinidad and Tobago 1.7 105.8 45.6 4 34 62 63.9
Tunisia 0.3 73.0 46.3 80 5 15 10.8
Turkey 0.5 23.6 35.5 74 11 15 8.4
Turkmenistan 0.1 5.1 6.3 94 3 3 0.4
Uganda 0.0 63.9 18.2 41 8 51 14.4
Ukraine 0.1 3.7 17.9 30 48 22 5.7
United Arab Emirates 0.5 2,228.5 200.8 83 2 15 69.8
United Kingdom of Great Britain and Northern Ireland 0.7 434.7 312.8 16 14 70 281.1
United Republic of Tanzania 0.1 121.6 12.7 89 0 10 2.0
United States of America 0.4 13.5 206.1 36 51 13 33.4
Uruguay 0.2 80.4 43.2 87 2 11 6.8
Uzbekistan 0.1 6.4 3.4 90 3 7 0.6
Venezuela (Bolivarian Republic of) 0.4 212.0 26.2 74 4 23 13.7
Viet Nam 0.2 15.3 43.5 95 4 1 1.4
Yemen 0.8 156.8 42.8 90 2 8 7.3
Zambia 0.2 16.3 15.2 73 8 18 4.3
Zimbabwe 0.0 8.4 5.8 82 6 12 1.2
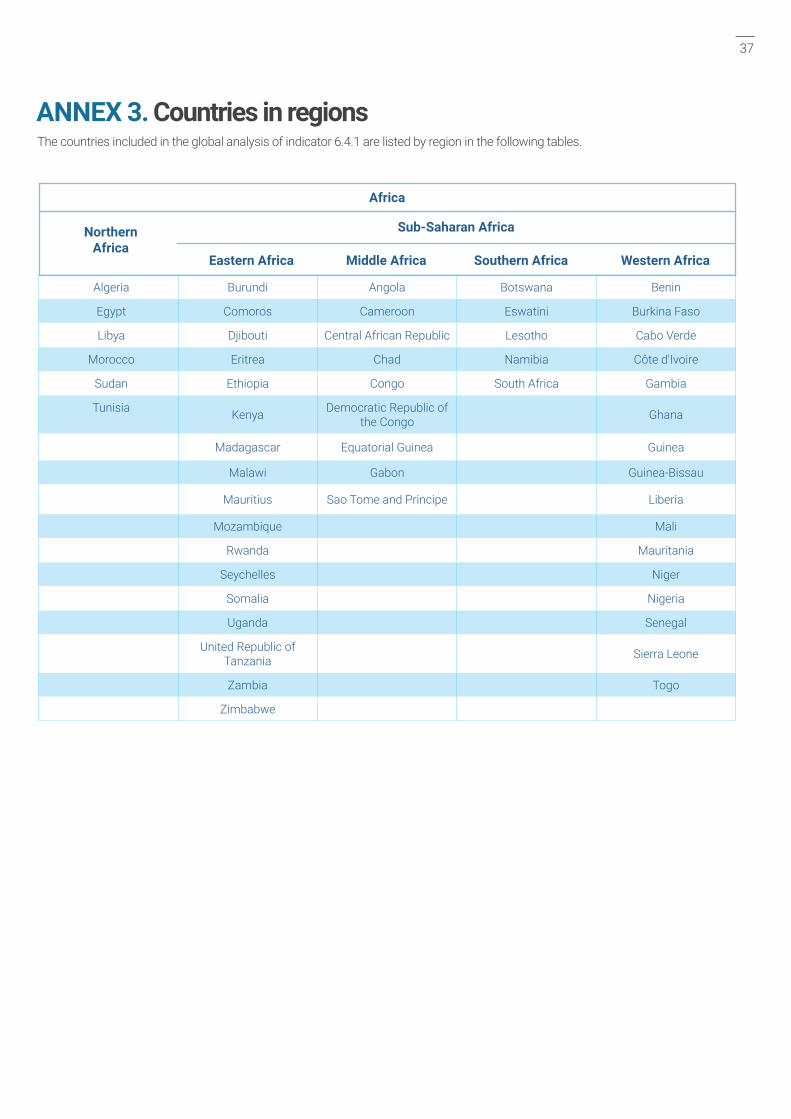
37
Algeria Burundi Angola Botswana Benin
Egypt Comoros Cameroon Eswatini Burkina Faso
Libya Djibouti Central African Republic Lesotho Cabo Verde
Morocco Eritrea Chad Namibia Côte d'Ivoire
Sudan Ethiopia Congo South Africa Gambia
Tunisia Kenya Democratic Republic of the Congo Ghana
Madagascar Equatorial Guinea Guinea
Malawi Gabon Guinea-Bissau
Mauritius Sao Tome and Principe Liberia
Mozambique Mali
Rwanda Mauritania
Seychelles Niger
Somalia Nigeria
Uganda Senegal
United Republic of Tanzania Sierra Leone
Zambia Togo
Zimbabwe
Northern Africa
Africa
Sub-Saharan Africa
Eastern Africa Middle Africa Western AfricaSouthern Africa
ANNEX 3. Countries in regionsThe countries included in the global analysis of indicator 6.4.1 are listed by region in the following tables.

38Progress on Water-use Efficiency
Canada Antigua and Barbuda Belize Argentina
United States of America Bahamas Costa Rica Bolivia (Plurinational
State of)
Barbados El Salvador Brazil
Cuba Guatemala Chile
Dominica Honduras Colombia
Dominican Republic Mexico Ecuador
Grenada Nicaragua Guyana
Haiti Panama Paraguay
Jamaica Peru
Puerto Rico Suriname
Saint Kitts and Nevis Uruguay
Saint Lucia Venezuela (Bolivarian Republic of)
Saint Vincent and the Grenadines
Trinidad and Tobago
Northern America
Americas
Latin America and the Caribbean
Caribbean Central America South America
Belarus Denmark Albania Austria
Bulgaria Estonia Andorra Belgium
Czechia Finland Bosnia and Herzegovina France
Hungary Iceland Croatia Germany
Poland Ireland Greece Luxembourg
Republic of Moldova Latvia Italy Monaco
Romania Lithuania Malta Netherlands
Russian Federation Norway Montenegro Switzerland
Slovakia Sweden Portugal
UkraineUnited Kingdom of Great
Britain and Northern Ireland
San Marino
Serbia
Slovenia
Spain
The former Yugoslav Republic of Macedonia
NorthernEurope
EasternEurope
WesternEurope
SouthernEurope
Europe

39
Kazakhstan China Brunei Darussalam Afghanistan Armenia
Kyrgyzstan Democratic People's Republic of Korea Cambodia Bangladesh Azerbaijan
Tajikistan Japan Indonesia Bhutan Bahrain
Turkmenistan Mongolia Lao People's Democratic Republic India Cyprus
Uzbekistan Republic of Korea Malaysia Iran (Islamic Republic of) Georgia
Myanmar Maldives Iraq
Philippines Nepal Israel
Singapore Pakistan Jordan
Thailand Sri Lanka Kuwait
Timor-Leste Lebanon
Viet Nam Palestine
Oman
Qatar
Saudi Arabia
Syrian Arab Republic
Turkey
United Arab Emirates
Yemen
CentralAsia
EasternAsia
SouthernAsia
South-EasternAsia
WesternAsia
Asia
Australia Fiji Kiribati Cook Islands
New Zealand Papua New Guinea Marshall Islands Niue
Solomon Islands Micronesia (Federal States of) Samoa
Vanuatu Nauru Tonga
Palau Tuvalu
Australia and New Zealand Melanesia Micronesia Polynesia
Oceania

40Progress on Water-use Efficiency
ANNEX 4. International Standard Industrial Classification of All Economic Activities (ISIC), Rev. 4
ISIC Activity Va Wa Vm Wm Vs Ws
A – Agriculture, forestry and fishing
01 – Crop and animal production, hunting and related ser-vice activities
02 – Forestry and logging – –
03(1) – Fishing – –
03(2) – Aquaculture
B (05–09) – Mining and quarryingC (10–33) – ManufacturingD (35) – Electricity, gas, steam and air conditioning supply
E – Water supply; sewerage, waste management and remediation activities
36 – Water collection, treatment and supply
37 – Sewerage38 – Waste collection, treatment and disposal activities;
materials recovery39 – Remediation activities and other waste management
services
–
F (41–43) – Construction
G (45–47) – Wholesale and retail trade; repair of motor vehicles and motorcycles
H (49–53) – Transportation and storageI (55–56) – Accommodation and food service activitiesJ (58–63) – Information and communicationK (64–66) – Financial and insurance activitiesL (68) – Real estate activitiesM (69–75) – Professional, scientific and technical activitiesN (77–82) – Administrative and support service activitiesO (84) – Public administration and defence; compulsory
social securityP (85) – EducationQ (86–88) – Human health and social work activitiesR (90–93) – Arts, entertainment and recreationS (94–96) – Other service activitiesT (97–98) – Activities of households as employers;
undifferentiated goods- and services-producing activities of households for own use
–
U (99) – Activities of extraterritorial organizations and bodies – – – – – –


42Progress on Water-use Efficiency
SDG 6 expands the MDG focus on drinking water and basic sanitation to include the more holistic management of water, wastewater and ecosystem resources, acknowledging the importance of an enabling environment. Bringing these aspects together is an initial step towards addressing sector fragmentation and enabling coherent and sustainable management. It is also a major step towards a sustainable water future.
The monitoring of progress towards SDG 6 is a means to making this happen. High-quality data help policy- and decision makers at all levels of government to identify challenges and opportunities, to set priorities for more effective and efficient implementation, to communicate progress and ensure accountability, and to generate political, public and private sector support for further investment.
In 2016–2018, following the adoption of the global indicator framework, the UN-Water Integrated Monitoring Initiative focused on establishing the global baseline for all SDG 6 global indicators, which is essential for effective follow-up and review of progress towards SDG 6. Below is an overview of the resultant indicator reports produced in 2017–2018. UN-Water has also produced the SDG 6 Synthesis Report 2018 on Water and Sanitation, which, building on baseline data, addresses the cross-cutting nature of water and sanitation and the many interlinkages within SDG 6 and across the 2030 Agenda, and discusses ways to accelerate progress towards SDG 6.
Progress on Drinking Water, Sanitation and Hygiene – 2017 Update and SDG Baselines (including data on SDG indicators 6.1.1 and 6.2.1)
By WHO and UNICEF
One of the most important uses of water is for drinking and hygiene purposes. A safely managed sanitation chain is essential to protecting the health of individuals and communities and the environment. By monitoring use of drinking water and sanitation services, policy- and decision makers can find out who has access to safe water and a toilet with handwashing facilities at home, and who requires it. Learn more about the baseline situation for SDG indicators 6.1.1 and 6.2.1 here: http://www.unwater.org/publication_categories/whounicef-joint-monitoring-programme-for-water-supply-sanitation-hygiene-jmp/.
Progress on Safe Treatment and Use of Wastewater – Piloting the monitoring methodology and initial findings for SDG indicator 6.3.1
By WHO and UN-Habitat on behalf of UN-Water
Leaking latrines and raw wastewater can spread disease and provide a breeding ground for mosquitoes, as well as pollute groundwater and surface water. Learn more about wastewater monitoring and initial status findings here: http://www.unwater.org/publications/progress-on-wastewater-treatment-631.
Progress on Ambient Water Quality – Piloting the monitoring methodology and initial findings for SDG indicator 6.3.2
By UN Environment on behalf of UN-Water
Good ambient water quality ensures the continued availability of important freshwater ecosystem services and does not negatively affect human health. Untreated wastewater from domestic sources, industry and agriculture can be detrimental to ambient water quality. Regular monitoring of freshwaters allows for the timely response to potential sources of pollution and enables stricter enforcement of laws and discharge permits. Learn more about water quality monitoring and initial status findings here: http://www.unwater.org/publications/progress-on-ambient-water-quality-632.
Progress on Water-Use Efficiency – Global baseline for SDG indicator 6.4.1
By FAO on behalf of UN-Water
Freshwater is used by all sectors of society, with agriculture being the biggest user overall. The global indicator on water-use efficiency tracks to what extent a country’s economic growth is dependent on the use of water resources, and enables policy- and decision makers to target interventions at sectors with high water use and low levels of improved efficiency over time. Learn more about the baseline situation for SDG indicator 6.4.1 here: http://www.unwater.org/publications/progress-on-water-use-efficiency-641.
LEARN MORE ABOUT PROGRESS TOWARDS SDG 6

43
Progress on Level of Water Stress – Global baseline for SDG indicator 6.4.2
By FAO on behalf of UN-Water
A high level of water stress can have negative effects on economic development, increasing competition and potential conflict among users. This calls for effective supply and demand management policies. Securing environmental water requirements is essential to maintaining ecosystem health and resilience. Learn more about the baseline situation for SDG indicator 6.4.2 here: http://www.unwater.org/publications/progress-on-level-of-water-stress-642.
Progress on Integrated Water Resources Management – Global baseline for SDG indicator 6.5.1
By UN Environment on behalf of UN-Water
Integrated water resources management (IWRM) is about balancing the water requirements of society, the economy and the environment. The monitoring of 6.5.1 calls for a participatory approach in which representatives from different sectors and regions are brought together to discuss and validate the questionnaire responses, paving the way for coordination and collaboration beyond monitoring. Learn more about the baseline situation for SDG indicator 6.5.1 here:http://www.unwater.org/publications/progress-on-integrated-water-resources-management-651.
Progress on Transboundary Water Cooperation – Global baseline for SDG indicator 6.5.2
By UNECE and UNESCO on behalf of UN-Water
Most of the world’s water resources are shared between countries; where the development and management of water resources has an impact across transboundary basins, cooperation is required. Specific agreements or other arrangements between co-riparian countries are a precondition to ensuring sustainable cooperation. SDG indicator 6.5.2 measures cooperation on both transboundary river and lake basins, and transboundary aquifers. Learn more about the baseline situation for SDG indicator 6.5.2 here: http://www.unwater.org/publications/progress-on-transboundary-water-cooperation-652.
Progress on Water-related Ecosystems – Piloting the monitoring methodology and initial findings for SDG indicator 6.6.1
By UN Environment on behalf of UN-Water
Ecosystems replenish and purify water resources and need to be protected to safeguard human and environmental resilience. Ecosystem monitoring, including that of ecosystem health, highlights the need to protect and conserve ecosystems and enables policy- and decision makers to set de facto management objectives. Learn more about ecosystem monitoring and initial status findings here: http://www.unwater.org/publications/progress-on-water-related- ecosystems-661.
UN-Water Global Analysis and Assessment of Sanitation and Drinking-Water (GLAAS) 2017 report – Financing universal water, sanitation and hygiene under the Sustainable Development Goals (including data on SDG indicators 6.a.1 and 6.b.1)
By WHO on behalf of UN-Water
Human and financial resources are needed to implement SDG 6, and international cooperation is essential to making it happen. Defining the procedures for local communities to participate in water and sanitation planning, policy, law and management is vital to ensuring that the needs of everyone in the community are met, and to ensuring the long-term sustainability of water and sanitation solutions. Learn more about the monitoring of international cooperation and stakeholder participation here: http://www.unwater.org/publication_categories/glaas/.
SDG 6 Synthesis Report 2018 on Water and Sanitation
By UN-Water
This first synthesis report on SDG 6 seeks to inform discussions among Member States during the High-level Political Forum on Sustainable Development in July 2018. It is an in-depth review and includes data on the global baseline status of SDG 6, the current situation and trends at the global and regional levels, and what more needs to be done to achieve this goal by 2030. Read the report here: http://www.unwater.org/publication_categories/sdg-6-synthesis-report-2018-on-water-and-sanitation/.

UN-Water coordinates the efforts of United Nations entities and international organizations working on water and sanitation issues. By doing so, UN-Water seeks to increase the effectiveness of the support provided to Member States in their efforts towards achieving international agreements on water and sanitation. UN-Water publications draw on the experience and expertise of UN-Water’s Members and Partners.
PERIODIC REPORTS
UN-WATER REPORTS
Sustainable Development Goal 6 Synthesis Report 2018 on Water and Sanitation
The SDG 6 Synthesis Report 2018 on Water and Sanitation was published in June 2018 ahead of the High-level Political Forum on Sustainable Development, where Member States reviewed SDG 6 in depth. Representing a joint position from the United Nations family, the report offers guidance to understanding global progress on SDG 6 and its interdependencies with other goals and targets. It also provides insight into how countries can plan and act to ensure that no one is left behind when implementing the 2030 Agenda for Sustainable Development.
Sustainable Development Goal 6 Indicator Reports
This series of reports shows the progress towards targets set out in SDG 6 using the SDG global indicators. The reports are based on country data, compiled and verified by the United Nations organizations serving as custodians of each indicator. The reports show progress on drinking water, sanitation and hygiene (WHO/UNICEF Joint Monitoring Programme for Water Supply, Sanitation and Hygiene for targets 6.1 and 6.2), wastewater treatment and ambient water quality (UN Environment, UN-Habitat and WHO for target 6.3), water-use efficiency and level of water stress (FAO for target 6.4), integrated water resources management and transboundary water cooperation (UN Environment, UNECE and UNESCO for target 6.5), ecosystems (UN Environment for target 6.6) and means for implementing SDG 6 (UN-Water Global Analysis and Assessment of Sanitation and Drinking-Water for targets 6.a and 6.b).
World Water Development Report
This annual report, published by UNESCO on behalf of UN-Water, represents the coherent and integrated response of the United Nations system to freshwater-related issues and emerging challenges. The theme of the report is harmonized with the theme of World Water Day (22 March) and changes annually.
Policy and Analytical Briefs
UN-Water’s Policy Briefs provide short and informative policy guidance on the most pressing freshwater-related issues, which draw upon the combined expertise of the United Nations system. Analytical Briefs provide an analysis of emerging issues and may serve as a basis for further research, discussion and future policy guidance.
UN-WATER PLANNED PUBLICATIONS 2018
• Update of UN-Water Policy Brief on Water and Climate Change
• UN-Water Policy Brief on the Water Conventions
• UN-Water Analytical Brief on Water Efficiency
More information on UN-Water Reports at www.unwater.org/publications

Few countries have the natural and financial resources to further enhance water supplies for human use. The alternative is to use the available resources more efficiently. The global indicator on water-use efficiency tracks to what extent a country’s economic growth is dependent on the use of water resources, and enables policy- and decision makers to target interventions at sectors with high water use and low levels of improved efficiency over time.
This indicator addresses the economic component of target 6.4. In this report, you can learn more about the baseline situation for water-use efficiency. More information and metrological guidance can be found at: http://www.fao.org/sustainable-development-goals/indicators/641/
This report is part of a series that tracks progress towards the various targets set out in SDG 6 using the SDG global indicators. To learn more about water and sanitation in the 2030 Agenda for Sustainable Development, and the Integrated Monitoring Initiative for SDG 6, visit our website: www.sdg6monitoring.org
CA1588EN/1/10.18
ISBN 978-92-5-130987-2
9 7 8 9 2 5 1 3 0 9 8 7 2