progress made opportunities ahead - mtaweb.mta.info/mta/investor/pdf/2003_annual_report.pdf ·...
TRANSCRIPT

Progress Made
Opportunities Ahead
2003 Annual ReportComprehensive Annual Financial Report for the YearEnded December 31, 2003

Most major construction supporting the restoration of full four-track subway service over the Manhattan Bridge was completed in 2003.

1
Contents
On the Cover (clockwise from top left):
The reconstruction of Stillwell Avenue neared completionin 2003.
The new link between AirTrain and the subway was com-pleted at the Howard Beach/JFK station.
Rendering shows the main concourse at the proposedFulton Street Transit Center.
The MTAMessage from the Chairman 2
Message from the Executive Director 4
MTA Leadership 6
2003 Consolidated Financial Highlights 8
Capital Program Progress 9
Financial Performance: 10 – 13
Revenue • Budget • Finance • Insurance
Operations • Real Estate and Advertising
Operations: 14 – 25
Capital Program • Ridership
Customer Satisfaction • Personal Security
Safety • Preparedness • Environment
People With Disabilities • MTA Arts For Transit
Transit Museum • Customer E-mail • Blackout
The MTA AgenciesMTA New York City Transit 26
MTA Long Island Rail Road 30
MTA Long Island Bus 32
MTA Metro-North Railroad 34
MTA Bridges and Tunnels 36
MTA Capital Construction 38
Comprehensive Annual Financial ReportIntroductory Section
Letter of Transmittal 1
Certificate of Achievement
for Excellence in Financial Reporting 8
MTA Organizational Structure 9
Financial Section
Independent Auditors’ Report 13
Management’s Discussion and Analysis 14
Consolidated Financial Statements for the
Years Ended December 31, 2003 and 2002 24
Statistical Section
10-Year Statistical Tables 70
2003 Operating Statistics 74

2
Three expansion projects — the first in over sixdecades — will make the region’s transportationarteries flow again. East Side Access (ESA) and theSecond Avenue Subway will provide additional serv-ice to hundreds of thousands of riders each day,relieving congestion and delays, and serving as the catalyst for growth. These projects are also progressing at a good pace. Construction continueson ESA as we have completed the Highbridge Yardand are nearing completion of the Arch Street Yard;the 7 Line Extension, which we expect will be fullyfunded by the City of New York, is targeted to getunderway in 2005. The Federal Transit Administration signed off on thedraft environmental impact statement for theSecond Avenue Subway in April 2004; the nextsteps are to obtain a Record of Decision and beginfinal design, after which construction will begin insegments. The environmental document for the 7 Line Extension is substantially complete, and con-struction will begin in 2005. A revitalized downtown Manhattan, long recognizedas another key building block of our city’s futureprosperity, became a central priority for the cityand the region after 9/11. I am proud that the MTAhas made a good, fast start toward two projectsthat will drive the revitalization. The current FultonStreet station is a maze of lines and passagewaysthat have bedeviled our customers for decades withdelays and confusion. The obsolete South Ferry station is a cause of inefficiency and delay alongthe entire 1/9 line. We will finally untangle thesebottlenecks. Even before designs were complete,federal funding was approved for the $1.15 billioncost of these two projects. Final approval for theenvironmental assessment and design is targetedfor early 2004 and completion for 2007.To ensure efficiency and cost-effectiveness, we havecreated a new agency, MTA Capital Construction,and consolidated in it all management of the down-town revitalization and the expansion projects. Itsexperienced staff has already been instrumental insecuring the federal funding for the downtown projects, and its planners have developed a programthat will save $100 million in the construction ofEast Side Access.
Last year was a pivotal year for theMTA. We pursued projects that arecrucial for the continued growth andeconomic health of the city and the metropolitan region and made substantial progress on them. We arenow poised to reshape the system tomeet the region’s long-deferred needs,prepare it to serve the enormous population expansion of the comingdecades, and foster long-term productivity and prosperity.
Message from the Chairman April 22, 2004

3
Peter S. KalikowChairman
The past year has been full of tangible achieve-ments, including: the roadway deck rehabilitation ofthe Triborough Bridge; the many station renovationsin the subway and on commuter rail lines, especiallythe renovation of the historic interior of the Yonkersstation; the delivery of hundreds of new M-7 cars toMTA Long Island Rail Road and MTA Metro-NorthRailroad. And I am pleased that at the beginning of2004, for the first time in almost 20 years, werestored four-track service to the Manhattan Bridge.Some 600,000 riders will benefit from the shorterrides, reduced crowding, fewer transfers, andimprovements we put into the lines that serve them.This, along with our achievements in 2003 and ourprogress and momentum on the expansion and revital-ization projects, all come as we approach the centennial of the subways in October of 2004. It willbe a bright beginning for the new subway century andfor the future of our public transportation system.To shape that future in ways that will further ensureour region’s economic prosperity, we are developingour 2005-2009 Capital Program. It will build on thehard-won successes of previous plans and identifyneeds, at least as large as those in the current program, for state of good repair, normal replace-ment, and system expansion — and every bit of it isessential to our system and the region’s economy. We cannot afford to lose the momentum of ourprogress and achievement. In the 1980s, after athree-and-a-half decade decline — brought on ingreat part by fares that were kept artificially andunrealistically low while indispensable repair andmaintenance work was deferred because funds werelacking — a third of the subway fleet was typicallyout of service during the morning rush hours, cars
broke down or caught fire, trains derailed on haz-ardous track, and graffiti covered virtually every car.Our commuter terminals suffered similar problems.Our five Capital Programs brought the MTA networkback from the brink of collapse and made consistentprogress in modernizing it. That work has nowbrought us to the threshold of great opportunities.We must continue to maintain the system whilebuilding the missing links, the expansion projectsthat will unclog our public transportation lines andrelieve traffic, enabling our network to serve a metro-politan population that is forecast to grow 1.0 percent a year through 2025. That huge growth inthe labor force can produce an economic renaissancefor our region — but only with a modern, seamlessweb of public transportation to connect it to jobs.We are working closely with Governor George E.Pataki, the New York delegation, Congressional lead-ers, and the Administration to increase federal fundsfor the new Capital Program. Currently the MTAreceives $750 million annually for its Capital Programfrom TEA-21, which is up for reauthorization. We alsomust ensure local and state support for the MTA’snext Capital Program. We will therefore seek financialassistance from governmental funding partners andmake the needs of our public transportation systemknown to leaders in business, government, and civicassociations. We will enlist their support to maintainand grow the MTA’s share of federal funds in the reauthorization of TEA-21 and to seek New Startsfunding for East Side Access and the Second AvenueSubway. Their support, and the commitment of thepeople of the New York region, will enable us totransform the opportunities we envision into transportation infrastructure that delivers prosperity.

Despite these difficulties, our customers continuedto give us a vote of confidence by riding our systemover 2.3 billion times to jobs, homes, and recre-ation, defying dire predictions of a significant drop-off in ridership from the fare increases and a softeconomy. Like most New Yorkers — famous for notwanting to pay retail — they clearly understoodthey get not only good value for their money, but agood deal with the deeper discounts we offered onMetroCard weekly and monthly passes.The fact is, the cost of an average subway or busride today is only $1.26 — a 40 percent discountfrom the $2.00 base fare and an amount that’s evenless than the $1.38 average fare in 1996, beforebeing adjusted for inflation. And for our customerswho are part of a federal tax benefit program thatwe have actively promoted, the average fare can befurther reduced to 84 cents.But we did even more in 2003 to take the edge offthe increase, lowering the “buy-in” level for thosepurchasing our multi-ride discount MetroCard from$15 to $10 and doubling the discount to 20 percentby providing six subway or bus rides for the price offive. And with the new MetroCard “BalanceProtection” program, MetroCard users who purchasea 30-day discount card for $70 using a debit orcredit card at our MetroCard Vending Machines wereautomatically protected from loss or theft. BalanceProtection provides riders with a refund for theunused value on their monthly pass from the daythey first report a lost card by automatically crediting the cardholder’s account.These fare discounts and special programs have nodoubt contributed to the consistently high ratingsour customers give us, but so has the condition ofour system. In 2003, our surveys showed that customer satisfaction with subway service and thestation environment was a full 10 percent betterthan it was eight years ago, suggesting we’re on the right track.Critical performance indicators such as our “MeanDistance Between Failure” (MDBF) ratings improvedsignificantly in 2003. MDBF increased as a result ofbetter and smarter management and maintenanceand the impact of ongoing investments in state ofgood repair and new rolling stock. Subway MDBFshot up from 116,063 miles in October 2002 to
4
By any standard, 2003 was a challenging year for the MTA. Fromhaving just averted a potentially crippling transit strike at the end of2002 and confronting the need forfare and toll increases early in theyear, to dealing with the largest blackout in the nation’s history bymid-year, there was no shortage ofcritical issues facing us each day.
Message from the Executive Director April 22, 2004

5
145,644 in October 2003. Bus MDBF went from3,443 miles to 3,752 miles.Those efforts were solidly backstopped by theinvestments from our $19.1 billion five-year CapitalProgram, which allowed us to continue to replacesubway cars, buses, rail coaches, and track beds on schedule.We also aggressively moved forward with our agendaof system expansion projects. Second AvenueSubway’s Environmental Impact Statement (EIS) wascompleted and submitted to the Federal TransitAdministration (FTA). With FTA approval, we expectto progress to initial construction by the end of thisyear. Two critical post-9/11 projects in LowerManhattan — the Fulton Street Transit Center andthe South Ferry Terminal — were advanced, both ofwhich will improve transit services into and out ofdowntown and will improve the economic viability ofthe nation’s third largest business district.In 2003 we also made many positive changes in the way we do business internally. We incorporatedrecommendations from nationally renowned corpo-rate governance expert, Ira Millstein, enhancing the way the MTA Board and executive staff manage,and becoming one of the first public agencies in the nation to embrace such an improved governance model.On a parallel track, a number of improvements toour short- and long-term budgeting and reportingprocess were implemented to allow for more efficient ways to manage our $8 billion-a-year enterprise. First, we adopted a new procedure torelease our next year’s preliminary budget in July —five months sooner than before — to allow publicaccess to and discourse on the budget before formaladoption by the Board in December. Second, we nowissue a four-year Financial Plan forecasting the state of MTA finances.Under our new procedures, we went through a verypublic process that culminated in the adoption of a2004 budget by the MTA Board in December thatincludes total operating expenses of $8 billion andproduces a $36 million year-end cash balance, inaddition to the savings with a value of over $250million. The budget is built on conservativeassumptions that will hold throughout 2004.Beyond 2004, our four-year financial forecast now
projects gaps of $539 million in 2005, $1.2 billionin 2006, and $1.3 billion in 2007. Like state andlocal governments around the nation, these gaps represent structural imbalances stemming primarilyfrom rising debt service, increasing pension, health and welfare expenses, and depletion of non-recurring resources.*In addition to the challenges presented to the operating budget, we are also putting together ournext five-year Capital Program (2005-2009), whichwill identify state of good repair, normal replace-ment, and system expansion needs. This will presentus with another set of financial challenges in termsof securing funding from our federal, state, andlocal partners.But as we work through those funding issues, weare committed to explore all avenues and take asmany steps as we can on our own. We’ve met withbusiness leaders throughout the region to get their advice on how to further fine-tune ourfinances. And we continue to maximize the benefitsof our existing real estate and advertising-relatedrevenue while continuing to reduce non-operating-related expenses.Finally, 2004 marks the 100th Anniversary of theNew York City subway system. It was the subwaythat took a New York that was choking on conges-tion and set in motion a dynamic that transformedit into a world-class economic powerhouse. Itshealth, as well as the health of all parts of ourregional transportation system, is as critically impor-tant to New York and the nation a century later. Wecan only hope that as we approach this importantmilestone in our history, we will have the samevision, insight, support, and resources to carry usinto the next century.
Katherine N. LappExecutive Director
*To supplement this annual report, a CD-ROM containing a PDF copy ofthe MTA-Wide February Financial Plan, which includes 2004-2007 budgetprojections and 2004 agency financial plans and budgets, has beeninserted on the inside back cover.

MTA Board
6
MTA Leadership
Peter S. Kalikow,Chairman
David S. Mack,Vice Chairman
Edward B. Dunn,Vice Chairman
Andrew B.Albert
Nancy ShevellBlakeman
James F. Blair Anthony J.Bottalico
Thomas J.Cassano
Barry L.Feinstein
Lawrence W.Gamache
James H.Harding Jr.
Susan L.Kupferman
Mark D. Lebow James L.McGovern
Mark Page
Ernest J.Salerno
Andrew M. Saul James L.Sedore Jr.
James S.Simpson
Edward A.Vrooman
Alfred E.Werner

Agency Presidents
MTA Management
(left to right) Thomas J. Savage, Chief Operating Officer; Stephen L. Kessler, Chief Financial Officer*
Maureen E. Boll, Corporate Secretary and Chief of Staff; Christopher P. Boylan, Deputy Executive Director,Corporate and Community Affairs; Linda G. Kleinbaum, Deputy Executive Director, Administration
(left to right) Michael C. Ascher, MTA Bridges and Tunnels; Peter A. Cannito, MTA Metro-North Railroad; James J.Dermody, MTA Long Island Rail Road; Mysore L. Nagaraja, MTA Capital Construction; Lawrence G. Reuter, MTANew York City Transit ; Neil S. Yellin, MTA Long Island Bus
Katherine N. Lapp, Executive Director
Gary M. Lanigan, Director, Budgets and Financial Management; William A. Morange, Deputy ExecutiveDirector, Director of Security; Catherine A. Rinaldi, Deputy Executive Director and General Counsel; Paul Spinelli, Auditor General
7
*Joined April 2004

2003 Consolidated Financial Highlights
8
Assets and Liabilities ($ Millions)
Income and Expenses ($ Millions)
Assets $42,029 100.00%
Capital assets, net $31,555 75.08%Other assets 10,474 24.92
Liabilities and Net Assets $42,029 100.00%
Current liabilities $2,384 5.67%
Long-term liabilities 22,132 52.66
Net assets 17,513 41.67
Income
Fares and operating revenues, $3,501 41.54%except tolls Tolls 1,022 12.12State subsidies 191 2.27Local subsidies 313 3.71Other subsidies 56 0.66State/regional taxes 2,016 23.92 Other 1,330 15.78Federal subsidies 0 0.00
Total $8,429 100.00%
Expenses
NYC buses and subways $4,937 58.57%Commuter rail, suburban buses, 2,263 26.85Staten Island Railway, and MTA headquarters Bridges and tunnels 362 4.29Debt service and other 867 10.29
Total $8,429 100.00%

9
Capital Program Progress
Capital Program Funding Received Through December 31, 2003* ($ Millions)
Capital Program Progress, 1982-2003 ($ Millions)
Capital Program Progress, 2003
($ Millions)
1982–2003 2003MTA federal grants $15,297 $2,076State appropriations 621 –City appropriations 3,459 37MAC surplus 925 –Port Authority 175 –Coliseum and East Side Airlines Terminal 262 –Capital-operating transfer 489 –Lessor equity 515 –MTA bonds 11,494 167MTA debt restructuring 2,334 432Pay-as-you-go 663 -7†
State service contracts 1,869 –Beneficial interest certificates 80 –Investment income 1,934 76Other 1,233 -165§
Total $41,351 $2,617
Commitments Expenditures Completions
MTA Total*† $46,987 $39,186 $33,573MTA New York City Transit 32,839 27,752 25,056MTA Long Island Rail Road 6,421 5,279 4,019MTA Metro-North Railroad 4,374 3,814 3,233MTA Bridges and Tunnels 1,980 1,487 1,156MTA Capital Construction 1,185 682 95
Commitments Expenditures Completions
MTA Total* $2,173 $3,476 $2,816MTA New York City Transit 1,342 2,252 1,932MTA Long Island Rail Road 224 495 556MTA Metro-North Railroad 186 240 74MTA Bridges and Tunnels 241 176 158MTA Capital Construction 180 296 95
* Funding for MTA Bridges and Tunnels Capital Programs not included.† As part of reconciliation by the MTA Office of the Comptroller, Pay-as-you-go receipts have been recalculated. Negative figure for 2003 represents the effect of the recalculation.§ Represents funds rebalanced between funding sources in 1992-1999 Capital Program.Note: Because of rounding, totals may not add exactly.
* MTA totals include the following amounts: World Trade Center recovery: Total commitments, $139 million (adjusted from 2002 reported figure as project was completed under budget); total expenditures, $138 million; total completions, $139 million; 2003 expenditures, $8 million; 2003 completions, $139 million. Planning and Customer Service Projects: Total commitments, $49 million; total expenditures, $34 million; total completions, $14 million; 2003 commitments $40 million; 2003 expenditures, $19 million. † Does not include $92 million of commuter rail project commitments made in the 1982-1991 Capital Program for projects that could not be assigned to either railroad since they benefited both.Note: Because of rounding, totals may not add exactly. Commitments may be more than receipts since bonds are sold as cash is needed.

10
Revenue The Metropolitan Transportation Authorityended 2003 with its budget in balance, setting asidea surplus of $119.4 million to offset a projected deficit in 2004. The balanced budget largely resultedfrom increased revenue generated by the MTA’s firstfare increase since 1995 and the first toll increasesince 1996.Despite ridership drops caused by the still-sluggishlocal economy, poor weather, the August blackout,and a decrease in discretionary rides attributable tothe fare and toll increases that went into effect inMay, fare and toll revenue was up 10.78 percent in
2003. Fare revenue rosefrom $2.98 billion to$3.31 billion, an increaseof 11.14 percent, whiletoll revenue at MTABridges and Tunnels rosefrom $933.1 million to$1.02 billion, an increaseof 9.52 percent.MTA New York City Transitand MTA Long Island Busintroduced deeperMetroCard® discounts anda new automatic insur-ance program for 30-DayUnlimited Ride MetroCard
purchases that are made at MetroCard VendingMachines. Passengers increased their purchases ofdiscounted fare cards and, by year-end, the aver-
age cost of a ride on MTA New York City Transit was$1.26, from a base fare of $2.00. In 2002, the aver-age cost of a ride was $1.04, when the base fare was$1.50. Although the base fare increase from $1.50 to$2.00 was a 33.3 percent increase, the deeperMetroCard discounts led to an average increase in paidfares of 21.0 percent. (See chart, page 17.)NYC Transit fare revenue rose 10.9 percent, from $2.25billion in 2002 to $2.54 billion in 2003. LI Bus farerevenue rose 14.9 percent, from $30.8 million in 2002to $35.4 million in 2003.Fare increases on the commuter railroads averagedapproximately 25 percent. The largest fare discountcompared to a one-way peak fare is for a monthly tick-et, with additional savings available for those purchas-
Financial Performance
Budget andFinancial Planinformation wasadded to theMTA website.
Deeper MetroCard discounts were introduced.
Fare and toll revenue went up10.78% in 2003.

11
ing tickets throughWebTicket on the MTAwebsite. Ten-trip ticketpackages and single- andround-trip fares roseslightly more, while on-board fares had thelargest increases. Whilemonthly ticket salesremained flat due to theeconomy, both MTA LongIsland Rail Road and MTAMetro-North Railroadexperienced increasedsales of peak and off-peak 10-trip tickets,which reflect new com-muting patterns, as well as increases in intermediatetravel, defined as trips that do not begin or end inNew York City. Customers generally took advantage oflower ticket prices offered at ticket windows, ticketmachines, and WebTicket, leading to a decrease inonboard sales of 44 percent on the Long Island RailRoad and 70 percent on Metro-North.The fare increase boosted fare revenue at the LIRRto $393.3 million in 2003, up 11.9 percent from$351.6 million in 2002. Metro-North fare revenueincreased to $378.1 million in 2003, up 11.5 per-cent from $339.1 million in 2002.MTA Bridges and Tunnels increased automobile tollsby 50 cents or 25 cents, depending on the crossing,with proportional increases for other vehicles.
Revenue was affected byfewer crossings, principallycaused by the Augustblackout, harsh winterweather (including blizzardsin February and December),rainy spring and summerweekends, a sluggish econ-omy, and the toll increase.The traffic reduction, how-ever, was far less thanBridges and Tunnels experi-enced after previous tollincreases. E-ZPassSM marketshare continued to grow,with more drivers takingadvantage of the discounts
offered by the electronic toll collection system.Budget As part of its financial planning process, in2003 the MTA changed its budget processes, releas-ing information to the public earlier in the year inorder to allow adequate time for analysis and discus-sion. The MTA also issued a four-year Financial Planthat forecast increasing deficits in the future. Whilethe 2004 budget is in balance, deficits are projectedto reach $539 million in 2005, $1.2 billion in 2006,and $1.3 billion in 2007.These gaps are caused by structural imbalances inthe MTA’s funding and are principally attributable torising debt service costs; increasing pension, health,and welfare expenses; and the depletion of non-recurring resources.
Fare and Toll Revenue($ Millions)
99
00
01
02
03
0 1,000 2,000 3,000 4,000
MTA New York City Transit*
MTA Long Island Rail RoadMTA Long Island Bus
MTA Metro-North RailroadMTA Bridges and Tunnels
* Includes revenue of Staten Island Railway.
E-ZPass market share continued to grow.

12
Debt service was 19 percent of MTA operating rev-enues in 2003; it is projected to increase to 29 per-cent by 2007, from $868 million to $1.58 billion overthe four-year period. Debt service costs are associatedwith the funding of the MTA’s Capital Program andwere anticipated in the planning of the current pro-gram. The 2002 debt restructuring helped lower debtservice; without the restructuring the increase in debtservice costs would have occurred earlier and wouldhave been greater than currently projected. Pensioncosts are projected to rise from 7 percent of operat-ing revenues to 14 percent, from $309 million to$771 million, principally due to stock market lossesbefore 2003 and lower fixed-income interest revenue.Health and welfare costs will go from 15 percent to18 percent of operating revenues, increasing from$693 million to $978 million.MTA management is focused on two broad strategiesto confront this challenge.First, all MTA operations are being examined in orderto identify cost-cutting and cost-containment meas-ures that can be made without diminishing serviceor compromising safety, security, or reliability stan-dards. Included in this review is a proposed reorgan-ization of MTA operations that will bring significanteconomies of scale. The reorganization is part of abill currently before New York State legislative andexecutive officials.Second, the MTA is working to identify new fundingmechanisms to support its operations. By developingalliances with civic, business, and political leaderswho appreciate the critical importance of the MTA’stransportation network to the vitality of our region,the MTA will pursue additional support from its governmental funding partners to address currentfunding shortfalls.Finance The MTA restructured its outstanding debtin 2002 in what was then the largest public bondrefinancing in the history of the market. The restruc-
turing allowed the MTA to better match debt serviceto the life span of its assets.With all of its old bonds refinanced, in 2003 theMTA began issuing the new money portion of therestructuring, selling more than $1.97 billion infixed- and variable-rate bonds in a favorable interestrate environment. All MTA bonds maintained ratingsof A or better from the three bond rating agencies:Moody’s, Standard & Poors, and Fitch.Insurance Operations The MTA’s captive insurancecompany, First Mutual Transportation AssuranceCompany (FMTAC), continues to help contain insurance costs.To lower insurance costs, the MTA restructured itsautomobile liability insurance, consolidating insur-
Financial Performance
2005 2006 2007
Projected Deficits, 2005-2007($ Millions)
0
300
600
900
1,200
1,500
539
1,1841,311
2003 2004 2005 2006 2007(Actual)*
Debt service (excluding Service Contract Bonds)
Pension expenses
Health and welfare costs
Projected Growth in MTA Expenses, 2003-2007($ Millions)
0
500
1,000
1,500
2,000
2,500
3,000
3,500
* 2003 (Actual) has been reformatted to enable comparison with subsequent years.
466617 717 771
768
942
832
1,251
901
1,442
978
1,583868
309
693

13
ance for non-revenue vehicles operated by the MTA,LIRR, LI Bus, Metro-North, MTA Police, MTA StatenIsland Railway, and the Inspector General. By hold-ing the funds to pay losses in FMTAC, the MTAexpects to save $1.2 million in 2004.The MTA terminated its Excess Loss Trust Fund andtransferred the assets and obligations to FMTAC,which established an all-agency excess liability pro-gram. Transferring this coverage to FMTAC providesthe MTA with reinsurance coverage for terrorist actsas provided by the federal government under theTerrorism Risk Insurance Act.The August 15 blackout resulted in extraordinarycosts, including overtime and other expenses, forthe MTA’s agencies. The MTA has submitted the fol-lowing claims to the Federal Emergency ManagementAgency (FEMA) for potential reimbursement: $2.3million for NYC Transit; $1.2 million for LIRR;$561,631 for Metro-North; $116,988 for Bridges andTunnels; and $212,711 for MTA Police. These figuresdo not include lost revenue.Real Estate and Advertising The MTA’s real estateand advertising operations remained strong in 2003:total revenue increased 9.3 percent from 2002 andby 53 percent since 1999.Revenue from real estate operations was $62.2 mil-lion, up 8.4 percent from $57.4 million in 2002. Theincrease was attributable in part to the renting ofadditional ground-level retail space at 2 Broadwayand increased revenue generated by the BatteryParking Garage, which is still recovering from thefalloff in downtown business since 9/11.Grand Central Terminal continued to be a premierNew York City location for retail businesses: 50 retailstores, gourmet food at Grand Central Market, avibrant, lower-level dining concourse, fine dining atfour restaurants, and a unique cocktail bar. Rentalscontinued very strong in 2003, with nearly all spaceoccupied or under lease.Advertising revenue was up 10.0 percent to $77.8million in 2003 from $70.7 million in 2002. Duringthe year the MTA expanded its LED advertising toadditional stations. LED screens, mounted at somestation entrances, replace back-lit advertising pan-els. The screens display video advertising and can
also be used to provide immediate service informa-tion to customers approaching the station. By year-end, 79 stations had LED panels. In addition, theadvertising program, building on the success of“brand cars,” expanded its “station domination” pro-gram, which allows an advertiser to purchase nearlyall of the advertising space at a station. The pro-gram is popular at major transfer points and by theend of 2003, the first full year of the program, fivestations were involved: Grand Central, 59th Street-Columbus Circle, 14th Street-Union Square,Lexington Avenue-53rd Street, and 161st Street-Yankee Stadium.
Digital LED screens helped boost advertising revenue.
Real Estate and Advertising Revenue($ Millions)
99
00
01
02
03
Real estateAdvertising
0 30 60 90 120 150

14
Since 2000,1,762 new subway cars weredelivered.
New transfer availability between subways, theLIRR, and AirTrain at the renovated SutphinBoulevard/Archer Avenue station and JamaicaStation will encourage tourism.
OperationsCapital ProgramA New Agency In July, the MTA Board created theMTA Capital Construction Company. All project man-agement of major capital expansion as well as thenew Fulton Street Transit Center and South FerryTerminal in Lower Manhattan and all MTA securitycapital construction are now consolidated in the newagency, headed by Mysore L. Nagaraja, longtime con-struction chief for New York City Transit. Capital
Construction will manage thecoordination, design, and con-struction of these projects andkeep them on schedule andwithin budget. The newagency’s small, experiencedstaff will draw on personnelfrom the agencies, efficientlyusing available in-houseexpertise for these critical projects. Capital Construction employsenvironmentally friendly designprinciples and constructionpractices in its work and usessophisticated managementtools and procedures to identi-
fy and manage the extraordinary complexities inher-ent in Capital Program mega-projects. These expan-sion projects — East Side Access, the Second AvenueSubway, the extension of the 7 line to the far WestSide — along with the Fulton Street Transit Centerand the new South Ferry Terminal are guided by thestrategies laid out in Governor George E. Pataki’sMaster Links, a plan to create a seamless regionaltransportation system with easier transfer betweenthe components of the MTA system and otherproviders of mass transit and to increase mass transitservice in the New York region.Capital Program Overview By the end of 2003, thefourth year of the 2000-2004 Capital Program, 78percent of total planned projects and commitmentswere completed, ongoing, or scheduled for comple-tion in 2004 in accordance with plan. This includesstation renovations, system repairs and maintenance,all major rolling stock purchases, and expansion andsecurity capital projects. Of the $2.80 billion planned
The Fulton Street Transit Center will spurDowntown revitalization.

15
for 2003, $2.17 billion was actually committed;delayed mega-project commitments accounted forthe majority of the balance.The Capital Program allots substantial funds forefforts that improve infrastructure performance andcustomer satisfaction: $19.1 billion for new equip-ment, rehabilitation and improvement, and systemexpansion, and $1.0 billion for maintaining and
upgrading facilities of Bridges and Tunnels. In 2003, MTA New York City Transit committed$1.34 billion to 63 Capital Program projects andcompleted 82 projects worth $1.9 billion. MTA LongIsland Rail Road committed $224 million and com-pleted $556 million worth of projects, including$434 million of rolling stock. MTA Metro-NorthRailroad fulfilled its goal of completing $74 millionin Capital Program projects, including significantwork on maintenance facilities, and committed$186 million, 101 percent of its goal. And MTABridges and Tunnels committed $241 million andcompleted $158 million worth of projects.The $19.1 billion 2000-04 Capital Program for masstransit is funded by a combination of bond sales;resources from debt restructuring; interest income;insurance proceeds; proceeds from selling or leasingassets; and federal, state, and local allocations.
Bridges and Tunnels funds its program solely withTBTA bonds and pay-as-you-go funding. About 81percent of the program is earmarked for maintaininga state of good repair by replacing or improvingcomponents of New York City Transit, Long IslandRail Road, Metro-North Railroad, and Bridges andTunnels as they reach the end of their useful life:$7.4 billion for normal replacement, $4.9 billion tobring additional parts of the network into goodrepair, and $3.9 billion for system improvements.Rolling Stock Continual upgrading and replacementof old rolling stock is essential to improving bench-marks that directly affect customer satisfaction —mean distance between failures and on-time per-formance, for example. In 2003, NYC Transit signed acontract for 80 R-142A subway cars for its numberedlines (A division) at a cost of $96.8 million. Itreceived 325 R-142 cars and 60 R-143 cars, complet-ing delivery of its R-142 (1,030 cars), R-142A (520cars), and R-143 (212 cars) car classes. No new busorders were placed in 2003, but a total of 313 vehi-cles —103 compressed natural gas (CNG) and 216articulated — were accepted for service, as were290 paratransit vehicles.
Over 300 new buses were added to Transit’s fleet.
Rolling stock upgrades are improving LIRR performance.

16
MTA Long Island Rail Road conditionally accepted190 new M-7 electric cars in 2003. A total of 678cars are on order for the agency and will continue toarrive over the next three years. Their mean distancebetween failures averaged 209,448 miles in 2003,more than double the goal of 100,000 miles.
Long Island Bus ordered nine buses to begin replac-ing its oldest natural gas buses, and also ordered 22replacements for paratransit buses that are approach-ing the end of their useful life. Deliveries of bothorders are expected in the last quarter of 2004.The first six pilot M-7 cars were delivered to Metro-North; delivery of production cars will begin in thesecond quarter of 2004. The M-2 Car RemanufactureProgram, funded jointly with the ConnecticutDepartment of Transportation, continued. It willoverhaul 241 M-2 (121 CDOT and 120 Metro-North)cars with in-kind replacement of critical system com-ponents as well as upgrading of various components.Rehabilitation and Improvement NYC Transit com-pleted construction of the West Farms Depot ($106.9
million) and 100th Street Depot ($113.4 million).West Farms will serve 250 clean-fuel buses with CNGfacilities and can accommodate ultra-low-sulfurdiesel buses. The new, four-story 100th Street Depothouses and maintains 116 articulated buses thatserve Manhattan’s East Side.Major subway station rehabilitations included theFifth Avenue station on the 7 line, the 42nd Streetstation on the A/C/E line, the Eastern Parkway-Brooklyn Museum station on the 2/3 line, and thereconstruction of the 72nd Street station on the1/2/3/9 line. Long Island Rail Road rehabilitated its station build-ings at Hewlett, Cedarhurst, St. Albans (includinginstallation of a new six-car-length platform), andAuburndale (including replacement of platforms).The first section of a new two-level commuter park-ing facility at Long Beach was opened, making 214additional spaces available.
Metro-North completed the restoration of the his-toric interior of Yonkers Station and parking andaccess improvements to the north and south lots
Operations
The LIRR Hewlett Station was completely rehabilitated.
A new bus depot serves Manhattan’s East Side.

17
adjacent to the Pelham Station. The Mid-HarlemThird-Track Project — upgrading an existing trackbetween Mount Vernon and Fleetwood and construc-tion of a new track between Fleetwood andCrestwood — advanced to 80 percent of completion.Bridges and Tunnels completed the $152-millionroadway deck rehabilitation of the suspension spanand Queens viaduct of the Triborough Bridge — thelargest rehabilitation project in the agency’s history. Heavy 15-foot-tall stiffening trusses — added to theBronx-Whitestone Bridge in 1946 to improve itsresistance to wind — were removed and replacedwith a lighter, more efficient, triangular fiberglasssystem along both sides of the bridge. This restoredthe bridge’s original graceful profile, reduced deadload on the bridge by more than 1,100 tons, andimproved its performance in the wind.
RidershipThe MTA network had a total ridership of 2.31 billion in 2003, downslightly from 2.37 bil-lion in the previousyear. Average weekdayridership was 7.53million, down from7.71 million in 2002.Contributing to thedecline throughoutthe agencies were theweak regional econo-my (which depressedcommuter travel), themid-year fareincrease, unusuallywet spring and summer weather (including manyweekends) and winter storms (19.8 inches of snowin Central Park on February 17) which depressedboth discretionary and commuter travel. Anotherfactor in the decline was the August 14 blackoutthroughout the eastern portion of the United States. At 2.12 billion, New York City Transit’s ridership wasdown from its 30-year record high of 2.18 billion in2002. Subways carried 1.38 billion passengers, buses735 million. MetroCard discounts mitigated the
effect of the fare increase on transit ridership.Long Island Rail Road ridership declined 3.6 percentto 80.9 million from 83.9 million in 2002. LongIsland Bus, at 30.0 million, was down 2.9 percentfrom its record high of 31.3 million (including para-
transit) in 2002. Metro-NorthRailroad ridership was 72.5 million,down 0.82 percent from 73.1 mil-lion in 2002.Bridges and Tunnels saw a 0.9 per-cent reduction in traffic in 2003,from the previous year’s recordhigh of 300 million vehicles to 297million, while E-ZPass average dailymarket share grew 1.0 percentfrom 68.8 percent in 2002 to 69.8percent in 2003.MetroCard Despite the subway fareincrease, innovative fare policiessuch as fare discounts and free
transfers made possible by MetroCard resulted in riders now paying an average of $1.26 per ride, lessthan the old $1.50 base fare and only a little morethan the fare a decade ago. Under the MetroCard Balance Protection Program,an insurance program introduced in October, cus-tomers who purchase their 30-Day Unlimited RideMetroCard with a credit, debit, or ATM card from aMetroCard Vending Machine are protected againstits loss or theft.
NYC Transit ridership was 2.12 billion.
Average Cost of a Ride on New York City Transit
99 00 01 02 03
($)2.00
1.50
1.00
.50
0
Base fare
Average cost of a ride
$1.50 $1.50 $1.50 $1.50
$2.00
$1.09 $1.07 $1.06 $1.04$1.26

18
For reduced-fare customers (seniors and people withqualifying disabilities) NYC Transit developed a newMail&Ride option that caps monthly spending at $35,the reduced-fare cost of a 30-day card. By trackingusage, Transit provides each Mail&Ride customer withthe least expensive payment option retroactively; fre-quent users pay the monthly rate and others receivethe advantages of weekly or per-ride rates.MetroCard use was expanded to the new JFK AirTrainand to PATH’s reopened World Trade Center station.High entry/exit turnstiles (HEETs) improve access byenabling customers to enter or exit stations when astation agent is not on duty. Some 480 HEETs werein place throughout the subway system in 2003.
Customer Satisfaction As has happened after previous fare and tollincreases, overall customer satisfaction levels,measured by independent citywide and regional sur-veys, fell because customer perceptions of value
and the cost of a ride influence ratings. In nearlyall categories, those who rated the cost of the fareor toll unfavorably gave lower ratings to service-and environment-related questions, while those whorated the cost of the fare favorably gave service andenvironment higher ratings. (All survey results areon a scale of 0 to 10.)New York City Transit Customers rated overall subwayservice at 6.2, down slightly from 6.4 in 2002. Thelargest drops in customer ratings were in cost of thefare, down from 7.0 to 5.0, and in the subway provid-ing a good value for the money, down from 7.2 to5.9. Also down, though much less significantly, wereratings of announcements on trains regarding delays(down 0.3 to 5.1), clarity of announcements (down0.3 to 4.9), speed of travel (down 0.2 to 7.2), safetyfrom subway train accidents (down 0.2 to 7.0), andstation environment (down 0.2 to 5.8). Overall com-fort rose slightly (up 0.1 to 6.3), as did the rating forcomfortable temperatures (up 0.2 to 6.8).Overall satisfaction with bus service dropped from6.3 to 6.1. As with subways, the largest decreaseswere in cost of the fare, from 7.0 to 5.3, and busesproviding good value for the money, from 7.1 to 5.8.Also down were ratings of bus operator courtesy(down 0.4 to 6.6), announcements (down 0.3 to6.1), cleanliness (down 0.3 to 6.6), and crowdingduring rush hours (down 0.3 to 4.6).Long Island Rail Road Overall LIRR customer satis-faction fell in 2003 to 6.9, down from 7.6 in 2002.The largest decrease was in the cost of a ride, whichfell from 6.9 to 5.7.For nearly all non-fare-related attributes, ratingsremained at 6 or above. Customers were less satis-fied with the on-time performance (down 0.4 to7.3), speed of trips (down 0.4 to 7.7), publicaddress announcements about delays (down 0.4 to6.2), and safety from accidents (down 0.6 to 7.8)but gave good marks to air conditioning (up 0.2 to7.1), cleanliness of restrooms (up 0.6 to 5.2), and
Operations
Overall subway satisfaction ratings remained high despite the fare increase.
MetroCard use was expanded to the new JFK AirTrain.

19
parking availability (up 0.4 to 5.8).Long Island Bus Satisfaction among LI Bus cus-tomers fell to 6.9 in 2003 from 7.4 in 2001, the lasttime a regional survey was conducted. The greatestdissatisfaction was with the cost of the fare (down2.8 to 5.3) and the value of service (down 2.0 to6.4). Other attributes fell as well (although none asmuch as those that are cost-related), including afeeling of security (down 1.1 to 7.3), wait times forbuses (down 0.9 to 6.0), ease of connections (down0.7 to 7.1), and crowding (down 0.6 to 5.7). Therating of competence of bus drivers rose 0.1 to 8.1.Metro-North Railroad Riders rated overall service onMetro-North at 7.3, down from 8.1 in 2002. The rat-ing of cost of the fare declined from 7.2 to 6.2.While many individual attribute ratings declinedfrom last year, most remained above 7. Among theattributes that declined were on-time performance(down 0.8 to 7.6), safety from accidents (down 0.6to 8.1), and speed of travel (down 0.6 to 8.1).Customers gave higher ratings to parking availability(up 0.3 to 6.1), parking lot security (up 0.1 to 7.0),and restroom cleanliness (up 0.1 to 4.7).Bridges and Tunnels Overall Bridges and Tunnelscustomer satisfaction decreased slightly to 7.3 fromthe record 7.5 of 2002. The rating for the value ofservice declined from 6.3 to 6.2. Overall, E-ZPasscustomers remained more satisfied (7.5) than cashcustomers (6.7) and rated the value of service higher(6.6 for E-ZPass customers; 5.1 for cash customers).
Personal SecurityMajor felonies were down 13 percent on subways in2003. Crime declined by 5.3 percent last year onthe commuter railroads, and by 50 percent since1998. Despite these achievements, customer per-ceptions of safety, along with customer satisfaction,declined in 2003. That drop, despite a reduction inactual crime, is consistent with the drop that fol-lowed the 1996 fare increase. Customer perceptionsof value and the cost of a ride influence ratings ofoverall satisfaction as well as of specific areas suchas personal security.In the citywide customer satisfaction survey con-ducted in October, customers rated safety and secu-
rity in subway cars 6.2 on a scale of 0 to 10, downfrom 6.3 in 2002. Police presence in subway carsremained at 4.7 as it was in 2002; police presencein stations was rated at 5.3, down from 5.5 in 2002.Safety and security on buses was rated 7.1, downfrom 7.4 in 2002.Long Island Rail Road customers rated overall per-sonal security at 6.9, down from 7.4 in 2002.Personal security at the customer’s home station wasrated 6.6, down from 7.0. Security at Penn Stationwas up slightly to 7.7 from 7.6, and police presenceat the terminal was rated 8.2, unchanged from2002. Metro-North customers rated overall personalsecurity at 7.4, down from 7.7 in 2002; personalsecurity at the customer’s home station at 7.1, downfrom 7.5, and personal security at Grand CentralTerminal at 8.0, down from 8.1; police presence atGrand Central was rated 8.2, up from 8.1.
MTA Police and conductors work in partnership to guard customer security.
Evacuation drills increase subway safety.

20
SafetyTransit employee lost-time accidents reached a 12-year low in 2003. Among its new safety initiatives,New York City Transit implemented enhanced flag-ging rules to improve safety of employees workingon tracks and line-specific high-frequency accidentcritiques to identify problems on individual lines andpresent solutions to them. Since the start of a new preventable accident pro-gram in July 2003, safety superintendents and localunion officials have interviewed 588 bus operatorsinvolved in preventable accidents, instilling accidentprevention awareness and prescribing appropriatetraining to improve their safety performance. Inconjunction with several other programs, theseefforts have contributed to a 10 percent reductionin the year-end bus collision rate per million miles,from 0.49 in 2000 to 0.44 in 2003.Long Island Rail Road has enhanced its accidentinvestigation training program and safety auditingprocess to help reduce employee accidents. Theagency’s lost time and restricted duty employeeaccidents declined to 3.44 per 200,000 work hoursin 2003 from 4.10 in 2002, and employee accidentshave declined by 78 percent since 1991.Metro-North’s lost-time and restricted duty employeeaccidents rose to 4.34 per 200,000 work hours in2003 from 4.26 in 2002. The agency’s new “24/7Safety” program emphasizes safety on a round-the-clock basis. Using employee-centered observationand feedback to underscore safe workplace behav-iors, it aims to create both a safer workplace and asafer way of living. Long Island Bus provided “Actions Employees CanTake” safety training to 294 administrative and rep-resented staff, providing practical strategies to elim-inate workplace hazards and to recognize and elimi-nate unsafe work practices. The agency’s bus acci-dents have declined for the sixth straight year:
preventable accidents were down 7 percent from2002. Lost-time injuries were up to 6.05 per200,000 work hours from 3.49 in the previous year.At Bridges and Tunnels, employee lost-time injurieswere up to 3.50 from 3.20 in 2002, largely due tounusually inclement weather and the increasedamount of time employees spend outdoors in securi-ty-related duties. Bridges and Tunnels continues toimprove roadway safety and enforce roadway safetyregulations, focusing attention on problem areasidentified through the Achieving Collision Reductionon Bridges and Tunnels (ACROBAT) program. In addi-tion, the agency reviews both traffic incidents andremediation efforts to focus all levels of the organi-zation on improving customer safety.
Operations Customer Injuries*(Per Million Customers)
99 00 01 02 03
New York City Transit Subway 3.38 3.25 3.03 2.68 2.65 Bus 2.07 1.79 1.67 1.58 1.45
Long Island Rail Road 4.42 3.97 3.80 2.95 4.28
Long Island Bus 4.72 2.84 1.60 1.75 1.90
Metro-North Railroad 5.96 5.87 4.82 4.30 5.47
Bridges and Tunnels† 1.87 1.95 1.85 1.95 1.46
* Some figures have been restated from 2002 Annual Report based on additional information from operating agencies.
† Vehicle accidents with injury per 1 million vehicle crossings.
Lost-time and Restricted Duty Injury Rate*(Per 200,000 Work Hours)
99 00 01 02 03
New York City Transit§ 4.51 3.77 3.00 3.14 2.85
Long Island Rail Road 6.51 5.26 5.06 4.10 3.44
Long Island Bus† 4.70 5.56 4.33 3.49 6.05
Metro-North Railroad 5.68 5.97 5.25 4.26 4.34
Bridges and Tunnels† 3.10 3.10 3.70 3.20 3.50
* Some figures have been restated from 2002 Annual Report based on additional information from operating agencies.
§ NYC Transit measures lost-time and restricted duty injury rates on an equivalent “per 100 employees” basis.
† Figures reflect lost-time injuries only.

21
PreparednessBoth before and after 9/11, the MTA engaged theservices of several security firms to conduct thor-ough assessments of the MTA network to identifyvulnerabilities and assist in developing plans toaddress them. The result was a list of priority capitalprojects necessary to harden various parts of thenetwork against attack. In December 2002, the MTABoard approved $591 million in capital funds — ofwhich $142.7 million were committed by FEMA inApril 2003 — for these projects. MTA CapitalConstruction has been spearheading their implemen-tation on a priority time frame: elements worthabout $200 million will be completed by 2006. A $38.6 million security fund was also created tosupport short- and long-term security measures(fencing, protective clothes/equipment, hazardousincident response equipment, cameras, alarms, locks,etc.) identified by various operating agencies. Since 9/11, the MTA has taken numerous other meas-ures to enhance security throughout the system.Head count at the MTA Police Department has grownby 39 percent (from 521 in 2001 to a budgeted 723
in 2004), overtime has increased by 31 percent ($9.1million in 2001 to a budgeted $11.9 million in2004), and specialized agencies (InteragencyCounterterrorism Task Force; K-9 Unit; EmergencyServices Unit; Highway Unit) have been created. To enhance security around the MTA’s two tunnelsand seven bridges, the number of Bridges andTunnels Officers has been increased by 30 percent(from 677 in 2001 to 882 in 2003) and overtimehas increased by 195 percent (from $3.8 million in2001 to $11.2 million in 2003). This increased pres-ence is both a deterrent and real response capabili-ty to potential threats.National Guard troops have been deployed on a con-tinuing basis to supplement the MTA’s resources since9/11, and in periods of heightened alert, New Yorkand Connecticut state troopers have been deployedon commuter rail lines. The NYPD continues its suc-cessful patrol strategies on subways with added focuson preventing terrorist activity.To engage and sensitize our riders to the importanceof reporting suspicious activities to authorities, theMTA began an advertising campaign — “If you SeeSomething, Say Something” — in 2002 in subways,buses, and commuter railroads. Handbills have beenplaced on LIRR and MNR trains, and ticket vendingmachine screens and MetroCard Vending Machinesare programmed to flash the message when themachines are not in use.Advertising throughout the MTA system engages customers in the
security effort.
MTA Police inspect trucks before they cross bridges or enter tunnels.

22
EnvironmentNYC Transit continued its aggressive program tomake its bus fleet the cleanest in the nation. By theend of 2003, NYC Transit had completed engine repowering on approximately 673 buses, installedcatalyzed particulate filters on 2,079 buses, andreceived 514 new buses with filters installed. Theseactions are reducing particulate emissions from alldiesel buses in the fleet to levels virtually equiva-lent to those from CNG buses.
To prioritize compliance issues throughout theagency and align all departments toward the common goal of environmental improvement, LongIsland Rail Road implemented a new CorporateEnvironmental Remediation Strategy that makeslong-term remediations the responsibility of LIRRCapital Program Management. Specific resources willbe devoted to long-term projects and dedicatedproject managers will provide oversight. In the first phase of the Th!nk Clean CommuteProgram, North America’s largest electric station cardemonstration project, the MTA and the New YorkPower Authority offered 100 Long Island Rail Roadand Metro-North customers an emission-free, all-
electric commute. The vehicles are leased to com-muters by the Ford Motor Company and providedwith free electric charging hook-ups at over 20 com-muter stations. The smaller, more efficient cars allowmore cars to park in the existing lots and con-tributed to improving air quality by avoiding therelease of nearly four tons of pollutants last year. Long Island Bus conducted a comprehensive reviewof its hazardous waste program, procured hazardouswaste storage units and secondary containment sys-tems, and updated signage and spill equipment. Theagency also created an environmental calendar ofthe environmental initiatives and regulatory require-ments that must be completed annually. Metro-North has expanded the use of oil recoveredfrom losses during locomotive fueling from HarmonYard to Brewster Yard. The oil is captured in theoil/water separators connected to the fuel pad andnever released to the environment; reuse eliminatesthe need for off-site disposal, saving both disposalcosts and the cost of purchasing new fuel.
People With DisabilitiesThe Baruch College Computer Center for VisuallyImpaired People (CCVIP) presented the MTA with anaward for “25 Years of Access to Excellence.” One ofthe most important projects cited in the award wasthe MetroCard Vending Machine (MVM). Designed
Operations
Hybrid and CNG buses support NYC Transit’s commitment to clean busoperations.
Baruch College Center for Visually Impaired People and MTA partner to improve accessibility.

23
with the help of CCVIP staff members to ensurecomplete accessibility to blind and low-vision cus-tomers, the MVM buttons are marked in Braille andthe machines include an audio option that promptscustomers on the use of the machine.ADA (Americans with Disabilities Act) accessibilitywas provided at the 72nd Street station on the1/2/3/9 lines, the Prospect Park station on the Q line, and the 34th Street local train platform onthe 1/9 line.In its tenth year of operation by New York CityTransit, the Access-A-Ride program implemented azero percent denial rate: when a registered paratran-sit customer requests a ride one to four days inadvance, the trip will be provided. Dedicated para-transit stops were also set up to clearly mark 71pickup locations. In addition, the use of vouchersfor black car service has been expanded, including apilot program for dialysis customers.Introduced in late 2002 to make it easier for cus-tomers to pay for trips, the 20-ride Able-Ride TicketBook program was used by about a third of LongIsland Bus’s Able-Ride customers in 2003.
MTA Arts for TransitTo date, Arts for Transit has installed 135 works inthe MTA network; another 81 commissions are inprogress. The latest subway customer satisfactionsurveys indicate that 59 percent of riders notice theworks; of these 85 percent feel that the artworkimproves the system.
Tom Otterness’s Life Underground at 14th Street.
Lisa Dinhofer’s On a Roll at 42nd Street.

24
Of the many installations Arts for Transit completedin 2003, two are especially eye-catching. In the cor-ridor that connects the 7 line’s Fifth Avenue/BryantPark station to the B/D/F/Q station at 42ndStreet/Bryant Park, Samm Kunce’s Under Bryant Parkuses a richly textured mixture of glass and stonemosaic and etched granite to evoke disparate-seem-ing systems — underground water pipes and treeroots below the park, and the systems of language,history, and knowledge aboveground in the New YorkPublic Library. On a Roll, Lisa Dinhofer’s panoramicmural at the 42nd Street A/C/E line station at EighthAvenue, covers one 32-foot-long wall with a glassmosaic that depicts a gold-colored trompe l’oeilframe enclosing a black-and-white tile floor — thebackdrop for dozens of colorful marbles scatteringacross the floor. Free-floating marbles on side wallsappear to be breaking free of the central mural.
Transit MuseumAfter two years of renovation, the New York TransitMuseum reopened to the public on September 16,with new life-safety systems and upgraded mechani-cal and electrical systems that make the Museum’s
1936 subway station home a safer and more comfort-able place for visitors and staff. By the end of theyear, the Museum’s state-of-the-art computer/educa-tion center and newly reinstalled exhibits had welcomed some 25,000 visitors. To attract a diverseaudience, the Museum developed new interactive features, age-tailored tours and workshops for everyschool group that arrives, more in-depth informationin exhibits, and free weekend workshops. While its main facility was closed, the TransitMuseum launched Education Station, a series ofinteractive educational activities on the MTA web-site. The Gallery Annex at Grand Central Terminalhad its biggest year ever: 270,000 visitors enjoyedexhibits on vintage railroad travel posters, originaletchings inspired by the region’s massive transporta-tion infrastructure, and the Transit Museum’s secondHoliday Train Show, featuring New York City Subwayand Metro-North commuter trains. Transit Museumretail sales reached an all-time high of $1.2 million.
Operations
The Transit Museum expanded its offerings on the MTA website.
The New York Transit Museum reopened after two years of renovation work.

25
Customer E-mailThe launch of the MTA’s interactive customer e-mailsystem in November coincided with the MTA’s effortto actively solicit public comment on its financialplan. The MTA encouraged customers to expresstheir opinions on alternatives for closing the 2003-2004 budget deficit. Nearly 4,000 commentswere received and incorporated into the officialpublic hearing record.An essential part of the MTA’s drive toward greatertransparency, the customer e-mail system enablescustomers to correspond with the MTA on any subject. The knowledge-based system builds on thepopularity of the MTA website and also provides over 150 Frequently Asked Questions (FAQs) for self-service inquiries.
BlackoutAt 4:15 p.m. on August 14, 2003, a blackoutthroughout much of the eastern United States halted all subway trains as well as the metro areanetwork of commuter rail trains. Drawing on advancepreparation and training, New York City Transit,commuter rail crews, and MTA Police evacuated hundreds of thousands of customers from strandedtrains without incident. Before service was restoredgradually over the next 36 hours, miles of subwayand commuter track had to be walked and inspectedto ensure safety.
NYC Transit provided free bus service — the onlypublic transportation in the city during the black-out. Long Island Bus, in addition to maintainingregular service, expanded its reach to accommodateLong Island Rail Road customers from FlatbushAvenue to Montauk. Buses from Long Island Bus alsoserved as cooling stations for residents of area nurs-ing homes.Bridges and Tunnels suspended tolls from about 7 p.m. to midnight at the request of New York Cityofficials. All facilities switched to emergency backuppower and continued to operate during the blackoutto move traffic safely out of the city.
MTA launched customer e-mail on its website.
After the blackout, crews walked and inspected hundreds of miles of track.

26
The Fifth Avenue station on the 7 line was renovated.
Rolling Stock and Capital Program MTA New YorkCity Transit received 385 high-tech R-142, R-142A,and R-143 subway cars, bringing the total of newcars in the fleet to 1,762. The cars enabled Transitto complete the retirement of the last Redbird carsas well as expand the fleet by 362 cars.Bus service across the city was improved by the
addition of 319 buses, including 216 articu-lated buses and 103 compressed natural gas(CNG) buses. Working to make its fleet moreenvironmentally friendly, Transit replaced 673two-stroke diesel engines with cleaner four-stroke diesels.Continuing its work to upgrade stations, NYCTransit completed major renovations at fivestations in 2003, including the A/C/E stationof the Times Square-42nd Street complex,72nd Street on the 1/2/3/9 line, Fifth Avenueon the 7 line, Eastern Parkway-BrooklynMuseum on the 2/3 lines, and FlushingAvenue on the J/M/Z lines.Work began on six additional stations in2003, including the Myrtle Avenue-WyckoffAvenue station in Brooklyn, which will bemade ADA compliant; and four stations inthe Bronx: Bedford Park Boulevard,Kingsbridge Road, 183rd Street, and BurnsideAvenue. Also in the Bronx, significant new
work — including restoration of control houses,railings, and light posts that will maintain the his-toric look of the stations — was begun at SimpsonStreet, Jackson Avenue, and Prospect Avenue. TheBronx projects are an example of Transit’s “line concept,” which coordinates the rehabilitation ofadjacent or nearby stations on a single train line togain construction efficiencies and reduce inconven-ience to customers.Transit also completed a number of projects that,while less visible to customers, are critically impor-tant to system performance and safety. Theseincluded the rehabilitation of the subway signalsystems from 111th Street to Main Street on the 7line and from 36th Street to Stillwell Avenue on theM/W line in Brooklyn, and the rehabilitation of theviaduct at Jamaica Bay on the A line.Two new bus depots opened in September. Thesestate-of-the-art facilities replaced aging depots
The subway fleet has beenexpanded by 362cars since 2000.

and allowed NYC Transit to improve service and better maintain its fleet. The West Farms Depot inthe Bronx handles refueling for both diesel and CNGbuses and has both indoor and outdoor storageareas; the 100th Street Depot in Manhattan wasdesigned to blend into the surrounding East Harlemneighborhood. All vehicles park inside the depot.Both openings were completed with no service disruptions.In December, Transit awarded a $246.4 million contract for construction of a state-of-the-art cen-tral maintenance facility and bus depot in Queens.It will provide space for 200 buses, service thediverse transit fleet, and provide for futureupgrades to take advantage of new technologies asthey are developed.
27
99 00 01 02 03
1,283.1
1,381.1 1,405.3 1,413.2 1,384.1
SubwayBus
Annual Ridership(Millions of Rides)
666.4 698.9 739.5 762.1 735.3
99
00
01
02
03
Mean Distance Between Failures-Subways(Distance in Miles)
86,884
110,180
109,914
114,619
139,960
Mean Distance Between Service Interruptions-Buses (Distance in Miles)
99
00
01
02
03
2,354
2,771
3,477
3,692
3,721
New bus depots improve fleet operations.
A new entrance complemented the opening of the Time Warner Center.
28
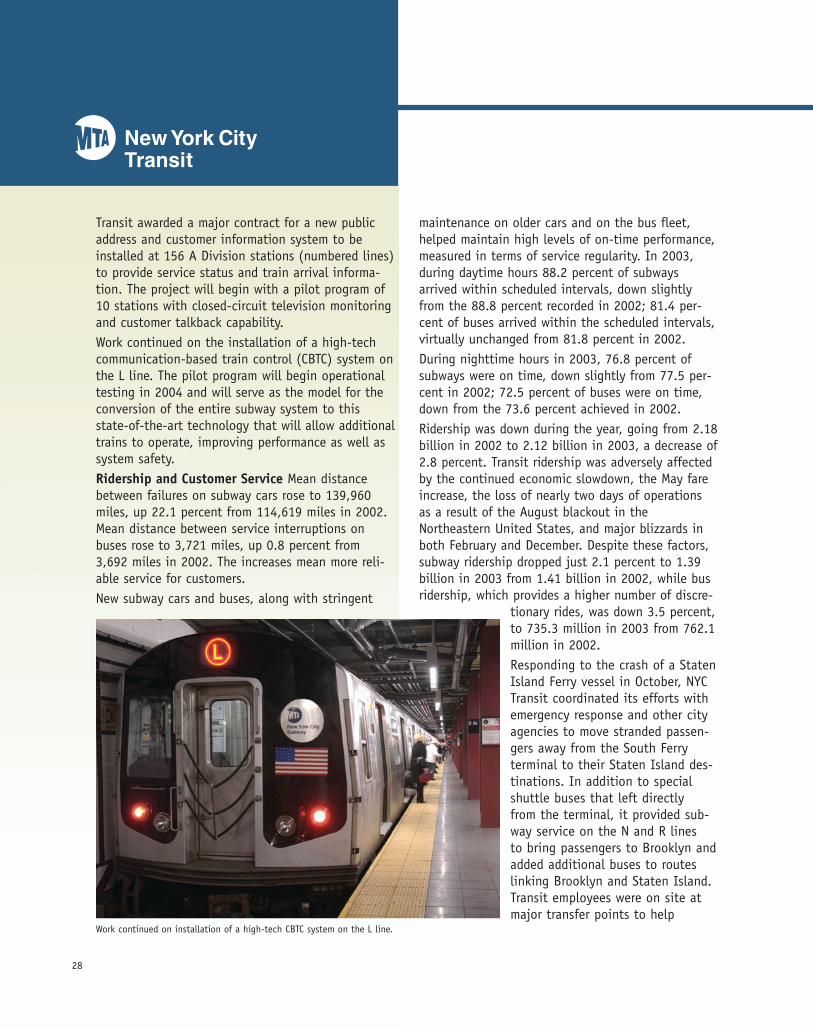
Transit awarded a major contract for a new publicaddress and customer information system to beinstalled at 156 A Division stations (numbered lines)to provide service status and train arrival informa-tion. The project will begin with a pilot program of10 stations with closed-circuit television monitoringand customer talkback capability.Work continued on the installation of a high-techcommunication-based train control (CBTC) system onthe L line. The pilot program will begin operationaltesting in 2004 and will serve as the model for theconversion of the entire subway system to thisstate-of-the-art technology that will allow additionaltrains to operate, improving performance as well assystem safety.Ridership and Customer Service Mean distancebetween failures on subway cars rose to 139,960miles, up 22.1 percent from 114,619 miles in 2002.Mean distance between service interruptions onbuses rose to 3,721 miles, up 0.8 percent from3,692 miles in 2002. The increases mean more reli-able service for customers.New subway cars and buses, along with stringent
maintenance on older cars and on the bus fleet,helped maintain high levels of on-time performance,measured in terms of service regularity. In 2003,during daytime hours 88.2 percent of subwaysarrived within scheduled intervals, down slightlyfrom the 88.8 percent recorded in 2002; 81.4 per-cent of buses arrived within the scheduled intervals,virtually unchanged from 81.8 percent in 2002.During nighttime hours in 2003, 76.8 percent ofsubways were on time, down slightly from 77.5 per-cent in 2002; 72.5 percent of buses were on time,down from the 73.6 percent achieved in 2002.Ridership was down during the year, going from 2.18billion in 2002 to 2.12 billion in 2003, a decrease of2.8 percent. Transit ridership was adversely affectedby the continued economic slowdown, the May fareincrease, the loss of nearly two days of operationsas a result of the August blackout in theNortheastern United States, and major blizzards inboth February and December. Despite these factors,subway ridership dropped just 2.1 percent to 1.39billion in 2003 from 1.41 billion in 2002, while busridership, which provides a higher number of discre-
tionary rides, was down 3.5 percent,to 735.3 million in 2003 from 762.1million in 2002.Responding to the crash of a StatenIsland Ferry vessel in October, NYCTransit coordinated its efforts withemergency response and other cityagencies to move stranded passen-gers away from the South Ferry terminal to their Staten Island des-tinations. In addition to specialshuttle buses that left directly from the terminal, it provided sub-way service on the N and R lines to bring passengers to Brooklyn andadded additional buses to routeslinking Brooklyn and Staten Island.Transit employees were on site atmajor transfer points to help
Work continued on installation of a high-tech CBTC system on the L line.

29
customers navigate unfamiliar routes as theyreturned home.In 2003, NYC Transit continued its work with thePort Authority of New York and New Jersey to inau-gurate seamless transportation to Kennedy Airportvia AirTrain service. AirTrain payment is made withMetroCard, and the service has connections to the Aline at Howard Beach-JFK Airport and to the E/J/Zlines at Sutphin Boulevard-Archer Avenue.Paratransit Operations Access-A-Ride, NYC Transit’sdoor-to-door service for people with disabilities,continued to grow in 2003, with ridership up 15.7percent to 2.58 million from 2.23 million the yearbefore. The service is provided by eight companiesunder contract to NYC Transit; Transit owns therolling stock and provides all customer services,including scheduling and appointments.With demand continuing to increase in 2003, Transitreceived 290 new vehicles (including 128 from anorder placed in 2002) to replace older vehicles andexpand its paratransit fleet by 22. Its total paratran-sit fleet now numbers 1,081.
New buses and improved maintenance make bus service more reliable.
Ridership rose over 15 percent at Access-A-Ride.

Rolling Stock and Capital Program MTA LongIsland Rail Road accepted delivery of 190 M-7 carsin 2003, bringing its high-tech fleet to a total of202 cars. When all deliveries are completed by year-end 2006, the LIRR will have 678 of the high-techcars in service.During 2003 the LIRR completed a number of sta-tion rehabilitations, including Auburndale, where anaging station building and platform were replacedwith a new waiting room, 10-car platform, canopy,and ADA-compliant elevator; St. Albans, where anew six-car center platform was built and twopedestrian tunnels and three sets of stairs wererehabilitated; Cedarhurst, where a station buildingwas rehabilitated and site work included a new ADA-compliant ramp; Hewlett, where the station buildingand parking lot were rehabilitated; and Oceanside,where a new station building was constructed.Parking lot improvements were completed at CentreAvenue, Floral Park, Greenlawn, Kings Park, Medford,and Patchogue.Among the many new projects begun in 2003 werethe East Williston station rehabilitation and parkingimprovements, Laurelton waiting room rehabilitationand parking improvements, Murray Hill station reha-bilitation, and Deer Park parking expansion design.Significant renovations at Jamaica Station andAtlantic Terminal-Flatbush Avenue are ongoing. AtJamaica, the soaring arc over the station is com-plete, spanning the tracks and platforms. Work iscontinuing on all of the station’s platforms and
platform waiting rooms, which will havestainless steel doors and new seating,upper window panels, and lighting fix-tures. Working with the Port Authority ofNew York and New Jersey, the LIRR coor-dinated construction work at Jamaica toallow a seamless transfer to the newAirTrain service to Kennedy Airport. Newticket machines that also sell AirTrain JFKMetroCard were installed at Jamaica andPenn Station.The rebuilding of Atlantic Terminal-
Flatbush Avenue Station continued. When completedin 2006, the station will be transformed, featuringstreet-level entrances, an enlarged concourse, ashopping mall, a modern waiting room and ticket
30
Work continuedon the renova-tions for theLIRR Jamaicastation.
190 new cars were added to the LIRR fleet.

office, and new stairways, elevators, and customer service areas.The railroad also completed its installation of new,more reliable ticket machines, including 30 ExpressTicket Machines to sell daily tickets.The LIRR moved forward on a plan for a new railyard on the Port Jefferson Branch, a prerequisite toincreased service along that line. As part of theenvironmental impact statement (EIS) process forthe proposed yard, Long Island Rail Road made far-reaching public outreach efforts, including a seriesof scoping meetings, mailings to customers andneighbors, and station visits with literature and dis-plays describing the need for the project.Ridership and Service LIRR ridership was down in2003, to 80.9 million from 83.9 million in 2002, adecrease of 3.6 percent. On-time performance was 93.1 percent in 2003,fourth best in the past 25 years and down from abest-ever 94.0 percent in 2002. The railroad’s overallperformance record was affected by a significantnumber of weather-related delays, including bliz-zards in both February and early December thatcaused systemwide service delays.With the continued delivery of new M-7 cars, theLIRR was able to improve service reliability — moretrains now operate with a full complement of cars.The mean distance between failures for the new carswas 209,448 miles, more than double the goal of100,000 miles, which pushed the overall fleet aver-age to 39,579 miles in 2003, up 6.6 percent from37,139 miles in 2002.The railroad continued its RailTalk customer out-reach program under newly appointed PresidentJames Dermody, a lifetime LIRR employee. He andother senior management team members of the rail-
road host dinners monthly with randomly selectedcommuters and also pay periodic morning visits tostations to solicit feedback directly from customers.Among the changes made based on customer sug-gestions were the installation of new station bench-es and the redesign of the parking area at KingsPark to better accommodate people with disabilities;a program to move trains out of the yard and intothe station earlier at Ronkonkoma to allow riders toboard earlier and not have to wait on the platformin inclement weather; and an increase in service toHunterspoint Avenue to accommodate riders con-necting to ferry service to midtown, employment inLong Island City, or the subway.The LIRR introduced a new WebTicket option for cus-tomers, allowing them to purchase tickets on theMTA website at a 2 percent discount for monthlytickets and a 5 percent discount on other tickets.
31
99 00 01 02 03
81.6 84.7 85.6 83.9 80.9
Annual Ridership(Millions of Rides)
99
00
01
02
03
Mean Distance Between Failures(Distance in Miles)
28,159
28,405
30,660
37,139
39,579
99 00 01 02 03
91.0 92.7 93.1 94.0 93.1
On-time Performance(Percent of Time*)
100
65
* Arrival within 5 minutes, 59 seconds of schedule
Oceanside Station was renovated.

Customer Service In 2003 MTA Long Island Buscelebrated its 30th anniversary of providing servicein Nassau, western Suffolk, and eastern Queens, andcontinued to focus its efforts on meeting new market needs.
Working with local governments and using afederal Job Access Reverse Commute grant toassist in funding, LI Bus introduced newroutes to provide additional service to majorshopping hubs at Roosevelt Field and GreenAcres. It also modified service on two routesto serve housing communities in Bethpageand Port Washington.LI Bus launched a “Take the Bus to the Train”campaign in conjunction with Long IslandRail Road, encouraging customers to leavetheir cars at home in favor of the many buslines that meet specific outbound andinbound LIRR trains. The program is designedto alleviate traffic congestion at train sta-tions and address the issue of limited availability of parking.Recognizing the agency’s work to increaseservice to the region by tapping into variousfunding sources, Vision Long Island, a com-munity-planning organization, presented LIBus President Neil S. Yellin with the 2003Smart Growth Award. It cited LI Bus for pro-
viding the region with creative and responsive trans-portation options.Rolling Stock and Capital Improvements In 2003,LI Bus began to replace the oldest compressed natu-ral gas (CNG) buses in its fleet. In addition to 58buses ordered in 2002, an additional nine buseswere ordered in 2003. All will be delivered in 2004.By that time, the entire LI Bus fleet will be convert-ed to CNG, making it the largest all-CNG fleet in thenation.LI Bus is installing an Automatic Vehicle Locationsystem on its buses. When completed in 2004, thesystem will improve tracking capabilities, allow clos-er monitoring of route adherence, and enable LI Busto optimize its schedule with more accurate real-time traffic and speed data.
32
Able-Ride grew 7.8 percent.
By the end of2004, all buseswill run on com-pressed naturalgas (CNG).

As part of its ongoing capital program to maintainits system in a state of good repair, LI Bus complet-ed a number of projects in 2003, including theinstallation of an aboveground storage tank and therebuilding of the boilers at the Roosevelt FieldDepot and the construction of a new cooling towerat the Mitchell Field Depot.Ridership Ridership was down slightly to 30.4 mil-lion in 2003, off 2.9 percent from a record high of31.3 million in 2002, attesting to the strength ofthe Long Island business community and policies atLI Bus that focus on direct community involvementto address emerging transportation needs. Thisstrong performance was achieved despite inclementweather in both spring and summer, major blizzardsin February and December, a fare hike in May, andthe August blackout that shut down commuter railservices and forced many businesses both in NewYork City and on Long Island to close, leading tosharply decreased ridership for two days.The mean distance between failures on buses fell in2003 to 1,944 miles, down 18.0 percent from 2,371miles in 2002.Paratransit Operations The paratransit operation ofLI Bus, Able-Ride, grew substantially in 2003, withridership up 7.8 percent — 309,667 customers in2003 compared to 287,150 in 2002. In November,Able-Ride set new single-day records for passengers(1,399 on November 3) and number of trips (1,145on November 12).To meet the increased demand, LI Bus received fivenew paratransit buses and ordered an additional 22buses to be delivered in 2004, at which point itsparatransit fleet will include 86 buses.
33
“Take the Bus to the Train” alleviates traffic congestion.
99 00 01 02 03
29.5 30.1 31.0 31.3 30.4
Annual Ridership(Millions of Rides)
99
00
01
02
03
Mean Distance Between Failures(Distance in Miles)
2,194
1,815
2,067
2,371
1,944

Capital Program Highbridge Yard was completed in2003. This new state-of-the-art train storage andcleaning facility, located on a 20-acre site just southof the Morris Heights Station on the Hudson Line,
allows trains to access HudsonLine tracks at both the north andsouth ends of the yard. The yardcan store train cars and push-pulltrains, and features a “run-around”track to move trains from one sideof the yard to the other. Its car appearance facility canaccommodate 20 cars per shift forthe “extraordinary” interior clean-ing that is performed every 90days when cars are scrubbed fromtop to bottom and vestibule andlavatory areas are power-cleaned.Another 72 cars can be cleanedand serviced in the yard every day. Phase I of the Harmon ShopReconstruction Plan, completed in2003, included new yard trainservicing facilities and modernizedsignal and power equipment. A user-friendly Asset ManagementSystem (AMS), developed in-housewith the latest technology, wentonline for testing in HarmonShop, the railroad’s largest main-tenance facility. The new real-timesystem will be used to manage all
of MTA Metro-North’s assets, starting with rollingstock, enabling the railroad to change the way itmaintains its rolling stock. AMS creates and tracksthe maintenance and repair history of a train car,using the accumulated data to improve the railroad’sequipment maintenance plan. With AMS, train prob-lems and maintenance issues can be addressed all atonce, so a car is taken out of service fewer times.AMS is also tied into a program which analyzes thecost of time spent maintaining or repairing a traincar and is linked with other departments and facili-ties that are vital to the maintenance process,greatly increasing the availability of information onany piece of equipment.
34
The newHighbridgeYard has astate-of-the-art cleaningfacility.
The first phase of reconstruction was completed atHarmon Shop.

Service Improvements Metro-North Railroad’s newcustomer e-mail notification service announcesplanned service changes as well as sudden majordisruptions that will cancel or curtail service for aprolonged period of time. Information is updated asit is available until full service is restored.Customers can choose to receive e-mail about theHarlem, Hudson, or New Haven lines (or all three ifthey desire) and West-of-Hudson service. Metro-North completed the rollout of its new, morereliable ticket vending machines (TVMs) that areeasy to use, offer a wider variety of ticket types,and allow customers to pay with cash, major creditcards, or ATM/debit cards. Like Long Island RailRoad, Metro-North also introduced a new fare struc-ture that offers customers discounts as incentivesto purchase tickets in advance. Buying a ticket onboard trains is the most expensive option. Ticketspurchased at stations from ticket machines or ticketagents before boarding the train are $2.75 to $3.50cheaper. Online with WebTicket, customers save 5percent on any ticket except a monthly, and anadditional 2 percent off the already-discountedmonthly ticket. TVMs sold almost 35 percent of all tickets for theyear; onboard sales dropped to 7.9 percent, down 70 percent. WebTicket accounted for over $6 millionin sales in 2003. Metro-North’s enhanced computerized inventory sys-tem for Lost & Found enables better management ofinventory and provides a database with interactivecapabilities, improving Lost & Found’s return rate to63 percent, more than double the industry standard.Ridership Overall ridership on Metro-North declinedby 0.83 percent from 73.1 million in 2002 to 72.5million. East-of-Hudson ridership, at 71.1 million,reached Metro-North’s goal for 2003. West-of-Hudson
ridership, at 1.5 million, fell by 3.2 percent. Groupsales, which offers discounted fares to customerstraveling in groups of 10 or more, had its best yearever in 2003, accounting for $334,475 in sales, a 25 percent increase over 2002.
35
99 00 01 02 03
68.5 71.8 73.1 73.1 72.5
Annual Ridership(Millions of Rides)
99
00
01
02
03
70,328
54,355
50,390
70,288
56,578
Mean Distance Between Failures(Distance in Miles)
99 00 01 02 03
96.3 96.7 96.6 97.3 96.4
On-time Performance(Percent of Time*)
100
65
* Arrival within 5 minutes, 59 seconds of schedule, measures East-of-Hudson only
The historic interior of the Yonkers station was renovated.

Capital Program The largest rehabilitation project inMTA Bridges and Tunnels’ history, the $152 millionroadway deck rehabilitation of the suspension spanand Queens viaduct of the Triborough Bridge, wascompleted in 2003. Overhead cranes running alongtracks installed on the main suspension span removedthe 1930s-era concrete deck and put in place a newsteel orthotropic deck that will increase the servicelife of the span. Deck installation was completed andall roadways were opened four months early in timefor Christmas Eve traffic under an incentive arrange-ment whereby the contractor worked overtime toavoid working in winter. At the Bronx-Whitestone Bridge, heavy 15-foot-tallstiffening trusses — added to the bridge in 1946 toimprove its resistance to wind — were removed andreplaced with a lighter, triangular, more efficientfiberglass system along both sides of the bridge. Thisrestored the bridge’s original graceful profile of 1939,reduced dead load on the bridge by more than 1,100tons, and improved its performance in the wind.At a cost of $48 million (paid for out of the operat-ing budget) and lasting five years, the repainting ofmajor portions of the Verrazano-Narrows Bridge wasthe largest painting project in agency history. Despitethe need to replace a contractor who defaulted, long-term lane closures associated with the project endedin November in time to remove all barriers and closedlanes for the New York City Marathon.Customer Service Bridges and Tunnels continuallyimplements plaza toll lane reconfigurations, linestriping, new signage, and expedited tollbooth per-sonnel changes to improve traffic flow through thetoll plazas. Roadway and other maintenance initia-tives help customers move through tunnels and overbridges more quickly. Personnel changeover time incash toll lanes has been reduced to 90 seconds orless. Last year, customers waited an average of only20 seconds in peak-time traffic queues at Bridges andTunnels facilities. For E-ZPass users, the overall aver-age waiting time was six seconds; for cash customersit was 43 seconds.In the midst of some $700 million in Capital Programprojects underway at the agency’s nine facilities,Bridges and Tunnels reduced customer accidents by11 percent per million vehicles — double its goal —through technology (a Geographical Information
36
The five-year repainting project at the Verrazano-NarrowsBridge was completed.

System [GIS] to map trouble spots) and practicalsolutions (signage, construction area safety, andenforcement) that encourage and enable customersto operate their vehicles more safely. In addition,Bridges and Tunnels made 441 arrests for drivingwhile intoxicated, a 30 percent increase from 2002.To give customers a new tool for planning theirtrips, Bridges and Tunnels introduced a Webcam tothe MTA’s website, providing a live view of trafficconditions in both directions at each toll plaza oneach bridge or tunnel. Customers can choose astreaming video or a still version. The Webcam wentlive on June 16 and received more than 132,000hits by year-end.Completion of installation and testing of 432 fiber-optic cables across the Verrazano-Narrows Bridge hasprovided interconnectivity among the bridge, theQueens Midtown Tunnel, the Brooklyn-BatteryTunnel, MTA Headquarters, TRANSCOM, Randall’sIsland, and 2 Broadway. This contributes to improve-ments in data and security systems and E-ZPass.Substantial progress was also made toward installa-tion of Intelligent Transportation Systems (ITS)including the real-time Roadway WeatherInformation System and the electronic toll collectionViolations Surveillance System. Crossings and E-ZPass Harsh winter weather, rainyspring and summer weekends, the blackout, and asluggish economy contributed to a 0.9 percentreduction in traffic in 2003 from the previous year’srecord high of 300.0 million vehicles to 297.2 million. Increased tolls also reduced traffic, thoughfar less than previous increases did. E-ZPass market share grew to 72 percent of all week-day crossings and 81 percent of commercial vehicleweekday crossings on Bridges and Tunnels facilities.
By the end of 2003, E-ZPass Plus customers couldalso use their tag to pay parking fees at all threemajor airports in the metropolitan area, and over900,000 such transactions were completed. In addi-tion, a pilot program at two Long Island McDonald’srestaurants had a 26 percent growth in transactionsduring 2003 by drive-through customers who usedan E-ZPass mounted on the windshield to pay fortheir purchases in the drive-through lane. Over 63percent of Bridges and Tunnels E-ZPass customerssurveyed said they would be likely to use their tagsto purchase gas, food, and parking, if offered.Continuing a program that began in 2002, theagency replaced nearly 550,000 first-generation E-ZPass tags with new tags. Tags are replaced auto-matically before the end of their service lives at nocost to the customer, and a prepaid mailer is provid-ed to return old tags to the Customer Service Center.This convenient program promotes operational effi-ciency at the toll plaza and minimizes operationaldisruptions at the agency’s facilities. More than 1.1million tags have been replaced since the programbegan — with no customer problems or complaints.
37
99 00 01 02 03
172.4188.9
197.6 206.4
288.7 296.6 293.2300.0 297.2
VehiclesE-ZPass transactions
Use of Facilities(Millions of vehicles)
207.4
99 00 01 02 03
912.8 940.6 914.9 933.11,021.9
Annual Revenue from Tolls($ Millions)
99
00
01
02
03
623.0
642.9
581.8
528.2
702.0
Support to Mass Transit($ Millions)
A new stiffening system on the Bronx-Whitestone Bridge reduced weightand restored its orginal 1939 profile.

38
In July, the MTA Board created a new subsidiarypublic benefit corporation, MTA Capital Construction,whose mission is to implement all MTA systemexpansion projects and the construction of theFulton Street Transit Center and South Ferry Terminalin Lower Manhattan, as well as all MTA security cap-ital construction. Capital Construction is dedicatedto keeping these crucial projects on schedule andwithin budget by bringing a team focus to managingtheir planning, design, construction, and communityand stakeholder coordination. Capital Construction operates with a small, experi-
enced staff. Mostpersonnel neededfor a project arematrixed from theoperating agencies,ensuring maximumefficiency and flexi-bility without dupli-cating resources andexpertise. Riskanalysis and othersophisticated man-agement tools and
procedures are used to identify and manage theextraordinary complexities inherent in the CapitalProgram mega-projects and to assure federal andother funding sources that their dollars are returningthe greatest value.Environment Capital Construction requires “greendesign” principles and construction practices andfollows International Standards Organization (ISO)14001 guidelines for setting up an environmentalmanagement system to protect the environment.Contractors on the Fulton Street Transit Center andSouth Ferry Terminal, for example, will be requiredto use low-sulfur diesel fuel in their constructionequipment, among other steps to reduce emissions.The Fulton Street Transit Center will incorporateLeadership in Energy and Environmental Design(LEED®) goals and include solar features to providesome of its energy needs. Project-specific sustain-able design guidelines will be developed for theSecond Avenue Subway and 7 Line Extension andsustainable design elements will be incorporated inall capital projects. Construction noise will bereduced through specific standards and monitoring
This schematic shows the East Side Access station tunnels.
A renderingshows the exterior of theFulton StreetTransit Center.
Nearly 600,000 people will ride the Second AvenueSubway daily.

requirements, and a comprehensive quality initiativewill ensure consistency in environmental documents. Security A vulnerability assessment completed in2003 identified and prioritized security projectsacross all MTA agencies. The Board approved $619million for these projects; the federal government,through the Federal Emergency ManagementAdministration (FEMA), will provide $143 million ofthis amount and the Office of Domestic Preparednesswill provide $28 million. Capital Construction willmanage all capital projects related to enhancingsecurity in the MTA network.Downtown Revitalization On December 3, federalfunding was approved for the $1.15 billion FultonStreet Transit Center and new South Ferry Terminal— the first time the government has funded proj-ects before planning is completed. CapitalConstruction is working with the Federal TransitAdministration to complete the necessary environ-mental review and design of the projects in 2004 sothe projects can be finished by 2007 — a veryambitious schedule. The Fulton Street Transit Centerwill create a major connection for 12 subway linesthat serve the Fulton Street/Broadway-Nassau com-plex and nearby stations, improving circulation andreducing crowding by reconfiguring the current mazeof narrow ramps and stairs. An underground pedes-trian concourse at Dey Street will connect the centerto the R/W and E subways and provide access to theWorld Trade Center site and PATH trains. SouthFerry’s obsolete curved, single-track 1/9 station willbe replaced by a straight two-track terminal withspace to accommodate full-length trains andimprove the frequency, speed, and reliability of theentire 1/9 line. The new station will largely elimi-nate delays caused by mechanical failures and traincongestion, create an underground connection with
the R/W at Whitehall Street, and improve access tothe Staten Island Ferry.
Expansion ProjectsSecond Avenue Subway This $16.8 billion full-length subway will be built in segments runningfrom 125th Street to the Financial District. It willgreatly relieve the overcrowded Lexington Avenueline and serve over 590,000 riders daily, including15,000 new daily subway riders. Pending the com-pletion of the environmental review process, con-struction is scheduled to begin by the end of 2004.East Side Access (ESA) In the first expansion ofLong Island Rail Road since 1898, service will bebrought into Grand Central Terminal, providing con-venient, time-saving access to Manhattan’s East Sidefor 76,000 daily commuters. Over the last year, theproject team has completed site clearing and otherpreparatory work to allow construction to begin onthe seven miles of new tunnels that will connect theLIRR in Queens to Grand Central through the exist-ing 63rd Street Tunnel. The $6.3 billion project willalleviate pressure on Penn Station and increasetransportation capacity, supporting economic andjob growth. 7 Line Extension NYC Transit’s 7 line will beextended from its current terminus at Times Squareto the far West Side, promoting new development inthat area. The project will be supported entirely bycity funds. The environmental review, which is beingconducted in conjunction with the New York CityPlanning Department, is substantially complete, andconstruction is targeted to begin in 2005.
39
Expansion Projects Progress, 2000–2003*($ Millions)
Commitments Expenditures
East Side Access 836.14 534.93
Second Avenue Subway 276.97 121.83
7 Line Extension† 46.04 18.83
Fulton Transit Center 25.55 6.70
* East Side Access figures include amounts attributable to the 1995-1999 Capital Program. Completions for East Side Access total $94.64 million, all attributable to 2003.
† The MTA expects that construction of the 7 line extension will be fully funded by New York City.
Expansion Projects Progress, 2003*($ Millions)
* East Side Access figures include amounts attributable to the 1995-1999 Capital Program. Completions for East Side Access total $94.64 million, all attributable to 2003.
† The MTA expects that construction of the 7 line extension will be fully funded by New York City.
Commitments Expenditures
East Side Access 154.71 192.45
Second Avenue Subway — 79.55
7 Line Extension† — 17.33
Fulton Transit Center 25.55 6.70


Comprehensive Annual Financial Reportfor the years ended December 31, 2003 and 2002
Metropolitan Transportation Authority, a component unit of the State of New York
Prepared by Department of Budgets and Financial Management

Table of Contents
Introductory Section
Letter of Transmittal 1
Certificate of Achievement for Excellence in Financial Reporting 8
MTA Organizational Structure 9
Financial Section
Report of Independent Auditors 13
Management’s Discussion and Analysis 14
Consolidated Basic Financial Statements for the Years
Ended December 31, 2003 and 2002:
Balance Sheets 24
Statements of Revenues, Expenses, and Changes in Net Assets 26
Statements of Cash Flows 28
Notes to Financial Statements 30
Required Supplementary Information 67
Statistical Section
10-Year Statistical Tables 70
2003 Operating Statistics 74

Introductory Section

This page is intentionally left blank

April 22, 2004
Chairman and Members of the BoardMetropolitan Transportation Authority
I hereby submit the Comprehensive Annual Financial Report (“CAFR”) of theMetropolitan Transportation Authority (“MTA,” the “Authority”) prepared by theComptroller’s Office for the year ended December 31, 2003. Responsibility for both theaccuracy of the enclosed data and the completeness and fairness of the presentation,including all disclosures, rests with the MTA. I believe that the data as presented areaccurate in all material respects and that the information is presented in a mannerdesigned to set forth fairly the financial position and results of operations of the MTAin accordance with generally accepted accounting principles. To the best of my knowl-edge, all disclosures necessary to enable the reader to gain an understanding of theMTA’s financial affairs have been included.
The CAFR is presented in three parts:
Introductory Section, including a copy of the 2002 Certificate of Achievement forExcellence in Financial Reporting, this Letter of Transmittal, and the MTAOrganizational Structure.
Financial Section, including Independent Auditors’ Report, Management’sDiscussion and Analysis, Combined Basic Financial Statements for the years endedDecember 31, 2003 and 2002, and accompanying notes to the financial statements.
Statistical Section, including a number of tables and graphs of unaudited data forthe past 10 years and other information.
The Reporting Entity
The MTA is the largest public transportation provider in the Western Hemisphere. Itsagencies serve 14.6 million people spread over 5,000 square miles from New York Citythrough Long Island, southeastern New York State, and Connecticut. MTA agenciesmove more than 2.3 billion rail and bus customers a year.
A public benefit corporation chartered by the New York State Legislature in 1965,
1
Letter of Transmittal

the MTA is governed by a 17-member Board.* Members are nominated by theGovernor, with four recommended by New York City’s mayor and one each by the coun-ty executives of Nassau, Suffolk, Westchester, Dutchess, Orange, Rockland, and Putnamcounties. (Members representing the last four cast one collective vote.) The Boardalso has six rotating nonvoting seats, three held by members of the PermanentCitizens Advisory Committee (“PCAC”), which serves as a voice for users of MTA transitand commuter facilities, and three held by representatives of organized labor. AllBoard members are confirmed by the New York State Senate.
The following table shows the agencies’ legal and popular names:
Legal Name: Popular Name:
New York City Transit Authority MTA New York City Transit
Staten Island Rapid Transit Operating Authority MTA Staten Island Railway
The Long Island Rail Road Company MTA Long Island Rail Road
Metropolitan Suburban Bus Authority MTA Long Island Bus
Metro-North Commuter Railroad Company MTA Metro-North Railroad
Triborough Bridge and Tunnel Authority MTA Bridges and Tunnels
MTA Capital Construction Company MTA Capital Construction
For financial reporting purposes, the above agencies are consolidated.
Major Initiatives, Service Efforts, and Accomplishments
In 2004 the MTA raised subway, bus, and commuter rail line fares for the first timesince 1995 and raised tolls on bridges and tunnels for the first time since 1996. Theincreases were necessary to close budget deficits in 2003 and 2004.
To lessen the impact of the increase on subway and bus riders and to encouragepre-payment for rides, the MTA increased the fare discounts available on both Pay-Per-Ride and Unlimited Ride MetroCard and began offering insurance on 30-Day UnlimitedRide purchases made with debit or credit cards at MetroCard Vending Machines. NewYork City Transit closed approximately 50 part-time station booths, nearly all of whichremain accessible on an around-the-clock basis through high entry/exit turnstiles.
Along with the fare increases, the commuter rail lines moved to a three-tier pric-ing structure that includes lower prices for tickets purchased at stations rather thanon trains and offers additional discounts on certain tickets when purchased on theinternet.
Bridges and Tunnels tolls increased by 25 or 50 cents in each direction, dependingon the crossing, and E-ZPass discounts continued.
2 M E T R O P O L I T A N T R A N S P O R T A T I O N A U T H O R I T Y
*The current board (as of April 5, 2004) includes 16 voting and 5 nonvoting members.

To better manage its system expansion projects, the MTA formed MTA CapitalConstruction. The new company is responsible for construction management of EastSide Access, the Second Avenue Subway, the extension of the 7 line to the West Sideand Javits Center, the Fulton Street Transit Center, the South Ferry Terminal, and theMTA’s security-related construction projects.
East Side Access, which will create a terminal for Long Island Rail Road at GrandCentral, has been recommended for a full funding agreement by the Federal TransitAdministration, and the project team completed site clearing and other preparatorywork that will allow construction to begin on the seven miles of new tunnels that willconnect the LIRR in Queens to Grand Central through the existing 63rd Street Tunnel.
The MTA submitted an Environmental Impact Statement to the Federal TransitAdministration for the Second Avenue Subway, which will ultimately run from EastHarlem to the Financial District. Following its approval and the issuance of a Recordof Decision, initial construction — slated for late 2004 — will begin.
The two Downtown Manhattan projects — Fulton Street and the South FerryTerminal — have received full funding from the federal government as part of theDowntown Manhattan rebuilding process. Both will complete the review process in2004, followed by aggressive construction schedules that call for completion by 2007.The Fulton Street Transit Center will create a major connection for 12 subway linesthat serve the Fulton Street/Broadway-Nassau complex and nearby stations, improvingcirculation and reducing crowding by reconfiguring the current maze of narrow rampsand stairs. An underground pedestrian concourse at Dey Street will connect the centerto the R/W and E subways and provide access to the World Trade Center site and PATHtrains. At South Ferry, an obsolete, curved, single-track 1/9 station will be replacedby a straight two-track terminal that will accommodate full-length trains and improvethe frequency, speed, and reliability of the entire line. It will include an undergroundconnection with the R/W at Whitehall Street and improved access to the StatenIsland Ferry.
The 2000-2004 Capital Program continues to rehabilitate and improve the MTA net-work with new rolling stock and modernized facilities.
Results of Operations
Ridership The continued economic slump and the fare increases pushed ridershipdown in 2003, but far less than expected. Total ridership was 2.31 billion, down from2.37 billion in 2002. New York City Transit carried a total of 2.12 billion customers in2003, down from 2.18 billion in 2002. Ridership on the Long Island Rail Road wasdown to 80.9 million from 83.9 million. Long Island Bus ridership, including its para-transit operations, fell to 30.4 million from 31.3 million. Metro-North Railroad rider-ship was 72.5 million in 2003, down from 73.1 million in 2002.
MetroCard Vending Machine sales totaled approximately $1 billion in 2003 andaccounted for 52 percent of all MetroCard transactions. Debit card and credit card pur-
3

chases accounted for 51 percent of all vending machine revenue.
Vehicle crossings at facilities of MTA Bridges and Tunnels reached 297.2 million in 2003,down from 300.0 million in 2002. The market share of the E-ZPass electronic toll collection sys-tem continued to grow, reaching 72.3 percent of all weekday crossings and 80.4 percent of com-mercial vehicle weekday crossings on Bridges and Tunnels facilities — a total of 207 millioncustomers. The E-ZPass program is the largest electronic toll collection system in the world.
Operating Revenues
Operating revenues rose in 2003 due to increases in fares and tolls.
Operating Expenses
Salaries and benefits expenses increased across all reporting groups, principally because of addi-tional service frequency, higher levels of overtime, and wage increases associated with laborcontracts for many of the MTA’s represented staff. Benefit expenses increased commensuratewith the higher salaries and wages and were affected by the nationwide increase in health ben-efit costs and recalculated pension contributions necessitated by stock market losses.
4 M E T R O P O L I T A N T R A N S P O R T A T I O N A U T H O R I T Y
Operating Expenses($ Millions)
Percent of Dollar 2003 Total 2002 Change
Salaries and wages $3,544 47% $3,435 $109
Retirement and other employee benefits 1,375 18% 1,171 204
Materials and supplies 416 6% 410 6
Fuel and power 298 4% 277 21
Computer, engineering, and other consulting services 454 6% 430 24
Public liability and claims 207 3% 140 67
Depreciation and amortization 1,235 16% 1,135 100
Other expenses 32 <1% (6) 38
Total $7,561 100% $6,992 $569
Operating Revenues($ Millions)
Percent of Dollar 2003 Total 2002 Change
Passengers $3,311 73% $2,979 $332
Tolls 1,022 23% 933 89
Rent, freight, and sundry 190 4% 141 49
Total $4,523 100% $4,053 $470

Nonoperating Revenues (Expenses)
Risk Management
The MTA has an extensive risk management program, including its own captive insur-ance company, and combines self-insurance with insurance policy contract coverage.
Following the terrorist attack on the World Trade Center, the MTA began workingwith its insurance carriers to settle claims for damage to MTA property, expenses relat-ing to additional operating expenses, and losses due to business interruption. OnApril 8, 2004, the MTA reached a global settlement with the insurance carriers and isnow awaiting final payment.
5
Nonoperating Revenues (Expenses) ($ Millions)
Percent of Dollar 2003 Total 2002 Change
Tax-supported subsidies: New York State $1,592 70% $1,215 $377 New York City and local 424 19% 453 (29)
Operating subsidies: New York State 191 8% 230 (39) New York City and local 188 8% 199 (11)
Operating subsidies recoverable from Connecticut Department of Transportation related to Metro-North Commuter Railroad’s New Haven line 56 2% 47 9
Subsidies to Dutchess, Orange, and Rockland counties (20) (1%) (14) (6)
Suburban Highway Transportation Fundsubsidy (19) (1%) - (19)
Interest on long-term debt (780) (34%) (558) (222)
Station maintenance, operation, and use assessments 125 6% 117 8
Loss on disposal of subway cars (31) (1%) (58) 27
Unrealized gain (loss) on investment (18) (1%) (9) (9)
World Trade Center insurance settlement 398 18% – 398
Other nonoperating income 160 7% 11 149
Total $2,266 100% $1,633 $633

Accounting and Budgetary Control
Management of the MTA is responsible for establishing and maintaining an internalcontrol structure to ensure that the assets of the MTA are protected from loss, theft,or misuse and to ensure that adequate accounting data are compiled to allow for thepreparation of financial statements in conformity with generally accepted accountingprinciples.
Basis of Accounting The MTA prepares its financial statements using the accrual basisof accounting. The activities of the MTA are similar to those of proprietary funds oflocal jurisdictions and are therefore reported in conformity with governmentalaccounting and financial reporting principles issued by the Governmental AccountingStandards Board (“GASB”).
Budgetary Controls The MTA maintains budgetary procedures in order to ensure com-pliance with the annual operating budgets approved by the MTA’s Board. It is theresponsibility of each office to administer its operation in such a manner as to ensurethat the use of funds is consistent with the goals and programs authorized by theBoard and that approved levels are not exceeded.
Cash Management The MTA’s investment policies comply with the New York StateComptroller’s guidelines. These policies permit investments in, among others, obliga-tions of the U.S. Treasury and its agencies and instrumentalities, and repurchaseagreements secured by such obligations.
Independent Audit
The accounting firm of Deloitte & Touche LLP performed the annual audit of thefinancial statements of the MTA in accordance with auditing standards generallyaccepted in the United States of America. The report of the independent auditors onthe financial statements of the MTA is included in the Financial Section of this CAFR.
Awards
The Government Finance Officers Association (“GFOA”) awarded a Certificate ofAchievement for Excellence in Financial Reporting to the MTA for its 2002 annualreport. This was the ninth consecutive year the MTA received this prestigious award.In order to be eligible for a Certificate of Achievement, the MTA published an easilyreadable and efficiently organized comprehensive annual financial report. This reportsatisfied both generally accepted accounting principles and applicable legal require-ments. A Certificate of Achievement is valid for a period of one year only. We believethat our current comprehensive annual financial report continues to meet theCertificate of Achievement Program’s requirements and we are submitting it to theGFOA to determine its eligibility for another certificate.
6 M E T R O P O L I T A N T R A N S P O R T A T I O N A U T H O R I T Y

Acknowledgments
The preparation of the comprehensive annual financial report on a timely basis wasmade possible by the dedicated service of the director of Financial Management andthe entire staff of the Comptroller’s Office. Each member of the office has our sincereappreciation for the contributions made in the preparation of this report.
Sincerely,
Gary M. Lanigan
Director of Budgets and Financial Management
7

Certificate of Achievement
8 M E T R O P O L I T A N T R A N S P O R T A T I O N A U T H O R I T Y
President Executive Director
Certificate of Achievementfor Excellence
in Financial Reporting
Presented to
Metropolitan Transportation Authority,
New York
For its Comprehensive Annual Financial Report
for the Fiscal Year EndedDecember 31, 2002
A Certificate of Achievement for Excellence in Financial Reporting is presented by the Government Finance Officers
Association of the United States and Canada to government units and public employee retirement systems whose comprehensive annual financial
reports (CAFRs) achieve the highest standards in government accounting
and financial reporting.

9
MTA Organizational Structure
Katherine N. Lapp
Paul Spinelli
Neil S. Yellin
Peter A. Cannito
James J. DermodyLawrence G. Reuter
Auditor General*
Executive Director
PresidentMTA Metro-North Railroad
PresidentMTA Long Island Rail Road
PresidentMTA Long Island Bus
Mysore L. Nagaraja
PresidentCapital Construction
PresidentMTA New York City Transit
Chairman
PresidentMTA Bridges and Tunnels
Michael C. Ascher
Peter S. Kalikow
* Also reports to Audit Committee of MTA Board.

This page is intentionally left blank

Financial Section

This page is intentionally left blank

13
Report of Independent Auditors
INDEPENDENT AUDITORS’ REPORT
To the Members of the Board ofMetropolitan Transportation Authority
We have audited the accompanying balance sheets of Metropolitan Transportation Authority (the“Authority”), a component unit of the State of New York, as of December 31, 2003 and 2002, and thestatements of revenues, expenses and changes in net assets, and cash flows for the years then ended.These financial statements are the responsibility of the Authority’s management. Our responsibility isto express an opinion on these financial statements based on our audits. We did not audit the financialstatements of the New York City Transit Authority (“NYCTA”); Staten Island Rapid Transit OperatingAuthority (“SIRTOA”); and Metropolitan Suburban Bus Authority (“MSBA”), which represent 53 per-cent and 56 percent, respectively, of the assets and revenues of the Authority. Those financial state-ments were audited by other auditors whose report thereon has been furnished to us, and our opinion,insofar as it relates to the amounts included for NYCTA, SIRTOA and MSBA, is based solely on thereport of the other auditors.
We conducted our audits in accordance with auditing standards generally accepted in the United Statesof America. Those standards require that we plan and perform the audit to obtain reasonable assuranceabout whether the financial statements are free of material misstatement. An audit includes examining,on a test basis, evidence supporting the amounts and disclosures in the financial statements. An auditalso includes assessing the accounting principles used and significant estimates made by management,as well as evaluating the overall financial statement presentation. We believe that our audits provide areasonable basis for our opinion.
In our opinion, the financial statements present fairly, in all material respects, the financial position ofthe Authority, as of December 31, 2003 and 2002, and the results of its operations, changes in excess ofliabilities over assets, and its cash flows for the years then ended in conformity with accounting princi-ples generally accepted in the United States of America.
The Management’s Discussion and Analysis on pages 2 through 13 is not a required part of the finan-cial statements but is supplementary information required by the Governmental Accounting StandardsBoard. This supplementary information is the responsibility of the Authority’s management. We haveapplied certain limited procedures, which consisted principally of inquiries of management regardingthe methods of measurement and presentation of the required supplementary information. However, wedid not audit the information and express no opinion on it.
The required supplementary information on the pension funding progress has not been subjected to theauditing procedures applied in the audit of the financial statements and, accordingly, we express noopinion on such information.
April 8, 2004

1. Overview of the Financial Statements
IntroductionThis report consists of four parts: Management’s Discussion and Analysis (“MD&A”), Financial Statements, Notes tothe Financial Statements, and Supplementary Information.
The Financial Statements Include:
• The Consolidated Statements of Net Assets provide information about the nature and amounts of investments inresources (assets) and the obligations to Metropolitan Transportation Authority (“Authority”) creditors (liabili-ties), with the difference between the two reported as net assets.
• The Consolidated Statements of Revenues, Expenses, and Changes in Fund Net Assets provide information aboutthe Authority’s changes in net assets during each year and accounts for all of the current year’s revenues andexpenses, measures the success of the Authority’s operations during the period, and can be used to determinehow the Authority has funded its costs.
• The Consolidated Statements of Cash Flows provide information about the Authority’s cash receipts, cash pay-ments, and net changes in cash resulting from operations, noncapital financing, capital and related financing,and investing activities.
The Notes to the Financial Statements Provide:
Information that is essential to understanding the financial statements, such as the Authority’s accounting methodsand policies; details of cash and investments, employee benefits, long-term debt, lease transactions, and futurecommitments and contingencies of the Authority; and information about other events or developing situations thatcould materially affect the Authority’s financial position.
Required Supplementary Information provides information concerning the Authority’s progress in funding itsobligation to provide pension benefits to its employees.
Management’s Discussion and Analysis provides a narrative overview and analysis of the financial activities ofthe Authority for the years ended December 31, 2003 and 2002. This management discussion and analysis is intend-ed to serve as an introduction to the Authority’s financial statements. It provides an assessment of how theAuthority’s position has improved or deteriorated and identifies the factors that, in management’s view, significantlyaffected the Authority’s overall financial position. It may contain opinions, assumptions, or conclusions by theAuthority’s management that should not be considered a replacement for, and must be read in conjunction with thefinancial statements.
14 M E T R O P O L I T A N T R A N S P O R T A T I O N A U T H O R I T Y
Management’s Discussion and AnalysisYears Ended December 31, 2003 and 2002($ Millions)

15
2. Financial Reporting Entity
The Metropolitan Transportation Authority was established under New York State Public Authorities Law and is a pub-lic benefit corporation and a component unit of the State of New York whose mission is to continue, develop, andimprove public transportation and to develop and implement a unified public transportation policy in the New Yorkmetropolitan area.
MTA Related Groups
• Headquarters (“MTAHQ”) – provides general oversight, planning, and administration, including budget, cash man-agement, finance, legal, real estate, treasury, risk management, and other functions to the agencies listed below.
• The Long Island Rail Road Company (“LIRR”) – provides passenger transportation between New York City andLong Island.
• Metro-North Commuter Railroad Company (“MNCR”) – provides passenger transportation between New York Cityand the suburban communities in Westchester, Dutchess, Putnam, Orange, and Rockland counties in New YorkState and New Haven and Fairfield counties in Connecticut.
• Staten Island Rapid Transit Operating Authority (“SIRTOA”) – provides passenger rail transportation on StatenIsland.
• Metropolitan Suburban Bus Authority (“MSBA”) – provides public bus service in Nassau and Queens counties.
• MTA Excess Loss Trust Fund (“ELF”) – provides coverage against losses from catastrophic events and providesbudget stability in the event annual aggregate losses impact negatively upon the operating budgets of its partic-ipants. ELF was terminated in the fourth quarter of 2003 and the assets were transferred to First MutualTransportation Assurance Company (“FMTAC”) (as defined below). FMTAC will be responsible for ELF’s past liabili-ties and issue a new policy covering similar claims.
• First Mutual Transportation Assurance Company (“FMTAC”) – operates as a captive insurance company to provideinsurance coverage for property and primary liability.
• New York City Transit Authority (“NYCTA”) and the Manhattan and Bronx Surface Transit Operating Authority(“MaBSTOA”) – provide subway and public bus service within the five boroughs of New York City.
• Triborough Bridge and Tunnel Authority (“TBTA”) – operates seven toll bridges, two tunnels, and the BatteryParking Garage.
Management’s Discussion and AnalysisYears Ended December 31, 2003 and 2002
($ Millions)

16 M E T R O P O L I T A N T R A N S P O R T A T I O N A U T H O R I T Y
3. Condensed Financial Information
The following sections discuss the significant changes in the Authority’s financial position for the years endedDecember 31, 2003 and 2002. An analysis of major economic factors and industry trends that have contributed tothese changes is provided. It should be noted that for purposes of the MD&A, summaries of the financial statementsand the various exhibits presented are in conformity with the Authority’s financial statements, which are presentedin accordance with accounting principles generally accepted in the United States of America. All dollar amounts arein millions.
2003 2002 2001
Capital assets, net $31,555 $29,079 $26,186Other assets 10,474 10,689 11,229
Total assets $42,029 $39,768 $37,415
December 31, 2003 versus 2002
• Capital assets increased in 2003 by $2,476. The significant additions included rehabilitation of stations andstructures for the subways and railroad cars of $469, placing in service of new railroad electric passenger carsand subway cars of $851, track and structure rebuild of $899, and other capital assets of $257. Major projectsrelated to these expenditures included:
— Installation of new Ticket Vending Machines by LIRR and MNCR.
— Rehabilitation of Jamaica station and construction of inter-modal transportation center linking LIRR, JFK AirTrain, and NYCTA subway and bus lines.
— Installation of new electrical distribution systems to the stand-by power substations in Penn Station.
— Reconstruction of the Atlantic Avenue stations, including disabled accessibility, Roosevelt station, Queens Plaza,and Times Square.
— Work was done on Canarsie and Flushing lines as part of signal modernization.
— Finalization of construction and reconstruction of the 1 and 9 lines destroyed in the terrorist attack of September11, 2001.
— Acquisition of 385 new subway cars.
— Acquisition of 319 new articulated and CNG buses.
• The additions were partially offset by the disposal of 296 “redbird” subway cars. The disposal of the “redbird”subway cars was completed in 2003 by “reefing” the cars off the coast of some states to enhance sea life.
Management’s Discussion and AnalysisYears Ended December 31, 2003 and 2002
Capital Assets
2003 2002■■ Construction work-in-progress 16% 18%
■ Building and structures 24% 25%
■ Bridges and tunnels 3% 3%
■ Passenger cars and locomotives 18% 16%
■ Buses 2% 2%
■ Infrastructure 23% 22%
■ Other 14% 14%
■ Land 0.39% 0.43%
2003 2002

17
• Other Assets decreased by $215 from 2002 to 2003. The major components of this decrease were:
— A decrease of $797 in investments primarily related to:– The acquisition of capital assets, an increase in operating losses, and payment of debt service.
— A decrease of $327 in current receivables and other noncurrent assets is derived primarily from:– The settlement of the World Trade Center (“WTC”) disaster, partially offset by the collection of accounts
receivable from the City of New York.
— An increase in prepaid expenses is primarily due to the prepayment of pension costs and insurance premiums.
— An increase of $445 in restricted investments related to new capital lease obligations. During 2003, the Authorityengaged in three sale/leaseback transactions with MetLife, Bank of New York, and Bank of America.
— An increase of $391 in the NYS Recoverable primarily related to the usage of proceeds available from the StateService Contract Bonds issued in 2002. This recoverable will be reduced in future years through NYS reimburse-ment of principal on the bonds.
December 31, 2002 versus 2001
• Capital Assets increased approximately $2,893 from 2001 to 2002. The increase is primarily due to the additionsand disposal of capital assets of $1,901, and infrastructure construction related primarily to the East Side Accessproject, the Second Avenue Subway project, and the reconstruction of the 1 and 9 Lines of $992. This increase ispartially offset by the disposal of capital assets.
• Other assets decreased by $540 from 2001 to 2002. The decrease is mostly attributable to:
Reduction of other current receivables of $544 of which $232 is related to amounts received as capital contributionfrom New York City representing the proceeds from the sale of the New York Coliseum. Additionally, New York State paidthe full amount of the state’s appropriations for the 2002-2003 fiscal year.
Increase in amounts held in escrow for the retirement of capital lease obligations of $1,536.
Payment of debt service.
Increase in New York State receivables of $591 related to the issuance of the new State Service Contract Bonds Series2002A and 2002B.
Total liabilities, distinguishing between long-term liabilities and other liabilities
2003 2002 2001
Other liabilities $ 2,384 $ 2,101 $ 2,800Long-term liabilities 22,132 20,805 18,113
Total liabilities $24,516 $22,906 $20,913
Management’s Discussion and AnalysisYears Ended December 31, 2003 and 2002
Total Liabilities
2003 2002■■ Accounts payable/accrued expenses 8% 8%
■ Long-term debt (Note 6) 70% 71%
■ Obligations under capital lease (Note 7) 11% 10%
■ Other current liabilities 2% 1%
■ Other long-term liabilities 9% 10%
2003 2002

Significant changes in liabilities include:
December 31, 2003 versus 2002
• Total liabilities increased by $1,610.
— The Other liabilities increased primarily due to:– An increase in current portion of bond principal payable.– An increase of $152 in accrued expenses, partially due to an increase in vacation and sick pay, retirement and
death benefits payable, bank and overdraft payable due to timing of payroll, and other expenses not yetfunded.
— The Long-term liabilities increased primarily due to:– Increase in Long-term debt in the amount of $1,444 resulting from the issuance of the Authority’s
Transportation Revenue Bonds, Series 2003A and Series 2003B in the amount of $475 and $752 respectively, forthe purpose of providing funds for capital projects as well as redeeming the Bond Anticipation Notes in theamount of $750. New Bond Anticipation Notes in the amount of $420 were issued. TBTA also issued SubordinateRevenue Bonds, Series 2003A and TBTA General Revenue Variable Rate Bonds, Series 2003B in the amounts of$500 and $250 respectively to finance transportation projects and certain improvements on bridges andtunnels.
– Increase in obligations under capital lease of $437, resulting mainly from the new sale-lease transactions withMetLife, Bank of America, and Bank of New York.
– Increase in estimated liabilities arising from injuries to persons increased by $93, due to increases in amountsclaimed and settled.
– Other long-term liabilities decreased by $645, primarily due to the settlement of the World Trade Centerinsurance claims.
December 31, 2002 versus 2001
• Total liabilities at December 31, 2002 increased over December 30, 2001 by approximately $1,993, long-term lia-bilities increased $2,692, and other liabilities decreased $699.
— The decrease in the other liabilities is primarily due to:– The payment of a short-term note in the amount of $300;– A decrease in interest payable in the amount of $208;– A decrease in the current portion of long-term debt of $364 is attributed to the extinguishment of the debt due
to restructuring.
— These decreases are partially offset by increases in accounts payable and accrued expenses related to increases incosts related to the general operations of the Authority.
— Long-term liabilities increased by $2,692 primarily due to increases in:– Long-term debt of $976, due in part to the debt restructuring that took place in 2002. The net proceeds from
issuances were used to refund existing obligations and the acquisition of capital assets.– Obligations under capital leases of $1,682 related to sale-lease back transactions that took place between
September and December 2002 as part of the Authority’s cross-border leasing transactions.– The increases are partially offset by a decrease in estimated liability arising from injuries to persons.– The increase in long-term debt is part of the new debt restructuring that took place in 2002. The net proceeds
from these issuances were used to refund existing obligations and for the acquisition of capital assets. Theincrease in obligations under capital leases is derived from the sale/lease back transactions that took placebetween September 25, 2002 and December 19, 2002 as part of the Authority’s cross-border leasingtransactions.
18 M E T R O P O L I T A N T R A N S P O R T A T I O N A U T H O R I T Y
Management’s Discussion and AnalysisYears Ended December 31, 2003 and 2002

19
Total net assets, distinguishing among amounts invested in capital assets, net of related debt; restricted amounts; andunrestricted amounts
2003 2002 2001
Invested in capital assets, net of related debt $ 13,671 $ 13,891 $ 10,917Restricted for debt service 2,130 768 1,714Unrestricted 1,712 2,203 3,871
Total $ 17,513 $ 16,862 $ 16,502
December 31, 2003 versus 2002
At December 31, 2003, the total net assets increased by $651 over December 31, 2002. This increase is comprised ofoperating losses of $3,038; non-operating revenue of $2,266; and appropriations, grants, and other receipts exter-nally restricted for capital projects of $1,423.
Capital assets net of related debt decreased by $220 due mainly to the new capital asset acquisitions. Bond pro-ceeds available for capital expenditures were not entirely used and at December 31, a total of $455 of unexpendedproceeds was still outstanding.
Funds restricted for debt service increased by $1,362. This increase is derived from the 2002 bond restructuring andthe impact of new issuances that took place in 2003.
December 31, 2002 versus 2001
The total net assets increase of $360 during the year December 31, 2002 to December 31, 2001 is comprised ofoperating losses of $2,943, non-operating revenues of $1,637 and appropriations, grants, and other receipts exter-nally restricted for capital projects of $1,666.
Capital assets net of related debt increased by $2,974. This is primarily due to the acquisition of assets with fundsother than bond proceeds. The amount restricted for debt service decreased by $946. This decrease is related to thebond restructuring that took place in 2002. Under the terms of the new Bond Resolution, the Authority is no longerrequired to maintain debt service reserve funds.
Condensed Statements of Revenues, Expenses, and Changes in Net AssetsYear Ended December 31,
2003 2002 2001
Operating revenues $4,523 $4,053 $4,052
Operating expenses (7,561) (6,992) (6,714)
Operating loss (3,038) (2,939) (2,662)
Nonoperating revenues:Grants, appropriations, and taxes 2,395 2,097 2,051Interest on long-term debt (780) (558) (509)Other 634 61 (29)Subsidies 17 33 29
Total nonoperating revenues 2,266 1,633 1,542Appropriations, grants and other receiptsexternally restricted for capital projects 1,423 1,666 1,510
Change in net assets 651 360 390
Net assets–beginning of year 16,862 16,502 16,112
Net assets–end of period $17,513 $16,862 $16,502
Management’s Discussion and AnalysisYears Ended December 31, 2003 and 2002

20 M E T R O P O L I T A N T R A N S P O R T A T I O N A U T H O R I T Y
Revenues and Expenses, by Major Source:
December 31, 2003 versus 2002
• Revenues from fares and tolls for the twelve months ended December 31, 2003 were $470 higher than in thetwelve months ended December 31, 2002. This is primarily due to the commuter rail fare increase that went intoeffect on May 1, 2003, and the bridge and tunnel toll increase that went into effect on May 18, 2003.
— TBTA Bridge and tunnel tolls accounted for over 95 percent of their operating revenue. The 2003 increase of $129in Operating revenue at TBTA was related primarily to the toll increase that was implemented in May 2003, asthere was a decline in year-to-year traffic. The traffic decline was due in part to the unfavorable weather condi-tions at both the beginning and end of the year.
— Commuter Railroads operating revenue increased $85.3 in 2003 over 2002. Passenger revenues accounted for approxi-mately 92 percent or $80 of the increase in operating revenue. The passenger revenue increase is due primarily tofare increases that took place in May 2003 in New York and July 2003 in Connecticut. Ridership of the CommuterRailroads declined in 2003 from 2002 due to the economic slowdown, which continues to linger in the region, thefare increase and the unusually harsh weather, with the August blackout also being a contributing factor.
— NYCTA operating revenue from fares increased by $242 in 2003 over 2002 ($170 from subway operations and $72from bus operations). Ridership decreased by approximately 2.6 percent and 3.5 percent for subway and bus oper-ations, respectively. As is the case with other components of the Authority’s transportation system, the increaseis due primarily to the fare increase, as the region’s economy is having an adverse effect on ridership.
— SIRTOA and MSBA had fare revenue increases of $4 and $35 respectively in 2003 over 2002. These fare increases,too, are attributable in large part, to the May 2003 fare increases while the weak regional economy and theAugust 2003 blackout had a negative impact on revenue.
• Salaries and wages increased by $109 for the twelve months ended December 31, 2003 over 2002. The increase isprimarily attributed to contract settlements, unscheduled overtime expenses, the impact of the August 2003blackout, and general salary increases.
• Retirement and other employee benefits increased by $204. Pension contributions accounted for the majority ofthe increase. This is attributed to an increase in the salary base, pension contributions required because of thepoor investment portfolio performance and an increase in the rates charged by the NYS and NYC pension funds,and an increase in workers compensation liability.
• Depreciation expenses increased by $100 resulting from new capital assets being placed into service.
• The financial statements reflect $398 of revenues related to the settlement of all claims with the insurers forlosses incurred due to the events of September 11, 2001.
December 31, 2002 versus 2001
• The operating revenue increase of $1.0 in twelve months ending December 31, 2002 over the same period in2001 is primarily related to an increase in toll revenues which was partially offset by a decrease in commuter andmetro area fare revenue. Ridership overall posted a modest increase in 2002 due primarily to a slowdown of theregional economy post-September 11.
• Salaries and wages increased in the twelve months ending December 31, 2002 over 2001, principally due to con-tractual and managerial wage increases.
• Retirement and other employee benefits expenses increased commensurate with the higher salaries and wagesand were affected by the nationwide increase in health benefit costs and recalculated pension contributionsnecessitated by stock market losses.
• Depreciation expenses also increased primarily due to increases in the Authority’s capital program, and new capi-tal assets being placed in service.
• Capital contributions increased by $156 due to the availability of new funds for capital projects resulting fromthe debt restructuring.
Management’s Discussion and AnalysisYears Ended December 31, 2003 and 2002

21
4. Overall Financial Position and Results of Operations and Important Economic Conditions
Economic Conditions
Metropolitan New York is the most transit-intensive region in the United States. A financially sound and reliabletransportation system is critical to the region’s economic well being. The Authority’s business consists of urban sub-way and bus systems, suburban rail and bus systems, and bridge and tunnel facilities, all of which are affected bymany different economic forces. In order to achieve maximum efficiency and success in its operations, the Authoritymust identify economic trends and continually implement strategies to adapt to changing economic conditions.
While the National Bureau of Economic Research has declared that the national recession that began in March2001 ended in November 2001, the region – and New York City in particular – continued to experience the impactsof a longer and deeper economic slowdown through 2002 and into 2003. As discussed more fully below, Authority-wide ridership posted a modest increase in 2002 and a modest decrease in 2003. The adverse ridership trends,together with additional security costs (both capital and operating) and a worsening of the operating balance posi-tion, moved the Authority to increase fares and tolls in May 2003.
The Authority expects the City and regional economies to eventually follow the national economy; by the end of2003, there were indications that the regional recession has bottomed out. The regional recovery is expected to con-tinue gaining strength and gradually show growth during 2004 as the regional economy is expected to benefit fromthe rebuilding of the downtown infrastructure. Moreover, the regional economy will also benefit from the economicstimulus provided through the Authority’s multi-billion-dollar capital programs, which create an annual average of21,000 private sector jobs, $1,100 in wages, $100 in state and local tax revenues, and $2,500 in economic activity.
Results of Operations
Until September 11, 2001, growth in fare- and toll-paying customers was moderating due to slowing economictrends. The events of September 11 caused dramatic temporary, and wide-ranging long-term changes, throughout theNew York metropolitan area.
During 2002, total ridership on the MTA network of mass transit, including subway, bus, and commuter rails, was2.37 billion, up from 2.33 billion in 2001. Average weekday ridership was 7.71 million. NYCTA ridership totaled 2.18billion in 2002, the highest level since 1970. Subways carried 1.41 billion passengers and buses carried 762.1 mil-lion. LIRR ridership declined by 2.0 percent to 83.9 million due to the weak national economy and losses in the NewYork City job market. MNCR ridership increased slightly to 73.1 million. And despite the economic downturn andpost-September 11 traffic restrictions, a record 300 million vehicles used TBTA bridges and tunnels, a 2.2 percentincrease over 2001.
The following factors made for adverse customer usage during 2003: sluggish local economy; adverse weather con-ditions (above-average snowfalls during winter and record-breaking rainfalls particularly in the spring); the May 2003fare and toll increases; and the August 2003 blackout. During 2003, total ridership on the MTA network of masstransit, including subway, bus and commuter rails, was 2.31 billion, down from 2.37 billion in 2002. Average week-day ridership was 7.53 million, down from 7.71 million. NYCTA ridership totaled 2.12 billion in 2003, down from its30-year record high of 2.18 billion in 2002. Subways carried 1.38 billion passengers and buses carried 735 million,both down slightly from 2002. LIRR ridership declined by 3.6 percent to 80.9 million and MNCR ridership decreasedslightly from 73.1 million in 2002 to 72.5 million. TBTA bridges and tunnels were used by 297 million vehicles, downapproximately 1.0 percent.
The operating subsidies provided to the Authority in the form of dedicated taxes were relatively stable throughoutthe period. In order to assist the Authority in balancing its budget for calendar year 2002, the State advanced thepayment of a fifth quarter of Metropolitan Mass Transportation Operating Assistance Fund (“MMTOA”) Receipts sched-uled for the first quarter of calendar year 2003 into the fourth quarter of calendar year 2002 (approximately $231.6million). Currently, the Authority receives the equivalent of four quarters of MMTOA Receipts each year, with the firstquarter of each succeeding calendar year’s receipts similarly advanced. This results in little or no MMTOA Receipts
Management’s Discussion and AnalysisYears Ended December 31, 2003 and 2002

being received during the first quarter of each calendar year; the MTA has made other provisions to provide for cashliquidity during this period. There has been no change in the timing of the State’s payment of, or MTA’s receipt of,Dedicated Mass Transportation Trust Fund (“MTTF”) Receipts, which MTA anticipates will be sufficient to makemonthly principal and interest deposits into the Debt Service Fund.
Over the last few years, the mortgage recording taxes payable to the Authority have generally exceeded expecta-tions due primarily to the high level of home buying and refinancings caused by historically low interest rates. TheAuthority does not expect that its collection of mortgage recording taxes will continue at current high levels.
Capital Programs
Capital programs covering the years 2000-2004 have been approved by the MTA Board for (1) the commuter railroadoperations of the Authority conducted by LIRR and MNCR (as amended to December 31, 2003, the “2000-2004Commuter Capital Program”), (2) the transit system operated by the NYCTA and its subsidiary, MaBSTOA, and the railsystem operated by SIRTOA (as amended to December 31, 2003, the “2000-2004 Transit Capital Program”) and (3)the toll bridges and tunnels operated by TBTA (as amended to December 31, 2003, the “2000-2004 TBTA CapitalProgram”). The 2000-2004 TBTA Capital Program was effective upon adoption by the TBTA Board. The 2000-2004Commuter Capital Program and the 2000-2004 Transit Capital Program (collectively, the “2000-2004 MTA CapitalPrograms”) have been submitted to the Metropolitan Transportation Authority Capital Program Review Board (the“CPRB”).
The CPRB-approved 2000-2004 MTA Capital Programs and the TBTA 2000-2004 Capital Program provide for $18,936in capital expenditures, of which $10,161 relates to ongoing repairs of, and replacements to, the Transit Systemoperated by NYCTA and MaBSTOA and the rail system operated by SIRTOA, $3,594 relates to ongoing repairs of, andreplacements to, the commuter system operated by LIRR and MNCR, $3,182 relates to the expansion of existing railnetworks for both the transit and commuter systems to be managed by the MTA Capital Construction Company, $802relates to planning and design and customer service projects, $162 relates to World Trade Center repair projects, and$1,035 relates to the ongoing repairs of, and replacements to, TBTA bridge and tunnel facilities.
The combined funding sources for the approved 2000-2004 MTA Capital Programs and the TBTA 2000-2004 CapitalProgram include $7,853 in bonds, $4,882 in federal funds, $4,505 from the proceeds of the MTA/TBTA debt restruc-turing in 2002 and $1,696 from other sources.
The 2000-2004 MTA Board-approved amended Capital Programs (amended in December 2003), provide for $20,133in capital expenditures, including $19,104 for MTA Capital Programs, which include $1,325 for new Capital Companyprojects mostly to be funded by the federal government and $1,029 for TBTA Capital program. (Please see Note 1 forfurther discussion).
22 M E T R O P O L I T A N T R A N S P O R T A T I O N A U T H O R I T Y
Management’s Discussion and AnalysisYears ended December 31, 2003 and 2002

23
5. Currently Known Facts, Decisions, or Conditions
Corporate Reorganization
The Authority has proposed a plan of corporate restructuring and introduced legislation to effectuate that plan.Under the plan, the Authority would create the following five distinct companies under MTA’s governance:
• MTA Subways, would include NYCTA’s subway operations and SIRTOA,
• MTA Bus, would include NYCTA’s and MaBSTOA’s bus operations and MSBA, and could in the future include one ormore bus lines currently operated by private companies in the City and Westchester County,
• MTA Rail, would include LIRR and MNCR,
• MTA Bridges and Tunnels, will retain the corporate structure of TBTA, and
• MTA Capital Construction, a new company that would be in charge of overseeing the system expansion projectsfor all MTA companies.
This corporate restructuring along business lines is designed to streamline administrative functions and provide eachentity with a single transportation focus.
Certain aspects of the corporate restructuring can proceed without legislation. For example, a new MTA subsidiary,MTA Capital Construction Company (“MTA Capital Construction”), was created in July 2003. MTA Capital Constructionis responsible for the planning, design, and construction of current and future major MTA system expansion projects,including East Side Access (bringing LIRR into Grand Central Terminal), extension of the 7 subway line from TimesSquare to the west side of Manhattan, the Lower Manhattan Fulton Street Transit Center, the new South Ferry stationcomplex in lower Manhattan, system-wide capital security projects, and Second Avenue Subway. Initial funding forMTA Capital Construction in the amount of $2.5 was advanced from the MTAHQ operating budget and is expected tobe recovered from charge-backs to the capital programs.
Management’s Discussion and AnalysisYears Ended December 31, 2003 and 2002

24 M E T R O P O L I T A N T R A N S P O R T A T I O N A U T H O R I T Y
Consolidated Balance SheetsDecember 31, 2003 and 2002($ Millions)
2003 2002
AssetsCurrent Assets:
Cash (Note 3) $ 88 $ 84
Investments (Note 3) 1,613 1,802
Receivables:
Station maintenance, operation, and use assessments 91 88
State and regional mass transit taxes 51 31
Interest 3 7
Due from New York City 42 108
WTC insurance settlement (Note 11) 200 -
Other 353 383
Less allowance for doubtful accounts (32) (27)
Total receivables–net 708 590
Materials and supplies 263 263
Prepaid expenses and other current assets (Notes 2 and 4) 202 133
Total current assets 2,874 2,872
Noncurrent Assets:
Capital assets–net (Note 5) 31,555 29,079
Restricted investments held for lease obligations (Notes 3 and 7) 2,555 2,110
Investments (Note 3) 1,405 2,013
Receivable from New York State 2,375 1,984
Other noncurrent assets 1,265 1,710
Total noncurrent assets 39,155 36,896
Total assets $42,029 $39,768
See notes to financial statements. (continued)

25
Consolidated Balance SheetsDecember 31, 2003 and 2002
($ Millions)
2003 2002
Liabilities and Net AssetsCurrent Liabilities:
Accounts payable $ 675 $ 650
Accrued expenses:
Interest 204 201
Salaries, wages, and payroll taxes 138 185
Vacation and sick pay benefits 558 506
Current portion–retirement and death benefits 44 15
Current portion–estimated liability from injuries to persons (Note 8) 160 153
Other 177 69
Total accrued expenses 1,281 1,129
Current portion–long-term debt (Note 6) 214 45
Current portion–obligations under capital lease (Note 7) 7 7
Deferred revenue 207 270
Total current liabilities 2,384 2,101
Noncurrent Liabilities:
Retirement and death benefits (Note 4) 59 61
Estimated liability arising from injuries to persons (Note 8) 889 796
Long-term debt (Note 6) 17,713 16,269
Obligations under capital lease (Note 7) 2,724 2,287
Other long-term liabilities 747 1,392
Total noncurrent liabilities 22,132 20,805
Total liabilities 24,516 22,906
Net Assets:
Invested in capital assets, net of related debt 13,671 13,891
Restricted for debt service 2,130 768
Unrestricted 1,712 2,203
Total net assets 17,513 16,862
Total liabilities and net assets $42,029 $39,768
See notes to financial statements (concluded)

26 M E T R O P O L I T A N T R A N S P O R T A T I O N A U T H O R I T Y
Consolidated Statements of Revenues, Expenses, and Changes in Net AssetsYears Ended December 31, 2003 and 2002($ Millions)
2003 2002
Operating Revenues
Passenger and tolls $ 4,333 $ 3,912
Rents, freight, and sundry 190 141
Total operating revenues 4,523 4,053
Operating ExpensesSalaries and wages 3,544 3,435
Retirement and other employee benefits 1,375 1,171
Materials and supplies 416 410
Fuel and power 298 277
Computer, engineering and other consulting services 454 430
Public liability and claims 207 140
Depreciation and amortization 1,235 1,135
Other expenses 32 (6)
Total operating expenses 7,561 6,992
Operating loss $ (3,038) $ (2,939)
See notes to financial statements. (continued)

27
Consolidated Statements of Revenues, Expenses, and Changes in Net AssetsYears Ended December 31, 2003 and 2002
($ Millions)
2003 2002
Nonoperating RevenuesGrants, appropriations, and taxes:
Tax supported subsidies–NYS $ 1,592 $ 1,215
Tax supported subsidies–NYC and local 424 453
Operating subsidies–NYS 191 230
Operating subsidies–NYC and local 188 199
Total grants, appropriations and taxes 2,395 2,097
Operating subsidies recoverable from Connecticut Department of Transportation
related to New Haven Line 56 47
Subsidies paid to Dutchess, Orange and Rockland counties (20) (14)
Suburban Highway Transportation Fund subsidy (19) -
Interest on long-term debt (780) (558)
Station maintenance, operation and use assessments 125 117
Loss on disposal of subway cars (31) (58)
Unrealized loss on investment (18) (9)
WTC insurance settlement 398 -
Other nonoperating revenue 160 11
Net nonoperating revenues and expense 2,266 1,633
Loss before appropriations (772) (1,306)
Appropriations, grants, and other receipts externally restricted for capital projects 1,423 1,666
Change in net assets 651 360
Net assets, beginning of year 16,862 16,502
Net assets, end of period $17,513 $16,862
See notes to financial statements. (concluded)

28 M E T R O P O L I T A N T R A N S P O R T A T I O N A U T H O R I T Y
Consolidated Statements of Cash FlowsYears Ended December 31, 2003 and 2002($ Millions)
2003 2002
Cash Flows from Operating ActivitiesPassenger receipt/tolls $ 4,356 $ 3,937
Rents and other receipts (5) 212
Payroll and related fringe benefits (4,912) (4,546)
Other operating expenses (1,410) (1,276)
Net cash used in operating activities (1,971) (1,673)
Cash Flows from Noncapital Financial ActivitiesGrants, appropriations, and taxes 2,564 2,587
Operating subsidies from CDOT 56 49
Subsidies paid to Dutchess, Orange, and Rockland counties (14) (10)
MTA ELF special obligation bonds cash refunded (41)
Net cash provided by noncapital financing activities 2,606 2,585
Cash Flows from Capital and Related Financing ActivitiesMTA bond proceeds 1,277 9,138
MTA bonds refunded - (7,635)
MTA anticipation notes proceed 420 -
MTA anticipation note repayment (750) -
TBTA bond proceeds 761 4,116
TBTA bonds refunded - (4,613)
Proceeds from capital lease transactions 157 476
Capital lease payments (8) (5)
Loan repayment - (300)
Grants and appropriations 1,461 1,327
CDOT capital contributions 2 4
Capital expenditures (3,835) (4,488)
Debt service payments (928) (955)
Subsidies designated for debt service payments - 7
Net cash used in capital and related financing activities $ (1,443) $ (2,928)
See notes to financial statements. (continued)

29
Consolidated Statements of Cash FlowsYears Ended December 31, 2003 and 2002
($ Millions)
2003 2002
Cash Flows from Investing ActivitiesPurchase of securities–long-term $ (4,146) $ (7,343)
Sales of maturities of securities–long-term 3,794 5,229
Sales of short-term securities 1,118 3,994
Earnings on investments 46 142
Net cash provided by investing activities 812 2,022
Net increase in cash 4 6
Cash, beginning of year 84 78
Cash, end of period $ 88 $ 84
Reconciliation of Operating Deficit from Operations to Net Cash Used in Operating Activities
Operating loss $ (3,038) $ (2,939)
Adjustments to reconcile to net cash used in operating activities:
Depreciation and amortization 1,235 1,135
Net increase (decrease) in payables, accrued expenses
and other liabilities (248) (82)
Net (increase) decrease in receivables 128 181
Net (increase) decrease in materials and supplies and prepaid expenses (48) 32
Net cash used in operating activities $(1,971) $(1,673)
See notes to financial statements. (concluded)

1—Basis of Presentation
The Metropolitan Transportation Authority was established in 1965, under Section 1263 of the New York State PublicAuthorities Law, and is a public benefit corporation and a component unit of the State of New York (“NYS”) whosemission is to continue, develop, and improve public transportation and to develop and implement a unified publictransportation policy in the New York metropolitan area.
These consolidated financial statements are of the Metropolitan Transportation Authority, including its subsidiaryunits and its legally separate related groups (collectively, the “Authority”) as follows:
Metropolitan Transportation Authority and Related Groups
• Metropolitan Transportation Authority Headquarters (“MTAHQ”) provides support in budget, cashmanagement, finance, legal, real estate, treasury, risk and insurance management, and otherservices to the subsidiary and related groups listed below.
• The Long Island Rail Road Company (“LIRR”) provides passenger transportation between NewYork City (“NYC”) and Long Island.
• Metro-North Commuter Railroad Company (“MNCR”) provides passenger transportation betweenNYC and the suburban communities in Westchester, Dutchess, Putnam, Orange, and Rocklandcounties in NYS and New Haven and Fairfield counties in Connecticut.
• Staten Island Rapid Transit Operating Authority (“SIRTOA”) provides passenger transportationon Staten Island.
• Metropolitan Suburban Bus Authority (“MSBA”) provides public bus service in NYC and NassauCounty.
• MTA Excess Loss Trust Fund (“ELF”) provides coverage against losses from catastrophic eventsand provides budget stability in the event annual aggregate losses impact negatively upon theoperating budgets of its participants. ELF was terminated effective October 31, 2003, when itsassets were transferred to FMTAC, and FMTAC assumed responsibility for ELF’s past liabilities andissued a new policy covering similar claims.
• First Mutual Transportation Assurance Company (“FMTAC”) provides primary insurance coveragefor property losses, which are reinsured, and assumes reinsurance coverage for station liabilityand force account liability.
MTAHQ, LIRR, MNCR, SIRTOA, MSBA, ELF, and FMTAC collectively are referred to herein as MTA. LIRR and MNCR arereferred to collectively as the Commuter Railroads.
• New York City Transit Authority (“NYCTA”) and Manhattan and Bronx Surface Transit OperatingAuthority (“MaBSTOA”) provide subway and public bus service within the five boroughs of NewYork City.
• Triborough Bridge and Tunnel Authority (“TBTA”) operates seven toll bridges, two tunnels andthe Battery Parking Garage, all within the five boroughs of New York City.
The NYCTA and TBTA are operationally and legally independent of the Authority. These related groups enjoy certainrights typically associated with separate legal status including, in some cases, the ability to issue debt. However,they are included in the Authority’s financial statements because of the Authority’s financial accountability for theseentities and they are under the direction of the MTA board. Under accounting principles generally accepted in theUnited States of America (“GAAP”), the Authority is required to include these related groups in its financialstatements.
30 M E T R O P O L I T A N T R A N S P O R T A T I O N A U T H O R I T Y
Notes to Financial StatementsYears Ended December 31, 2003 and 2002($ Millions)

31
Notes to Financial StatementsYears Ended December 31, 2003 and 2002
($ Millions)
Capital ProgramThe Authority has ongoing capital programs, which except for TBTA are subject to the approval of the NYSMetropolitan Transportation Authority Capital Program Review Board (“CPRB”), and which are designed to improvepublic transportation in the New York Metropolitan area.
1995-1999 Capital ProgramIn November 1995, the Authority’s Board approved a proposed 1995-1999 Capital Program exclusive of TBTA totaling$11,929, which was increased in July 1997 to $12,169, when it was first approved by the CPRB. In September 1996,the Governor signed legislation to increase the current bonding authority for capital projects and approved addition-al changes to the provisions governing capital programs. In February 1999, the Authority’s Board approved certainchanges to the 1995-1999 Capital Program, raising the amount to $12,553. The March 1999 amendments have beenapproved by the CPRB. Since March 1999, the 1995-1999 program is tracked along with the 1992-1994 program andis updated whenever there is an amendment to the current program. The current approved 1992-1999 CapitalProgram, including TBTA, equals $18,088.
In November 1995, the Authority’s Board approved a proposed 1995-1999 Capital Program for TBTA totaling $665,which was increased in December 1997 to $669. In February 1999, this amount was increased to $670. The plandoes not require the approval of the CPRB.
At December 31, 2003, $17,923 had been committed and $17,101 has been expended for the 1992-1999 CapitalProgram for the Authority, including TBTA.
2000-2004 Capital ProgramThe 2000-2004 Capital Program exclusive of TBTA, initially totaling $16,462, was approved by the Authority’s Boardin September 1999. This plan was submitted to the CPRB for approval in October 1999, but was returned for revisionin December 1999. In April 2000, the Authority’s Board approved subsequent revisions to the proposed 2000-2004Capital Program, with total capital expenditures of $17,062. In May 2000, CPRB approved the $17,062 CapitalProgram. In February 2002 the CPRB approved the bonding resolution for restructuring debt that funds the 2000-2004 Capital Program. In February 2002, the Authority’s Board increased the 2000-2004 Capital Program to $17,224.The CPRB approved the increase in April 2002. In May 2002, the MTA Board increased the 2000-2004 CapitalProgram to $17,301. In December 2002, the Authority’s Board approved changes within and an increase to theTransit, Commuter and TBTA 2000-2004 programs totaling $591.2 for infrastructure and facilities security program.In February 2003, the MTA Board approved an amended 2000-2004 Capital Program of $17,901, exclusive of TBTA. InMay 2003 the $17,901 amended Capital Program was submitted to the CPRB and subsequently returned due to secu-rity funding concerns. The plan was resubmitted to the CPRB in June 2003 and approved on July 5, 2003. InDecember 2003 the MTA Board approved an amended 2000-2004 program of $19,104. This increase included $1,325for new Capital Company projects mostly funded by the federal government. This amended program has been submit-ted to the CPRB in January 2004.
In September 1999, the MTA Board approved a proposed 2000-2004 Capital Program for the TBTA that provides forapproximately $1,000 in capital expenditures. This plan does not require approval of the CPRB. In March 2000, theMTA Board increased the 2000-2004 Capital Program for TBTA to $1,025. In May 2002 the MTA Board increased theTBTA program again to $1,030 and in December 2002 to $1,036. In December 2003 the MTA board amended theTBTA capital program to $1,029.
At December 31, 2003, $13,856 had been committed and $6,797 has been expended for the 2000-2004 CapitalProgram for the Authority, including TBTA.
The federal government has a contingent equity interest in assets acquired by the Authority with federal funds,and upon disposal of such assets, the federal government may have a right to its share of the proceeds from thesale.

2—Significant Accounting Policies
In accordance with GASB Statement No. 20, Accounting and Financial Reporting for Proprietary Fund Accounting, theAuthority applies all applicable GASB pronouncements, as well as, Financial Accounting Standards Board (“FASB”)Statements and Interpretations issued on or before November 30, 1989, that do not conflict with GASB pronounce-ments. The Authority has elected not to apply FASB Standards issued after November 30, 1989.
Financial statements prepared in accordance with GAAP require the use of estimates made by management for cer-tain account balances and transactions. Actual results may differ from these estimates.
Basis of AccountingThe Authority follows enterprise fund and accrual basis of accounting, which is similar in presentation to privatebusiness enterprises.
Certain reclassifications have been made to the prior year financial statements to conform to the current yearpresentation.
InvestmentsThe Authority’s investment policies comply with the New York State Comptroller’s guidelines for such policies. Thosepolicies permit investments in, among others, obligations of the U.S. Treasury, its agencies and instrumentalities,and repurchase agreements secured by such obligations.
Investments maturing and expected to be utilized within a year of December 31 have been classified as currentassets in the financial statements.
All investments are recorded on the balance sheet at fair value and all investment income, including changes inthe fair value of investments, is reported as revenue on the statement of operations. Fair values have been deter-mined using quoted market values at September 30, 2003 and December 31, 2002.
Materials and SuppliesMaterials and supplies are valued principally at the lower of average cost or market value, net of obsolescencereserve.
Prepaid Expenses and Other Current AssetsPrepaid expenses and other current assets reflect advance payment of insurance premiums as well as farecard mediarelated with ticket machines, WebTickets and AirTrain tickets.
Capital AssetsProperties and equipment are carried at cost and are depreciated on a straight-line basis over estimated useful lives.Expenditures for maintenance and repairs are charged to operations as incurred.
Self-Insurance and Risk RetentionLIRR and MNCR are self-insured for liabilities arising from injuries to passengers, employees and others with theexception of injuries to non-employees and off-duty employees arising from occurrences at NYS stations (“StationLiability”), and employees and non-employees, arising from reimbursable project work (“Force Account”). LIRR andMNCR accrue the estimated total cost for the self-insured liability arising out of these claims. Claims arising fromStation Liability and Force Account occurring after December 15, 2002 are fully insured up to $7 per occurrence,claims arising December 15, 1997 to December 15, 2002 are insured up to $6, and claims arising prior to December15, 1997 are insured up to $5. NYCTA and TBTA are self-insured up to certain per-occurrence limits for liabilityclaims arising from injuries to persons, excluding employees. For claims arising after November 1, 2001, the limitsare $7 and $1.4 respectively; for claims arising between November 1, 1996 and October 31, 2001, the limits are $6and $1.2 respectively, and for claims arising between December 15, 1986 and October 31, 1996, the limits are$5, and $1 respectively.
32 M E T R O P O L I T A N T R A N S P O R T A T I O N A U T H O R I T Y
Notes to Financial StatementsYears Ended December 31, 2003 and 2002($ Millions)

33
Notes to Financial StatementsYears Ended December 31, 2003 and 2002
($ Millions)
ELF insured certain claims in excess of the self-insured retention limits for LIRR, MNCR, NYCTA, and TBTA notedabove, and in excess of $1.4 for MTAHQ ($1.2 for claims arising between November 1, 1996 and October 31, 2001and $1 for claims arising between December 15, 1986 and October 31, 1996). It received payments, as required bythe ELF self-insurance agreement, from the participating agencies to cover the actuarially computed amount requiredto pay claims, and fund operations.
On October 31, 2003, First Mutual Transportation Assurance Company (“FMTAC”), a subsidiary of MTA, assumed theexisting ELF program on both a retrospective and prospective basis. The retrospective portion contains the sameinsurance agreements, participant retentions and limits as existed under the ELF program for occurrences happeningon or before October 30, 2003. The coverage limit will remain $50 per occurrence or the proceeds of the programwhichever is less. On a prospective basis, FMTAC will issue insurance policies indemnifying the MTA, its subsidiariesand affiliates above their specifically assigned Self-Insured Retention with a limit of $50 per occurrence with $50annual aggregate. On December 12, 2003, the ELF transferred all assets and liabilities at historical cost to FMTAC.FMTAC will charge appropriate annual premiums based on loss experience and exposure analysis to maintain the fis-cal viability of the program. The operations of ELF for the period ended December 12, 2003 are consolidated in theStatements of Revenues, Expenses and Changes in Net Assets.
Effective October 31, 2003, an All-Agency Excess Liability Insurance Policy was renewed. This coverage affords theMTA and its subsidiaries and affiliates an additional limit of $150, for a total limit of $200 ($150 excess of $50). Incertain circumstances, when the ELF’s assets are exhausted due to payment of claims, the All-Agency Excess LiabilityInsurance will assume the ELF’s coverage position of $50.
Property and Casualty InsuranceFMTAC insured property damages or loss exposures in excess of $15 per occurrence, $30 annual aggregate, for claimsbrought by the MTA and its subsidiaries and affiliates until October 30, 2001. From October 31, 2001 to January 31,2002 coverage units were $500 per occurrence. By February 1, 2002, coverage limits were increased to $900. Thispolicy excludes coverage for acts of terrorism. Effective November 1, 2001, a stand-alone policy was purchased tocover sabotage and terrorism up to $70 in excess of a $30 self-insured retention.
Effective October 31, 2003, FMTAC insures property damages or loss exposures in excess of $25 per occurrence,$75 annual aggregate, up to a limit of $1 billion for claims brought by the MTA and its subsidiaries and affiliates.This policy excludes acts of terrorism. Effective November 1, 2003, a stand-alone policy was purchased to cover sab-otage and terrorism up to $100 in excess of a $25 self-insured retention. On November 26, 2002, with the enact-ment of the Terrorism Risk Insurance Act (“TRIA”) of 2002, any endorsements excluding certified acts of terrorismwere void if the act of terrorism is covered by TRIA. The stand-alone terrorism policy is structured to provide $100of coverage in excess of the $25 self-insured retention for all acts of terrorism or 10 percent of $1 billion for thoseacts covered by TRIA. FMTAC reinsures the majority of its property risks above the $25 retention.
Effective December 15, 2001, FMTAC reinsures the primary $7 in losses for Station Liability and Force AccountLiability for MNCR and LIRR with a third-party insurer. FMTAC established an aggregate blanket stop loss protectionagreement with the third party whereby if losses and allocated expenses retained by FMTAC exceed $45 for the insur-ance policy period ending December 15, 2002, a cover limit of $10 (inclusive of allocated expenses) is available. Thethird-party insurer will be responsible for paying all losses and allocated expenses within the cover limit. If thecover limit is exhausted, any additional losses and allocated expenses are payable by FMTAC. Effective December 15,2002, FMTAC directly insures the primary $7 in losses for Station Liability and Force Account Liability for MNCR andLIRR.
Operating RevenuesPassenger Revenue and TollsRevenues from the sale of tickets, tokens, electronic toll collection system, and farecards are recognized as incomeas they are used. Deferred revenue is recorded for the estimated amount of unused tickets, tokens, and farecards.

Nonoperating RevenuesOperating AssistanceThe Authority receives, subject to annual appropriation, NYS operating assistance funds that are generally recognizedas revenue when all applicable eligibility requirements are met. Generally, funds received under the NYS operatingassistance program are fully matched by contributions from NYC and the seven other counties within the Authority’sservice area.
NYS and Regional Mass Transit TaxesMTA, NYCTA, and SIRTOA receive, subject to annual appropriation, revenues from taxes enacted by the NYSLegislature. These taxes are recognized as revenue when all applicable eligibility requirements are met. Tax proceedsare distributed to the Authority as they are needed.
Mortgage Recording Taxes (“MRT”)Under NYS law, the Authority receives capital and operating assistance through a Mortgage Recording Tax (MRT-1),which is collected by NYC and the seven other counties within the Authority’s service area, at the rate of one-quar-ter of one percent of the debt secured by certain real estate mortgages. The Authority also receives an additionalMortgage Recording Tax (MRT-2) of one-quarter of one percent of certain mortgages secured by real estate improvedor to be improved by structures containing one to six dwelling units in the Authority’s service area. MRT-1 and MRT-2 taxes are recognized as revenue based upon reported amounts of taxes collected.
MRT-1 proceeds are initially used to pay MTAHQ’s operating expenses. Remaining funds, if any, are allocated 55percent to the NYCTA and SIRTOA and 45 percent to the Commuter Railroads. The Commuter Railroad portion is firstused to fund the NYS Suburban Highway Transportation Fund in an amount not to exceed $20 annually. In 2003 theamount allocated to the NYS Suburban Highway fund was $18.9. Until defeasance of MRT Bonds in November 2002,any funds remaining after this payment were used to pay the commuter portion of debt service on the MortgageRecording Tax Bonds (the “MRT Bonds”). Any funds remaining after meeting debt service requirements were to beused for operating and capital needs of the Commuter Railroads at the discretion of the Authority’s Board. Similarly,the NYCTA portion was used to pay the transit portion of debt service on the MRT Bonds. Any excess funds subse-quent to meeting debt service requirements were to be used for operating and capital needs of NYCTA at the discre-tion of the Authority’s Board. The MRT bonds were defeased in 2002, so there are currently no MRT bonds outstand-ing or contemplated. In 2003 the Authority provided NYCTA with $17.8 of MRT-1 funds.
The first $5 of the MRT-2 proceeds is transferred, to the MTA Dutchess, Orange, and Rockland Fund ($1.5 each forDutchess and Orange counties and $2 for Rockland County). Additionally, the Authority must transfer to eachCounty’s fund an amount equal to the product of (i) the percentage by which each respective County’s mortgagerecording tax payments to the Authority increased over such payments in 1989 and (ii) the base amount received byeach county as described above. Excess amounts transferable to the counties were $15.2 and $9.0 for 2003 and2002, respectively. Until MRT Bonds were defeased in November 2002, remaining funds, if any, were used to paydebt service on the MRT Bonds. Unexpended funds from MRT-2 of $122.5 and $133.0 at December 31, 2003 andDecember 31, 2002, respectively, are available to meet capital and operating needs, including debt service, of theCommuter Railroads and NYCTA, as determined by the Authority’s Board. During 2003 and 2002, the CommuterRailroads used $0, and $12.4, and NYCTA used $0 and $71.3, respectively, of MRT-2 funds to satisfy debt servicerequirements on the MRT bonds. Also, in 2003 the Authority distributed from the MRT-2 funds $81.5 to theCommuter Railroads and $178.6 to NYCTA for their current operations. In 2002 the Authority provided $50.0 of MRT-2 funds to TBTA. Of this amount, $17.3 was used for bond defeasance and $32.7 was used to satisfy debt servicefunds.
In addition, NYCTA receives operating assistance directly from NYC through a mortgage recording tax at the rateof five-eighths of one percent of the debt secured by certain real estate mortgages and through a property transfertax at the rate of one percent of certain properties’ assessed value (collectively referred to as “Urban TaxSubsidies”).
34 M E T R O P O L I T A N T R A N S P O R T A T I O N A U T H O R I T Y
Notes to Financial StatementsYears Ended December 31, 2003 and 2002($ Millions)

35
Notes to Financial StatementsYears Ended December 31, 2003 and 2002
($ Millions)
Dedicated TaxesUnder NYS law, subject to annual appropriation, the Authority receives operating assistance through a portion of theDedicated Mass Transportation Trust Fund (“MTTF”) and Metropolitan Mass Transportation Operating Assistance Fund(“MMTOA”). The MTTF receipts are comprised of a portion of the revenues derived from certain business privilegetaxes imposed by the State on petroleum businesses, a portion of the motor fuel tax on gasoline and diesel fuel,and a portion of certain motor vehicle fees, including registration and nonregistration fees. MTTF receipts areapplied first to meet certain debt service requirements of obligations and in the second instance are used to payoperating and capital costs. The MMTOA receipts comprise a quarter of one percent regional sales tax, a temporaryregional franchise tax surcharge, a portion of taxes on certain transportation and transmission companies, and anadditional portion of the business privilege tax imposed on petroleum businesses. MMTOA receipts, to the extentthat MTTF receipts are not sufficient to meet debt service requirements, will also be applied to certain debt serviceobligations, and secondly to operating and capital costs of the NYCTA, SIRTOA, and the Commuter System.
The State Legislature enacts in an annual budget bill for each state fiscal year an appropriation to the MTADedicated Tax Fund for the then current state fiscal year and an appropriation of the amounts projected by theDirector of the Budget of the State to be deposited in the MTA Dedicated Tax Fund for the next succeeding state fis-cal year. The assistance deposited into the MTTF is required by law to be allocated, after provision for debt serviceon Dedicated Tax Fund Bonds (see Note 6), 85 percent to NYCTA and SIRTOA and 15 percent to the CommuterRailroads. Revenues from this funding source are recognized based upon amounts of tax reported collected by NYS,to the extent of the appropriation.
Operating Subsidies Recoverable from Connecticut Department of Transportation (“CDOT”)The portion of the deficit from operations relating to MNCR’s New Haven line is recoverable from CDOT. Under theterms of a renewed Service Agreement, which began on January 1, 2000, and the 1998 resolution of an arbitrationproceeding initiated by the State of Connecticut, CDOT pays 100 percent of the net operating deficit of MNCR’sbranch lines in Connecticut (New Canaan, Danbury, and Waterbury), 65 percent of the New Haven mainline operatingdeficit, and a fixed fee for the New Haven line’s share of the net operating deficit of Grand Central Terminal (“GCT”)calculated using several years as a base, with annual increases for inflation and a one-time increase for the cost ofoperating GCT’s North End Access beginning in 1999. The Service Agreement also provides that CDOT pay 100 percentof the cost of non-movable capital assets located in Connecticut, 100 percent of movable capital assets to be usedprimarily on the branch lines and 65 percent of the cost of other movable capital assets allocated to the New Havenline. Remaining funding for New Haven line capital assets is provided by the Authority. The Service Agreement pro-vides for automatic five-year renewals. For a third consecutive time, the Service Agreement has been renewed for anadditional five years beginning January 1, 2000. Capital assets completely funded by CDOT are not reflected in thesefinancial statements, as ownership is retained by CDOT. The Service Agreement provides that final billings for eachyear are subject to audit by CDOT. Years subsequent to 2000 remain subject to final audit.
Interagency Subsidy–Triborough Bridge and Tunnel AuthorityNYS Law requires TBTA to transfer its annual operating surplus, as defined, to NYCTA and MTA. The initial $24 of theoperating surplus is provided to NYCTA and the balance, as adjusted to reflect debt service requirements of TBTAbonds issued for their respective benefit, was divided between NYCTA and MTA in their respective amounts of$178.3 and $251.8 recognized in 2003. In 2002, the amounts related to NYCTA and MTA were $103.9 and $144.2,respectively.
Certain TBTA investment income is transferred to MTA and is Board designated for use in acquiring or constructingcapital assets for the Commuter Railroads and NYCTA. MTA recognized $2.3 and $14.7 in 2003 and 2002, respective-ly, related to the TBTA investment income transfer.
Sale of New York ColiseumOn July 31, 2000, the Authority closed on the sale of the New York Coliseum. The sale contract price was approxi-mately $345, resulting in a gain on the sale of approximately $340. Proceeds from the sale were remitted to NYC

and are to be returned as contributions to the capital program, which NYC funds through issuance of its bonds. MTAhas recorded accounts receivable due from NYC of $42 and $108 at December 31, 2003 and December 31, 2002,respectively. MTA expects to receive the remainder of these funds in 2004.
Reimbursement of ExpensesThe cost of operating and maintaining the passenger stations of the Commuter Railroads in NYS is assessable by theAuthority to NYC and the other counties in which such stations are located for each NYS fiscal year ending March31, under provisions of the NYS Public Authorities Law. This funding is recognized as revenue based upon anamount, fixed by statute, for the costs to operate and maintain passenger stations and is revised annually by theincrease or decrease of the regional Consumer Price Index.
NYC no longer fully reimburses NYCTA for costs of the free fare program for students. However, pursuant to anagreement with NYS and NYC, NYCTA continued the student program beginning with the 1995-1996 school year withNYS and NYC each agreeing to pay $45. It is believed NYC will continue to provide for the continuation of the City’s$45 contribution for the 2003-2004 school year, of which $15 was received in December 2003. NYCTA’s AdoptedBudget assumes that the remaining $30 from NYC will be received in 2004. It is also assumed that the State’s full$45 for the 2003-2004 school year will be received in 2004. NYCTA’s 2004-2007 Financial Plan assumes the continua-tion of the joint funding of the free fare program for students.
Prior to April 1995, NYC was obligated to reimburse the NYCTA for the transit police force. As a result of the April1995 merger of the transit police force into the NYC Police Department, NYC no longer reimburses NYCTA for thecosts of policing the transit system on an ongoing basis since policing of the transit system is being carried out bythe NYC Police Department at NYC’s expense. NYCTA continues to be responsible for certain capital costs and supportservices related to such police activities, a portion of which is reimbursed by NYC. NYCTA received approximately$4.2 in 2003 and in 2002 from NYC for the reimbursement of transit police costs.
Federal law and regulations require a paratransit system for passengers who are not able to ride the buses andtrains because of their disabilities. Pursuant to an agreement between NYC and the MTA, NYCTA, effective July 1,1993, assumed operating responsibility for all paratransit service required in NYC by the Americans with DisabilitiesAct of 1990. NYC reimburses NYCTA for the lesser of 33 percent of net paratransit operating expenses defined aslabor, transportation and administrative costs less fare revenues and 6 percent of gross Urban Tax Subsidies or, anamount that is 20 percent greater than the amount paid by the City for the preceding calendar year. Fare revenueand NYC reimbursement aggregated approximately $36.5 in 2003 and $32.0 in 2002.
Grants and AppropriationsGrants and appropriations for capital projects are recorded when requests are submitted to the funding agencies forreimbursement of capital expenditures and beginning in 2001 were recorded as nonoperating revenues in accordancewith GASB Statement No. 33, Accounting and Financial Reporting for Nonexchange Transactions.
Recent Accounting PronouncementsThe Authority implemented GASB Statement No. 40, Deposit and Investment Risk Disclosure during the year endedDecember 31, 2003. The implementation of the standard resulted in new disclosure related to investment andcredit risk.
The Authority has not completed the process of evaluating the impact that will result from adopting GASBStatement No. 42, Accounting and Financial Reporting for Impairment of Capital Assets and for Insurance Recoveries.The Authority is therefore unable to disclose the impact that adopting this statement will have on its financial posi-tion and results of operations when such statement is adopted. GASB Statement No. 42 is effective for financialstatements for periods beginning after June 15, 2004 and December 15, 2004, respectively.
36 M E T R O P O L I T A N T R A N S P O R T A T I O N A U T H O R I T Y
Notes to Financial StatementsYears Ended December 31, 2003 and 2002($ Millions)

37
Notes to Financial StatementsYears Ended December 31, 2003 and 2002
($ Millions)
3—Cash and Investments
Cash, including deposits in transit, consists of the following at December 31, 2003 and 2002:
2003 2002_______________________________________________ ______________________________________________Carrying Bank Carrying BankAmount Balance Amount Balance
FDIC insured or collateralized deposits $21 $16 $54 $ 13Uninsured and not collateralized 67 22 30 195
Total $88 $38 $84 $208
All collateralized deposits are held by the Authority or its agent in the Authority’s name.The MTA, on behalf of the NYCTA, TBTA and MSBA, invests funds which are not immediately required for the
Authority’s operations in securities permitted by the State Public Authorities Law, including repurchase agreementscollateralized by U.S. Treasury securities, U.S. Treasury notes, and U.S. Treasury zero coupon bonds.
The MTA uninsured and uncollateralized deposits are primarily held by commercial banks in the Metropolitan NewYork area and are subject to the credit risks of those institutions.
Investments, at fair value, consist of the following at December 31, 2003 and 2002:
2003 2002
Repurchase agreements $ 983 $1,086U.S. Treasuries due 2003-2020 1,040 2,487Government National Mortgage Association due 2004-2021 – 21Investments restricted for capital lease obligations 2,555 2,229Other Agencies due 2005-2011 995 221
Total $5,573 $6,044
Fair values include accrued interest to the extent it is included in the carrying amounts. Accrued interest on invest-ments other than Treasury bills and coupons is included in other receivables on the balance sheet. The Authority’sinvestment policy states that securities underlying repurchase agreements must have a market value at least equalto the cost of the investment. The Authority’s investment policy restricts the Authority’s investments to Federal gov-ernment and agency securities.
In connection with certain lease transactions described in Note 7, MTA and TBTA have purchased securities orentered into payment undertaking, letter of credit or similar type agreements or instruments (Guaranteed InvestmentContracts) with financial institutions that have a credit rating of AAA by Standard and Poors, which generate suffi-cient proceeds to make payments under the terms of the leases. If the obligors do not perform, MTA or TBTA mayhave an obligation to make the related rent payments.
All investments are either insured or registered and held by the Authority or its agent in the Authority’s name.Investments had weighted average yields of 1.5 percent and 2.1 percent for the years ended December 31, 2003 andDecember 31, 2002, respectively.

Of the above cash and investments, amounts held for restricted purposes were as follows at December 31, 2003and 2002:
2003 2002
Construction or acquisition of capital assets $ 1,667 $ 1,983Funds received from affiliated agencies for investment 317 448Debt service 444 768Payment of claims 290 286Restricted for capital leases 2,555 2,110Other 130 130
Total $5,403 $5,725
4—Employee Benefits
Substantially all of the Authority’s related groups and pension plans have separately issued financial statements thatare publicly available and contain descriptions and supplemental information regarding employee benefit plans.These statements may be obtained by calling the administrative office of the respective related group.
Pension PlansThe Authority sponsors and participates in a number of pension plans for its employees. These plans are not compo-nent units of the Authority and are not included in the combined financial statements.
Defined Benefit Pension PlansSingle-Employer Public Employee Retirement SystemsThe Long Island Rail Road Company Pension Plan and the Long Island Rail Road Company Plan for AdditionalPensions (“Additional Plan”) are contributory, defined benefit pension plans that cover employees who began servicewith LIRR prior to January 1, 1988. Benefit provisions are established by LIRR and are based on length of qualifyingservice and final average compensation.
The TWU-MSBA Employees’ Pension Plan (“MSBA Plan”) is a contributory, defined benefit plan covering substan-tially all its employees who began service prior to January 23, 1983. Persons employed after that date are coveredby NYS Employees’ Retirement System (“NYSERS”). In 1999, the “MSBA Plan,” which was administered under terms ofthe TWU-MSBA Employees’ Pension Trust, was merged with the MTA Defined Benefit Plan and administered by theMTA.
The MaBSTOA Pension Plan is a defined benefit plan covering substantially all of its employees. This plan assignsauthority to amend the plan and determine contributions to the MaBSTOA Board.
During 2003 and 2002, NYCTA made additional contributions to the MaBSTOA Plan of $114.4 and $72.0, respec-tively, resulting in the recognition of a pension asset in the combined balance sheets.
SIRTOA has a contributory defined benefit plan that is a single-employer public employee retirement system cov-ering certain employees. Authority to amend the plan and to determine contributions rests with the MTA Board.
The Metropolitan Transportation Authority Defined Benefit Pension Plan (“MTA Plan”), a defined benefit pensionplan for certain LIRR and MNCR management employees hired after December 31, 1987, certain MSBA employeeshired prior to January 23, 1983, and MTA Police, is a cost-sharing multiple-employer retirement plan. LIRR, MNCRand MTA contribute to the MTA Plan, which offers distinct retirement, disability and death benefits for MNCR andLIRR management employees, MTA 20-year Police Retirement Plan and MSBA Employees’ Pension Plan. MTA Policecontribute to the MTA Plan at various rates. Annual pension costs and related information about this plan are pre-sented in the following table for all years presented as if the plan was a single-employer plan at the MTA level. Astand-alone financial report may be obtained by writing to the MTA Comptroller, 347 Madison Avenue, New York, NewYork, 10017.
38 M E T R O P O L I T A N T R A N S P O R T A T I O N A U T H O R I T Y
Notes to Financial StatementsYears Ended December 31, 2003 and 2002($ Millions)

39
Notes to Financial StatementsYears Ended December 31, 2003 and 2002
($ Millions)
LIRR, MNCR, MTA and MSBA recognized 2003 and 2002 pension expense based upon an assessment, which onaverage was 18.27 percent and 14.72 percent, respectively, of annual compensation. Also during 2003, LIRR andMNCR made additional contributions of $30 and $20 respectively, to decrease the unfunded pension liability. TheMTA Plan may be amended by the action of the MTA Board.
Annual pension costs and related information about each plan follows:
Single-Employer Plans
LIRR SIRTOA MaBSTOA MTA Plan
Required contribution rates:Plan members variable 3.00% variable variable
Employer: actuarially actuarially actuarially actuariallydetermined determined determined determined
Employer contributions made in 2003 $63.8 $ 1.6 $137.0 $27.1Three-year trend information:
Annual Pension Cost (APC):2003 $63.8 $ 1.6 $135.2 $28.22002 41.6 1.4 121.7 21.32001 34.6 1.4 114.2 16.5
Net Pension Obligation (NPO) (assets) at end of year:
2003 (4.7) None 58.9 (2.0)2002 (4.7) None 60.8 (3.1)2001 (2.2) None 62.6 (0.5)
Percentage of APC contributed:2003 100% 100% 101% 96%2002 106% 100% 102% 103%2001 93% 100% 102% 87%
Components of APCAnnual required contrib. (ARC) $63.9 $ 1.6 $137.0 $28.1Interest on NPO (0.4) – 5.0 (0.2)Adjustment of ARC (0.3) – 6.9 (0.3)
APC 63.8 1.6 135.1 28.2Contributions made 63.8 1.6 137.0 27.1
Change in NPO (assets) – – (1.9) 1.1NPO (assets) beginning of year (4.7) – 60.8 (3.1)
NPO (assets) end of year $ (4.7) $ – $ 58.9 $(2.0)
Date of valuation 1/1/2003 1/1/2003 1/1/2003 1/1/2003Actuarial cost method Entry age Entry age Entry age Entry age
normal normal normal normalfrozen initial frozen initial frozen initial
liability liability liabilityMethod to determine actuarial 5-year 5-year 5-year 5-year
value of plan assets smoothing smoothing smoothing smoothing
Investment return 8.50% 8.00% 8.25% 8.25%Projected salary increases 4.0% 4.0% – 11.0% 3.5% – 18.0% 3.0% – 36.2%
Consumer price inflation 3.75% 2.50% 2.50% 2.50%
Amortization method and period level dollar / level dollar / level dollar / level dollar /30 years 23 years 30 years 25 years
Period closed or open closed closed closed closed

40 M E T R O P O L I T A N T R A N S P O R T A T I O N A U T H O R I T Y
Notes to Financial StatementsYears Ended December 31, 2003 and 2002($ Millions)
Cost-Sharing Multiple-Employer PlansNew York City Employees’ Retirement System (“NYCERS”)
Plan DescriptionNYCTA and TBTA contribute to the New York City Employees’ Retirement System (NYCERS), a cost-sharing multiple-employer retirement system for employees of NYC and certain other governmental units. NYCERS combines features ofa defined benefit pension plan with those of a defined contribution pension plan. NYCERS provides pension benefitsto retired employees based on salary and length of service. In addition, NYCERS provides disability benefits, accidentbenefits, cost-of-living adjustments, and death benefits subject to satisfaction of certain service requirements andother provisions. The NYCERS Plan functions in accordance with existing NYS statutes and NYC laws and may beamended by action of the State Legislature. NYCERS issues a publicly available comprehensive annual financial reportthat includes financial statements and required supplementary information. That report may be obtained by writing tothe New York City Employees’ Retirement System, 335 Adams Street, Suite 2300, Brooklyn, New York 11201.
Funding PolicyNYCERS is a noncontributory plan, except for employees who entered qualifying service after July 1976, who con-tribute 3 percent of their salary. The State legislature passed legislation in 2000 that suspends the 3 percent contri-bution for employees who have 10 years or more of credited service. The NYCTA and TBTA are required to contributeat an actuarially determined rate. The contribution requirements of plan members and NYCTA and TBTA are estab-lished and amended by law. NYCTA’s contributions to NYCERS for the years ended December 31, 2003, and 2002 were$68.8 and $30.7, respectively. These amounts cover NYCTA’s annual required contribution for the NYCERS 2003 and2002 fiscal years as well as a portion of the annual required contribution for the 2004 NYCERS fiscal year. These pay-ments cover NYCTA’s annual required contributions for the NYCERS 2003 and 2002 fiscal years ended June 30, as wellas a portion of the annual required contribution for the 2003 NYCERS fiscal year. The remainder of the 2004 annualrequired contribution is expected to be paid subsequent to year-end within the NYCERS fiscal year. TBTA’s contribu-tions to NYCERS for the years ended December 31, 2003, and 2002 were $1.0, and $1.0, respectively, which wereequal to or in excess of the actuary’s recommendation, plus interest.
Prior to 1981, NYCTA and TBTA were required to pay NYCERS its share of the pension liability on a two-year lagbasis. Due to a change in New York State law, the NYCTA and TBTA in 1981 were required to make pension liabilitypayments on a current year basis. The amount representing the “catch-up” liability remaining was included in theconsolidated balance sheets in accrued retirement and death benefits. However, in accordance with Chapter 85 ofthe New York State laws of 2000 (the “Laws of 2000”), enacted as part of a number of changes to actuarial assump-tions and methods, this liability is no longer being funded separately as part of actuarially determined pension con-tributions and a liability on the part of the NYCTA and TBTA separate from its actuarially determined pension contri-butions no longer exists. Accordingly, the amount of the recorded catch-up liability and related receivable from theNYCTA for the portion of the catch-up liability applicable to capital project engineers was reduced to zero as ofDecember 31, 2000, with the net effect of such elimination of $236.8 recorded as a nonoperating transaction in theconsolidated statements of operations and surplus.
New York State Employees’ Retirement System (“NYSERS”)
Plan Description and Funding PolicyMTAHQ and MSBA employees who were hired after January 23, 1983, are members of NYSERS. NYSERS is a cost-sharingmultiple-employer plan and offers a broad spectrum of benefits including retirement and disability benefits. Generally,employees contribute 3 percent of salary. In 2000, the State legislature passed legislation that suspends the 3 percentcontribution of members who have 10 or more years of credited service. MTAHQ and MSBA recognize pension expensebased upon annual assessments made by NYSERS. NYSERS pension expense was approximately $4.9, $1.5, and $1.2, forthe years ended December 31, 2003, 2002, and 2001, respectively, and was equal to the annual required contributionsfor each year. Further information about the plan is more fully described in the publicly available statement of NYSERSand may be obtained by writing to New York State and Local Retirement System, Office of the State Comptroller, 110State Street, Albany, New York, 12244-0001.

41
Notes to Financial StatementsYears Ended December 31, 2003 and 2002
($ Millions)
Defined Contribution PlansThe MTA also provides retirement benefits to certain of its employees under the following defined-contributionplans:
Single-Employer Public Employee Retirement SystemsThe Long Island Rail Road Company Money Purchase Plan (“Money Purchase Plan”) is a defined contribu-tion plan that covers all employees who began service with LIRR after December 31, 1987. Employees par-ticipating in the plan contribute 3 percent of their compensation and LIRR contributes 4 percent of theircompensation. The Plan is administered by the LIRR Board of Managers of Pension. The MTA Board ofDirectors is responsible for establishing or amending the Plan’s provision and contribution requirements.
The Metro-North Commuter Railroad Company Defined Contribution Pension Plan for AgreementEmployees (“Agreement Plan”), established January 1, 1988, covers union-represented employees in accor-dance with applicable collective bargaining agreements. Under this plan, MNCR will contribute an amountequal to 4 percent of each eligible employee’s gross compensation to the plan on that employee’s behalf.For employees who have 19 or more years of service, MNCR contributes 7 percent. In addition, employeesmay voluntarily match MNCR’s contribution to the plan, on an after-tax basis. The Plan is administered byan employee of Metro-North Commuter Railroad and the Metro-North Board of Managers of Pension. TheMTA Board of Directors is responsible for establishing or amending the Plan’s provision and contributionrequirements.
2003 2002__________________________________________________________ __________________________________________________________
LIRR MNCR LIRR MNCRMoney Purchase Agreement Money Purchase Agreement
Plan Plan Plan Plan
Employer contributions $10.9 $16.2 $9.6 $17.4
Employee contributions 6.7 1.2 5.9 1.2
Deferred Compensation PlansAs permitted by Internal Revenue Code Section 457, the Authority has established a trust or custodial account tohold plan assets for the exclusive use of the participants and their beneficiaries. Plan assets and liabilities are notreflected on the Authority’s combined balance sheets.
Certain Authority employees are participants in a second deferred compensation plan established in accordancewith Internal Revenue Code Section 401(k). Participation in the plan is available to all nonunion and certain otheremployees. All amounts of compensation deferred under the plan, and all income attributable to such compensation,are solely the property of the participants; accordingly, this plan is not reflected in the accompanying combined bal-ance sheets.

Other Post-Employment BenefitsIn addition to providing pension benefits, the Authority provides healthcare, life insurance, and survivor benefits forcertain retired employees and their families. These benefits are recorded on a pay-as-you-go basis. The Authority isstatutorily required to provide such benefits. The cost of the benefits is shared in varying proportions by theemployer and employee. The number of retirees and costs of providing the benefits by the Authority follows:
2003 2002________________________________________________________ _________________________________________________________
Number of Cost of Number of Cost ofParticipants Benefits Participants Benefits
(Actual) (in millions) (Actual) (in millions)
MTAHQ 253 $ 1.9 204 $ 1.4MNCR 1,506 2.7 1,421 2.3LIRR:
Management 730 6.5 725 5.4Represented 4,107 19.3 3,982 13.9
NYCTA 30,846 162.6 31,350 127.9TBTA 1,366 8.6 1,314 6.7SIRTOA 51 0.2 40 0.2MSBA 86 0.8 91 0.7
5—Capital Assets
Capital assets and improvements include all land, buildings, equipment, and infrastructure of the Authority having aminimum useful life of two years, having a cost of more than $.025.
Capital assets are generally stated at historical cost, or at estimated historical cost based on appraisals or onother acceptable methods when historical cost is not available. Capital leases are classified as capital assets inamounts equal to the lesser of the fair market value or the present value of net minimum lease payments at theinception of the lease.
Accumulated depreciation and amortization are reported as reductions of fixed assets. Depreciation is computedusing the straight-line method based upon estimated useful lives of 25 to 50 years for buildings; 2 to 40 years forequipment; and 25 to 100 years for infrastructure. Capital lease assets and leasehold improvements are amortizedover the term of the lease or the life of the asset whichever is less.
42 M E T R O P O L I T A N T R A N S P O R T A T I O N A U T H O R I T Y
Notes to Financial StatementsYears Ended December 31, 2003 and 2002($ Millions)

43
Notes to Financial StatementsYears Ended December 31, 2003 and 2002
($ Millions)
Capital assets consist of the following at December 31, 2003 and 2002:
Balance Balance BalanceDecember 31, December 31, December 31,
2001 Additions Deletions 2002 Additions Deletions 2003
Capital assets, not being depreciated
Land $ 122 $ 2 $ – $ 124 $ – $ – $ 124Construction work-in-
progress 4,386 1,716 726 5,376 1,315 1,671 5,020
Total capital assets, notbeing depreciated 4,508 1,718 726 5,500 1,315 1,671 5,144
Capital assets, being depreciatedBuildings and structures 8,584 693 10 9,267 815 34 10,048Bridges and tunnels 1,169 14 – 1,183 167 – 1,350Equipment
Passenger cars andlocomotives 5,914 1,123 111 6,926 1,127 100 7,953
Buses 1,531 42 1 1,572 166 – 1,738Infrastructure 7,953 635 28 8,560 1,196 13 9,743Other 5,403 621 7 6,017 755 68 6,704
Total capital assets, beingdepreciated 30,554 3,128 157 33,525 4,226 215 37,536
Less accumulated depreciationBuildings and structures 1,943 280 2 2,221 313 1 2,533Bridges and tunnels 305 10 – 315 11 – 326Equipment
Passenger cars andlocomotives 2,076 220 59 2,237 248 72 2,413
Buses 839 93 – 932 97 – 1,029Infrastructure 1,939 290 13 2,216 291 7 2,500Other 1,774 256 5 2,025 301 2 2,324
Total accumulated depreciation 8,876 1,149 79 9,946 1,261 82 11,125
Total capital assets, beingdepreciated, net 21,678 1,979 78 23,579 2,965 133 26,411
Capital assets, net $26,186 $3,697 $804 $29,079 $4,280 $1,804 $31,555
Interest capitalized in conjunction with the construction of capital assets at December 31, 2003 and 2002 is $27and $81, respectively.
Capital assets acquired prior to April 1982 for NYCTA were funded primarily by NYC with capital grants made avail-able to NYCTA. NYC has title to a substantial portion of such assets and, accordingly, these assets are not recordedon the books of NYCTA. Subsequent acquisitions, which are part of the MTA Capital Program, are recorded at cost byNYCTA. In certain instances, title to TBTA’s real property may revert to NYC in the event TBTA determines such prop-erty is unnecessary for its corporate purpose. NYCTA scrapped 296 “redbird” subway cars and 405 cars in the yearending December 31, 2003 and the year ending December 31, 2002, respectively. Loss on disposal of capital assetsof $30.7 and $58.3 were recorded for the year ended December 31, 2003 and the year ended December 31, 2002,respectively. The NYCTA concluded the fleet disposal program in 2003.
For certain construction projects, the Authority holds in a trust account marketable securities pledged by third-party contractors in lieu of cash retainages. At December 31, 2003 and December 31, 2002 these securities totaled$56.5 and $67.3, respectively, and had a market value of $58.8 and $68.5 respectively, and are not included inthese financial statements.

6—Long-Term Debt
Substantially all of the outstanding debt of MTA, TBTA and the Transit Authority was restructured during 2002 byconsolidating most existing credits into four principal new credits:
• MTA Transportation Revenue Bonds,• MTA State Service Contract Bonds,• MTA Dedicated Tax Fund Bonds, and• TBTA General Revenue Bonds and TBTA Subordinate Revenue Bonds.
MTA, TBTA and the NYCTA used the proceeds of bonds issued under the new resolutions, together with other avail-able monies, to fully defease the resolutions and/or trust agreements relating to the following bonds and notes:
• MTA Transit Facilities Revenue Bonds and Bond Anticipation Notes,• MTA Commuter Facilities Revenue Bonds and Bond Anticipation Notes,• MTA Subordinated Commuter Facilities Revenue Bonds (Grand Central Terminal Redevelopment
Project),• New York City Transit Authority Subordinated Transit Facilities Revenue Bonds (Livingston Plaza
Project),• MTA Transit Facilities Service Contract Bonds (1982 and 1987 Resolutions),• MTA Commuter Facilities Service Contract Bonds (1982 and 1987 Resolutions),• MTA Dedicated Tax Fund Bonds,• TBTA Special Obligation Bonds (1991 Resolution), and• TBTA Beneficial Interest Certificates.
Following the defeasance of the old bonds, notes and lease obligations, approximately $1,100 in debt servicereserves were released to MTA, TBTA and the NYCTA to be used primarily to finance transit and commuter rail capitalprojects.
In a separate transaction, on December 19, 2002, MTA defeased the MTA Excess Loss Fund Special ObligationBonds, Series 1998.
44 M E T R O P O L I T A N T R A N S P O R T A T I O N A U T H O R I T Y
Notes to Financial StatementsYears Ended December 31, 2003 and 2002($ Millions)
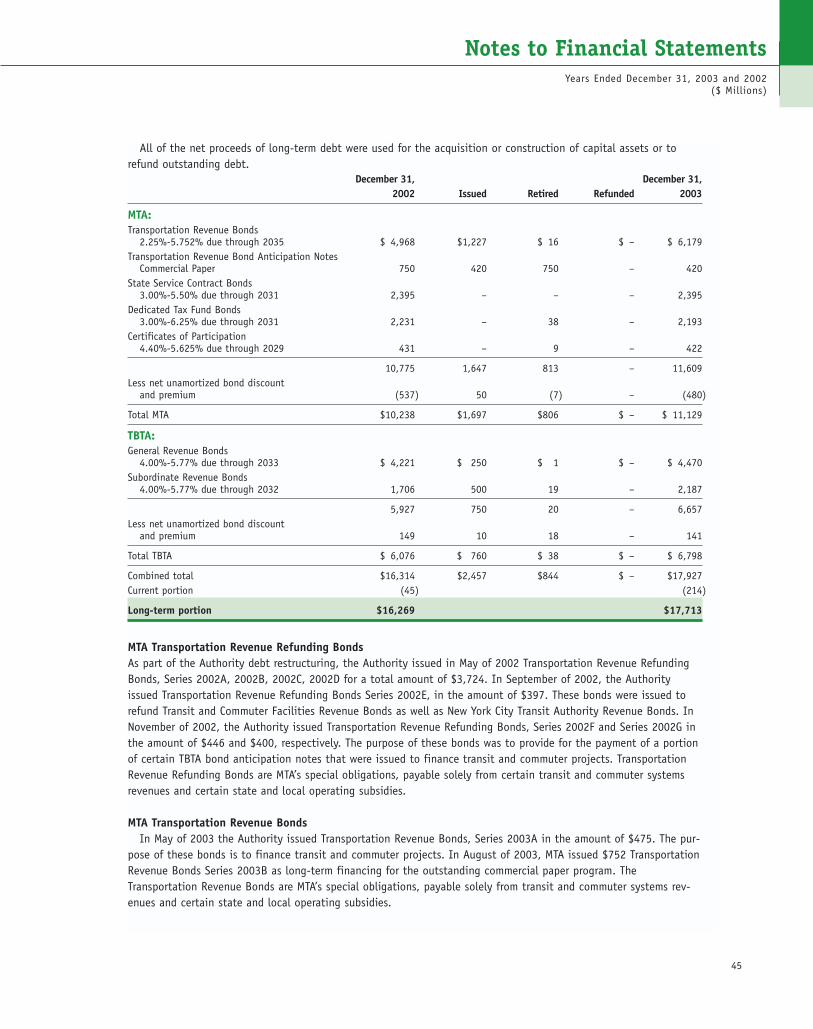
45
Notes to Financial StatementsYears Ended December 31, 2003 and 2002
($ Millions)
All of the net proceeds of long-term debt were used for the acquisition or construction of capital assets or torefund outstanding debt.
December 31, December 31,2002 Issued Retired Refunded 2003
MTA:Transportation Revenue Bonds
2.25%-5.752% due through 2035 $ 4,968 $1,227 $ 16 $ – $ 6,179Transportation Revenue Bond Anticipation Notes
Commercial Paper 750 420 750 – 420State Service Contract Bonds
3.00%-5.50% due through 2031 2,395 – – – 2,395Dedicated Tax Fund Bonds
3.00%-6.25% due through 2031 2,231 – 38 – 2,193Certificates of Participation
4.40%-5.625% due through 2029 431 – 9 – 422
10,775 1,647 813 – 11,609Less net unamortized bond discount
and premium (537) 50 (7) – (480)
Total MTA $10,238 $1,697 $806 $ – $ 11,129
TBTA:General Revenue Bonds
4.00%-5.77% due through 2033 $ 4,221 $ 250 $ 1 $ – $ 4,470Subordinate Revenue Bonds
4.00%-5.77% due through 2032 1,706 500 19 – 2,187
5,927 750 20 – 6,657Less net unamortized bond discount
and premium 149 10 18 – 141
Total TBTA $ 6,076 $ 760 $ 38 $ – $ 6,798
Combined total $16,314 $2,457 $844 $ – $17,927Current portion (45) (214)
Long-term portion $16,269 $17,713
MTA Transportation Revenue Refunding BondsAs part of the Authority debt restructuring, the Authority issued in May of 2002 Transportation Revenue RefundingBonds, Series 2002A, 2002B, 2002C, 2002D for a total amount of $3,724. In September of 2002, the Authorityissued Transportation Revenue Refunding Bonds Series 2002E, in the amount of $397. These bonds were issued torefund Transit and Commuter Facilities Revenue Bonds as well as New York City Transit Authority Revenue Bonds. InNovember of 2002, the Authority issued Transportation Revenue Refunding Bonds, Series 2002F and Series 2002G inthe amount of $446 and $400, respectively. The purpose of these bonds was to provide for the payment of a portionof certain TBTA bond anticipation notes that were issued to finance transit and commuter projects. TransportationRevenue Refunding Bonds are MTA’s special obligations, payable solely from certain transit and commuter systemsrevenues and certain state and local operating subsidies.
MTA Transportation Revenue BondsIn May of 2003 the Authority issued Transportation Revenue Bonds, Series 2003A in the amount of $475. The pur-
pose of these bonds is to finance transit and commuter projects. In August of 2003, MTA issued $752 TransportationRevenue Bonds Series 2003B as long-term financing for the outstanding commercial paper program. TheTransportation Revenue Bonds are MTA’s special obligations, payable solely from transit and commuter systems rev-enues and certain state and local operating subsidies.

MTA Bond Anticipation NotesIn 2002, MTA Transit and Commuter Facilities Special Obligation Bond Anticipation Notes were reissued under thenew MTA Transportation Bond Resolution. The interest rate payable on the notes depends on the maturity and mar-ket conditions at the time of issuance. At December 31, 2002, the average rate on the outstanding notes was 1.3percent. Payment of principal and interest on the notes were additionally secured by a letter of credit issued by abank. In August 2003, MTA issued $752 of Transportation Revenue Bonds, Series 2003B to pay at the respectivematurity date all of MTA’s Bond Anticipation Notes. The MTA Act requires MTA to periodically refund its commercialpaper notes with bonds. As of December 31, 2003 the Bond Anticipation Notes reissued in 2002 in the amount of$750 were all paid. In October 2003, MTA issued new Bond Anticipation Notes in the amount of $420, in accordancewith the terms and provisions of the General Resolution authorizing Transportation Revenue Obligations adopted onMarch 26, 2002. Payment of principal and interest is also secured by an irrevocable Letter of Credit issued by ABNAMRO bank.
MTA State Service Contract BondsIn June of 2002, the Authority issued State Service Contract Refunding Bonds, Series 2002A, in the amount of$1,716 to refund outstanding service contract bonds issued by MTA. Also in June of 2002, the Authority issued StateService Contract Bonds, Series 2002B, in the amount of $679 to finance certain transit and commuter projects. TheSeries 2002A and 2002B are MTA’s special obligations, payable solely from certain payments from the State of NewYork under a service contract.
MTA Dedicated Tax Fund BondsThese bonds are payable solely from and secured by monies held in the Pledged Amounts Account of the MTADedicated Tax Fund. State law requires that a portion of the revenues derived from certain business privilege taxesimposed by the State on petroleum businesses, as well as certain special taxes, including a regional sales tax, atemporary regional franchise tax surcharge, a portion of a tax on certain companies and a portion of the businessprivilege tax imposed by the State on petroleum businesses, be deposited, subject to appropriation by the StateLegislature, into the MTA Dedicated Tax Fund.
In 2002, the Authority as part of its debt restructuring defeased all series from 1996A to 2000A by issuingDedicated Tax Bond Series 2002A in the amount of $1,247 and Dedicated Tax Bond Series 2002B in the amount of $440.
On March 10, 2004, the Authority issued Dedicated Tax Fund Bonds Series 2004A in the amount of $250 andSeries 2004B in the amount of $500 to finance certain transit and commuter projects operated by MTA’s affiliatesand subsidiaries. The 2004B bonds are issued as auction rate securities.
MTA Certificates of ParticipationIn June 1999, the Authority issued fixed-rate Serial and Term Certificates, Series 1999A, in the amount of $328,which represent proportionate interests in the principal and interest components of Base Rent paid severally, but notjointly, in their respective proportionate shares by NYCTA, MTA, and TBTA, pursuant to a Leasehold ImprovementSublease Agreement, dated June 1, 1999. These certificates were issued to finance certain building and leaseholdimprovements to an office building in Manhattan, occupied by NYCTA and TBTA.
In June 2000, additional Certificates of Participation, Series 2000A, in the amount of $121 were executed anddelivered to finance additional improvements at 2 Broadway (See Note 7).
TBTA General Revenue BondsIn March 2002, TBTA issued General Purpose Revenue Bonds, Series 2002A in the amount of $268. These bonds wereissued to finance certain improvements to TBTA’s bridges and tunnels. In October 2002, TBTA issued General RevenueRefunding Bonds, Series 2002B in the amount of $2,157, and General Revenue Variable Rate Refunding Bonds, Series2002C in the amount of $103. These bonds were issued to refund TBTA bonds issued under the old resolutions. InOctober 2002, TBTA substituted the TBTA General Revenue Bond Resolution (the Senior Resolution) for TBTA General
46 M E T R O P O L I T A N T R A N S P O R T A T I O N A U T H O R I T Y
Notes to Financial StatementsYears Ended December 31, 2003 and 2002($ Millions)

47
Notes to Financial StatementsYears Ended December 31, 2003 and 2002
($ Millions)
Purpose Revenue Bond Resolution adopted in 1980 as the resolution securing $24 General Purpose Revenue Bonds,Series EFC1996A; $1,126 General Purpose Revenue Bonds, Series 2001A; $296 General Purpose Revenue Bonds, Series2001B and 2001C; and $268 General Purpose Revenue Bonds, Series 2002A. In November 2002, TBTA issued $246General Revenue Refunding Bonds, Series F. These bonds were issued to refund TBTA bonds issued under the oldresolutions. These series are general obligations of TBTA, payable generally from the net revenues collected on thebridges and tunnels operated by TBTA. In 2003 TBTA issued $250 General Revenue Variable Rate Bonds, Series2003B, to finance certain improvements on bridges and tunnels.
TBTA Subordinate Revenue BondsIn October 2002, TBTA issued $262 Subordinate Revenue Variable Rate Refunding Bonds, Series 2002D. In November2002, TBTA issued $756 Subordinate Revenue Refunding Bonds, Series 2002E and $181 Subordinate Revenue VariableRate Refunding Bonds, Series 2002G. These bonds were issued to refund TBTA bonds issued under the old resolu-tions. In October 2002, TBTA substituted the Subordinate Revenue Resolution for the TBTA 1991 Special ObligationBond Resolution as the resolution securing $508 Special Obligation Variable Rate Refunding Bonds (1991 Resolution)Series 2002A-D. These series are special obligations of TBTA, payable generally from the net revenues collected onthe bridges and tunnels operated by TBTA after the payment of operating expenses and debt services as required byTBTA’s Senior Resolution. In March 2003, TBTA issued $500 Subordinate Revenue Bonds, Series 2003A. These bondswere issued to finance transit and commuter projects, and are special obligations of TBTA, payable generally fromthe net revenues collected on the bridges and tunnels operated by TBTA after the payment of operating expensesand debt services as required by TBTA’s Senior Resolution.
Debt LimitationThe NYS Legislature has imposed limitations on the aggregate amount of debt that the Authority and TBTA can issueto fund the approved transit and commuter capital programs. For the 1992 through 2004 Capital Programs, theimposed limitation, subject to certain exclusions, is $16,500 compared with issuances totaling approximately $8,728at December 31, 2003.
Bond RefundingsDuring 2002 and as part of the Debt Restructuring, the Authority retired most of the outstanding debt of MTA, TBTA,and NYCTA with either funds available or by issuing new bonds, the proceeds of which were used to purchase U.S.Treasury obligations that were placed in irrevocable trusts. The principal and interest within the trusts will be usedto repay the refunded debt. The trust account assets and the refunded debt are excluded from the consolidatedbalance sheets.
In accordance with GASB Statement No. 23, Accounting and Financial Reporting for Refundings of Debt Reported byProprietary Activities, gains or losses resulting from debt refundings have been deferred and will be amortized overthe lesser of the remaining life of the old debt or the life of the new debt.
The debt refundings resulted in an economic loss of approximately $57 and an increase in future debt service cashflow of $4,283. The economic loss is defined as the present value of the increase in future debt service cash flows.
During 2003 the Authority completed escrow restructurings of the TBTA Subordinate Revenue Bonds Series 2002E,TBTA General Revenue Bonds Series 2002B, TBTA Subordinate Revenue Bonds Series 2002G, MTA Dedicated Tax FundBonds Series 2002A, MTA Transportation Revenue Bonds Series 2002E, and MTA Transportation Revenue Series 2002A.These restructurings resulted in a gross benefit of approximately $56.

At December 31, 2003, the following amounts of Authority bonds, which have been refunded, remain valid debtinstruments and are secured solely by and payable solely from their respective irrevocable trusts.
MTA Transit and Commuter Facilities:Transit Facilities Revenue Bonds $ 2,057Commuter Facilities Revenue Bonds 1,846Commuter Facilities Subordinate Revenue Bonds 81Transit and Commuter Facilities Service Contract Bonds 1,057Dedicated Tax Fund Bonds 1,455Excess Loss Trust Fund 35
NYCTA:Transit Facilities Revenue Bonds (Livingston Plaza Project) 137
TBTA:Beneficial Interest Certificates 19General Purpose Revenue Bonds 2,600Special Obligation Subordinate Bonds 235Mortgage Recording Tax Bonds 283
Total $9,805
Debt Service PaymentsPrincipal and interest debt service payments (excluding refunded bonds) at December 31, 2003, are as follows:
MTA TBTA Aggregate___________________ __________________________________________Senior Revenue Subordinate Revenue Debt Service___________________ ___________________ ___________________
Principal Interest Principal Interest Principal Interest Principal Interest
2004 $ 179 $ 546 $ 39 $ 219 $ 33 $ 108 $ 251 $ 8732005 205 538 77 217 35 106 317 8612006 212 529 81 213 36 105 329 8472007 218 520 78 210 38 103 334 8332008 226 511 88 206 39 102 353 8192009-2013 1,297 2,388 491 959 234 470 2,022 3,8172014-2018 1,654 2,027 650 806 330 398 2,634 3,2312019-2023 2,118 1,562 810 624 430 305 3,358 2,4912024-2028 2,696 979 962 402 518 195 4,176 1,5762029-2033 2,385 260 1,194 122 494 59 4,073 4412034-2038 – – – – – – – –
$11,190 $ 9,860 $ 4,470 $ 3,978 $ 2,187 $ 1,951 $17,847 $15,789
The above interest amounts include both fixed and variable rate calculations. The interest rate assumptions for vari-able rate bonds are as follows:
Dedicated Tax Fund, Series 2002B – 4.06% per annum until 09/01/2013 based on the interestrate swap and 4.00% per annum thereafter
Transportation Revenue Refunding Bonds, Series 2002B – 4.00% per annum
Transportation Revenue Refunding Bonds, Series 2002C – 4.50% per annum
Transportation Revenue Refunding Bonds, Series 2002D – 4.00% per annum and including netpayments made by MTA under the swap agreements
Transportation Revenue Refunding Bonds, Series 2002G – 4.00% per annum
48 M E T R O P O L I T A N T R A N S P O R T A T I O N A U T H O R I T Y
Notes to Financial StatementsYears Ended December 31, 2003 and 2002($ Millions)

49
Notes to Financial StatementsYears Ended December 31, 2003 and 2002
($ Millions)
TBTA Subordinate Refunding Bonds, Series 2000A and 2000B – 4.00% per annum and includingnet payments made by TBTA under the swap agreements
TBTA General Revenue Refunding Bonds, Series 2002C – 4.00% per annum and including net pay-ments made by TBTA under the swap agreements
TBTA General Revenue Refunding Bonds, Series 2002D – 4.00% per annum
TBTA General Revenue Refunding Bonds, Series 2002F – 4.00% per annum
TBTA General Revenue Refunding Bonds, Series 2002G – 4.00% per annum
Tax Rebate LiabilityUnder the Internal Revenue Code of 1986, the Authority accrues a liability for an amount of rebatable arbitrageresulting from investing low-yielding, tax-exempt bond proceeds in higher-yielding, taxable securities. The arbitrageliability is payable to the federal government every five years and is reported as part of other long-term liabilities.At December 31, 2003, the Authority recorded a rebate liability amounting to $4.1.
Swap AgreementsBoard-Adopted GuidelinesThe Related Group adopted guidelines with respect to the use of swap contracts to manage the interest rate expo-sure of their debt. The Guidelines establish specific requirements that must be satisfied for a Related Entity to enterinto a swap contract.
Objectives of the SwapsIn order to protect against the potential of rising interest rates, to achieve a lower net cost of borrowing, to reduceexposure to changing interest rates on a related bond issue, or, in some cases where federal tax law prohibits anadvance refunding, to achieve debt service savings through a synthetic fixed rate, MTA and TBTA entered into sepa-rate pay-fixed, receive-variable interest rate swaps at a cost anticipated to be less than what MTA and TBTA wouldhave paid to issue fixed-rate debt.
Activity During the Period• In an effort to hedge against rising interest rates, on April 17, 2003, MTA entered into the fol-
lowing two forward hedges with an effective date of October 7, 2003 in connection with theexpected issuance of approximately $750 in Transportation Revenue Bonds to provide long-termfinancing for MTA’s commercial paper program:
— $336.3 notional amount with Lehman Brothers Special Financing Inc., and— $224.2 notional amount with Bear Stearns Capital Markets Inc.
On July 23, 2003, MTA terminated the Lehman hedge and the Bear Stearns hedge in return for payments to MTA of$1.1 and $0.7, respectively. At the same time, MTA entered into new hedges with Lehman and Bear Stearns in thesame notional amounts with an effective date of May 15, 2004 in order to hedge against rising interest rates in con-nection with the expected issuance in 2004 of approximately $750 of Transportation Revenue Bonds to finance tran-sit and commuter projects. The terms of the new hedges are reflected in the tables below.
• In an effort to hedge against rising interest rates, on May 29, 2003, TBTA entered into a for-ward hedge in the notional amount of $370.7 with Lehman Brothers Special Financing Inc. withan effective date of January 1, 2004 in connection with the expected issuance of approximately$500 in General Revenue Bonds to finance TBTA’s Facilities.
Due to favorable market conditions, on July 23, 2003, TBTA terminated the Lehman hedge in return for a payment toTBTA of $16.4.

Fair ValueRelevant interest rates were lower on December 31, 2003 (the valuation date) than they were on the effective dateof the swaps. Consequently, as of the valuation date, all of the swaps had negative fair values and MTA and TBTAwere not exposed to the credit risk of the counterparties. However, should interest rates change and the fair valuesof the swaps become positive, MTA and TBTA would be exposed to the credit risk of the counterparties in theamount of the swaps’ fair value.
The fair values listed in the following tables represent the theoretical cost to the defaulting party to terminatethe swap as of the date indicated, assuming that a termination event occurred on that date. The fair values wereestimated using the zero-coupon method. This method calculates the future net settlement payments required by theswap, assuming that the current forward rates implied by the yield curve correctly anticipate future spot interestrates. These payments are then discounted using the spot rates implied by the current yield curve for hypotheticalzero-coupon bond due on the date of each future net settlement on the swap. In the event both parties continue toperform their obligations under the swap, there is not a risk of termination and neither party is required to make atermination payment to the other. Neither MTA nor TBTA is aware of any event that would lead to a terminationevent with respect to any of their swaps. See “Termination Risk” below.
Terms and Fair ValuesThe terms, fair values and counterparties of the outstanding swaps of MTA and TBTA are as follows:
MTA
Notional FairAmounts Values
as of Fixed Variable as of Swap12/31/03 Effective Rate Rate 12/31/03 Termination
Associated Bond Issue (in millions) Date Paid Received (in millions) Date Counterparty
Dedicated Tax Fund $ 440.000 09/05/02 4.06% Actual bond rate $(18.6) 09/01/13 Morgan StanleyVariable Rate Bonds, until 04/30/10, and Capital Services Inc.Series 2002B thereafter, BMA(1)
Transportation Revenue 210.500 05/30/02 2.565 BMA (.3) 01/01/04 Bear Stearns CapitalVariable Rate Refunding Markets Inc.Bonds, Series 2002B
Transportation Revenue 200.000 05/30/02 3.385 BMA (6.5) 01/01/06 Bear Stearns CapitalVariable Rate Refunding Markets Inc.Bonds, Series 2002D-1
Transportation Revenue 200.000 05/30/02 3.627 BMA (8.3) 01/01/07 Bear Stearns CapitalVariable Rate Refunding Markets Inc.Bonds, Series 2002D-2
Transportation Revenue 200.000 01/01/07 4.45 69% of one-month (9.7) 11/01/32 Bear Stearns CapitalVariable Rate Refunding LIBOR(2) Markets Inc.Bonds, Series 2002D-2
Proposed Issuance of 336.280 05/15/04 3.605 67% of one-month (1.8) 11/15/32 Lehman BrothersTransportation Revenue LIBOR Special Financing Bonds Inc.
Proposed Issuance of 224.190 05/15/04 3.605 67% of one-month (1.3) 11/15/32 Bear Stearns CapitalTransportation Revenue LIBOR Markets Inc.Bonds
Total $1,810.970 $(46.5)
(1) The Bond Market Association Municipal Swap IndexTM.(2) London Interbank Offered Rate.
50 M E T R O P O L I T A N T R A N S P O R T A T I O N A U T H O R I T Y
Notes to Financial StatementsYears Ended December 31, 2003 and 2002($ Millions)

51
Notes to Financial StatementsYears Ended December 31, 2003 and 2002
($ Millions)
TBTA
Notional FairAmounts Values
as of Fixed Variable as of Swap12/31/03 Effective Rate Rate 12/31/03 Termination
Associated Bond Issue (in millions) Date Paid Received (in millions) Date Counterparty
Subordinate Revenue $234.800 01/01/01 6.08% Actual bond rate $ (50.8) 01/01/19 Bear Stearns CapitalVariable Rate Refunding Markets Inc.Bonds, Series 2000A and 2000B(3)
Subordinate Revenue 234.800 01/01/01 6.07 Actual bond rate (48.8) 01/01/19 Citigroup FinancialVariable Rate Refunding Products Inc.Bonds, Series 2000Cand 2000D(3)
General Revenue Variable 296.200 01/01/02 5.777 Actual bond rate (49.1) 01/01/19 Citigroup FinancialRate Refunding Bonds, Products Inc.Series 2001B and2001C(4)
General Revenue Variable 93.900 01/01/00 5.634 Actual bond rate (15.2) 01/01/13 Ambac FinancialRate Refunding Bonds, Services, L.P.Series 2002C(5)
Subordinate Revenue 90.500 11/26/02 3.218 Lesser of actual bond (1.4) 01/01/18 JPMorgan Chase BankVariable Rate Refunding rate, or 67% of Bonds, Series 2002G-1 one-month LIBOR
minus 45 basis points
Subordinate Revenue 90.525 11/26/02 3.218 Lesser of actual bond (1.6) 01/01/18 JPMorgan Chase BankVariable Rate Refunding rate, or 67% ofBonds, Series 2002G-2 one-month LIBOR
minus 45 basis points
Total $1,040.725 $(166.8)
(3) In accordance with a swaption entered into August 12, 1998 with each Counterparty paying a premium of $22,740,000.(4) In accordance with a swaption entered into February 24, 1999 with each Counterparty paying a premium of $19,204,000.(5) In accordance with a swaption entered into February 24, 1999 with each Counterparty paying a premium of $8,400,000.
The current ratings of the counterparties, or their credit support providers, are as follows:
Ratings of the Counterpartyor its Credit Support Provider
Counterparty S&P Moody’s Fitch
Ambac Financial Services, L.P. AAA Aaa AAABear Stearns Capital Markets Inc. A A1 A+Citigroup Financial Products Inc. AA- Aa1 AA+JPMorgan Chase Bank AA- Aa3Lehman Brothers Special Financing Inc. A A1 A+Morgan Stanley Capital Services Inc. A+ Aa3 AA-

52 M E T R O P O L I T A N T R A N S P O R T A T I O N A U T H O R I T Y
Notes to Financial StatementsYears Ended December 31, 2003 and 2002($ Millions)
Except as set forth below, the notional amounts of the swaps match the principal amounts of the associated bonds.The following table sets forth the notional amounts and the outstanding principal amounts as of December 31,2003, for those swaps where the notional amounts do not match the outstanding principal amounts of the associat-ed bonds.
PrincipalAmount of Notional
Bonds AmountAssociated Bond Issue (in millions) (in millions)
TBTA Subordinate Revenue Variable Rate Refunding Bonds, Series 2000A and 2000B $244.3 $234.8TBTA Subordinate Revenue Variable Rate Refunding Bonds, Series 2000C and 2000D 244.2 234.8TBTA General Revenue Variable Rate Refunding Bonds, Series 2001B and 2001C 296.4 296.2TBTA General Revenue Variable Rate Refunding Bonds, Series 2002C 103.3 93.9
Except as discussed below under the heading “Rollover Risk,” MTA’s and TBTA’s swap agreements contain scheduledreductions to outstanding notional amounts that are expected to approximately follow scheduled or anticipatedreductions in the principal amount of the associated bonds.
Risks Associated with the Swap AgreementsFrom MTA’s and TBTA’s perspective, the following risks are generally associated with swap agreements:
• Credit Risk – The counterparty becomes insolvent or is otherwise not be able to perform itsfinancial obligations. In the event of a deterioration in the credit ratings of the counterparty orMTA/TBTA, the swap agreement may require that collateral be posted to secure the party’s obli-gations under the swap agreement. See “Collateralization” below.
• Basis Risk – The variable interest rate paid by the counterparty under the swap and the vari-able interest rate paid by MTA or TBTA on the associated bonds are not the same. If the coun-terparty’s rate under the swap is lower than the bond interest rate, then the counterparty’spayment under the swap agreement does not fully reimburse MTA or TBTA for its interest pay-ment on the associated bonds. Conversely, if the bond interest rate is lower than the counter-party’s rate on the swap, there is a net benefit to MTA or TBTA.
• Termination Risk – The swap agreement will be terminated and MTA or TBTA will be required tomake a large termination payment to the counterparty.
• Rollover Risk – The notional amount under the swap agreement terminates prior to the finalmaturity of the associated bonds, and MTA or TBTA may be exposed to then market rates andcease to get the benefit of the synthetic fixed rate for the duration of the bond issue.
Credit RiskThe following table shows the diversification, by percentage of notional amount, among the various counterpartiesthat have entered into ISDA Master Agreements with MTA and/or TBTA. The notional amount totals below includeboth Bear Stearns swaps relating to the Transportation Revenue Bonds, Series 2002D-2 (one of which swaps termi-nates on January 1, 2007, which is the effective date of the other swap) and both the Lehman and Bear Stearnshedges that become effective on May 15, 2004. The counterparties have the ratings set forth above.
Notional Amount % of TotalCounterparty (in millions) Notional Amount
Bear Stearns Capital Markets Inc. $1,269.5 44.5%Citigroup Financial Products Inc. 531.0 18.6Morgan Stanley Capital Services Inc. 440.0 15.4Lehman Brothers Special Financing Inc. 336.3 11.8JPMorgan Chase Bank 181.0 6.3Ambac Financial Services, L.P. 93.9 3.3
Total $2,851.7

53
Notes to Financial StatementsYears Ended December 31, 2003 and 2002
($ Millions)
The ISDA Master Agreements entered into with the following counterparties provide that the payments under onetransaction will be netted against other transactions entered into under the same ISDA Master Agreement:
• Bear Stearns Capital Markets Inc. with respect to the TBTA Subordinate Revenue Variable RateRefunding Bonds, Series 2000A and 2000B,
• Citigroup Financial Products Inc. with respect to the TBTA Subordinate Revenue Variable RateRefunding Bonds, Series 2000C and 2000D,
• Citigroup Financial Products Inc. with respect to the TBTA General Revenue Variable RateRefunding Bonds, Series 2001B and 2001C, and
• Ambac Financial Services, L.P. (though there is only one transaction outstanding under thatMaster Agreement).
Under the terms of these agreements, should one party become insolvent or otherwise default on its obligations,close-out netting provisions permit the nondefaulting party to accelerate and terminate all outstanding transactionsand net the transactions’ fair values so that a single sum will be owed by, or owed to, the nondefaulting party.
CollateralizationGenerally, the Credit Support Annex attached to the ISDA Master Agreement requires that if the rating of MTA orTBTA, as the case may be, or the counterparty falls to a certain level, the party whose rating falls is required to postcollateral with a third-party custodian to secure its termination payments above certain threshold amounts.Collateral must be cash or U.S. government or certain federal agency securities.

54 M E T R O P O L I T A N T R A N S P O R T A T I O N A U T H O R I T Y
Notes to Financial StatementsYears Ended December 31, 2003 and 2002($ Millions)
AssociatedBond Issue Counterparty
If the highest rating of therelated MTA bonds or thecounterparty’s long-termunsecured debt falls to
Then the downgraded partymust post collateral if its
estimated termination pay-ments are in excess of
MTA Dedicated Tax FundVariable Rate Bonds, Series2002B
Morgan Stanley CapitalServices Inc.
Fitch – BBB+, orS&P – BBB+Fitch – BBB and below orunrated, orS&P – BBB and below orunrated
$10,000,000
$0
MTA Transportation RevenueVariable Rate RefundingBonds – Series 2002B andSeries 2002D-2
Bear Stearns CapitalMarkets Inc.
Fitch – BBB+,Moody’s – Baa1, orS&P – BBB+Fitch – BBB and below orunrated,Moody’s – Baa2 and belowor unrated by S&P &Moody’s, or S&P – BBB and below orunrated
$10,000,000
$0
The following table sets forth the ratings criteria and threshold amounts relating to the posting of collateralset forth for MTA or TBTA, as the case may be, and the counterparty for each swap agreement.
MTA
MTA May 15, 2004 Hedge –Transportation RevenueBonds
Lehman Brothers SpecialFinancing Inc.
Fitch – BBB+, Moody’s – Baa1, orS&P – BBB+Fitch – BBB and below orunrated,Moody’s – Baa2 and belowor unrated by S&P &Moody’s, or S&P – BBB and below orunrated
$10,000,000
$0
MTA May 15, 2004 Hedge –Transportation RevenueBonds
Bear Stearns CapitalMarkets Inc.
Fitch – BBB+,Moody’s – Baa1, orS&P – BBB+Fitch – BBB and below orunrated, Moody’s – Baa2and below or unrated byS&P & Moody’s, or S&P – BBB and below orunrated
$10,000,000
$0

55
Notes to Financial StatementsYears Ended December 31, 2003 and 2002
($ Millions)
TBTA
AssociatedBond Issue Counterparty
If the highest rating of therelated TBTA bonds or thecounterparty’s long-termunsecured debt falls to
Then the downgraded partymust post collateral if its
estimated termination pay-ments are in excess of
TBTA Subordinate RevenueVariable Rate RefundingBonds, Series 2000A and2000B
Bear Stearns CapitalMarkets Inc.
TBTA Subordinate RevenueVariable Rate RefundingBonds, Series 2000C and2000D
Citigroup Financial ProductsInc.
TBTA General RevenueVariable Rate RefundingBonds, Series 2001B and2001C
Citigroup Financial ProductsInc.
TBTA General RevenueVariable Rate RefundingBonds, Series 2002C
Ambac Financial Services,L.P.
TBTA Subordinate RevenueVariable Rate RefundingBonds – Series 2002G-1 andSeries 2002G
JPMorgan Chase Bank Fitch – BBB+,Moody’s – Baa1, orS&P – BBB+Fitch – Below BBB+,Moody’s – Below Baa1, orS&P – Below BBB+
$10,000,000
$0
N/A – Because TBTA’s swap payments are insured, TBTA isnot required to post collateral, but Bear Stearns isrequired to post collateral if its estimated terminationpayments are in excess of $1,000,000.
N/A – Because TBTA’s swap payments are insured, TBTA isnot required to post collateral, but Citigroup is requiredto post collateral if its estimated termination paymentsare in excess of $1,000,000.
N/A – Because TBTA’s swap payments are insured, TBTA isnot required to post collateral, but Citigroup is requiredto post collateral if its estimated termination paymentsare in excess of $1,000,000.
N/A – Because TBTA’s swap payments are insured, TBTA isnot required to post collateral, but Ambac is required topost collateral if its estimated termination payments arein excess of $1,000,000.
Notwithstanding the foregoing, in the event any downgraded party is responsible for an event of default or poten-tial event of default as defined in the ISDA Master Agreement, the downgraded party must immediately collateralizeits obligations irrespective of the threshold amounts.
Basis RiskFor those swaps for which MTA and TBTA receive a variable-rate payment other than the actual bond rate, such as ifthe interest rate is based on BMA or LIBOR, MTA and TBTA are exposed to basis risk to the extent that the ratebased on BMA or LIBOR is less than the actual bond rate for any given period. To the extent that the rate based onBMA or LIBOR is greater than the actual bond rate for any given period, there is a benefit to MTA and/or TBTA.
Termination RiskAny party to the swap may terminate the swap if the other party fails to perform under the terms of the contract. Ifany swap is terminated, the associated variable-rate bonds would no longer carry a synthetic interest rate. Also, ifat the time of termination the swap has a negative fair value, MTA or TBTA could be liable to the counterparty for apayment equal to the swap’s fair value. Neither MTA nor TBTA is aware of any event that would lead to a termina-tion event with respect to any of their swaps.
Under each MTA and TBTA bond resolution, the payments relating to debt service on the swaps are parity obliga-tions with the associated bonds, as well as all other bonds issued under that bond resolution, but all other pay-ments, including the termination payments, are subordinate to the payment of debt service on the swap and allbonds issued under that bond resolution. In addition, MTA and TBTA have structured each of the swaps in a mannerthat will permit MTA or TBTA to bond the termination payments under any available bond resolution.

56 M E T R O P O L I T A N T R A N S P O R T A T I O N A U T H O R I T Y
Notes to Financial StatementsYears Ended December 31, 2003 and 2002($ Millions)
The ISDA Master Agreement sets forth certain termination events applicable to all swaps entered into by the par-ties to that ISDA Master Agreement. MTA and TBTA have entered into separate ISDA Master Agreements with eachcounterparty that governs the terms of each swap with that counterparty, subject to individual terms negotiated in aconfirmation.
The following table sets forth, for each swap, the additional termination events for the following associated bondissues.
MTA
AssociatedBond Issue Counterparty
MTA Dedicated Tax FundVariable Rate Bonds, Series2002B
Morgan Stanley CapitalServices Inc.
MTA Transportation RevenueVariable Rate RefundingBonds, Series 2002B
Bear Stearns CapitalMarkets Inc.
MTA Transportation RevenueVariable Rate RefundingBonds, Series 2002D-1
Bear Stearns CapitalMarkets Inc.
MTA Transportation RevenueVariable Rate RefundingBonds, Series 2002D-2
Bear Stearns CapitalMarkets Inc.
MTA Transportation RevenueVariable Rate RefundingBonds, Series 2002D-2
Bear Stearns CapitalMarkets Inc.
MTA May 15, 2004 Hedge –Transportation RevenueBonds
Lehman Brothers SpecialFinancing Inc.
MTA May 15, 2004 Hedge –Transportation RevenueBonds
Bear Stearns CapitalMarkets Inc.
Additional Termination Events
1. The ratings by S&P and Fitch of the Counterparty orthe MTA Dedicated Tax Fund Bonds falls below “BBB-” orare withdrawn.
1. The ratings by S&P and Moody’s of the Counterparty orthe MTA Transportation Revenue Bonds falls below “BBB-”and “Baa3”, respectively, or are withdrawn.
1. The ratings by S&P and Moody’s of the Counterparty orthe MTA Transportation Revenue Bonds falls below “BBB-”and “Baa3”, respectively, or are withdrawn.
1. The ratings by S&P and Moody’s of the Counterparty orthe MTA Transportation Revenue Bonds falls below “BBB-”and “Baa3”, respectively, or are withdrawn.
1. The ratings by S&P and Moody’s of the Counterparty orthe MTA Transportation Revenue Bonds falls below “BBB-”and “Baa3”, respectively, or are withdrawn.
1. The ratings by S&P and Moody’s of the Counterparty orthe MTA Transportation Revenue Bonds falls below “BBB-”and “Baa3”, respectively, or are withdrawn.
1. The ratings by S&P and Moody’s of the Counterparty orthe MTA Transportation Revenue Bonds falls below “BBB-”and “Baa3”, respectively, or are withdrawn.

57
Notes to Financial StatementsYears Ended December 31, 2003 and 2002
($ Millions)
TBTA
AssociatedBond Issue Counterparty Additional Termination Events
TBTA Subordinate RevenueVariable Rate RefundingBonds, Series 2000A and2000B
Bear Stearns CapitalMarkets Inc.
1. TBTA can elect to terminate the swap on 10 BusinessDays’ notice if the Series 2000A and 2000B Bonds areconverted to a fixed rate, the fixed rate on the convertedBonds is less than the fixed rate on the swap and TBTAdemonstrates its ability to make the termination pay-ments, or TBTA redeems a portion of the Series 2000A or2000B Bonds and demonstrates its ability to make thetermination payments.Note: The TBTA swap payments are insured by FinancialSecurity Assurance Inc., so there is no ratings downgradeor withdrawal termination.
TBTA Subordinate RevenueVariable Rate RefundingBonds, Series 2000C and2000D
Citigroup Financial ProductsInc.
1. TBTA can elect to terminate the swap on 10 BusinessDays’ notice if the Series 2000A and 2000B Bonds areconverted to a fixed rate, the fixed rate on the convertedBonds is less than the fixed rate on the swap and TBTAdemonstrates its ability to make the termination pay-ments, or TBTA redeems a portion of the Series 2000A or2000B Bonds and demonstrates its ability to make thetermination payments.Note: The TBTA swap payments are insured by FinancialSecurity Assurance Inc., so there is no ratings downgradeor withdrawal termination.
TBTA General RevenueVariable Rate RefundingBonds, Series 2001B and2001C
Citigroup Financial ProductsInc.
1. TBTA can elect to terminate the swap on 10 BusinessDays’ notice if the Series 2000A and 2000B Bonds areconverted to a fixed rate, the fixed rate on the convertedBonds is less than the fixed rate on the swap and TBTAdemonstrates its ability to make the termination pay-ments, or TBTA redeems a portion of the Series 2000A or2000B Bonds and demonstrates its ability to make thetermination payments.Note: The TBTA swap payments are insured by AmbacAssurance Corporation, so there is no ratings downgradeor withdrawal termination.
TBTA General RevenueVariable Rate RefundingBonds, Series 2002C
Ambac Financial Services,L.P.
1. TBTA can elect to terminate the swap on 10 BusinessDays’ notice if the Series 2000A and 2000B Bonds areconverted to a fixed rate, the fixed rate on the convertedBonds is less than the fixed rate on the swap and TBTAdemonstrates its ability to make the termination pay-ments, or TBTA redeems a portion of the Series 2000A or2000B Bonds and demonstrates its ability to make thetermination payments.Note: The TBTA swap payments are insured by AmbacAssurance Corporation, so there is no ratings downgradeor withdrawal termination.
TBTA Subordinate RevenueVariable Rate RefundingBonds, Series 2002G-1
JPMorgan Chase Bank 1. TBTA may terminate the swap at no cost on or afterDecember 29, 2010.
TBTA Subordinate RevenueVariable Rate RefundingBonds, Series 2002G
JPMorgan Chase Bank 1. TBTA may terminate the swap at no cost on or afterJanuary 5, 2011.

Rollover RiskMTA and TBTA are exposed to rollover risk on swaps that mature or may be terminated prior to the maturity of theassociated debt. When these swaps terminate, MTA or TBTA may not realize the synthetic fixed rate offered by theswaps on the underlying debt issues. The following debt is exposed to rollover risk:
Bond SwapMaturity Termination
Associated Bond Issue Date Date
TBTA General Revenue Variable Rate Refunding Bonds, Series 2001B and 2001C 01/01/32 01/01/19MTA Dedicated Tax Fund Variable Rate Bonds, Series 2002B 11/01/22 09/01/13MTA Transportation Revenue Variable Rate Refunding Bonds, Series 2002B 11/01/22 01/01/04MTA Transportation Revenue Variable Rate Refunding Bonds, Series 2002D-1 11/01/29 01/01/06TBTA General Revenue Variable Rate Refunding Bonds, Series 2002C 01/01/33 01/01/13TBTA Subordinate Revenue Variable Rate Refunding Bonds, Series 2002G(1) 11/01/32 01/01/18
It should also be noted that, in connection with the TBTA Subordinate Revenue Variable Rate Refunding Bonds,Series 2000A, 2000B, 2000C and 2000D, currently, all of the principal of the bonds is scheduled to be amortizedthrough sinking fund redemption payments by the time of the swap’s termination; however, TBTA has retained theright to readjust the sinking fund payments to decrease the amounts of the sinking fund payments currently sched-uled and to extend the amortization period of the Series 2000A-D Bonds to January 1, 2031. A readjustment of thesinking fund payments would not change the scheduled decreases in notional amounts of the associated swap. As aresult, the principal amount of the bonds outstanding would exceed the notional amount of the associated swap.However, if TBTA decided to readjust the sinking fund schedules, TBTA would be exposed to rollover risk at the swaptermination date. TBTA could readjust such sinking fund redemption schedules only upon delivery of an opinion ofnationally recognized bond counsel meeting the conditions of the bond resolutions. TBTA has no current intention ofexercising these rights.
Swap Payments and Associated DebtThe following tables contain the aggregate amount of estimated variable-rate bond debt service and net swap pay-ments during certain years that such swaps were entered into in order to: protect against the potential of risinginterest rates; achieve a lower net cost of borrowing; reduce exposure to changing interest rates on a related bondissue; or, in some cases where federal tax law prohibits an advance refunding, achieve debt service savings througha synthetic fixed rate. As rates vary, variable-rate bond interest payments and net swap payments will vary. Usingthe following assumptions, debt service requirements of MTA’s outstanding variable-rate debt and net swap paymentsare estimated to be as follows:
• Beginning in 2004, it was assumed that the variable-rate bonds would bear interest at a rate of4.0% per annum.
• The net swap payments were calculated using the actual fixed interest rate on the swap agree-ments.
(1) The swap relating to the Subseries 2002G-1 Bonds in the notional amount of $90,500,000 may be terminated at the option of TBTA on orafter December 29, 2010, and the swap relating to the Subseries 2002G-2 Bonds in the notional amount of $90,525,000 may be terminatedat the option of TBTA on or after January 5, 2011.
58 M E T R O P O L I T A N T R A N S P O R T A T I O N A U T H O R I T Y
Notes to Financial StatementsYears Ended December 31, 2003 and 2002($ Millions)

59
Notes to Financial StatementsYears Ended December 31, 2003 and 2002
($ Millions)
MTA (in millions)
Variable-Rate BondsNet Swap
Fiscal Year Ending December 31 Principal Interest Payments Total
2004 $ – $ 34.0 $ 4.6 $ 38.62005 – 42.2 (1.7) 40.52006 – 42.3 (0.5) 41.92007 – 42.1 1.2 43.32008 – 42.1 1.2 43.32009-2013 9.0 210.6 5.7 225.32014-2018 274.0 185.9 4.5 464.42019-2023 435.8 113.0 4.5 553.32024-2028 125.3 56.0 4.5 185.82029-2033 206.4 24.4 2.7 233.5
TBTA (in millions)
Variable-Rate BondsNet Swap
Fiscal Year Ending December 31 Principal Interest Payments Total
2004 $ 19.9 $ 35.2 $21.9 $ 77.02005 20.8 41.3 14.4 76.52006 22.1 40.3 13.5 75.92007 23.5 39.1 12.6 75.22008 31.3 38.6 11.5 81.32009-2013 194.3 168.8 44.8 407.92014-2018 295.6 118.3 12.3 426.22019-2023 143.3 76.6 – 219.92024-2028 164.4 46.9 – 211.32029-2033 154.0 11.7 – 165.7
7—Lease Transactions
Hillside FacilityOn March 31, 1997, the Authority entered into a lease/leaseback transaction with a third party whereby MTA leasedLIRR’s Hillside maintenance facility. The term of the lease is 22 years, but the third party has the right to renew fora further 21.5 year term. The facility was subsequently subleased back to the Authority as a capital lease, and sub-subleased by the Authority to LIRR.
Under the terms of the lease/leaseback agreement, the Authority initially received $314, which was utilized asfollows. The Authority paid $266 to an affiliate of the third party’s lender, which has the obligation to make a por-tion of sublease rent payments equal to this amount, thereby eliminating the need for the Authority to make thesepayments to the third party. The Authority used $21 to purchase Treasury securities, which it deposited under pledgeto the third party. This deposit, together with the aforementioned obligation of the third party’s lender, resulted in afinancial defeasance of all sublease obligations, including the cost of purchasing the third party’s remaining rights atthe end of the 22-year sublease period, if the purchase option is exercised. A further $.6 was used to pay for legaland other costs of the transaction, and $3 was used to pay the first rental payment under the sublease. A further$23 is the Authority’s net benefit from the transaction, representing consideration for the tax benefits. TBTA hasentered into a guarantee with the third party that the sublease payments will be made. At December 31, 2003, theAuthority has recorded a long-term capital obligation and capital asset of $282 arising from the transaction.

Subway and Rail CarsOn December 12, 1997, the Authority entered into lease/leaseback transactions whereby the Authority leased certainof MNCR’s rail cars to a third party and NYCTA leased certain subway maintenance cars to the same third party. Thelease periods for MNCR’s rail cars expire between 2009 and 2014, depending on the asset, and the lease period forNYCTA’s subway maintenance cars expires in 2013. The third party has the right to renew the lease for an additionalperiod of 12 years for MNCR cars, depending on the asset, and a further 12 years for NYCTA’s subway maintenancecars. The cars were subsequently subleased back to the Authority as a capital lease, and sub-subleased by theAuthority to MNCR and NYCTA, respectively.
Under the terms of the lease/leaseback agreement, the Authority initially received $76.6, which was utilized asfollows: the Authority paid $59.8 to an affiliate of the third party’s lender, which has the obligation to make a por-tion of sublease rent payments equal to this amount, thereby eliminating the need for the Authority to make thesepayments to the third party. The Authority used $12.5 to purchase a Letter of Credit from an affiliate of the thirdparty’s lender, guaranteed by the third party lender’s parent. This payment, together with the aforementioned obliga-tion of the third party’s lender, is sufficient to settle all obligations, including the cost of purchasing the thirdparty’s remaining rights at the end of the sublease period if the purchase options are exercised. At December 31,2003, the Authority has recorded a long-term capital obligation and capital asset of $51 arising from the transac-tion. The net proceeds are deferred and amortized to operations over the period of the lease.
On September 25, 2002, and December 17, 2002, the Authority entered into four sale/leaseback transactionswhereby NYCTA transferred ownership of certain NYCTA subway cars to the Authority, the Authority sold those cars tothird parties, and MTA leased those cars back from such third parties. The Authority subleased the cars to NYCTA.The four leases expire in 2032, 2034, 2033 and 2033, respectively. At the lease expiration, the Authority has theoption of either exercising a fixed price purchase option for the cars or returning the cars to the third party owner.
Under the terms of the sale/leaseback agreements, the Authority initially received $1,514.9, which was utilized asfollows: the Authority paid $1,058.6 to affiliates of certain of the lenders to the third parties, which affiliates havethe obligation to make a portion of the lease rent payment equal to the debt service on the related loans, therebyeliminating the need for MTAHQ to make these payments to the third parties. The Authority also purchased FreddieMac, FNMA and U.S. Treasury debt securities in amounts and with maturities, which are sufficient, to make the leaserent payments equal to the debt service on the loans from the other lenders to the third parties. In the case of oneof the four leases, MTAHQ also purchased Freddie Mac debt securities in amounts and with maturities which areexpected to be sufficient to pay the remainder of the lease rent payments under that lease and the purchase pricedue upon exercise by the Authority of the purchase option if exercised. In the case of the other three leases, theAuthority entered into Equity Payment Agreements with Premier International Funding Co. (which are guaranteed byFinancial Security Assurance, Inc.) whereby that entity has the obligation to provide to the Authority the amountsnecessary to make the remainder of the basic lease rent payments under the leases and to pay the purchase pricedue upon exercise by the Authority of the purchase options if exercised. The amount remaining after payment oftransaction expenses, $96.2, was the Authority’s net benefit from these four transactions. These amounts aredeferred and amortized to operations over the period of the lease.
During 1995, TBTA entered into a sale/leaseback transaction with a third party whereby the TBTA sold certain sub-way cars, which were contributed by the NYCTA, for net proceeds of $84.2. These cars were subsequently leased backby the TBTA under a capital lease. The deferred credit of $34.2 was netted against the carrying value of the leasedassets, and the assets were recontributed to the NYCTA. TBTA transferred $5.5 to the Authority, representing the neteconomic benefit of the transaction. The remaining proceeds, equal to the net present value of the lease obligation,of which $71.3 was placed in an irrevocable deposit account and $7.5 was invested in U.S. Treasury Strips. The esti-mated yields and maturities of the deposit account and the Treasury Strips are expected to be sufficient to meet allobligations under the lease as they become due. The capital lease obligation is included in other long-term liabili-ties. At the end of the lease term, TBTA has the option to purchase the subway cars for approximately $106 whichamount has been reflected in the net present value of the lease obligation, or to make a lease termination paymentof approximately $89.
60 M E T R O P O L I T A N T R A N S P O R T A T I O N A U T H O R I T Y
Notes to Financial StatementsYears Ended December 31, 2003 and 2002($ Millions)

61
Notes to Financial StatementsYears Ended December 31, 2003 and 2002
($ Millions)
QTE Lease TransactionsOn December 19, 2002, the Authority entered into four sale/leaseback transactions whereby NYCTA transferred own-ership of certain NYCTA qualified technological equipment (QTE) relating to the NYCTA automated fare collection sys-tem to the Authority. The Authority sold that equipment to third parties, and the Authority leased that equipmentback from such third parties. The Authority subleased the equipment to NYCTA. The four leases expire in 2022, 2020,2022 and 2020, respectively. At the lease expiration, the Authority has the option of either exercising a fixed pricepurchase option for the equipment or returning the equipment to the third-party owner.
Under the terms of the sale/leaseback agreements, the Authority initially received $507.4, which was utilized asfollows: the Authority paid $316.2 to affiliates of certain of the lenders to the third parties, which affiliates havethe obligation to make a portion of the lease rent payment equal to the debt service on the related loans, therebyeliminating the need for the Authority to make these payments to the third parties. The Authority also purchasedFNMA and U.S. Treasury debt securities in amounts and with maturities, which are sufficient, to make the lease rentpayments equal to the debt service on the loans from the other lenders to the third parties. In the case of three ofthe four leases, the Authority also purchased U.S. Treasury debt securities in amounts and with maturities which areexpected to be sufficient to pay the remainder of the lease rent payments under those leases and the purchase pricedue upon exercise by the Authority of the purchase options if exercised. In the case of the other lease, theAuthority entered into an Equity Payment Undertaking Agreement with XL Insurance (Bermuda) Ltd. (which is guar-anteed by XL Financial Assurance Ltd.) whereby that entity has the obligation to provide to the Authority theamounts necessary to make the remainder of the basic lease rent payments under that lease and to pay the purchaseprice due upon exercise by the Authority of the purchase option if exercised. The amount remaining after payment oftransaction expenses, $57.6, was the Authority’s net benefit from these four transactions. As consideration for thecooperation of the City of New York in these transactions, including the transfer of any property interests held bythe City on such equipment to NYCTA and the Authority, the Authority is obligated to pay to the City 24.11% of thenet benefit received from these four QTE transactions.
On June 3, 2003, the Authority entered into a sale/leaseback transaction whereby NYCTA transferred ownership ofcertain NYCTA subway cars to the Authority, the Authority sold those cars to a third party, and the Authority leasedthose cars back from such third party. The Authority subleased the cars to NYCTA. The lease expires in 2033. At thelease expiration, the Authority has the option of either exercising a fixed price purchase option for the cars orreturning the cars to the third-party owner.
Under the terms of the sale/leaseback agreement, the Authority initially received $168.1 million, which was uti-lized as follows: the Authority paid $126.3 to an affiliate of one of the lenders to the third party, which affiliate hasthe obligation to make a portion of the lease rent payment equal to the debt service on the related loan, therebyeliminating the need for MTAHQ to make these payments to third parties. The Authority also purchased FNMA andU.S. Treasury securities in amounts and with maturities which are sufficient to make the lease rent payments equalto the debt service on the loans from the other lender to the third party and to pay the remainder of the rent underthat lease and the purchase price due upon exercise by the Authority of the purchase option if exercised. Theamount remaining after payment of transaction expenses, $7.4, was the Authority’s benefit from the transaction.
On September 25, 2003 and September 29, 2003, MTA entered into two sale/leaseback transactions wherebyNYCTA transferred ownership of certain NYCTA subway cars to MTA, MTA sold those cars to third parties, and MTAleased those cars back from such third parties. MTA subleased the cars to NYCTA. Both leases expire in 2033. At thelease expiration, MTAHQ has the option of either exercising a fixed price purchase option for the cars or returningthe cars to the third party owner.
Under the terms of the sale/leaseback agreements, MTA initially received $294, which was utilized as follows. Inthe case of one of the leases, MTA paid $97 to an affiliate of one of the lenders to the third party, which affiliatehas the obligation to make a portion of the lease rent payment equal to the debt service on the related loan, there-by eliminating the need for MTA to make these payments to the third party. In the case of the other lease, MTA purchased U.S. Treasury debt securities in amounts and with maturities which are sufficient to make the lease rentpayments equal to the debt service on the loan from the other lender to the third party. In the case of both of theleases, MTA also purchased REFCO debt securities that mature in 2030 under an agreement with AIG Matched

Funding Corp. (guaranteed by American International Group, Inc.) whereby AIG Matched Funding Corp. receives theproceeds from the REFCO debt securities at maturity and is obligated to pay the remainder of the lease rent pay-ments under those leases and the purchase price due upon exercise by MTA of the purchase options if exercised. Theamount remaining after payment of transaction expenses, $24, was MTA’s net benefit from these two transactions.These amounts are deferred and amortized to operations over the period of the respective leases.
Other Lease TransactionsOn July 29, 1998, the MTAHQ, NYCTA and TBTA entered into a lease and related agreements whereby each agency, assublessees, will rent, for an initial stated term of approximately 50 years, an office building at 2 Broadway in lowerManhattan. The lease term expires on July 30, 2048, and, pursuant to certain provisions, is renewable for two addi-tional 15-year terms. The lease comprises both operating (for the lease of land) and capital (for the lease of thebuilding) elements. The total annual rental payments over the initial lease term are $1,602 with rent being abatedfrom the commencement date through June 30, 1999. During 2002 and 2001 the Authority made rent payments of$21. In connection with the renovation of the building and for tenant improvements, the Authority issued $121 and$328 in 2000 and 1999, respectively, of long-term obligations (see Note 6). The office building is principally occu-pied by NYCTA and TBTA.
On April 8, 1994, the Authority amended its lease for the Harlem/Hudson line properties, including Grand CentralTerminal. This amendment initially extends the lease term, previously expiring in 2031, an additional 110 years and,pursuant to several other provisions, an additional 133 years. In addition, the amendment grants the Authority anoption to purchase the leased property after the 25th anniversary of the amended lease. The amended lease compris-es both operating (for the lease of land) and capital (for the lease of buildings and track structure) elements.
In August 1988, the Authority entered into a 99-year lease agreement with Amtrak for Pennsylvania Station. Thisagreement, with an option to renew, is for rights to the lower concourse level and certain platforms. The $45 paid toAmtrak by the Authority under this agreement is included in other assets. This amount is being amortized over 30years. In addition to the 99-year lease, LIRR entered into an agreement with Amtrak to share equally the cost of thedesign and construction of certain facilities at Pennsylvania Station. Under this agreement, the Authority may berequired to contribute up to $60 for its share of the cost. As of December 31, 2000 the project was closed and $50were included in property and equipment.
Total rent expense under operating leases approximated $42 in 2003 and $14 in 2002.At December 31, 2003, the future minimum lease payments under noncancellable leases are as follows:
Year Operating Capital
2004 $ 24 $ 2552005 23 1492006 23 1872007 22 1,1502008 21 1012009-2013 85 7982014-2018 69 3962019-2023 60 7032024-2028 57 2692029-2033 46 1,099Thereafter 471 1,200
$901 6,307Amount representing interest (3,576)
Present value of capital lease obligations $2,731
62 M E T R O P O L I T A N T R A N S P O R T A T I O N A U T H O R I T Y
Notes to Financial StatementsYears Ended December 31, 2003 and 2002($ Millions)

63
Notes to Financial StatementsYears Ended December 31, 2003 and 2002
($ Millions)
8—Estimated Liability Arising from Injuries to Persons
A summary of activity in estimated liability as computed by actuaries arising from injuries to persons, includingemployees, and damage to third-party property, for the years ended December 31, 2003 and 2002 is presentedbelow:
2003 2002
Balance, beginning of year $ 949 $ 890Activity during the year:
Current year claims andchanges in estimates 253 192
Claims paid (153) (133)
Balance, end of period 1,049 949Less current portion (160) (153)
Long-term liability $ 889 $ 796
9—Commitments and Contingencies
The Authority actively monitors its properties for the presence of pollutants and/or hazardous wastes and evaluatesits exposure with respect to such matters. When the expense, if any, to clean up pollutants and/or hazardous wastesis estimable, it is accrued by the Authority. Management has reviewed with counsel all actions and proceedingspending against or involving the Authority, including personal injury claims. Although the ultimate outcome of suchactions and proceedings cannot be predicted with certainty at this time, management believes that losses, if any, inexcess of amounts accrued resulting from those actions will not be material to the financial position, results of oper-ations or cash flows of the Authority.
A Federal appellate court has upheld a District Court opinion that the Authority is a common carrier under theFederal Employers’ Liability Act (“FELA”) and therefore, an Authority police officer involved in a car accident whileon duty may seek recovery for damages based upon his alleged personal injuries pursuant to FELA. The court limitedits holding to the Authority’s employees and expressly excluded employees who provide local transportation servicesand those who operate bridges and tunnels. The Authority has filed a petition for a Rehearing In Banc, which wasdenied. The Authority has filed a petition for certiorari to the Supreme Court of the United States. The Authoritycannot determine the probable outcome of the litigation, but if the police officer’s position prevails, and the hold-ing is extended to those similarly situated, the Authority’s liability could be significant.
On December 30, 1996, MTAHQ, LIRR and MSBA entered into a Funding Agreement (“First Nassau CountyAgreement”) with the County of Nassau (the “County”). Pursuant to the First Nassau County Agreement, MTAHQagreed to make a grant transfer of $51 to the County, after certain conditions were met by the County. In exchange,the County would make project contributions to MTAHQ equal to two times the amount of the grant transfer, provid-ed that the aggregate amount of project contributions does not exceed $102. At December 31, 1997, $51 had beenpaid to the County as a grant and was recorded by MTAHQ as a receivable against future project contributions. AtDecember 31, 2002, MTAHQ had requisitioned $90 and had received $81 from the County for reimbursement of proj-ect costs incurred. A second Funding Agreement (“Second Nassau County Agreement”) with the County containingsubstantially the same terms was entered into by MTAHQ and LIRR on May 1, 1999. Pursuant to the Second NassauCounty Agreement, MTAHQ made a grant transfer of $70 to the County and, in exchange, the County made projectcontributions in 1991 of $140 to MTAHQ.
Pursuant to a Memorandum of Understanding (“MOU”) dated May 20, 1996, by and among MTAHQ, NYCTA and NYC,NYCTA was authorized, and made grant transfers to NYC, totaling $250 through 1997. In exchange, NYC agreed topay $500 from its capital budget to fund NYCTA’s capital program. The intent of the MOU was to provide additionalcapital funding to the NYCTA, which did not require the issuance of bonds supported by NYCTA revenues, including

fare receipts. MTAHQ treats the first $250 as a receivable due from NYC and the second $250 as contributed capital.As of December 31, 2002, NYC had made capital payments totaling $445, thereby reducing the receivable due fromNYC in the consolidated balance sheets to $0 and recognizing the additional $195 as contributed capital.
On March 31, 1995, the MTA Board agreed to a merger of the transit police with the New York City PoliceDepartment, in accordance with a memorandum of understanding between NYCTA and NYC. Pursuant to the terms ofthe merger, NYCTA’s operation of the transit police and NYC’s obligation to reimburse the cost of operating the tran-sit police terminated effective April 2, 1995. NYC has assumed the liability for substantially all past and future costsassociated with operating the transit police, including all future pension costs. NYCTA has asserted a claim ofapproximately $92 against NYC relating to reimbursement of costs incurred in the operation of the transit police.NYCTA claims that NYC underpaid these amounts in the period from 1988 through December 1994. In January 1995,NYCTA filed a demand for arbitration pursuant to the lease governing the overall relationship between NYCTA andNYC to pursue, among other matters, payment of these arrearages. The arbitration matter has been held in abeyancewhile NYC, NYCTA, and the Authority explore the possibility of an amicable resolution.
In 1990, a fire occurred in a subway tunnel operated by NYCTA resulting in passenger injuries on a subway trainpassing through that tunnel. In 1991, a subway train operated by NYCTA derailed at Union Square resulting ininjuries to passengers who were aboard the train. While the ultimate loss from each of these events has exceededNYCTA’s retention limit, thereby resulting in a liability to the ELF, there are few remaining cases. A verdict has beenreached in a 1993 subway accident case. The verdict will require a payment from ELF in the amount of $4. Theamount was paid in November 2003 by ELF before its termination and transferring of the assets to FMTAC.
The Authority previously reported that its lease of new office space at 2 Broadway has resulted in civil litigationbetween the Authority and the owner/landlord of 2 Broadway in the Supreme Court of New York, New York County(the “Supreme Court action”), asking for declaratory, injunctive and monetary relief as a result of the landlord’sdefective performance and interference with the reconstruction and refurbishment of the base, core and shell of thebuilding (the “Base Building Work”). In turn, the landlord commenced a nonpayment of rent proceeding in the CivilCourt of New York City, New York County (the “Civil Court action”), seeking to collect rent withheld by the Authorityto cover the costs of the Base Building Work, which was being financed by the Authority. The Civil Court action hasbeen stayed pending adjudication of the Supreme Court action, on the condition that the Authority pay use andoccupancy rent. On May 22, 2000, the Supreme Court granted the Authority’s request for a preliminary injunctionenjoining the defendants from taking any action to interfere with the Base Building Work, evict the Authority, orterminate the Authority’s tenancy, pending the outcome of the case. On January 16, 2001, the Appellate Divisionmodified the May 22, 2000 order to condition the injunction on the Authority’s payment of use and occupancy rent,from that day forward. On November 22, 2002, the Court granted in part the Authority’s motion for summary judg-ment and referred the determination of the full amount of the Base Building Work budget to a judicial referee. OnNovember 4, 2003, the parties to this dispute entered into a Settlement Agreement that resolves all the issues inboth lawsuits on terms that are acceptable to the Authority and which will not have a negative impact on its budgetfor the development of the property. The lawsuits have both been dismissed.
64 M E T R O P O L I T A N T R A N S P O R T A T I O N A U T H O R I T Y
Notes to Financial StatementsYears Ended December 31, 2003 and 2002($ Millions)

65
Notes to Financial StatementsYears Ended December 31, 2003 and 2002
($ Millions)
10—Segment Information
Bridgesand
MTA *Commuters Transit Tunnels Eliminations Total
2003
Operating revenue $ 85 $ 825 $ 2,581 $ 1,069 $ (37) $ 4,523Depreciation and amortization 26 339 829 41 – 1,235Subsidies and grants 220 – 318 – (159) 379Tax revenue 1,627 – 1,146 – (757) 2,016Interagency subsidy 432 – 243 (1,267) 592 –Operating (deficit) surplus (356) (996) (2,385) 699 – (3,038)Net (deficit) surplus (590) 579 1,451 (789) – 651
Capital expenditures 3,663 237 746 1,094 (1,905) 3,835Total assets 9,735 8,408 22,661 3,304 (1,574) 42,534Net working capital 801 (39) 26 (105) (193) 490Long-term debt 10,987 – – 6,768 (42) 17,713Net assets (6,187) 7,257 20,488 (4,045) – 17,513
2002Operating revenue $ 81 $ 740 $ 2,330 $ 939 $ (37) $ 4,053Depreciation and amortization 26 312 761 36 – 1,135Subsidies and grants 111 – 318 – – 429Tax revenue 634 – 1,034 – – 1,668Interagency subsidy 163 – 100 (263) – –Operating (deficit) surplus (252) (980) (2,310) 603 – (2,939)Net (deficit) surplus (6,265) 502 6,066 57 – 360
Capital expenditures 4,313 251 734 263 (1,073) 4,488Total assets 9,622 7,751 21,093 3,536 (2,234) 39,768Net working capital 1,166 (70) (120) 119 (324) 771Long-term debt 10,214 – 6,097 – (42) 16,269Net assets (5,598) 6,678 19,037 (3,255) – 16,862
*Includes the amounts for MTAHQ, MSBA, SIRTOA, FMTAC and ELF.NOTE: Only MTA and Bridges and Tunnels agencies are issuing debt.

11—Settlement of Claims
The September 11, 2001 terrorist attack on the World Trade Center in New York resulted in the following significantitems: (1) significant physical and structural damage to NYCTA’s N, R, 1 and 9 lines and related facilities and sta-tions; (2) temporary closure of TBTA’s bridges and tunnels, not all facilities, and certain restrictions imposed on thenumber of vehicle occupants when the facilities were reopened; (3) safety and security expenditures in and aroundthe World Trade Center; and (4) temporary closure of MNCR’s Grand Central Terminal and LIRR’s Pennsylvania Station.
In April 2004, the Authority settled its claims with its property insurance carriers for damage caused as a result ofthe September 11, 2001 terrorist attack. The global settlement in the amount of $398 represents the settlement ofclaims for losses related to physical damage of property, loss of revenues, increased operating expenses, and otherexpenses related to the clean-up of its facilities caused by the attack.
On November 4, 2003, MTA entered into agreement to end the litigation between the Authority and the owners ofthe 2 Broadway facilities. The settlement provides a $45 rent credit to the Authority over a 30-year period commenc-ing January 1, 2004.
12—Subsequent Events
On March 10, 2004, MTA issued its MTA Dedicated Tax Fund Bonds, Series 2004A in the aggregate principal amountof $250 and MTA Dedicated Tax Fund Variable Rate Bonds, Series 2004B (Auction Rate Securities) in the aggregateprincipal amount of $500 to provide long-term financing for transit and commuter capital projects.
66 M E T R O P O L I T A N T R A N S P O R T A T I O N A U T H O R I T Y
Notes to Financial StatementsYears Ended December 31, 2003 and 2002($ Millions)

67
January 1, January 1, January 1,2003 2002 2001
LIRR
a. Actuarial value of plan assets $ 701.9 $ 820.8 $ 813.8
b. Actuarial accrued liability (AAL) 1,567.2 1,451.4 1,361.1
c. Total unfunded AAL (UAAL) [b-a] 865.3 630.6 547.3
d. Funded ratio [a/b] 44.8% 56.6% 59.8%
e. Covered payroll $ 174.9 $ 180.3 $ 192.5
f. UAAL as a percentage of covered payroll [c/e] 494.7% 349.8% 284.3%
SIRTOA
a. Actuarial value of plan assets $ 34.4 $ 33.8 $ 31.0
b. Actuarial accrued liability (AAL) 42.4 42.0 39.2
c. Total unfunded AAL (UAAL) [b-a] 8.1 8.2 8.2
d. Funded ratio [a/b] 81.0% 80.5% 79.1%
e. Covered payroll $ 15.7 $ 15.3 $ 13.7
f. UAAL as a percentage of covered payroll [c/e] 51.6% 53.6% 59.9%
MaBSTOA
a. Actuarial value of plan assets $ 629.8 $ 656.4 $ 611.5
b. Actuarial accrued liability (AAL) 1,564.6 1,614.9 1,592.5
c. Total unfunded AAL (UAAL) [b-a] 934.8 958.5 981.0
d. Funded ratio [a/b] 40.3% 40.6% 38.4%
e. Covered payroll $ 450.6 $ 432.7 $ 400.5
f. UAAL as a percentage of covered payroll [c/e] 207.5% 221.5% 244.9%
MTA
a. Actuarial value of plan assets $ 243.2 $ 255.5 $ 240.4
b. Actuarial accrued liability (AAL) 268.0 284.3 270.2
c. Total unfunded AAL (UAAL) [b-a] 24.8 28.8 29.8
d. Funded ratio [a/b] 90.7% 89.9% 89.0%
e. Covered payroll $ 154.0 $ 144.7 $ 135.1
f. UAAL as a percentage of covered payroll [c/e] 16.1% 19.9% 22.1%
Required Supplementary Information: Schedule of Pension Funding ProgressUnaudited
($ Millions)

This page is intentionally left blank

Statistical Section

70 M E T R O P O L I T A N T R A N S P O R T A T I O N A U T H O R I T Y
10-Year Statistical Tables
MTA Passenger Miles
(Millions)
0 2,000 4,000 6,000 8,000 10,000 12,000 14,000
Rail Cars Buses
12,112
9,997
10,172
10,951
11,923
12,757
12,614
10,772
11,573
2,024
1,291
1,471
1,419
1,448
1,674
1,688
1,939
1,512
11,9911,782
1994
1995
1996
1997
1998
1999
2000
2001
2002
2003
Rail Cars Buses
0 200 400 600 800 1,000 1,200 1,400 1,600
1,574
1,224
1,237
1,278
1,436
1,542
1,568
1,255
1,350
793
544
549
517
644
696
729
770
564
1,541766
1994
1995
1996
1997
1998
1999
2000
2001
2002
2003
MTA Revenue Passengers
(Millions) Rail Cars Buses

71
10-Year Statistical Tables
Rail Cars Buses
1994
1995
1996
1997
1998
1999
2000
2001
2002
2003
0 100 200 300 400 500
443
405
412
411
431
408
419
435
411
115
99
98
101
102
106
111
113
98
442
MTA Revenue Vehicle Miles
(Millions)
116
Rail Cars Buses
1994
1995
1996
1997
1998
1999
2000
2001
2002
2003
0 100 200 300 400
260
266
260
279
289
296
293
267
300
297
MTA Bridges and Tunnels Revenue Vehicles
(Millions)

72 M E T R O P O L I T A N T R A N S P O R T A T I O N A U T H O R I T Y
10-Year Statistical Tables
MTA Buses and Rail Cars
(Millions)
1994
1995
1996
1997
1998
1999
2000
2001
2002
2003
Rail Cars Buses
8,487
7,802
7,819
7,800
7,843
7,849
8,231
7,800
7,820
4,864
4,029
3,899
4,184
4,477
4,756
4,871
3,874
0 2,000 4,000 6,000 8,000 10,000
4,930
8,2594,895
44.8%
47.6%
57.8%
54.0%
50.3%
46.4%
47.6%
45.1%
43.7%
0 20 40 60 80 100
43.6%
1994
1995
1996
1997
1998
1999
2000
2001
2002
2003
MTA Farebox Recovery Ratio
(Percent)

73
10-Year Statistical Tables
13,728
13,819
14,020
14,151
14,295
14,396
13,957
14,454
14,592
0 2,000 10,000 12,000 14,000 16,000
1994
1995
1996
1997
1998
1999
2000
2001
2002
2003
Population within MTA Service Area
(Thousands) New York State Connecticut
14,641
MTA Employees
1994
1995
1996
1997
1998
1999
2000
2001
2002
2003
0 10,000 20,000 30,000 40,000 50,000 60,000 70,000
65,465
58,201
56,551
58,644
61,261
62,800
64,337
57,636
64,138
63,884

74 M E T R O P O L I T A N T R A N S P O R T A T I O N A U T H O R I T Y
2003 Operating Statistics
MTA MTA MTA MTANew York City New York City Staten Island Long Island
Subway Bus1 Railway Rail Road
Paid rides (annual)
2003 1,384,068,220 735,272,542 3,398,232 80,924,069
2002 1,413,177,943 762,096,318 3,594,677 83,918,140
Gain (Loss) (29,109,723) (26,823,776) (196,445) (2,994,071)
Percent change -2.1% -3.5% -5.5% -3.6%
Paid rides (average weekday)
2003 4,512,503 2,368,686 12,359 287,930
2002 4,590,571 2,452,669 13,011 299,254
Gain (Loss) (78,068) (83,983) (652) (11,324)
Percent change -1.7% -3.4% -5.0% -3.8%
Annual revenue vehicle miles
2003 334,505,342 103,225,945 2,145,732 57,512,396
2002 333,565,884 102,134,686 2,148,000 57,736,700*
Gain (Loss) 939,458 1,091,259 (2,268) (224,304)
Percent change 0.3% 1.1% -0.1% -0.4%
Average number weekdaytrain/bus trips 8,510 47,731 130 726
Stations 468 — 22 124
Train lines/bus routes 27 244 1 11
Route milesRail route miles7 233 — 14 319Bus route miles — 2,017 — —
Track miles8 660 — 29 594
Rolling stock
Rail cars 6,146 — 64 1,118Buses — 4,483 — —
Bridges — — — —
Tunnels — — — —
Employees 26,594 14,244 305 6,309
1. Includes Manhattan and Bronx Surface Transit Operating Authority, an MTANew York City Transit subsidiary.
2. Ridership and employee statistics include both fixed-route and paratransitoperations.
3. Includes operations on the Harlem, Hudson, and New Haven lines in NewYork State and Connecticut as well as the New York State portions of thePort Jervis and Pascack Valley lines.
4. MTA New York City Subway plus MTA New York City Bus.
5. MTA Long Island Rail Road plus MTA Metro-North Railroad.

75
2003 Operating Statistics
6. MTA ridership totals do not include MTA Bridges and Tunnels vehicle counts.
7. Nondirectional route miles; i.e., the distance from terminal to terminal.Several rail or bus lines may share the same route.
8. Does not include track in yards.
9. Includes 1,505 employees at CPM, 1,439 employees at Telecommunicationsand Information Services, 1,305 at MetroCard Operations, 1,811 employeesat Executive Vice President, 103 at Paratransit, 1 at MTA Capital Construction,and 478 employees at other General and Administrative.
10. Includes 553 employees at MTA Headquarters and 673 employees at MTAPublic Safety.
* Revised from 2002 Annual Report
MTA MTA MTA MTA Combined MTALong Island Metro-North Bridges and New York City MTA Railroads Network
Bus2 Railroad3 Tunnels Transit Total4 Total5 Total6
30,433,281 72,548,000 297,178,497 2,119,340,762 153,472,069 2,306,644,344
31,323,743 73,140,809* 299,994,683* 2,175,274,261 157,058,949* 2,367,251,630*
(890,462) (592,809) (2,816,186) (55,933,499) (3,586,880) (60,607,286)
-2.8% -0.8% -0.9% -2.6% -2.3% -2.6%
102,401 249,700 839,536 6,881,189 537,630 7,533,579
104,604 251,836* 842,532* 7,043,240 551,090* 7,711,945*
(2,203) (2,136) (2,996) (162,051) (13,460) (178,366)
-2.1% -0.9% -0.4% -2.3% -2.4% -2.3%
12,670,397 48,745,706 — 437,731,287 106,258,102 558,805,518
12,604,130 49,463,127 — 435,700,570 107,199,827* 557,652,527*
66,267 (717,421) — 2,030,717 (941,725) 1,152,991
0.5% -1.5% — 0.5% -0.9% 0.2%
4,013 644 — 56,241 1,370 61,754
— 120 — 468 244 734
54 6 — 271 17 343
— 384 — 233 703 950950 — — 2,017 — 2,967
— 775 — 660 1,369 2,058
— 931 — 6,146 2,049 8,259412 — — 4,483 — 4,895
— — 7 — — 7
— — 2 — — 2
1,126 5,705 1,733 47,4809 12,014 63,88410

76 M E T R O P O L I T A N T R A N S P O R T A T I O N A U T H O R I T Y
Peter S. KalikowChairman
David S. MackVice Chairman
Edward B. DunnVice Chairman
Katherine N. LappExecutive Director
Members of the BoardAndrew B. Albert†
James F. Blair†
Nancy Shevell Blakeman
Anthony J. Bottalico†
Barry L. Feinstein
Lawrence W. Gamache
James H. Harding Jr.
Susan L. Kupferman
Mark D. Lebow
James L. McGovern†
Mark Page
Ernest J. Salerno
Andrew M. Saul
James L. Sedore Jr.
James S. Simpson
Edward A. Vrooman
Ed Watt†
Alfred E. Werner
The Metropolitan Transportation Authority is a public-benefit corporation chartered by the State of New York, George E. Pataki, Governor.
MTA New York City TransitLawrence G. Reuter President370 Jay StreetBrooklyn, NY 11201-5190718-330-3000
MTA Metro-North RailroadPeter A. CannitoPresident347 Madison AvenueNew York, NY 10017-3739212-340-3000
MTA Long Island Rail RoadJames J. DermodyPresidentJamaica StationJamaica, NY 11435-4380718-558-7400
MTA Bridges and TunnelsMichael C. AscherPresidentRandalls IslandNew York, NY 10035-0035646-252-7000
MTA Long Island BusNeil S. YellinPresident700 Commercial AvenueGarden City, NY 11530-6410516-542-0100
MTA Capital ConstructionMysore L. NagarajaPresident2 BroadwayNew York, NY 10004-2207646-252-4277
347 Madison AvenueNew York, NY 10017-3739212-878-7000
www.mta.info
For additional copies of the 2003 MTA annual report, write to MTA Marketing and Corporate Communications, 347 Madison Avenue, New York, NY 10017-3739; for informa-tion about the 2003 financial statements, write to MTA Office of the Comptroller, 345 Madison Avenue, New York, NY 10017-3937.
The 2003 MTA annual report and financial statements are also available on our website at www.mta.info.
†Nonvoting member
MTA Agencies


42
State of New York
347 Madison AvenueNew York, NY 10017-3739
www.mta.info
© 2004 Metropolitan Transportation AuthorityPrinted on recycled paper