progress in wqstm climate change analyses
TRANSCRIPT

Progress in WQSTM Climate Change Analyses
Richard Tian and CBPO modeling team
Modeling Quarterly Review04/02/2019Annapolis
1
2
Outline• Sea level rise
• Heat flux
• Temperature parameter values
• Nutrient loading
• Preliminary results for 2025
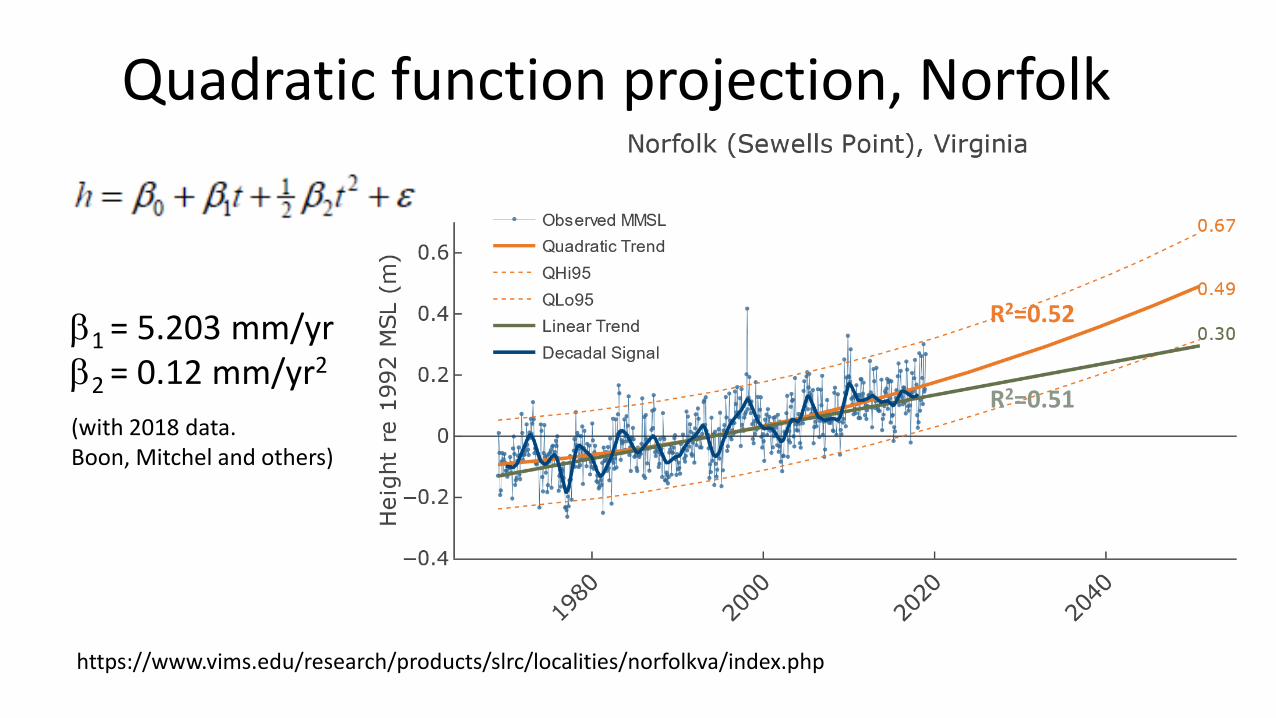
β1 = 5.203 mm/yrβ2 = 0.12 mm/yr2
(with 2018 data. Boon, Mitchel and others)
https://www.vims.edu/research/products/slrc/localities/norfolkva/index.php
Quadratic function projection, Norfolk
R2=0.52
R2=0.51
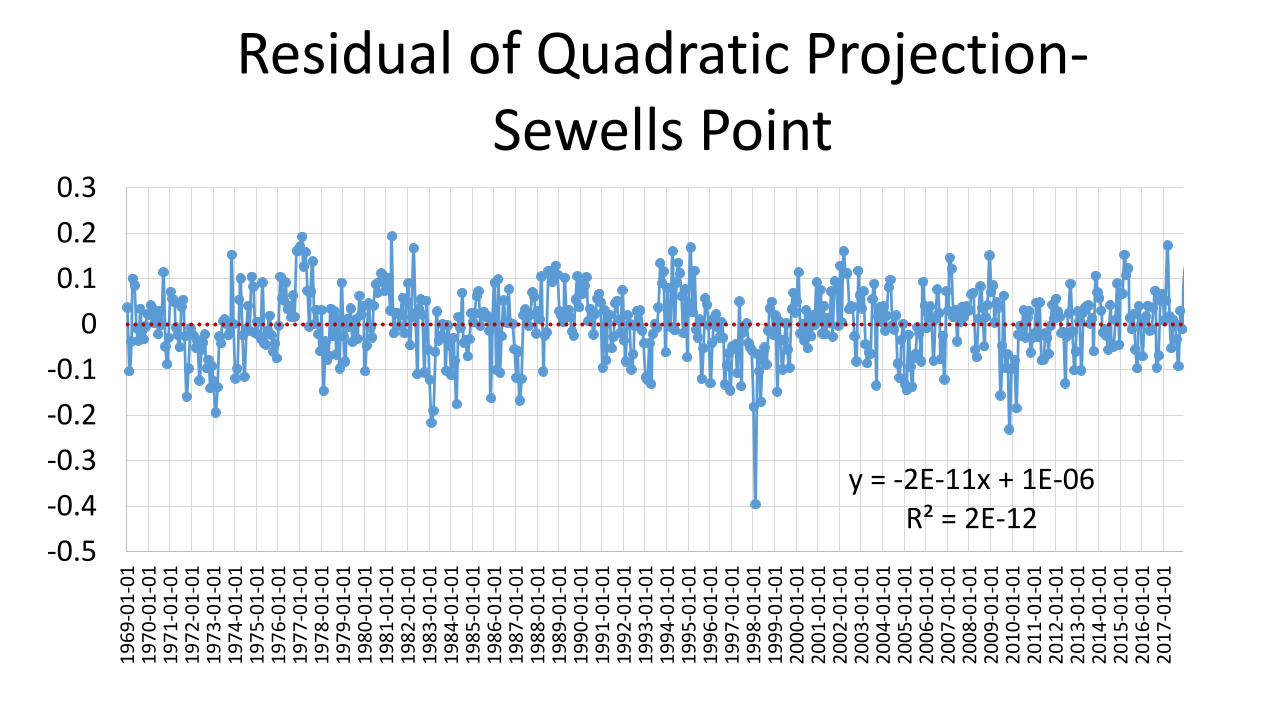
y = -2E-11x + 1E-06R² = 2E-12
-0.5-0.4-0.3-0.2-0.1
00.10.20.3
1969
-01-
0119
70-0
1-01
1971
-01-
0119
72-0
1-01
1973
-01-
0119
74-0
1-01
1975
-01-
0119
76-0
1-01
1977
-01-
0119
78-0
1-01
1979
-01-
0119
80-0
1-01
1981
-01-
0119
82-0
1-01
1983
-01-
0119
84-0
1-01
1985
-01-
0119
86-0
1-01
1987
-01-
0119
88-0
1-01
1989
-01-
0119
90-0
1-01
1991
-01-
0119
92-0
1-01
1993
-01-
0119
94-0
1-01
1995
-01-
0119
96-0
1-01
1997
-01-
0119
98-0
1-01
1999
-01-
0120
00-0
1-01
2001
-01-
0120
02-0
1-01
2003
-01-
0120
04-0
1-01
2005
-01-
0120
06-0
1-01
2007
-01-
0120
08-0
1-01
2009
-01-
0120
10-0
1-01
2011
-01-
0120
12-0
1-01
2013
-01-
0120
14-0
1-01
2015
-01-
0120
16-0
1-01
2017
-01-
01
Residual of Quadratic Projection-Sewells Point

Boesch et al., 2018
Probabilistic 21st and 22nd century sea-level projectionsat a global network of tide-gauge sites (Kopp et al. 2014)BA13: Bamber and Aspinall [2013].GIC: glacier and ice cap.SMB: surface mass balance.

0.00
0.22
0.31
0.420.48
0.54
0.00
0.23
0.32
0.410.46
0.52
0.00
0.10
0.20
0.30
0.40
0.50
0.60
6/15
/199
5
6/14
/200
5
6/15
/201
5
6/14
/202
5
6/15
/203
5
6/14
/204
5
6/15
/205
5
6/14
/206
5
SLR
(m)
Quadratic-1995
K14
SLR future projection-Sewells Point

7
0
0.22
0.31
0.420.475
0.53
0
0.17
0.3
0.430.5
0
0.1
0.2
0.3
0.4
0.5
0.6
6/15
/199
5
6/14
/200
5
6/15
/201
5
6/14
/202
5
6/15
/203
5
6/14
/204
5
6/15
/205
5
6/14
/206
5
SLR
(m)
Current Old
SLR future projection-Sewells Point(Climate Resiliency Group)

SKY COVERAIR TEMPERATURE DEW POINT WIND
Equilibrium T (TE) Heat exchange coefficient (KT)
Hex program
∆T=KE(TE-T)/(Cp•V)
ICM Meteorological Forcing for Heat Transfer From Air to the Tidal Waters
Climate Change +∆Tair(2025) = 1.06 °C
Dew point recomputed
8

9
f(T)=�𝑒𝑒−𝑘𝑘𝑘 𝑇𝑇−𝑇𝑇𝑇𝑇𝑇𝑇𝑇𝑇 2 ,𝑇𝑇 ≤ 𝑇𝑇𝑇𝑇𝑇𝑇𝑇𝑇𝑒𝑒−𝑘𝑘2 𝑇𝑇−𝑇𝑇𝑇𝑇𝑇𝑇𝑇𝑇 2,𝑇𝑇 > 𝑇𝑇𝑇𝑇𝑇𝑇𝑇𝑇
0
2
4
6
8
0 10 20 30 40
grow
th ra
te (d
-1)
Temperature (°C)
P3-Green Algae
revised old0
1
2
3
4
5
0 10 20 30 40
Gro
wth
rate
(d-1
)
Temperature (°C)
P1-Cyanobacteria
revised old
Revised temperature control on phytoplankton growth rate
From Carl Cerco
0
1
2
3
4
0 10 20 30
Gro
wth
rate
(d-1
)
Temperature (°C)
P2-Diatom
SATC recommendation
10
0
0.5
1
1.5
2
2.5
3
0 10 20 30
fact
or
Temprature (°C)
Old Revised
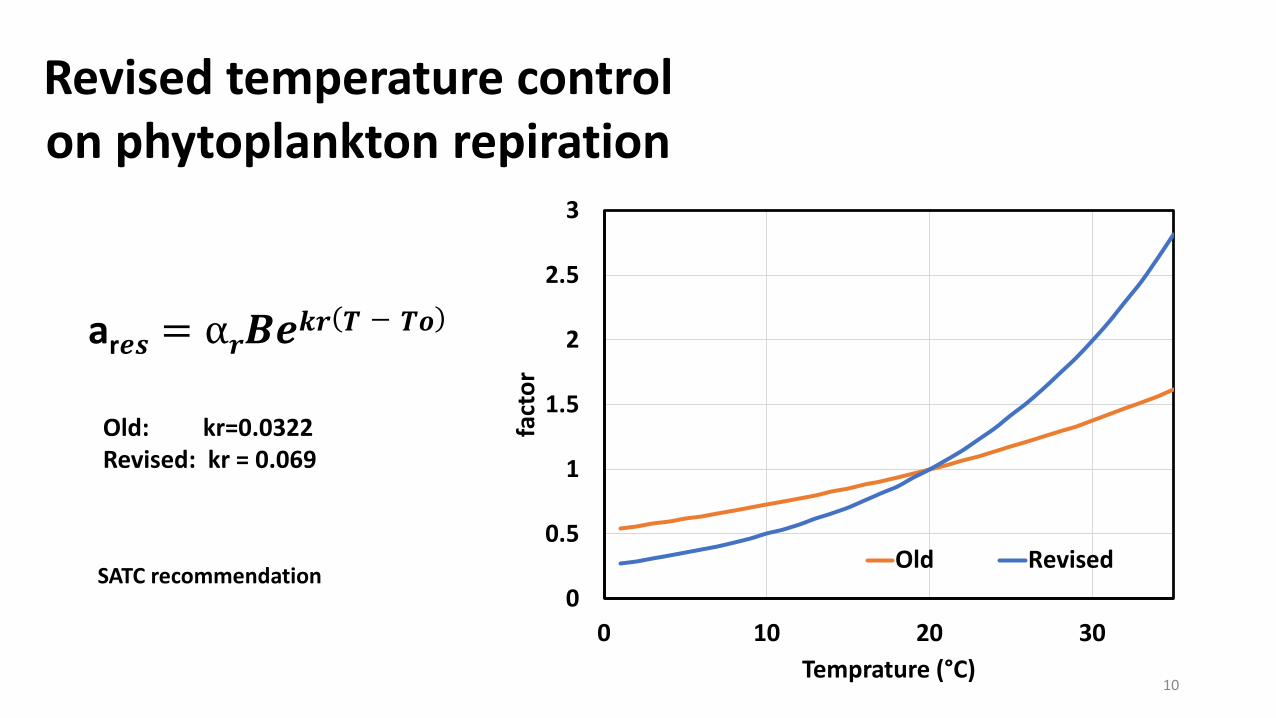
ar𝒆𝒆𝒆𝒆 = α𝒓𝒓𝑩𝑩𝒆𝒆𝒌𝒌𝒓𝒓(𝑻𝑻 − 𝑻𝑻𝑻𝑻)
Revised temperature control on phytoplankton repiration
SATC recommendation
Old: kr=0.0322Revised: kr = 0.069

2.4%
2.7%
2%
4%
2025Base 2025WIP
Nitr
ogen
load
incr
ease
(%)
3.1%
3.6%
0%
4%
2025Base 2025WIPPh
osph
orus
load
incr
ease
Nitrogen loading Phosphorus loading
Changes in nutrient loading in the 2025
From Gopal Bhatt11
12
0.0
0.2
0.4
0.6
0.8
1.0
CB2.
1CB
2.2
CB3.
2CB
3.3C
CB4.
1CCB
4.2C
CB4.
3CCB
4.4
CB5.
1CB
5.2
CB5.
3CB
5.4
CB5.
5CB
6.2
CB7.
2CB
7.3
CB7.
4CB
8.1E
∆T
(℃)
Surface Bottom
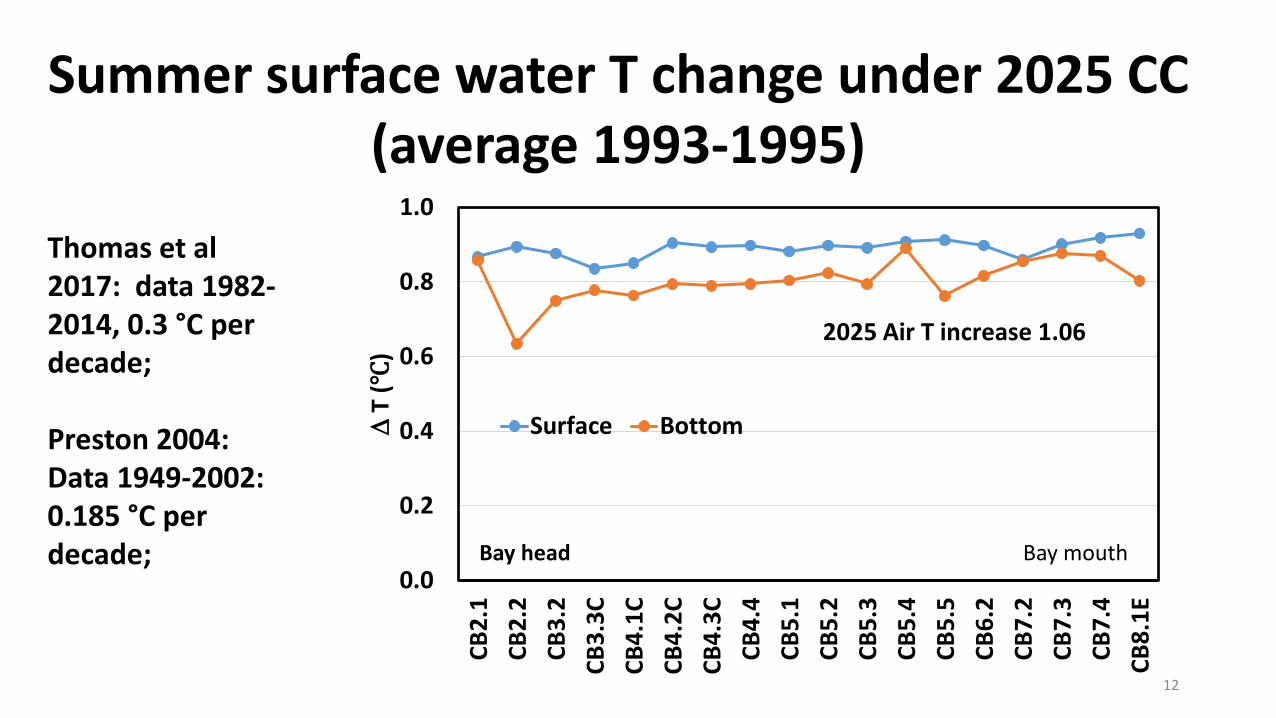
2025 Air T increase 1.06
Summer surface water T change under 2025 CC (average 1993-1995)
Thomas et al 2017: data 1982-2014, 0.3 °C per decade;
Preston 2004: Data 1949-2002: 0.185 °C per decade; Bay head Bay mouth
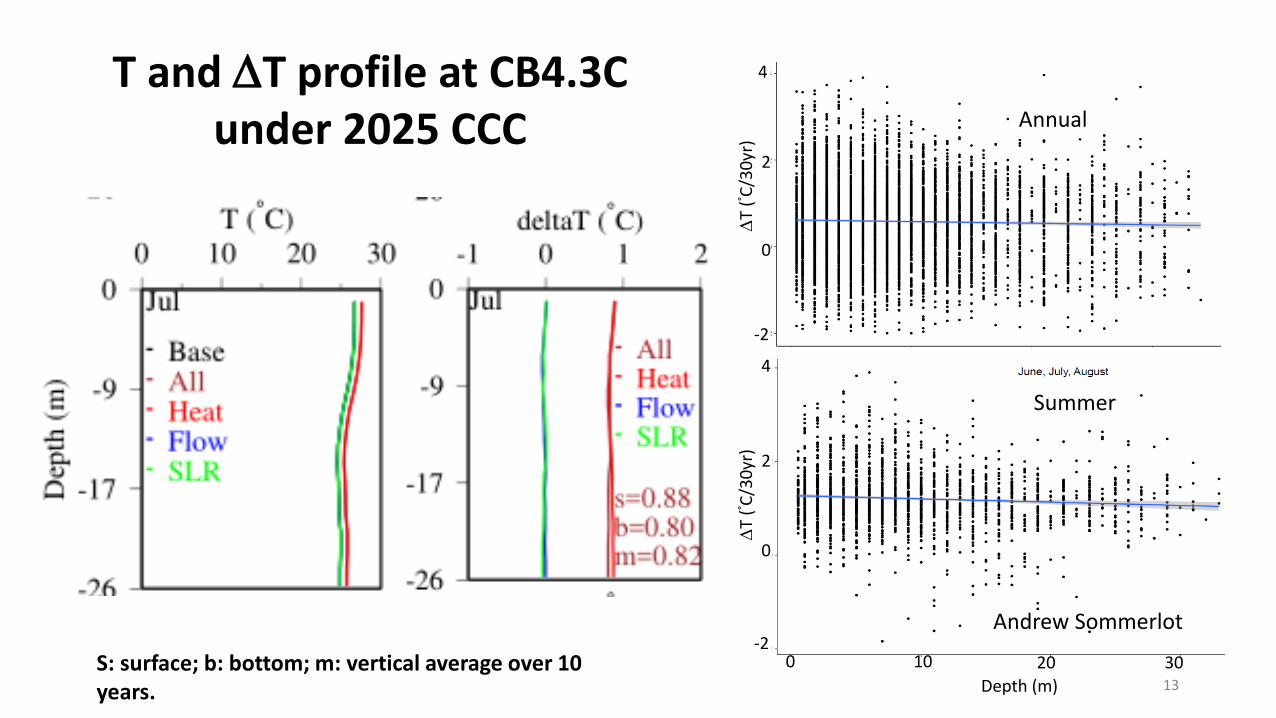
T and ∆T profile at CB4.3Cunder 2025 CCC
S: surface; b: bottom; m: vertical average over 10 years.
Andrew Sommerlot
0 10 20 30Depth (m)
∆T
(° C/3
0yr)
0
2
4
-2
∆T
(° C/3
0yr)
0
2
4
-2
Summer
Annual
13
14
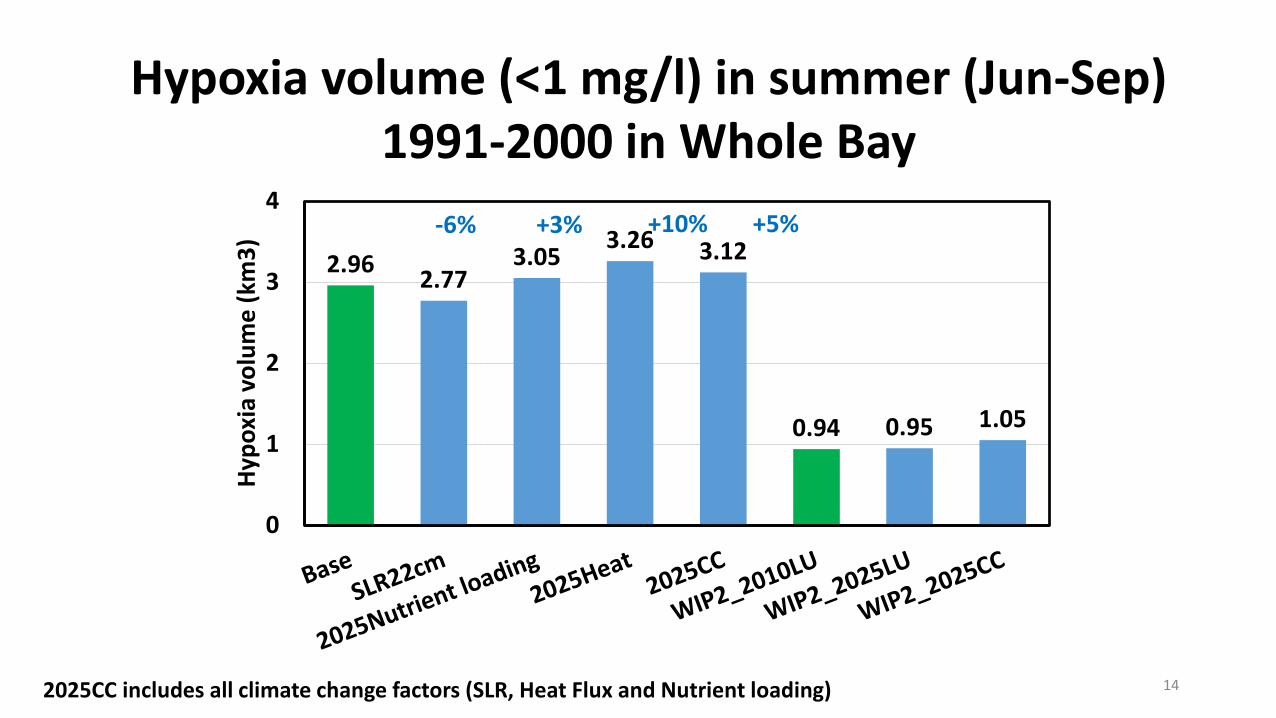
Hypoxia volume (<1 mg/l) in summer (Jun-Sep) 1991-2000 in Whole Bay
2.96 2.773.05
3.26 3.12
0.94 0.95 1.05
0
1
2
3
4
Hypo
xia
volu
me
(km
3)-6% +3% +10% +5%
2025CC includes all climate change factors (SLR, Heat Flux and Nutrient loading)

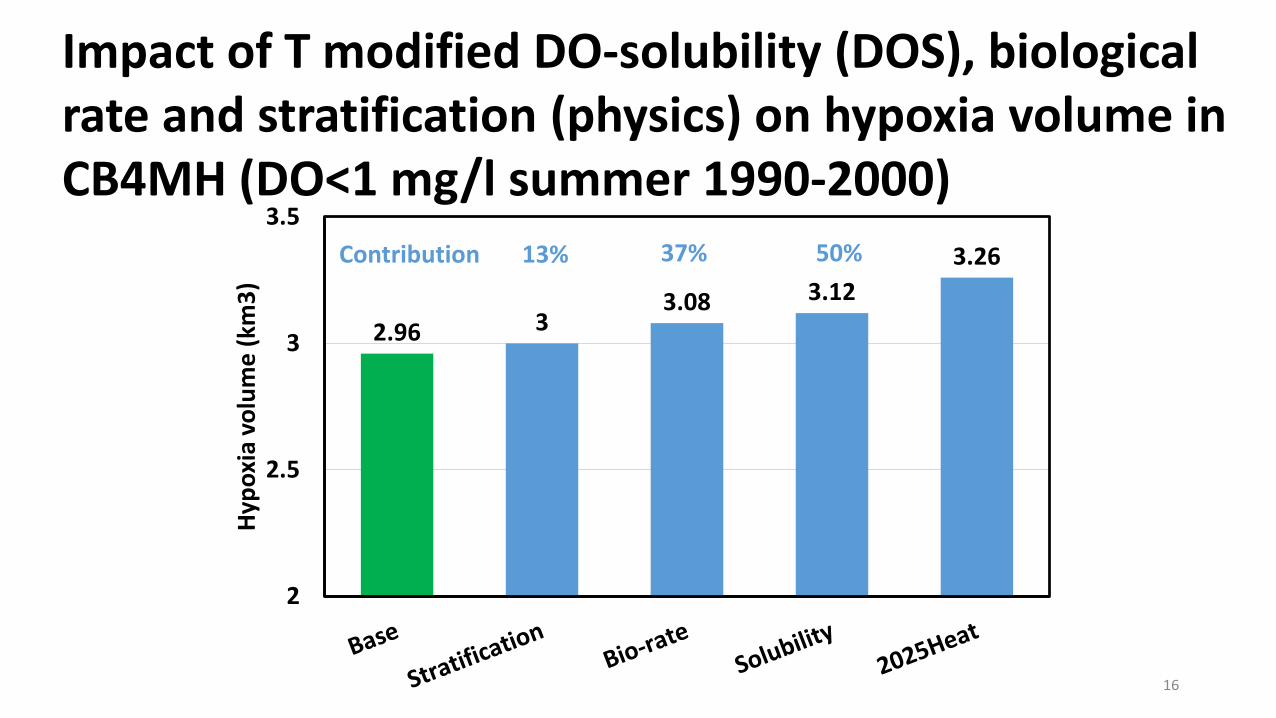
Temperature effects
• Solubility: 0.9 °C increase decreases solubility by 0.13 mg/l, or 1.7%.
• Biological rates: increase 6% over 0.9 °C (Q10=2)
• Stratification (physics)
15
16
2.96 33.08 3.12
3.26
2
2.5
3
3.5Hy
poxi
a vo
lum
e (k
m3)
Impact of T modified DO-solubility (DOS), biological rate and stratification (physics) on hypoxia volume in CB4MH (DO<1 mg/l summer 1990-2000)
50%37%13%Contribution

17
Below Potomac Transect
CB4/CB5 Transect
CB3/CB4 Transect
CB2/CB3Transect
6,494 Base6640 SLR (2%)
7,236 Base7,374 SLR (2%)
4,7415,045 (6%)
5,3105,611 (6%)
1,9111,979 (4%)
2,3222,336 (1%)782
785
1,3561,352
Base = Beta 2 Calibration. SLR = 0.22m Sea Level Rise Scenario representing relative Chesapeake sea level riser from 1995 to 2050. Units in mean cubic meters per second (m3/s) for summer 1993 to 1995 hydrodynamics.
Toward OceanToward Head of Bay
Cross-transect water mass fluxesBase case versus sea level rise (SLR)Summer 1993-1995
17

18
4.64.74.84.9
55.15.2
DO_DC (mg/l)
1.51.521.541.561.58
1.6
PP (g C/m2/day)
0.36
0.38
0.4
0.42
Resp_OW (mg/m3/day)
0.39
0.41
0.43
0.45
SOD (g C/m2/day)
10
11
12CL_OW (ug/L)
Diagnosis on Climate Change Scenarios, CB4,
average 1991-2000

19191919
Below Potomac Transect
CB4/CB5 Transect
CB2/CB3Transect
CB1/CB2Transect
9.2 Base9.2 SLR
2.4 Base2.4 SLR
10.710.9(2%)
3.33.5(6%)
9.29.2
1.81.87.6
7.6
0.60.6
Base = Beta 2 Calibration. SLR = 0.22m Sea Level Rise Scenario representing relative Chesapeake sea level rise from 1995 to 2025. Units in mean gram per second (g/s) averaged over June-Sep 1993-1995.
Toward OceanToward Head of Bay
Cross-transect TN fluxes: Base case versus sea level rise (SLR), summer 1993-1995
CB3/CB4 Transect
OBCTransect
8.08.0
0.90.9
10.810.8
3.63.6
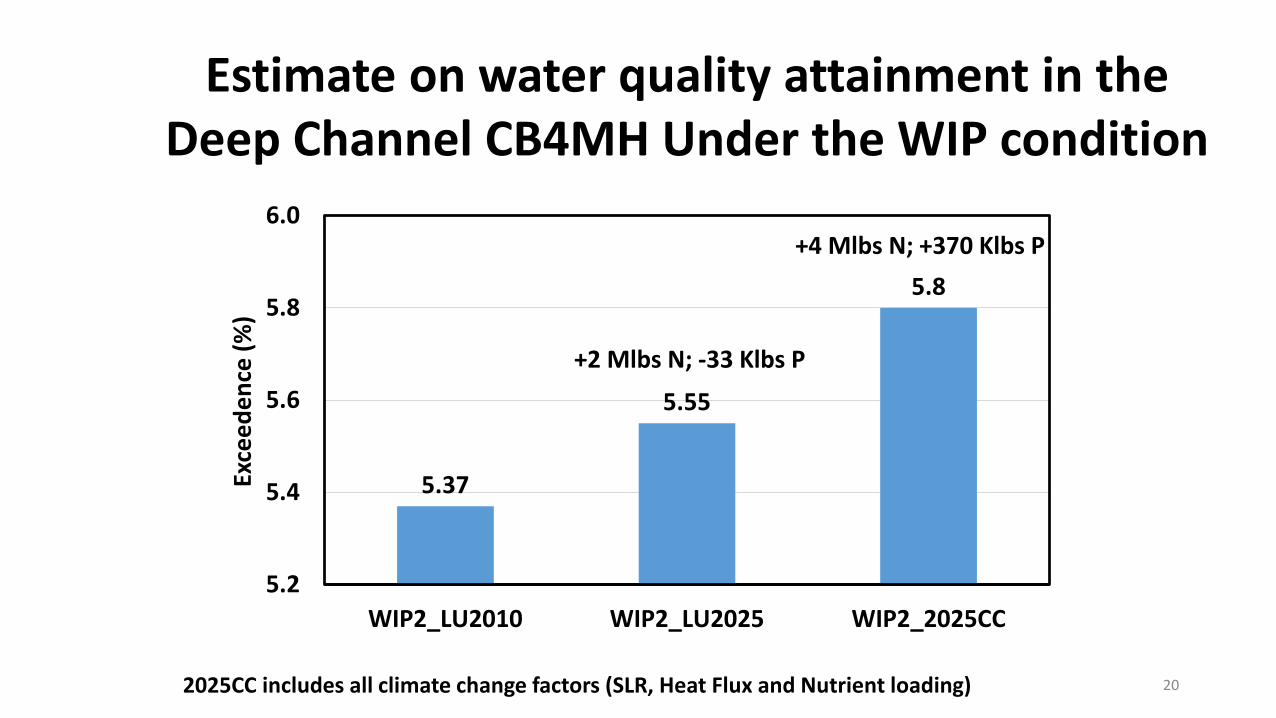
Estimate on water quality attainment in the Deep Channel CB4MH Under the WIP condition
20
5.37
5.55
5.8
5.2
5.4
5.6
5.8
6.0
WIP2_LU2010 WIP2_LU2025 WIP2_2025CC
Exce
eden
ce(%
)
2025CC includes all climate change factors (SLR, Heat Flux and Nutrient loading)
+2 Mlbs N; -33 Klbs P
+4 Mlbs N; +370 Klbs P

Messages
• Temperature is the most sensitive variable in controlling DO under climate change conditions, followed by sea level rise and nutrient loading.
• Solubility contribute 50% to temperature effect.• Temperature deteriorates water quality whereas sea level rise
improves DO in the deep channel, with combined effect of 0.4% degradation of attainment under the WIP condition.
• Working on projection for 2035, 2045 and 2055.
21