progress in the development of improved - university of iowa
TRANSCRIPT

Progress in the Development of Improved Feeding Rules for the Risering of Steel
Castings
Richard A. Hardin - Research Engineer Xingyun Shen - Graduate Student Jiangping Gu - Research Engineer Christoph Beckermann - Professor
Solidification Laboratory Department of Mechanical Engineering
The University of Iowa Iowa City, Iowa 52242
Abstract
Based on results from computational studies and plate casting trials, deficiencies in the steel casting feeding rules as currently published by the Steel Founders’ Society of America (SFSA) were determined. A methodology for the development of improved steel casting feeding rules was established based on the Niyama criterion determined from simulation. Newly developed feeding rules using this methodology are presented for numerous configurations. Unlike the current SFSA rules, these rules do not depend on the type of plate geometry cast (bar, semi-plate or plate), and are applicable to wider ranges of casting section width to thickness ratios than are the old rules. The feeding distances given by the new rules are longer than the old rules, in most cases about two times the feeding distances given by the old rules. It is demonstrated that use of the new rules leads to typical yield improvements of about 5%, and can increase the yield by up to 14% over castings risered using the current SFSA rules. The existing SFSA guidelines for riser dimensioning are shown through simulations to be valid and entirely adequate. Results from casting trials performed by foundries participating in this project show that the new rules are more accurate than the current rules. In addition, the new rules offer a straightforward methodology of tailoring the feeding of the casting to allow for more or less porosity. This concept of built-in “shrinkage by design’’ can lead to still higher yields on castings with less restrictive non-destructive testing requirements.

1. INTRODUCTION
For the past two years, the Steel Founders’ Society of America (SFSA) has sponsored a program in casting yield improvement which has been spearheaded by a research team at the University of Iowa, This program has had substantial industry guidance, participation, and in-kind support. The purpose of this paper is to summarize recent progress in the development of improved feeding rules arising from this research program in “Yield Improvement”.
The consequences of low casting yield are well known in the foundry industry; lower profits due to increased production costs and decreased capacity. Additional melted metal and heats and increased labor and materials costs required for production are the primary reasons for the increased costs. Furthermore, it is recognized that higher casting yield has the side benefit of lowering casting cleaning costs. Essentially when a foundry achieves the highest possible yield, it can operate at maximum capacity, maximizing its revenues.
The path to achieving higher yields is not easy, nor is it straightforward. Higher yields often come from an investment in time and capital, having experienced personnel, and often require ingenuity and perseverance. Presently there are more and better tools than ever before available to the foundryman that can be applied to the problem of increasing casting yield. Computer simulation of the casting process is becoming an indispensable tool to achieve increased casting yield. It enables more experimentation with the casting process. It enables better use of feeding aids, such as sleeves and chills (see for example [1]), which can sometimes be difficult to apply effectively without numerous trial runs in the foundry. However, computer simulation is applied on a case by case basis. Simulation also requires expertise and accurate data for numerous process variables to be used effectively. Therefore, in spite of the power of simulation, it is used on less than 10% of the tonnage of steel castings produced according to a recent survey [2-3]. The same survey showed that feeding rules (or rule-based software) were used to rig about 80% of tonnage produced. This was broken down into 50% for “rules developed in-house”, 20% SFSA “Red Book” rules, and 10% for “non-SFSA published rules”. A primary goal of the SFSA Yield Improvement Project is to apply the power of computer simulation to develop improved feeding rules for the SFSA that will be of more use to its membership and lead to higher casting yields.
At the time of this writing, the SFSA Yield Improvement Program is completing its second year of work on a planned three-year project. During the first year of the project information from a thorough study of casting yield in the steel foundry industry [2-3], and direction from the SFSA membership, steered the project toward a re-examination of the rules for feeding steel castings as published by the SFSA [4]. The first step in the development of the improved feeding rules was a computational study, which included examining the simple plate-like geometries addressed in the SFSA guidelines [4]. Results from this computational study [5] provided insight and laid the groundwork to establish a methodology to determine feeding distances using a commercial casting simulation package. The computational study [5] showed that the computed Niyama criterion [6,7] (which is commonly used in commercial casting software to indicate the severity of porosity formation) could be related to the porosity and soundness level in castings. Comparisons made in the study between the SFSA rules and simulations showed that in some
2

cases a good correspondence existed. However, in most cases, the SFSA rules were shown to be overly conservative (a common criticism of the current SFSA guidelines).
Plate trials were then begun to test the existing feeding rules and to assist in the development of the new rules. Four participating foundries cast and tested 3” thick by 6” wide plates, and a fifth foundry cast and tested 1” thick by 5.5” wide plates. Five plate lengths (or “Cases”) were chosen based on the existing rules and the results of the initial computational study. For comparison, each foundry made at least three castings of each of the plate lengths, and data sheets on the casting process variables of each plate cast were completed. While work on the trials is ongoing, and additional trials are to be performed, the preliminary results presented here support the simulation results, the methodology used to develop the new rules, and show the current feeding rules to be overly conservative.
This paper will present the basis and methodology for the development of new and improved feeding rules. The current rules and their development will be briefly discussed. Next, the Niyama criterion, and its application in developing the new rules, will be discussed. Preliminary results of the casting trials will be presented. This is followed by a presentation of the methodology behind the development of the new rules, and some examples and comparisons with the old rules. The new rules (as they currently stand, pending modification based on further casting trials) are presented. Finally, the impact the new rules will have on feeding length and casting yield will be discussed by comparison with results from the present rules.
It is envisioned that these improved rules will address all of the variables treated in the current rules (end effect, lateral feeding, side risers, chills, and alloy variations). They will also consider more detailed treatments of all the current variables, in what will be demonstrated to be a more accurate form. Furthermore in the rules developed from the present work, mold materials will be addressed in more detail, wider ranges of geometry will be presented, and (most importantly) different levels of casting soundness can be considered.
2. BACKGROUND ON THE IMPROVED FEEDING RULES
2.1 Present SFSA Feeding Rules
The present SFSA feeding rules are based on an extensive series of heat transfer studies directed by J. F. Wallace starting in 1966 at Case Western Research University [8-11]. The current risering guidelines published by the Steel Founders’ Society of America [4] provide a set of graphs and nomographs for the feeding distances in plates (W≥ 2T), semi-plates (T<W<2T), and bars (W=T). These basic shapes can be used and combined to determine feeding lengths for more complicated casting geometries. Various riser configurations, chills, section taper, and molding materials are considered in the present guidelines for both carbon and high alloy steels.
The solidification gradient criterion for shrinkage porosity formation used to develop the present SFSA rules was proposed by Spiegelberg [8-9]. It is defined as
3

where fs is the solid fraction, ∆x is the distance along the casting center line. The solid fraction values of two computational nodes adjacent to the end-of-freeze interface were used to compute ∆ fs /∆x. This gradient was compared with a minimum threshold value, gmin. A solidification gradient smaller than this threshold value was taken as a prediction of porosity formation.
The determination of the minimum solidification gradient gmin for this threshold was based on the feeding distance of a single riser to the casting edge for a 3” thick plate. The minimum gradient was varied in several computer runs until the feeding distance predicted by the computer matched the experimental value where the plate was no longer cast to x-ray Level I soundness. Note that in this work, for ease in creating the x-ray level plots, Arabic rather than Roman numerals are adopted to denote and discuss the x-ray levels. In these studies, this value was taken
to be gmin = 0.0312--------- /inch . Using this approach, Maier [10] computed feeding lengths for
plates of different thicknesses, and Ghun [11] developed rules for vertical plates. The resulting SFSA feeding rules [4] for casting plates to x-ray Level 1 soundness were completed following statistical analysis of the computational results. The SFSA rules for cases with end effect and a diagram to illustrate the nomenclature used in this paper are shown in Figure 1.
Although experiments were performed in development of these rules [4], extensive casting trials at foundries were not performed. It is planned that development of the new rules will be supported by casting trials at foundries, but will be based primarily on simulations like the old rules.
2.2 A Brief Discussion of the Niyama criterion
The formation of porosity in solidifying metals has long been, and continues to be, the subject of much research. From examination and analysis of several commercial castings, Niyama et al. [6] proposed that the temperature gradient G could be used to predict the formation of shrinkage porosity. Later, Niyama et al. [7] developed the Niyama criterion to predict shnnkage defects. The Niyama criterion at a given point in the casting is defined as the temperature gradient G divided by the square root of the cooling rate R at the end of solidification at that point. The Niyama criterion is expressed therefore as the parameter G/√ R. According to Niyama et al. [7],
___
the critical value for the Niyama criterion in steel was about 1.0 deg1/2 min1/2 cm-1 and was independent of the alloy cast and the size and shape of the casting in the range studied.
The Niyama criterion is a well accepted and often used porosity predictor. Furthermore, although it was originally developed for microporosity, it is has been used to predict macroporosity as well. Currently the Niyama criterion is used in a number of commercial casting simulation packages, and it is generally believed to work well for short freezing range alloys such as steel. In the present study, the Niyama criterion distribution in the casting is calculated by the post- processor of MAGMAsoft. MAGMAsoft was used to simulate all cases presented here. The subject of which predictor of porosity is best is still open to debate, but presently, it is clear that the Niyama criterion is the best available predictor for the purposes of this study.
inch3 inch3
4

3 RESULTS FROM 3” HORIZONTAL PLATE CASTING TRIALS APPLIED TO RULE DEVELOPMENT
3.1 Description of Casting Trials
In the casting yield survey [2] it was found that the average section thickness of a typical casting is 2.88”. Based on this finding, and the recommendations of SFSA members, casting trials were performed at four participating foundries using 3“ thick plates. It was expected that the casting trials would verify the predictions from the simulations performed in the computational study [5], and establish a correspondence between the Niyama criterion and x-ray defect level of the plates.
The configuration for casting trials is shown in Figure 2, where T=3” and W=6“. Five cases with different feeding lengths (FL) were proposed, which is described in Table 1. It is important that the feeding distance (FD) and the feeding length (FL) be clearly defined in the context of the present work to avoid confusion:
* Feeding Distance: As given in Figure 1, the feeding distance (FD) is the distance from the riser to the furthest point in the casting over which the riser can provide feed metal resulting in a sound casting. In the case of the SFSA guidelines [4], soundness is defined as “Class Isoundness at 2% radiographic sensitivity.”
Feeding Length: As given in Figure 2 for the casting trial cases, the feeding length (FL) is the distance from the riser to the furthest point in the casting. It is the length to be fed. It is purely geometrical, and implies nothing as to the soundness of the casting being fed.
*
The minimum Niyama values in Table 1 are taken from simulations based on an initial/pouring temperature of 1620°C. At least three test castings were produced by each foundry for each trial case. However, in one instance, a foundry produced six castings of Cases 4 and 5, with three of these in green sand and the other three in polyurethane no-bake molds.
Each plate was examined radiographically using ASTM E94 procedures for 3” thick plates (E186). After the x-ray Level was determined for each casting, each trial plate was cut at mid- width with a vertical/longitudina1 section through the plate thickness, and the surface of the cut was examined by magnetic particle testing. The magnetic particle testing was performed ‘primarily to confirm casting soundness, and help explain anomalies in the x-ray results. Magnetic particle testing began consistently showing defects in Case 4 for the 3” plates (the 1” plate results will not be discussed in detail here), and gross shrinkage defects were also observed starting in Case 4.
3.2 Preliminary Casting Trial Results
For the purposes of the present paper, only the x-ray testing results will be presented in any detail. The 3” thick plate casting trial results given in Figure 3 show the x-ray Level for each plate cast as a function of the feeding length. There are five feeding lengths considered, corresponding to the five casting trial cases. Cases 2 corresponds to a simulation feeding length
5

based on a minimum Niyama level in the plate of 0.7 (this will be discussed in more detail shortly). The feeding length of Case 3 was selected for the trials because it corresponds to the SFSA feeding distance for this plate geometry. The reader will note that Figure 3 presents the number of plates exhibiting a given x-ray Level within the symbol, or next to the symbol. These results show completely sound (x-ray Level 1) plates were cast for Case 1. Two of nine plates cast for Case 2 were of x-ray Level 2, and the remaining seven were all sound. For Case 3, ten plates were cast as Level 1, and one each were cast in x-ray levels 2 and 3. There is a trend for the plates to have increasingly higher defect levels as the feeding length increases. In the Case 4 results there is one plate each at x-ray levels 4 and 3, two plates at x-ray Level 2, and eleven at x- ray Level 1. The linear curve fit for the upper 95% confidence level for the data passes through x-ray Level 2 at Case 4. This would be one basis for the feeding length in Case 4 as the experimentally determined feeding distance from the casting trials for Level 2, and demonstrates that the rules are on the conservative side. A wider distribution of results is seen in the data from Case 5. For Case 5, one plate was actually cast to a soundness of x-ray Level 1. The mean of the distribution for Case 5 is above x-ray Level 3 and the 95% confidence level for this case is less than Level 4; conservatively (since it is not possible to have a fractional x-ray level) it should be fixed at x-ray Level 4.
The scattered distribution of x-ray Level results at longer feeding lengths is due in part to the inexact science of x-ray testing and evaluation, which is far from a truly quantitative measure of casting soundness. In addition, the numerous parameters in the casting process itself are a cause of the scattered data. Examining the upper 95% confidence error band for each casting trial case, a linear relationship appears to fit them quite well as shown in Figure 3. With more careful control of the casting process, and more careful evaluation of the x-rays1, it should be possible to develop a better picture of the x-ray Level versus feeding length for these plate trials. Two additional casting trial cases are currently being undertaken to “fill in” the gap of data between Cases 4 and 5.
Since a critical goal of the casting trials was to establish a correspondence between x-ray Level and Niyama values that occur in simulation, these plates must be simulated as close as possible to the actual casting conditions. The casting parameters which were taken into account in these “as-cast” plate simulations were pouring temperature, mold material, actual casting rigging and mold-box geometry and pouring time. The actual rigging (riser size, gating dimensions and locations) and mold box geometry varied from foundry to foundry. This variation was intended and planned for in the development of the trials. In doing so, the effect of these variations in the casting process which occur from foundry to foundry could be observed, and taken into consideration in the development of the new rules.
An important variable not taken into account in these detailed simulations was the precise steel chemistry of the plates. Since all cases were cast with a steel of similar composition (1025 steel), the same steel in the MAGMAsoft database was used in simulating all of the plate trial cases, The variations in the steel chemistry between the foundries would produce some additional differences in Niyama results. This is due to differences in the solidus temperature which affects (and is affected by) the temperature gradient and cooling rate at the end of solidification, as the
1Currently a “gage R&R" evaluation of the x-rays is being undertaken by having the x-rays independently evaluated by several foundries to try and determine the uncertainty in the x-ray Level determination.
6

steel chemistry varies. However, since there are additional effects which can alter the solidus temperature at any point in a real casting process (i.e. such as macrosegregation and differences in cooling rate), these effects could not be controlled in the trials anyway. In the context of the current study, it was decided to use the same steel properties for all cases. A more detailed study of the effect of chemistry has on property values and the Niyama predictions has been performed as part of this study, but is beyond the scope of the present paper.
After simulating each plate and case according to the data gathered by the participating foundry, an accurate simulation for each plate was generated for comparison with the x-rays for that part. There is no established methodology for evaluating what the defect level will be based on the Niyama criterion. This must be developed as part of this study. Several different approaches have been examined and must be weighed, not only by how well they appear to predict the defect levels, but also by the time required to apply a given method. Ultimately, the “time-required” constraint could be eliminated by automating the calculations required in the simulation post- processor. The following methods have been applied to the casting trial Niyama results to try and develop a correspondence with x-ray level:
* the lowest (minimum) Niyama value of any computational cell in the casting
* the area of computational cells below a certain threshold Niyama value
* the average Niyama value in the area of Niyama values below a certain threshold value
* the average Niyama value in the area where a defect occurs in the x-rays (both in the plane of the x-ray and normal to the plane of the x-ray)
Not only the value of a certain Niyama threshold level, but the amount (area or volume) of that level can be used to predict casting soundness. It might be wise to investigate various volumetric measures also, but this had not been tried with these simulations at the time of this writing.
A complete presentation and comparison of these methods of evaluating the simulations will not be presented here. Since, most foundrymen are interested in the quickest method of checking the simulation results, the results of the minimum Niyama value for the casting trial simulations is given in Figure 4. The minimum Niyama values for a given plate (signifying the highest level of porosity formation in the casting) were compared with the x-ray Level for the actual plate as shown in this figure. The plates were sound (x-ray Level 1) in all but two of the thirty-three cases where the Niyama level was greater than or equal to 0.2. This is strong evidence that the minimum Niyama 0.2 level could be used to signify a break between x-ray levels 1 and 2. The minimum level Niyama 0.7 level has also been recommended to us as good indicator below which porosity defects might develop. Based on the results in Figure 4, the 0.7 level appears to be a too conservative choice with a good margin of safety. Below the minimum Niyama level of 0.2, it appears from Figure 4 that there are a wide range of x-ray levels, and the minimum Niyama criterion does not distinguish the defect severity levels well. On Figure 4, are also plotted the mean values of the x-ray Level at each Niyama value with 95% confidence bars, the same mean x-ray Level plus one standard deviation, and a decaying exponential curve-fit through the upper 95% confidence bars. While it is not recommended that this curve should be used to
7

predict the x-ray Level at a given Niyama value, this curve-fit is interesting because it represents several points apparent in the data:
1) A minimum Niyama level of 0.6 or higher is a very good indication that the casting will be sound (no defects or x-ray Level 1).
2) At a minimum Niyama level of 0.2 there is a small chance that your casting will be of x-ray Level 2, but will probably be x-ray Level 1 (31 times out of 33 according to the trials).
3) At a minimum Niyama level of 0.1 your casting will on average be of x-ray Level 3 or better, but might be as bad as x-ray Level 5.
4) At a minimum Niyama level of 0.0 it was found that the casting is most likely level 4 as indicated by the curve fit, but note too that even at Niyama = 0.0 some castings were produced at x-ray Level 2.
The minimum Niyama results are plotted in Figure 5 versus the feeding lengths for these 3” plate trials. Consulting this plot, one can see the range of minimum Niyama values computed for the five casting trial cases. Figure 5 shows that for a given trial case, the variations in casting conditions (due to actual rigging, mold-box geometry, and pouring temperature etc.) result in Niyama values which span an absolute spread of 0.2. It is observed that the lower 95% confidence bar (taken on the conservative side of the mean) in trial Case 3 corresponds to the 0.2 Niyama level. Recall that Case 3 is the SFSA rule feeding distance. In Figure 4, this 0.2 Niyama level was shown to be a good estimate for the level below which one could no longer cast to x- ray Level 1 soundness. In this case, casting trial Case 3, it is shown that the SFSA rules, the casting trials x-ray results, and a minimum Niyama level of 0.2 for a threshold between x-ray Level 1 and 2, are all in agreement. Based on a curve-fit as shown in Figure 5 through the lower confidence band of the mean minimum Niyama values, the feeding length at a minimum Niyama value of 0.2 is 14.2”. This is quite close to (but less than) the SFSA rule feeding distance, and is about an inch greater than the feeding length corresponding to the 0.7 minimum Niyama level.
From these results, a minimum Niyama value of 0.1 appears to be a clear choice for x-ray Level 3, and a minimum Niyama level of 0.0 for x-ray Level 4. It is also apparent from the 3” casting trials that a minimum Niyama value of 0.7 is a very conservative choice for producing sound plates of carbon low-alloy steel. Indeed, one can readily argue that a level of 0.2 is a much better, more aggressive choice for a Niyama “soundness” criteria between x-ray levels 1 and 2. Given that the spread in the simulation data is up to 0.2 Niyama for a given case, a prudent choice for this threshold is probably about 0.4 since the lowest it could be given the uncertainty in the simulation results is about 0.2 for a given case. The definition and significance of the simulation feeding length, meaning of the various Niyama levels, and discussion of their application in evaluating the SFSA feeding rules will now be discussed. It is hoped that this section has given the basis for development of improved feeding rules, which are based on modem casting simulations, casting trials and take into account the level of casting soundness.
8

4. METHODOLOGY BEHIND THE DEVELOPMENT OF IMPROVED FEEDING RULES
The computational criterion for the formation of shrinkage porosity used in the development of the new rules is the Niyama criterion. The new rules and old rules will be compared shortly. A variety of casting geometries are presented in the SFSA rules, and from these a “base-case” needed to be chosen for more detailed study, experimentation, casting trials and comparison between the rules. The “base-case” chosen for detailed comparison was bars, plates and semi- plates with end effect.
A methodology was established in the computational study [5] to determine a simulation feeding distance. This simulation feeding distance FD, was determined in the computational study when a lower threshold Niyama value of 0.7 first occurs in a simulated plate casting. In other words, iterative simulations are performed on the plate casting, increasing its length in small 0.25” increments, until the first appearance of an 0.7 level Niyama occurs at a computational cell. This will be the smallest (or minimum) Niyama value in the plate. The 0.7 level was chosen based the recommendations of experienced users of the particular software employed in the study (MAGMAsoft). It was also found that simulation feeding distances determined by the 0.7 Niyama criterion corresponded well to the SFSA feeding distances in many instances (see [5] for more details). However, more recent simulations and the casting trials have shown the 0.2 minimum Niyama level to be better choice of porosity criterion for developing new rules to Level 1. In Section 5 of this paper (the “New Rules” section) the rules for 0.2 minimum Niyama level are given. The 0.7 minimum Niyama level threshold gives reasonable agreement with the SFSA rules for bars and semi-plates in the range from 2” to 4” thick as shown in Figures 6 and 7, but is an overly conservative predictor of porosity as already discussed.
4.1 Development of a “Base-Case’’
The simulations within MAGMAsoft require prescribing numerous casting variables. In the course of this investigation, it has generally been found that for end effect plates with thickness 2” and greater, that simulation of mold filling does not greatly effect the model results. Hence, the simulation results presented here start with the steel already in the mold. For the purposes of this study, the absence of filling simulation is believed to be justified for a section thickness greater than 0.5”. All other conditions were chosen so as to match the conditions on which the SFSA guidelines [5] are based. The simulation parameters are:
* * * chill material: steel * initial steel temperature: 1620°C * * * * * mold material thickness: ≥ 2” * Critical solid fraction: 65%
cast material: steel (carbon or low alloy) mold material: silica sand (green sand)
initial temperature of mold, core and chill: 20°C interfacial heat transfer coefficient between cast and mold materials: 1000 W/m2K interfacial heat transfer coefficient between chill and cast materials: 1500 W/m2K interfacial heat transfer coefficient between chill and mold materials: 1000 W/m2K
9

In order to investigate the sensitivity of the predictions to these parameters, the effect of grid size, riser size, initial temperature, HTCchill-casting, swell, convection, and filling were investigated. The details of these investigations cannot be given here. However, due to the critical nature of computational meshes in simulation, it must be stated that the computational mesh was selected based on a compromise between accuracy and simulation cost. Typically, at least seven control volumes were employed across a section. A finer grid did not result in any differences in the calculated feeding distances corresponding to a given Niyama level.
A base case geometry was selected in order to establish the procedures and perform more detailed comparisons. The base case geometry is a horizontal plate that is 4” thick and 8” wide, while the length is variable. For this base-case, the steps outlined previously were followed to determine the feeding distance through simulation. Some of the critical information on the base case is summarized below:
(1) Basic shape is a horizontal plate (T = 4” and W = 8”) with a top riser.
(2) Feeding distance from the SFSA guidelines [5] is FDR = 18”. The Riser size from the SFSA guidelines is used, diameter = height = 8.77”. The total plate length corresponding to the above dimensions is L = 44.05”.
(3) The first simulation is performed for a plate length exactly corresponding to the feeding distance from the SFSA guidelines, i.e., L = 44.05”. The resulting Niyama values are plotted in Figure 6(a) on a scale from 0 to 1.4. Only the center section of the right half is shown. Niyama values less than unity are observed near the bottom of the riser and in the center of the right half of the plate. The riser size was deemed sufficient from the MAGMAsoft riser pipe predictions.
(4) The minimum observed Niyama value in the plate shown in Figure 6(a) is 0.7, which (as we saw in the plate casting trials) is an overly conservative threshold value for Class 2 shrinkage porosity. However, based on this 0.7 Niyama criterion, the plate length needs to be decreased because the area with threshold value of 0.7 is larger than one cell.
(5) When the feeding length is decreased 0.25” less than FDR, where the corresponding plate length is L=43.55”, the minimum observed Niyama value in the plate shown in Figure 6(b) is 0.7, and this threshold value appears just in one cell. Hence, the shortest length for minimum Niyama value of 0.7 is L=43.55”.
(6) For the plate length of 43.55”, the distance from the edge of the riser to the comer of the plate is equal to 17.75”. This is therefore the feeding distance obtained from the simulations and would be denoted by FDS=17.75”.
For this base-case, the difference between feeding distances from the SFSA guidelines FDR and the simulations FDS is very small. The agreement is purely coincidental, and, as will be shown later, the differences between FDR and FDS can be substantial.
10

4.2 Comparison between Simulation Feeding Distances and the SFSA Rules
The SFSA publishes guidelines [4] for risering steel castings. These include both feeding rules for low and high alloy steel castings and riser sizing rules. Feeding rules are presented as a set of graphs and nomographs for the feeding distances in plate-like geometries, which are categorized into plates (W≥ 2T), semi-plates (T<W<2T) and bars (W=T). Other than geometry conditions, all simulation conditions for the results below are the same as the base-case.
Simulation feeding distances obtained from this computational study are compared with the feeding distances determined by the SFSA guidelines. Although every case for the SFSA rules for carbon steel were examined (end effect, end chill, drag chill, lateral feeding, side riser, taper and molding materials) in a thorough computational study (presented in detail in [5]), only a selection of these comparisons is presented here. In some cases, the accompanying figures contain more data than their counterparts in [5].
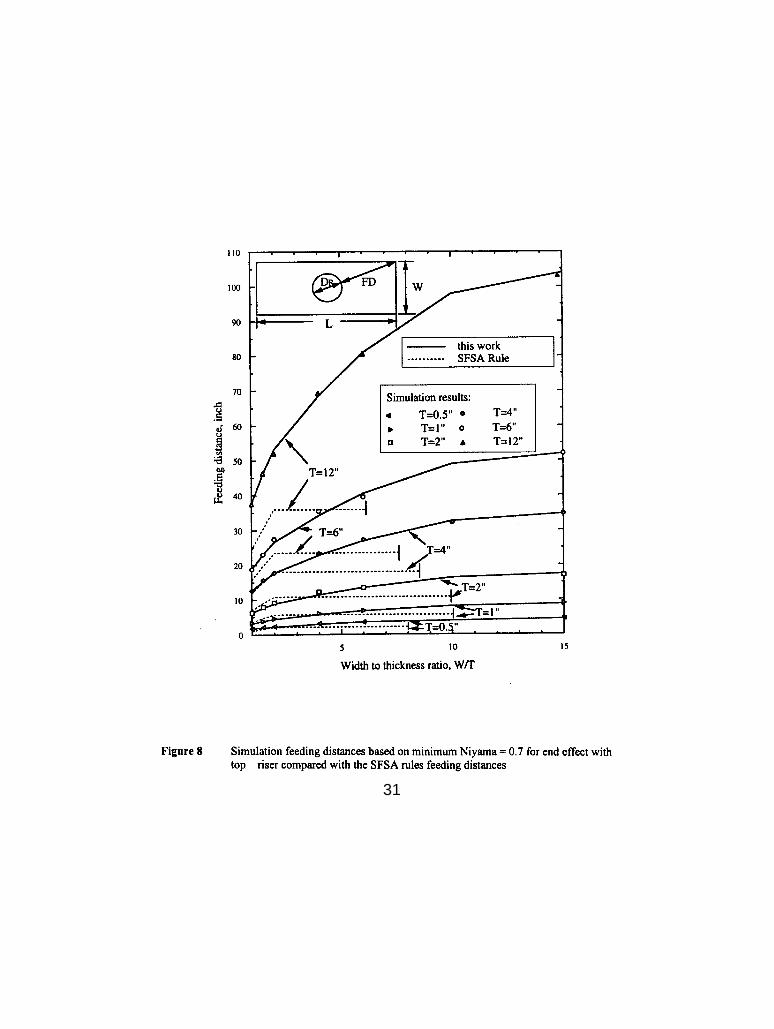
4.2.1 End Effect
In Figures 7 and 8 the feeding distances obtained using the SFSA rules (FDR) are compared with the feeding distance determined from simulation (FDS) using the 0.7 Niyama criterion described above. It can be seen that for bars and plates, the feeding distance generally increases with thickness. The agreement between FDS and FDR can be considered good for small thickness, but this agreement deteriorates with increasing thickness and increasing width. For example, when W/T=15 and T=10“, the simulation feeding distance is about three times of the rule feeding distance. According to the SFSA guidelines, the feeding distance does not increase significantly beyond a width to thickness ratio of 2. However, as shown in Figure 8, the simulated results show this does not hold true for plates with a thickness greater than about 4“. In many situations the rules appear to agree with the simulations. However there is ample evidence that these rules are overly conservative as thickness and W/T increase.
4.2.2 End Chill
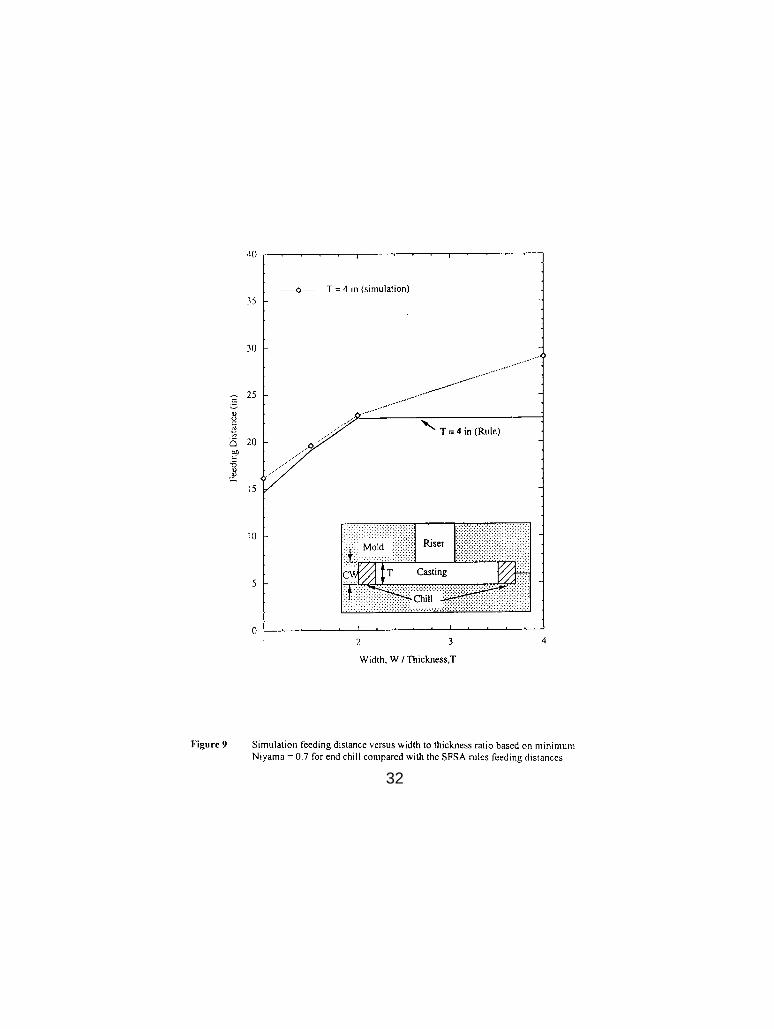
The simulation feeding distances and the SFSA rule feeding distances for plates of thickness 4” with an end chill are summarized in Figure 9. A side view of this is also given in the figure. The chill geometry was fixed with the chill thickness CT set to 2/3T, and the chill width CW set to T, where T is the plate thickness. The chill material was steel. It can be seen from Figure 8 that for the “base-case” of a 4”x8” plate (W/T=2), there is almost perfect agreement between FDS and FDR, as was already observed for the case without a chill. Note that the chill increases the feeding distance in this case from 17.75” to 22.8”. For other widths, the agreement between FDS and FDR shown in Figure 9 follows the same trend as in the cases without a chill (i.e., the agreement deteriorates with increasing width to thickness ratio). In other words, the large disagreement for the W/T=15 cases observed in Figure 8 will also be present with a chill.
The simulations were also performed on the base plate (4”x8”) with different chill thickness and chill materials, The chill thickness CT was found to have only a minor effect on the feeding distance. From the simulations it was found that CT should be larger than half the plate thickness
11

T, but showed no benefit if it was larger than T. This result is in agreement with the SFSA guidelines. In the guidelines it is indicated that the adequate end chill thickness is 1/2T, while anything over 2/3T does not add appreciably to the feeding distance. The choice of chill materials (steel, gray iron, copper) did not appear to have any impact on the feeding distance.
4.2.3 Taper
It is well known that tapering a fed casting section can increase the feeding distance by promoting directional solidification. The effect of tapering a casting was simulated. These results were not presented in the earlier report [5]. Taper was investigated using the plate with end effect configuration as shown in a side view in Figure 10. These simulations were performed on 3”x6” plate of variable length. The length of the end effect region, EE, executed with parallel surfaces, is 7” and the length of the riser effect region RE is 4.9”. The required tapering from simulation and its comparison with rule taper values versus plate length are shown in Figure 11, The plot demonstrates agreement between the rule plate length, and simulation determined length (based on 0.7 Niyama). The simulations give less taper for a given plate length. In the SFSA rules it is indicated that the required taper increases to the 0.1 in/in level, even to an infinite plate length. However, the simulation results are in conflict with this since they do not indicate that 0.1 in/in is the maximum taper for long plates. Here the 0.7 Niyama criterion appears to be a good value for overall comparison with the SFSA rules.
4.2.4 Side Riser
The results for side risers were presented previously [5], and so will be only briefly discussed here. These results are important because they demonstrate the inadequacies of the current rules for many situations. Simulations were first performed on the 4” thick plates with different widths. These results, shown in Figure 12, indicate that the simulation feeding distance is much larger than rule feeding distance for larger width to thickness ratios. According to the rules, the feeding distance in the lateral direction for a 16” plate is zero, while the simulations predict a feeding distance of about 20”. The simulation feeding distance is determined to be zero when the width increases to 24” (W/T=6). It should be noted that for the 20” wide plate (W/T=5) the feeding length should be more than 16” to avoid the defects caused by the large width.
Simulations with different plate thicknesses were also performed. All the simulation results as a function of plate thickness and their rule feeding distances (FDR) are compared in Figure 13. Contrary to the rules, the simulation feeding distance increases with the width to thickness ratio. Both simulation and rule results are in agreement that when the width of the plate is large enough, the feeding distances are indicated to be zero. It is interesting to note that, according to the SFSA guidelines, the feeding behavior of bars and semi-plates with side risers is much different from that for plates with W>2T, which is not indicated by the simulation results and the rules developed in the present study. This inconsistency with the present simulations demonstrates the need for the re-evaluation of the present feeding rules.
12

4.3 Evaluation of SFSA Rules for Riser Size
The SFSA riser size recommendations were developed based on extensive experiments conducted by Bishop et al. [12]. In their work, the riser diameters and heights (DR and HR, respectively, as shown in Figure 14) were varied until the minimum riser volume was experimentally determined. The minimum volume corresponded to a safety margin (SM in Figure 14) of zero as determined by x-ray.
To relate the end of the shrinkage pipe to the feeding percentage value in the MAGMAsoft simulations, simulations were first performed on seven selected experimental cases. It was found that the 85% feeding percentage level in the simulations appeared to give reasonable agreement with experiments. In the following cases the 85% feeding percentage level will be used to define the end of the shrinkage pipe.
Simulations were then performed on a 4”x8”x40” plate to determine computationally the optimum riser height to diameter ratio. The ratios were set to be 0.25, 0.5, 1.0, 1.5 and 2. The resulting yield is shown in Figure 15. It can be seen that the highest yield occurs at a ratio of 1.0. Lower or higher riser diameter to height ratio will cause lower yield. When the ratio is greater than 1.5, increasing riser height has no beneficial effect on safety margin because of the secondary shrinkage. In the SFSA riser sizing rules [4], the recommended riser height to diameter ratio is from 1.0 to 1.5. The simulation results confirm this to be the best riser height to diameter ratio with 1.0 being the recommendation.
Simulations were then performed on plates of varying shape factors to evaluate riser size rules further. The riser heights were set to be the same as the riser diameters. If the safety margin is fixed at 1” and also at 15% of riser diameter, a comparison between a fixed safety margin and a variable safety margin (based on riser size) can be made. The resulting simulated riser volume to casting volume ratio, and their comparison with rule and experiment values, are shown in Figure 16. It can be seen that with 1” safety margin, simulation results are in reasonable agreement with rules. Whereas the simulations made using a 15% safety margin appear too conservative for most of the range of shape factors.
The SFSA riser rules appear to be very sound, and no evidence exists from these studies to show they can be improved on. However, this is not the case with the SFSA feeding rules.
5. NEW AND IMPROVED FEEDING RULES
Based on the results of the computational study, and thorough examination of the current SFSA rules there is ample evidence that the rules are overly conservative. There is a demonstrated need for more accurate rules where the existing rules are lacking. When the development of these new rules are completed, the goal is for the new rules to cover thinner and thicker sections than do the present rules and be tailored to the class of soundness in some or all parts of a casting. A introduction to, and description of, these new guidelines will be presented here. There is much work remaining in the new rule development, and it is planned that this will be both computational work (perform a thorough development which includes configurations not covered by the current rules), and experimental work to validate the new rules.
13

The minimum Niyama level of 0.7 is discussed below because prior to the casting trials the 0.7 level was known to be as a safe level upon which to develop the new feeding rules. The “base- case’’ of the new rules for plates with end effect were then developed on the 0.7 level basis. However, a simulation feeding distance can be determined in the manner described here for any minimum Niyama level. By lowering this Niyama level threshold one would essentially be allowing for the existence of increasingly severe porosity in the plate. Following this one could theoretically develop, by simulation, feeding rules for a given range of allowable porosity defects.
5.1 Outline and Description of the Improved Feeding Rules
The new rules are based on simulations according to the Niyama criterion and employ a feeding shape factor (FSF) for the section of the casting to be fed. The casting thicknesses covered by new rules are from 0.5” to 12”. The concept of a feeding shape factor (FSF) was applied, which is defined as:
where: LFD = plate length corresponding to the simulation feeding distance W = plate width T = plate thickness
The FSF was then plotted as a function of plate width to thickness ratio, as illustrated in Figure 17 for end effect cases. It can be seen that all the simulation results (based on the 0.7 Niyama criterion) collapse on a single line regardless of plate thickness. On the other hand, the SFSA guidelines (also given in Figure 17) produce results that vary with plate thickness.
Using a least squares fourth-order polynomial to fit the simulation results gives
where a=-5.66x10⁻⁴, b=3.40x10⁻³, c=-0.17, d=3.60, and e=6.15. This equation has a standard error of 0.47 in the FSF. The curve defined by Equation 2 is symmetric at W/T=15, The solid line in Figure 17 gives the left half of the line. When W/T=15, the corresponding feeding shape factor is 30, where the plate length is equal to plate width. At this point, the feeding shape factor reaches a maximum.
The case described above, whose feeding distance is given by Equation (2), will be referred to as the “base-case” for the development of the new rules. The conditions are summarized below:
End Effect Niyama ≥ 0.7
14

Cast Alloy: steel Sand: Magma green sand
5.2 Summary of the Rules
Following the example of the base-case, hundreds of simulations were performed (bearing it mind it requires several simulations to determine the feeding distance for a given data point) to develop fourth-order polynomial curves relating the FSF to W/T for other casting conditions. The casting conditions presented here are permutations of the following: Niyama level to simulate soundness level, chills, molding materials, and various high and low alloy compositions. The resulting polynomials for sixteen different casting conditions are given in Table 2 according to the coefficient nomenclature in Equation (2).
Example plots of the FSF relations for the first five cases listed in Table 2 are given in Figures 18 through 22. These cover the following conditions: Niyama ≥ 0.2 with end effect, end chill and Niyama ≥ 0.2, drag chill, and furan molding material (chemically bonded no-bake material similar to PUNB), respectively. In each figure the base case condition (end effect, Niyama ≥ 0.7, silica sand mold) is plotted as well in order that the change from the base case can be readily compared. The standard error between the curve-fit and the simulation data for each curve is given in Table 2.
For the end chill case, chill width is set to be the plate thickness, CW=T, chill thickness set to be 2/3T, and chill length is set to plate width. The largest data point of feeding shape factor in Figure 19 is corresponding to the largest square plate fed by one riser, where L=W=17T. Further investigation showed that a linear relationship could be established between the feeding shape factor of the end effect (the base-case) and the case of an end chill within reasonable accuracy when the width to thickness ratio is from 1 and 15. This linear relationship means that by multiplying the FSF curve for the base case by a multiplier the end chill curve can be closely approximated. Note in Figure 17 and 18 that the ratio of W/T=15 is the symmetry point for end effect cases, and FSF decreases with increasing width to thickness ratio when the ratio is larger than symmetry point value. The FSF for end chill cases, however, will still increase when W/T increases from 15 to 17. Hence, applying the linear relationship for the plate with W/T>15 will cause significant error. Yet, for W/T<15 this linearity is a powerful tool whereby the linear factors may be multiplied together to consider multiple effects starting from the base-case.
Applying this principle for a “one condition” change from the base case means that the new FSF would be given by
and for a multiple condition change this mean the new FSF for the desired conditions could be computed by a linear combination of N (the number of new conditions) in the form
15

These linear coefficients and the standard error resulting from their application are given in Table 2. See also the notes given Table 2 for more explanation of the conditions for which a given case was simulated.
5.3 Comparison with Casting Trials
Although there is work yet to be completed on the casting trials, and additional analysis of the casting trials which are completed, the applicability of the new rules is already apparent from the trial data presented in Section 3.2. From the casting trial data, the break between x-ray levels 1 and 2 can be established and plotted as the feeding shape factor versus width to thickness ratio. Casting trials have been performed for plates with end effect at two width to thickness ratios. In the case of the 3” plate trials W = 6” and T = 3”, and for the 1” trials W = 5.5” and T=1”. These trial results are compared with the SFSA rules (for T = 1”, 2” and 4”), and the new, Niyama based, and rules for minimum Niyama values of 0.7 (the base-case) and 0.2. These results are shown in Figure 23. The casting trial results are plotted as the diamond symbols. The break between the x-ray levels is determined from the X-ray level versus Feeding length plot (Figure 3). The casting trial data are shown to agree with both the SFSA rules and the new rule based on Niyama 0.2 at W/T = 2”. At W/T = 5.5, for the 1” thick plates, the trial value feeding distance also agrees quite well again with the new rule based on Niyama 0.2 but the SFSA rules are far too conservative.
This demonstrates that even the most conservative data from the casting trials show the SFSA rules to be overly conservative, and that great increases in feeding length are possible. Also, the additional feeding length possible through using the new rules increases as W/T increases. Based on Figure 23, the Niyama 0.2 based rule appears to be a good choice, but lacks a safety factor. The Niyama 0.7 rule appears to have a decent safety factor built in, and would result in casting yield improvement though not as much as the 0.2 rule. These will be compared shortly.
Another plot comparing the current and the new rules with the casting trial x-ray level data is given in Figure 24. In this figure each of the five cases cast in the 3” and 1” trials is plotted as a circle with the mean x-ray Level for that case given inside the circle. The new rules for Niyama = 0.7 and Niyama = 0.2 are also plotted. The SFSA rules are clearly overly conservative at larger W/T. Also note from Figure 24 that if rules for x-ray Level 2, and 3, and 4 were to be developed, still larger increases in the feeding length are possible. This will be made possible through additional trials, and with more experimental trial results at a range of x-ray levels. The new rules, and the approach to the rule development, are strongly supported by the evidence from the casting trials.
5.4 Application of the Rules
These new feeding rules were developed for low carbon steel with top center riser. The correct procedure for riser design employing new feeding rules for a given casting involves several steps.
(1) Calculate the feeding shape factor for the casting section and configuration under consideration.
16

(2) Calculate shape factor (W+L)/T of the casting section to be fed by the riser. Using the feeding shape factor for a base condition, decide whether or not chills will be used and determine how many risers will be applied.
(3) Compute the casting volume and shape factor to be fed by each riser.
(4) Compute the riser diameter using SFSA guidelines [5], which have been confirmed by simulations as part of this study. This guideline is based on Equation (5) given below
where DR = Riser diameter VC = Casting volume SF = (W+L)/T, Shape factor
(5) Set riser height equal to at least the riser diameter given by Equation (5).
Adopting the feeding shape factor in this study not only simplifies the feeding rules (since they are no longer classified as bars, semi-plates and plates), but facilitates the riser design procedure. However, if the conventional feeding distances are desired, it can also be obtained by
which is derived from Equations (5) and (1). The relation between feeding shape factor and feeding distance is also presented in Figure 25.
6. IMPACT OF NEW AND IMPROVED RULES: CASTING YIELD IMPROVEMENT
The yield of the casting corresponding to a feeding shape factor is calculated by dividing the volume of the casting by the sum of the volumes of the casting and the riser (the shrinkage of the casting, and the gating system is not included). Employing Equation (5) and setting the riser height equal to riser diameter, the yield can be obtained as a single valued function of feeding shape factor, which is shown in Figure 26 and given by
Yield for the base case with end effect for minimum Niyama threshold values of 0.7 and 0.2 obtained using the new feeding rules is compared with the SFSA guideline [4] in Figure 27. It can be seen that yield is improved for most cases when the new feeding rules are applied. This is especially true in the case of plates with large thickness or large width to thickness ratio. When T=12 and W/T=5, the yield improvement is about 10%. Furthermore, according to the rule
17

feeding distance, the largest width to thickness ratio for varying plate thickness is from 5 to 10. The new feeding rules give a maximum possible ratio of 15 for every plate thickness simulated. This means that even more yield improvement can be obtained by using a single riser instead of multiple risers for the large width to thickness ratio plates.
Based on the results of average casting geometry data from the casting yield survey [3], the range of yield improvement possible through application of the new rules can be explored. Some comparisons between applying the current and the new rules to castings with end effect are summarized in a tabular form below. The results for each configuration include the current (or old) SFSA rules and the new rules based on 0.7 and 0.2 minimum Niyama values (Ny).
The average section thickness from the survey is T=3”. Assuming a typical length to width ratio from the survey L=1.7W, gives FSF=2.7(W/T), which can be located on Figure 27 for a given thickness. The yield increase based on Ny=0.2 is 7.3%. Note too that the feeding length is almost doubled, which means there is an opportunity to decrease the number of riser as well when using the new rules.
Consider now a T=3” and assume L=W, which gives the best possible yield. Hence FSF=2(W/T), which can be located on the graphs for a given thickness. As shown below for the Ny = 0.2 results, the yield increase about 8% and the feeding distance doubles using the new rules.
Consider the average maximum section thickness from the yield survey, T=12”. Assuming L=W, which can be justified from survey and also gives best possible yield, FSF=2(W/T). For this case the feeding length is 3 times the present rules, and the yield is increased by 14%.
Finally, taking the average minimum section thickness from survey T=0.5”, and assuming L=W, and FSF=2(W/T) the Ny=0.2 rule feeding length is over twice the current SFSA rules, and the yield is increased by 9.4%.
18

It has been recognized, and documented previously [13] that the feeding lengths predicted by simulation and achieved in practice are multiples of those given by the current SFSA rules. Here are given quantitative estimates of the increases in yield (assuming the same number of risers and riser sizes) and feeding distance that would be possible using the new rules. The results of the present paper are consistent with what has been previously observed [13].
7. CONCLUSIONS AND DIRECTION OF FUTURE WORK
New feeding rules have been established by using the new concept of a feeding shape factor. These rules have been verified using casting trials on two different plate thicknesses, and cast at five different foundries. These results demonstrate that one rule is applicable to plates, semi- plates and bars from T=0.5” to 12”. This is in dramatic contrast to the current SFSA rules, which are classified by plates, semi-plates and bars. The new rules demonstrate that different end conditions and molding materials can be taken into account in a straightforward manner using coefficients to modify the feeding shape factor in a linear fashion. The coefficients obtained from this study are summarized in Table 2. Adopting the feeding shape factor in new feeding rules facilitates riser design procedure. Yield is improved by 7% to 14% applying new feeding rules, and feeding distance are increased by up to 3 times the current recommendations. The increase in feeding length will have the additional benefit of decreasing the number of risers necessary to feed a casting. Where the required feeding lengths allow this additional benefit, very substantial yield improvements can be achieved.
Thus far, these new rules have been developed for and tested with horizontal plates with end effect. They are based on the Niyama criterion, which has been shown through casting trials to be a very good indicator of the break between x-ray Level 1 and 2. It also predicts well the worst case boundaries for x-ray levels 3 and 4. Thus the new rules can be tailored to a desired level of soundness.
Future project work will focus on coordinating additional plate casting trials with participating foundries at larger W/T and high FSF, and analyzing the results. Casting trials for thick (i.e. 12”) and thin (i.e. 0.5”) are also being pursued to demonstrate that these unified rules are applicable to a very wide range of section thickness. A more quantitative evaluation of the x-rays from the trials is being undertaken to eliminate data scatter between x-ray levels 3, 4 and 5. This is currently being done through scanning the x-rays and performing digital image analysis.
19

ACKNOWLEDGMENTS
This work was supported by the United States Department of Energy through the Cast Metals Coalition (CMC) under the auspices the Steel Founders' Society of America. We are greatly indebted to Malcolm Blair and Raymond Monroe of the SFSA for their support and advice and to the participants in the plate casting trials for their substantial time and resource investment in the Yield Improvement program. Finally, the achievements of this project would not be possible without the guidance and support of numerous foundries, whose representatives have attended our project review meetings giving frank opinions and excellent suggestions on the project direction.
REFERENCES
[1] Ruud, P., "Yield Improvements", 1997 SFSA Technical and Operating Conference, 1997.
[2] Hardin, R., and Beckermann, C., "The Current State of Casting Yield: Results from the 1997 Steel Founders' Society of America Casting Yield Survey", 1997 SFSA Technical and Operating Conference, 1997
[3] Hardin, R.A., and Beckermann, C., Steel Founders' Society of America Casting Yield Survey, a final report prepared for the SFSA, 1997.
[4] S.F.S.A., Risering Steel Castings, Steel Founders' Society of America, 1973
[5] Beckermann, C., Shen, X., Gu, J.,and Hardin, R. A, "A Computational Study of Feeding Rules and Yield Improvement Techniques," 1997 SFSA Technical and Operating Conference, 1997.
[6] Niyama, E., Uchida, T. and Saito, S., "Predicting Shrinkage in Large Steel Castings from Temperature Gradient Calculations", AFS International Cast Metals Journal, vol. 6, No. 2, pp 16- 22, June 1981.
[7] Niyama, E., Uchida, T., Morikawa, M. and Saito, S., "A Method of Shrinkage Prediction and Its Application to Steel Casing Practice", AFS Internat. Cast Metals Journal, Vol 7 (#3), pp 52-63, Sep. 1982.
[8] Spiegelberg, W.,D., Heat Flow Computations of Solidification Behavior in Cast Steel, M.S. Thesis, Case Western Reserve University, 1968
[9] Spiegelberg, W.D., Computation of Solidification Gradients in Cast Steel Sections, Ph.D. Thesis, Department of Metallurgy and Materials Science, Case Western Reserve University, 1970.
[ 10] Maier, R., Computation of Three Dimensional Heat Flow in Solidifying Cast Steel Sections, M.S. Thesis, Dept. of Metals and Materials Science, Case Western Reserve University, 1972.
20

[11] Ghun, W., P., Computation of Heat Flow in Solidifying Veritical Cast Steel Sections, M.S. Thesis, Case Western Reserve University, 1974.
[12] Bishop, H.F., Myskowski, E.T. and Pellini, W.S., “A Simplified Method for Determining Riser Dimensions”, Trans. AFS., vol. 63, pp271-282, 1955.
[13] Smith, D., “An Evaluation of Conventional Method Rules Using Casting Simulation”, 50th Technical and Operating Conference, Steel Founders ’ Society of America, 1996.
[14] Bishop, H.F., and Pellini, W.S., “The Contribution of Riser and Chill-Edge Effects to Soundness of Cast Steel Plates”, Trans. AFS., vol .58, pp. 185-197, 1950.
21

22

23

24

25

26

27

28

29

30
31
32

33

34

35

36

37

38

39

40

41

42

43

44

45

46

47

48

49

50