progress in the development of a fmc/tfm based … in the development of a fmc/tfm based ultrasonic...
TRANSCRIPT

19th World Conference on Non-Destructive Testing 2016
1 License: http://creativecommons.org/licenses/by-nd/3.0/
Progress in the Development of a FMC/TFM Based Ultrasonic System
Raymond TEN GROTENHUIS 1, Andrew HONG 1, Yadav VERMA 1 1 Ontario Power Generation, Toronto, Canada
Contact e-mail: [email protected]
Abstract. An Ultrasonic inspection system was developed by Ontario Power Generation (OPG) combining the Full Matrix Capture (FMC) data acquisition technique with a two stage Total Focussing Method (TFM) beamformer. Development of the system, known as the Matrix Inspection Technique (MIT), focussed on a range of aspects including; software, manipulator hardware, instrumentation, acquisition and analysis processes. MIT was developed to address the inspection of carbon steel fitting to fitting welds for highly localized Flaw Accelerated Corrosion (FAC). The localized FAC was identified at and immediately adjacent the weld root in these joints. The system was initially deployed in 2010 and produced highly encouraging results. A series of improvements was identified derived from sources including operational field experience, new requirements from end users and efforts directed to MIT Inspection Qualification. These changes were prioritized and implemented in a sequential manner over a series of inspection campaigns. The result is a robust system that is capable of imaging the inspection volume bounded by an arbitrary geometry. Individual frame results can then be compiled into an accurate 3D rendering of the object inspected. This paper describes the system, the series of significant modifications undertaken and the results obtained.
1. Introduction
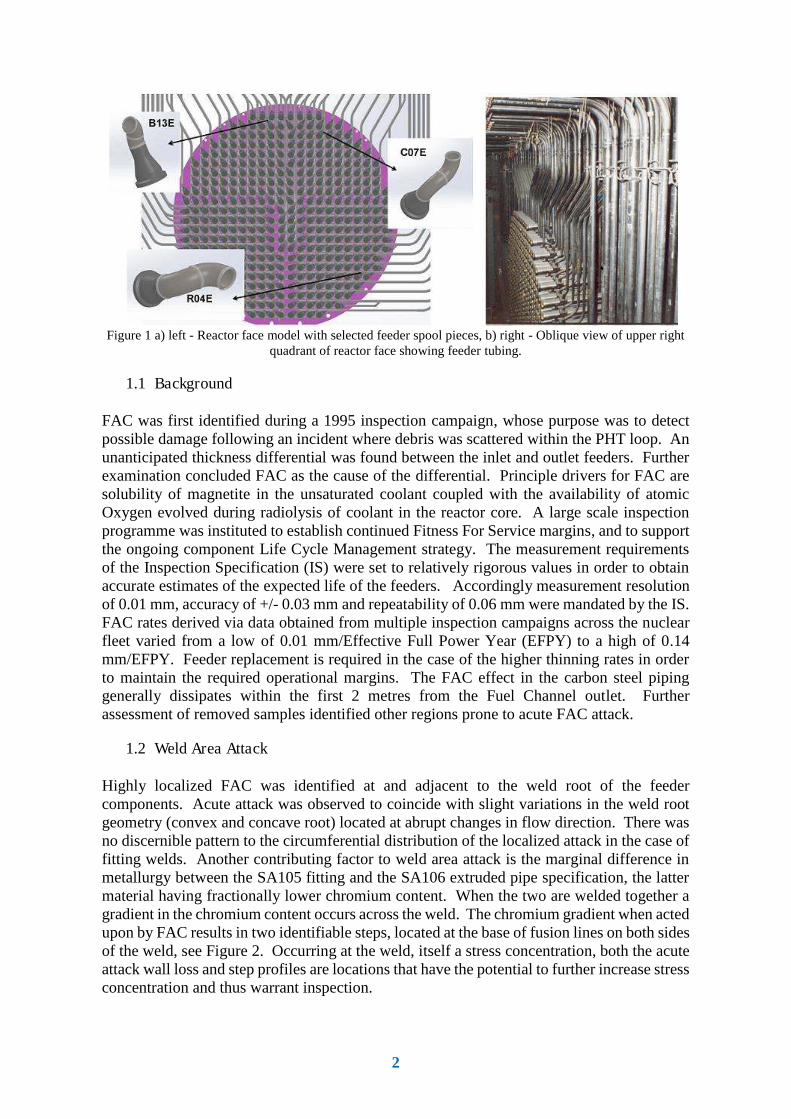
Flow Accelerated Corrosion (FAC) is a common degradation mechanism that affects many process based industries. At Ontario Power Generation – Nuclear (OPG-N), FAC is encountered in the carbon steel piping of the Primary Heat Transport (PHT) system. Locations most significantly affected are the components immediately adjacent to the fuel channel end fitting outlets, see Figure 1. These components form part of a subsystem of the PHT, collectively known as feeders, the function of which is to carry the heavy water coolant to and from the individual fuel channels, comprising the reactor core. The geometries found at these locations are fitting to fitting in the form of SA105 carbon steel Grayloc® fittings welded to either bent schedule 80 SA106 carbon steel tubing or forged elbows. The diameters of the fittings are either 2 or 2½ inch NPS. The permutations of bend radii, sweep angle, bend offset angle and orientation, results in a host of possible feeder configurations.
More info about this article: http://ndt.net/?id=19639
2
Figure 1 a) left - Reactor face model with selected feeder spool pieces, b) right - Oblique view of upper right
quadrant of reactor face showing feeder tubing.
1.1 Background
FAC was first identified during a 1995 inspection campaign, whose purpose was to detect possible damage following an incident where debris was scattered within the PHT loop. An unanticipated thickness differential was found between the inlet and outlet feeders. Further examination concluded FAC as the cause of the differential. Principle drivers for FAC are solubility of magnetite in the unsaturated coolant coupled with the availability of atomic Oxygen evolved during radiolysis of coolant in the reactor core. A large scale inspection programme was instituted to establish continued Fitness For Service margins, and to support the ongoing component Life Cycle Management strategy. The measurement requirements of the Inspection Specification (IS) were set to relatively rigorous values in order to obtain accurate estimates of the expected life of the feeders. Accordingly measurement resolution of 0.01 mm, accuracy of +/- 0.03 mm and repeatability of 0.06 mm were mandated by the IS. FAC rates derived via data obtained from multiple inspection campaigns across the nuclear fleet varied from a low of 0.01 mm/Effective Full Power Year (EFPY) to a high of 0.14 mm/EFPY. Feeder replacement is required in the case of the higher thinning rates in order to maintain the required operational margins. The FAC effect in the carbon steel piping generally dissipates within the first 2 metres from the Fuel Channel outlet. Further assessment of removed samples identified other regions prone to acute FAC attack.
1.2 Weld Area Attack
Highly localized FAC was identified at and adjacent to the weld root of the feeder components. Acute attack was observed to coincide with slight variations in the weld root geometry (convex and concave root) located at abrupt changes in flow direction. There was no discernible pattern to the circumferential distribution of the localized attack in the case of fitting welds. Another contributing factor to weld area attack is the marginal difference in metallurgy between the SA105 fitting and the SA106 extruded pipe specification, the latter material having fractionally lower chromium content. When the two are welded together a gradient in the chromium content occurs across the weld. The chromium gradient when acted upon by FAC results in two identifiable steps, located at the base of fusion lines on both sides of the weld, see Figure 2. Occurring at the weld, itself a stress concentration, both the acute attack wall loss and step profiles are locations that have the potential to further increase stress concentration and thus warrant inspection.

3
Figure 2 Ex-service feeder coupons depicting interior of welded joint with localized FAC attack at and
adjacent weld root.
2. Inspection System
Conventional approaches to thickness measurement are challenged to achieve the Inspection Specification requirements on small diameter bend and fittings, particularly in light of the restricted access to the component surfaces. The requirement to assess thickness through the as fabricated weld cap mandated an entirely new approach to inspection. OPG applied the Full Matrix Capture technique to this problem [1].
2.1 Full Matrix Capture
Full Matrix Capture (FMC) is a relatively underutilized data acquisition method that for the most part has found application in laboratory settings as a vehicle for the study of beamforming techniques. FMC is realized at a position over the inspection volume when transmitting on one element in the array and receiving on all elements in the array. Without displacing the transducer, the next element transmits and all elements in the array receive. The process is repeated for every element in the array such that for an array containing N such elements, the number of individual time domain traces (A scans) collected is N2. The defining attribute of the FMC data set is: it represents the complete data set containing all modes and interactions for a given transducer at a given position with respect to the inspection volume. Other variants of the FMC strategy exist such as sparse array, half matrix capture however; these alternatives were not evaluated during the development of the system. The MIT system acquires FMC frames every 0.5 mm, in the current application, for a total of 400 to 500 frames per scan. File sizes are typically 6 to 7 Gigabytes for a 2½” NPS fitting inspection.
2.2 Total Focussing Method
The Total Focussing Method (TFM) is one of several possible beamforming strategies that can be applied to the FMC data set. Other approaches include; phased array methods [5], wavenumber method [6], back propagation techniques. TFM is categorized as a ‘delay and sum’ method, and is well documented in references [7]. An overview is provided here for context in further discussion.
The FMC data set is first processed to obtain the analytic signal representation of the data set. A reconstruction grid is established representing the inspection volume. The granularity of the nodes in the grid is chosen with respect to both transducer frequency and Inspection Specification requirements. The flight time to each node in the reconstruction grid from each element in the transducer is calculated. For a given transmit receive pair, the time index of the analytic signal contribution is simply the sum of the flight times. The analytic signal values from all transmit-receive pairs relevant to the evaluated node are

4
summed. Where a valid reflector exists, the signal contributions are coherent and reinforce, otherwise cancellation is obtained. An image of the inspection volume is formed taking the absolute magnitude of the analytic signal sum at each node.
The TFM beamformer implemented by OPG follows this approach, with the addition
of an edge detection algorithm to define the coordinates of the imaged external surface. A second iteration of the TFM beamformer is applied however this iteration evaluates the transit time from each element in the array to the node in the search grid through coordinates of the surface detected by the first iteration. The correct path is identified via application of the Fermat principle. As in the previous paragraph, the image of the inspection volume is obtained by summing the values of the analytic signal at the appropriate time indexes. Once the interior volume image is formed, a second instance of an edge detection algorithm is applied to define the coordinates of the interior surface. The minimum thickness is determined by evaluating the most proximate point of the interior surface for every point on the exterior surface. An example of the two images formed, the exterior surface and interior volume, along with the detected edges corresponding to the exterior and interior surfaces is given in Figure 3.
Figure 3 Two stage TFM result of an FMC frame. Exterior surface with detected edge, interior volume with
detected edge and location of minimum thickness. Continuity of image is obtained from parent material (left) through weld region to parent material (right).
The above process is repeated for every FMC frame acquired. The individual frame profiles are assembled into a 3D representation of the inspected component, as found in Figure 4a, colour coded to represent thickness. Alternatively, a monotone grey colour is applied resulting in a photo realistic representation of the component, see Figure 4b. The file may also be exported in STL file format for 3D printing.
Figure 4 a) left - 3D development of Grayloc to fitting weld, colour coded for thickness, b) centre - grey
monotone 3D image, note surface texture and weld pool ripple c) right photograph of similar configuration.
2.3 System Configuration
The original configuration of the MIT data Acquisition system consisted of the following:

5
128 channel Micropulse 5PA data acquisition unit Single axis double hinge clamshell style manipulators, for both 2 and 2½ NPS pipe 7.5 MHz 128 element linear array, pitch dimension of 0.27 mm Ancillary instrumentation module containing motor driver, temperature monitor and various supporting electronics Couplant delivery sub-system Custom UT reference standards Proprietary data acquisition software (Neovision© written in C++) Remote data acquisition PC
The MIT data analysis system consisted of: 4 - Blade centres mounted in a rack configuration 28 - dual processor, quad core blade servers Two gateway servers Custom task supervisory software (C++, C#) running on gateway servers Proprietary data analysis code, written in MATLAB® 2008a, operating as a separate
instance on each of the cores in the blade machines
2.4 Field Application
The MIT system was developed over a period of 20 months and first deployed May 2010 during the Pickering Unit 1 inspection campaign. The scope of the campaign included 38 welds representing 17 feeders. Due to the nature of the single axis manipulator, three separate passes were required for each weld in order to provide full coverage. A total of 27 welds were fully inspected with another 5 welds partially inspected due to obstruction. The remaining welds were deemed inaccessible due to obstruction by adjacent structures. Typical scan times were 23 minutes, and nominal processing times were 45 to 50 minutes per file, applying the configuration listed above. Unlike the defects identified in ex-service feeders, Figure 5, results of the inspection identified few highly localized thinning regions but none significant enough to warrant component replacement. See Figure 6.
Figure 5 a) left - profile view of FAC attack at weld root of an ex-service feeder sample, b) right - end view of
replica from the same flaw.
6
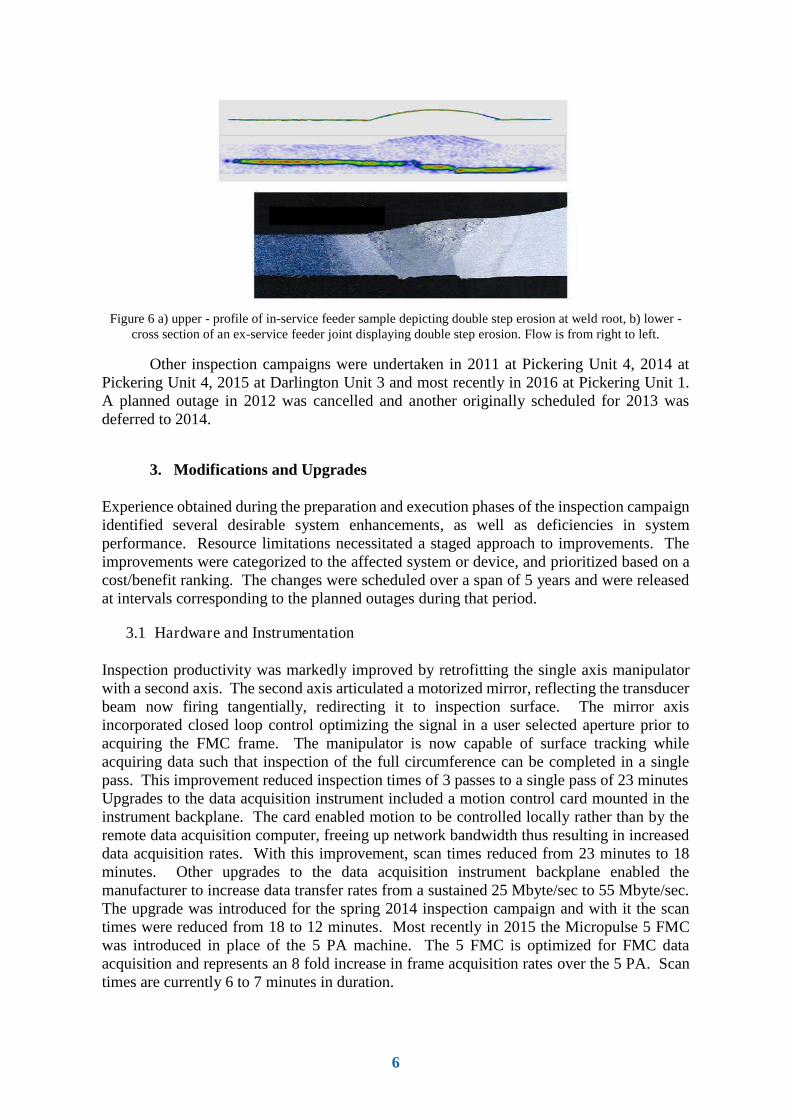
Figure 6 a) upper - profile of in-service feeder sample depicting double step erosion at weld root, b) lower -
cross section of an ex-service feeder joint displaying double step erosion. Flow is from right to left.
Other inspection campaigns were undertaken in 2011 at Pickering Unit 4, 2014 at Pickering Unit 4, 2015 at Darlington Unit 3 and most recently in 2016 at Pickering Unit 1. A planned outage in 2012 was cancelled and another originally scheduled for 2013 was deferred to 2014.
3. Modifications and Upgrades
Experience obtained during the preparation and execution phases of the inspection campaign identified several desirable system enhancements, as well as deficiencies in system performance. Resource limitations necessitated a staged approach to improvements. The improvements were categorized to the affected system or device, and prioritized based on a cost/benefit ranking. The changes were scheduled over a span of 5 years and were released at intervals corresponding to the planned outages during that period.
3.1 Hardware and Instrumentation
Inspection productivity was markedly improved by retrofitting the single axis manipulator with a second axis. The second axis articulated a motorized mirror, reflecting the transducer beam now firing tangentially, redirecting it to inspection surface. The mirror axis incorporated closed loop control optimizing the signal in a user selected aperture prior to acquiring the FMC frame. The manipulator is now capable of surface tracking while acquiring data such that inspection of the full circumference can be completed in a single pass. This improvement reduced inspection times of 3 passes to a single pass of 23 minutes Upgrades to the data acquisition instrument included a motion control card mounted in the instrument backplane. The card enabled motion to be controlled locally rather than by the remote data acquisition computer, freeing up network bandwidth thus resulting in increased data acquisition rates. With this improvement, scan times reduced from 23 minutes to 18 minutes. Other upgrades to the data acquisition instrument backplane enabled the manufacturer to increase data transfer rates from a sustained 25 Mbyte/sec to 55 Mbyte/sec. The upgrade was introduced for the spring 2014 inspection campaign and with it the scan times were reduced from 18 to 12 minutes. Most recently in 2015 the Micropulse 5 FMC was introduced in place of the 5 PA machine. The 5 FMC is optimized for FMC data acquisition and represents an 8 fold increase in frame acquisition rates over the 5 PA. Scan times are currently 6 to 7 minutes in duration.
7
3.2 Software Features
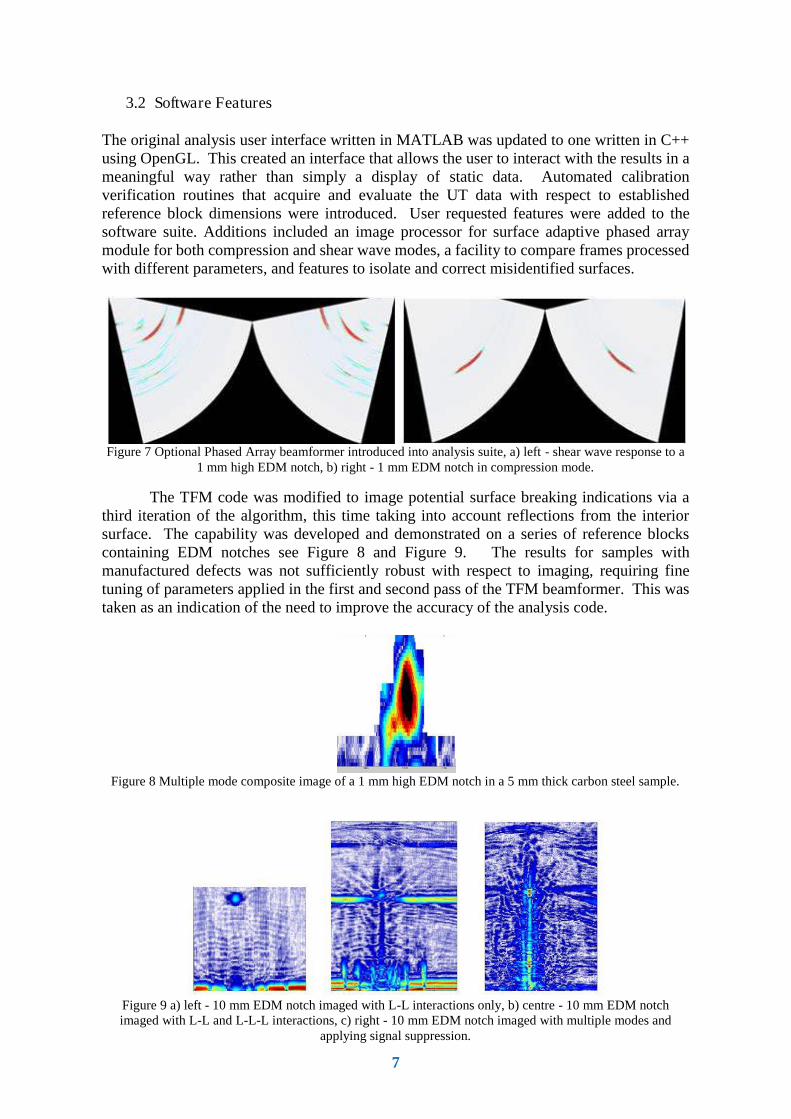
The original analysis user interface written in MATLAB was updated to one written in C++ using OpenGL. This created an interface that allows the user to interact with the results in a meaningful way rather than simply a display of static data. Automated calibration verification routines that acquire and evaluate the UT data with respect to established reference block dimensions were introduced. User requested features were added to the software suite. Additions included an image processor for surface adaptive phased array module for both compression and shear wave modes, a facility to compare frames processed with different parameters, and features to isolate and correct misidentified surfaces.
Figure 7 Optional Phased Array beamformer introduced into analysis suite, a) left - shear wave response to a
1 mm high EDM notch, b) right - 1 mm EDM notch in compression mode.
The TFM code was modified to image potential surface breaking indications via a third iteration of the algorithm, this time taking into account reflections from the interior surface. The capability was developed and demonstrated on a series of reference blocks containing EDM notches see Figure 8 and Figure 9. The results for samples with manufactured defects was not sufficiently robust with respect to imaging, requiring fine tuning of parameters applied in the first and second pass of the TFM beamformer. This was taken as an indication of the need to improve the accuracy of the analysis code.
Figure 8 Multiple mode composite image of a 1 mm high EDM notch in a 5 mm thick carbon steel sample.
Figure 9 a) left - 10 mm EDM notch imaged with L-L interactions only, b) centre - 10 mm EDM notch imaged with L-L and L-L-L interactions, c) right - 10 mm EDM notch imaged with multiple modes and
applying signal suppression.
8
3.3 Analysis Code
Analysis code was streamlined with the removal of duplicate or otherwise superfluous processes. Further efficiency was obtained by structuring the code to pipeline sequential operations where possible. Other efficiency improvements restructured the way in which the Gateway software managed the blade machines, specifically data passing between Gateway and the blades. The task management code was adapted to make use of idle computing resources attached to the secure network rather than restrict processing solely to the blade machines. Cumulatively these improvements reduced the processing time from 50 minutes per file to 20 minutes.
Inspection Qualification of the MIT system was initiated in 2013 and progressed in areas of modelling of the UT responses, analysis of variables associated with data acquisition. Review of the analysis code identified aspects of the process which can potentially introduce errors that, if left unaddressed, may result in unacceptable performance. The majority of these changes are transparent to the user and are summarized in Table 1. The effect of the changes is to increase the robustness of the result across a wider range of inspection conditions.
Table 1 Summary of changes to the analysis code
Feature Purpose – Benefit
Re-sampling analytic signal to 270 MHz equivalent
Improved estimate of analytic signal contribution to the grid node for enhanced resolution and reduced error
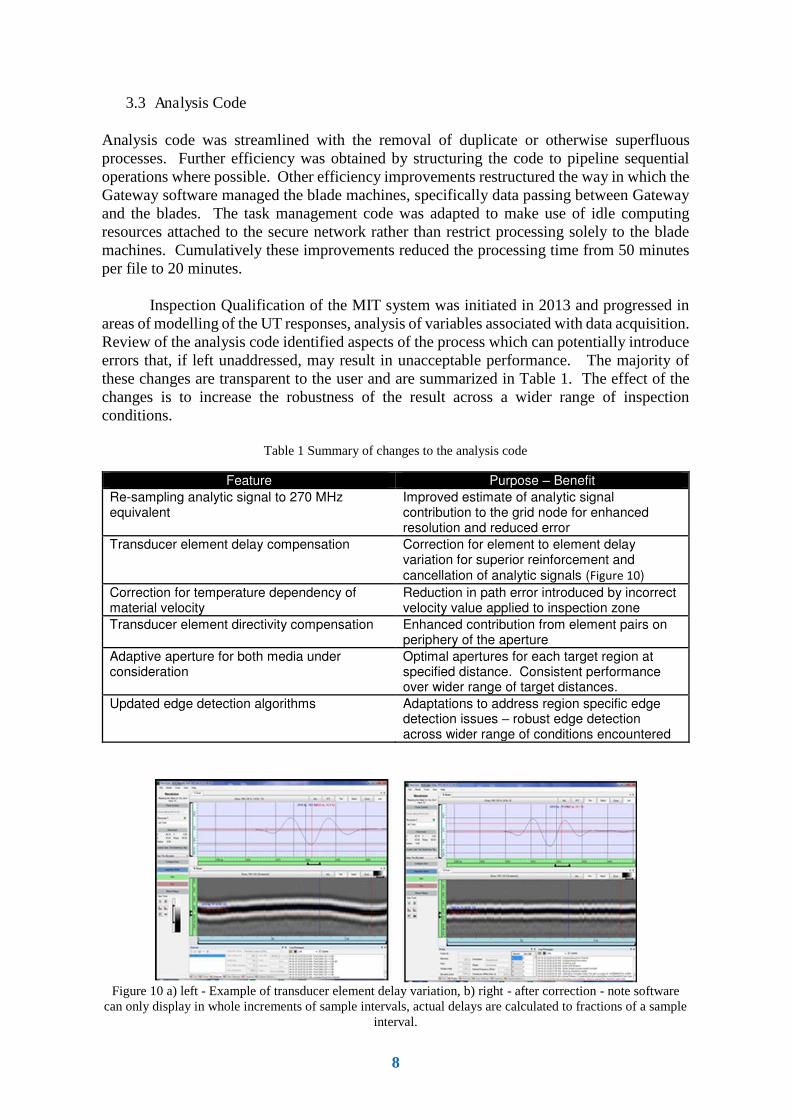
Transducer element delay compensation Correction for element to element delay variation for superior reinforcement and cancellation of analytic signals (Figure 10)
Correction for temperature dependency of material velocity
Reduction in path error introduced by incorrect velocity value applied to inspection zone
Transducer element directivity compensation Enhanced contribution from element pairs on periphery of the aperture
Adaptive aperture for both media under consideration
Optimal apertures for each target region at specified distance. Consistent performance over wider range of target distances.
Updated edge detection algorithms Adaptations to address region specific edge detection issues – robust edge detection across wider range of conditions encountered
Figure 10 a) left - Example of transducer element delay variation, b) right - after correction - note software
can only display in whole increments of sample intervals, actual delays are calculated to fractions of a sample interval.
9
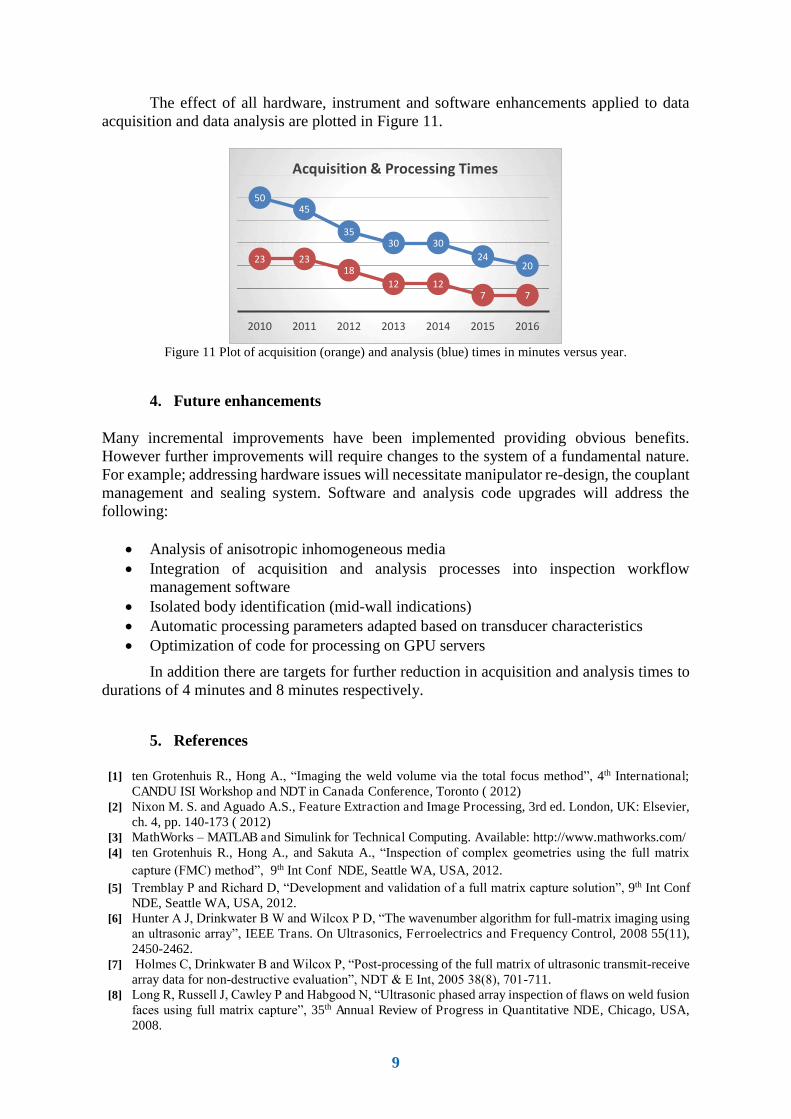
The effect of all hardware, instrument and software enhancements applied to data acquisition and data analysis are plotted in Figure 11.
Figure 11 Plot of acquisition (orange) and analysis (blue) times in minutes versus year.
4. Future enhancements
Many incremental improvements have been implemented providing obvious benefits. However further improvements will require changes to the system of a fundamental nature. For example; addressing hardware issues will necessitate manipulator re-design, the couplant management and sealing system. Software and analysis code upgrades will address the following:
Analysis of anisotropic inhomogeneous media Integration of acquisition and analysis processes into inspection workflow management software Isolated body identification (mid-wall indications) Automatic processing parameters adapted based on transducer characteristics Optimization of code for processing on GPU servers
In addition there are targets for further reduction in acquisition and analysis times to durations of 4 minutes and 8 minutes respectively.
5. References
[1] ten Grotenhuis R., Hong A., “Imaging the weld volume via the total focus method”, 4th International; CANDU ISI Workshop and NDT in Canada Conference, Toronto ( 2012)
[2] Nixon M. S. and Aguado A.S., Feature Extraction and Image Processing, 3rd ed. London, UK: Elsevier, ch. 4, pp. 140-173 ( 2012)
[3] MathWorks – MATLAB and Simulink for Technical Computing. Available: http://www.mathworks.com/ [4] ten Grotenhuis R., Hong A., and Sakuta A., “Inspection of complex geometries using the full matrix
capture (FMC) method”, 9th Int Conf NDE, Seattle WA, USA, 2012. [5] Tremblay P and Richard D, “Development and validation of a full matrix capture solution”, 9th Int Conf
NDE, Seattle WA, USA, 2012. [6] Hunter A J, Drinkwater B W and Wilcox P D, “The wavenumber algorithm for full-matrix imaging using
an ultrasonic array”, IEEE Trans. On Ultrasonics, Ferroelectrics and Frequency Control, 2008 55(11), 2450-2462.
[7] Holmes C, Drinkwater B and Wilcox P, “Post-processing of the full matrix of ultrasonic transmit-receive array data for non-destructive evaluation”, NDT & E Int, 2005 38(8), 701-711.
[8] Long R, Russell J, Cawley P and Habgood N, “Ultrasonic phased array inspection of flaws on weld fusion faces using full matrix capture”, 35th Annual Review of Progress in Quantitative NDE, Chicago, USA, 2008.
50
45
35
30 30
2420
23 23
18
12 12
7 7
2010 2011 2012 2013 2014 2015 2016
Acquisition & Processing Times