progress in making nhs efficiency savings - national audit office
TRANSCRIPT

Progress in making NHS efficiency savings
REPORT BY THE COMPTROLLER AND AUDITOR GENERAL
HC 686 SESSION 2012-13
13 DECEMBER 2012
Department of Health

The National Audit Office scrutinises public spending for Parliament and is independent of government. The Comptroller and Auditor General (C&AG), Amyas Morse, is an Officer of the House of Commons and leads the NAO, which employs some 860 staff. The C&AG certifies the accounts of all government departments and many other public sector bodies. He has statutory authority to examine and report to Parliament on whether departments and the bodies they fund have used their resources efficiently, effectively, and with economy. Our studies evaluate the value for money of public spending, nationally and locally. Our recommendations and reports on good practice help government improve public services, and our work led to audited savings of more than £1 billion in 2011.
Our vision is to help the nation spend wisely.
We apply the unique perspective of public audit to help Parliament and government drive lasting improvement in public services.

Report by the Comptroller and Auditor General
Ordered by the House of Commons to be printed on 11 December 2012
This report has been prepared under Section 6 of the National Audit Act 1983 for presentation to the House of Commons in accordance with Section 9 of the Act
Amyas Morse Comptroller and Auditor General National Audit Office
10 December 2012
Department of Health
HC 686 London: The Stationery Office £16.00
Progress in making NHS efficiency savings
This report examines the progress in making NHS efficiency savings in 2011-12 and whether the NHS is well placed to deliver savings over the three years, 2012-13 to 2014-15.
© National Audit Office 2012
The text of this document may be reproduced free of charge in any format or medium providing that it is reproduced accurately and not in a misleading context.
The material must be acknowledged as National Audit Office copyright and the document title specified. Where third party material has been identified, permission from the respective copyright holder must be sought.
Links to external websites were valid at the time of publication of this report. The National Audit Office is not responsible for the future validity of the links.
Printed in the UK for the Stationery Office Limited on behalf of the Controller of Her Majesty’s Stationery Office
2529241 12/12 7333

The National Audit Office study team consisted of: Leon Bardot, Elena Cozzi, Dan Ward and David Xu, under the direction of Laura Brackwell, with assistance from George Graham and Kathryn McNeillie
This report can be found on the National Audit Office website at www.nao.org.uk/nhs-savings-2012
For further information about the National Audit Office please contact:
National Audit Office Press Office 157–197 Buckingham Palace Road Victoria London SW1W 9SP
Tel: 020 7798 7400
Enquiries: www.nao.org.uk/contactus
Website: www.nao.org.uk
Twitter: @NAOorguk
Contents
Key facts 4
Summary 5
Part OneNHS efficiency savings 11
Part TwoThe delivery of efficiency savings in 2011-12 16
Part ThreeMaking efficiency savings over the three-year period 2012-13 to 2014-15 30
Appendix OneOur audit approach 41
Appendix TwoOur evidence base 43

4 Key facts Progress in making NHS efficiency savings
Key facts
£0.6 billion estimated efficiency savings made by the Department, its arm's-length bodies and strategic health authorities, 2011-12
49 per cent percentage of reported NHS efficiency savings made through the commissioning of acute services, 2011-12
92.5 per cent percentage of planned savings made on average by NHS trusts and NHS foundation trusts, 2011-12
£2.1 billion total aggregate financial surplus of NHS bodies, 2011-12
1.2 per cent growth in NHS hospital activity, 2011-12
Up to £20bnthe Department of Health’s estimate of the efficiency savings the NHS needs to make, 2011-12 to 2014-15
0.1%planned annual real terms increase in NHS spending, 2011-12 to 2014-15
£5.8bnreported NHS efficiency savings made, 2011-12

Progress in making NHS efficiency savings Summary 5
Summary
1 After a decade of sustained and significant growth, spending on the NHS is planned to increase by an average of 0.1 per cent in real terms in the four years from 2011-12 to 2014-15. At the same time, the NHS faces continuing growth in the demand for healthcare, due in part to the ageing population and advances in drugs and technology.
2 The Department of Health (the Department) has estimated that, to keep pace with demand and live within its tighter means, the NHS must make recurrent efficiency savings of up to £20 billion over the four-year period. This is equivalent to year-on-year efficiency savings of 4 per cent, or a cumulative saving of about 17 per cent. The Department expects the NHS to reinvest the savings to meet the demand for healthcare.
3 The NHS is seeking to make efficiency savings by focusing on four areas: quality, innovation, productivity and prevention (together known as QIPP). The Department considers that the NHS will have been successful in meeting the efficiency challenge if it continues to live within its budget and, as a minimum, maintains the quality of, and access to, healthcare.
4 Locally, the key players involved in delivering efficiency savings are as follows:
• Healthcare commissioners. These currently comprise primary care trusts, which will be replaced by clinical commissioning groups and the NHS Commissioning Board from April 2013. Commissioners can make efficiency savings by reducing their own costs, securing the same services for a lower price, reducing the demand for services, or redesigning services.
• Acute, mental health and community service providers. These comprise NHS trusts and NHS foundation trusts. Providers can make efficiency savings by reducing their own costs or redesigning services to achieve the same or better outcomes with fewer resources.
5 This report examines the progress in making efficiency savings in 2011-12 and whether the NHS is well placed to deliver savings over the three years, 2012-13 to 2014-15. Our audit approach is set out in Appendix One and our evidence base is outlined in Appendix Two.

6 Summary Progress in making NHS efficiency savings
Key findings
The Department reported that the NHS achieved almost all its forecast savings for 2011-12
6 The Department reported that the NHS made efficiency savings of £5.8 billion in 2011-12, virtually all of that year’s forecast total of £5.9 billion. Just under half of the reported savings were made through the commissioning of acute services. In addition, the Department, its arm’s-length bodies and strategic health authorities made an estimated £0.6 billion of savings (paragraphs 2.2 and 2.3).
7 Most of the reported savings were generated through contractual levers applied by the Department. To help support the delivery of savings, the Department reduced the national prices (tariffs) that primary care trusts pay to NHS trusts and NHS foundation trusts for healthcare by 1.5 per cent (4 per cent in real terms). NHS staff were also subject to the Government’s two-year pay freeze for public sector workers from April 2011 (paragraphs 2.5 to 2.7).
However, there is limited assurance that all the reported savings were achieved
8 The chief executives of primary care trusts are required to confirm that the financial data they report, including on efficiency savings, is a true reflection of the actual and forecast position, but the Department does not validate or gain independent assurance about the data provided. The Department’s analysis of national data provides assurance that a total of £3.4 billion of NHS efficiency savings and £0.6 billion of central savings were made (although these estimates do not take account of the cost associated with staff reductions, which amounted to at least £0.4 billion) (paragraphs 2.16 to 2.18).
9 Primary care trusts do not measure or report NHS efficiency savings in a consistent way, undermining the quality of the data. The Department has provided limited guidance, and as a result primary care trusts measure and report savings differently. For example, the costs associated with generating savings are not consistently deducted from the figures reported (paragraphs 2.8 to 2.10).
10 We estimate that up to £520 million of the reported savings for 2011-12 were non-recurrent (one-off in nature), meaning the NHS will have to find replacement savings in future years. The need for the NHS to make up to £20 billion of savings is based on the savings being recurrent. The Department does not monitor whether savings are recurrent or non-recurrent. Drawing on our survey data, we estimate that about 91 per cent of the savings reported by primary care trusts were recurrent and about nine per cent were non-recurrent (paragraphs 2.11 and 2.12).

Progress in making NHS efficiency savings Summary 7
The NHS was successful in living within its means
11 The NHS lived within its budget in 2011-12, although there was significant variation in financial performance, particularly among provider organisations. The NHS as a whole reported a surplus of £2.1 billion, but 21 NHS foundation trusts and 10 NHS trusts finished the year with a combined deficit of £307 million. Some trusts in difficulty were given additional financial support from the Department, strategic health authorities and primary care trusts. In our report Securing the future financial sustainability of the NHS,1 we concluded that it is hard to see that this approach will be a sustainable way of reconciling growing demand with the scale of efficiency gains required (paragraphs 2.20 to 2.24).
The NHS performed well against headline indicators of quality
12 In 2011-12, the NHS maintained or improved its performance against key indicators of quality. Performance standards for waiting times were achieved nationally and rates of healthcare associated infections continued to fall. Patient surveys indicated that the quality of patient experience was maintained or improved. The Department does, however, face a significant challenge in monitoring the quality of healthcare across the NHS as a whole. The existing indicators focus mainly on hospital care, and data to assess the quality of primary, community and mental health services in particular is limited (paragraphs 2.25 and 2.26).
The Department does not know whether demand is being managed in ways which inappropriately restrict patients’ access to care
13 The NHS is making increased use of demand management measures to reduce the growth in hospital activity, but it is not clear whether the slowdown in growth is sustainable. Reducing demand and redesigning care pathways to make sure patients are treated in the most appropriate setting are key ways of generating efficiency savings. The growth in hospital activity was 1.2 per cent in 2011-12, compared with 3.7 per cent in 2010-11. Activity growth has been cyclical over the last 15 years (paragraphs 2.27 to 2.32).
14 The aim is to control demand without inappropriately restricting patients’ access to care, but the Department has no way of routinely gaining assurance that this is being achieved. Through our survey, primary care trusts reported they had introduced a variety of measures to manage demand, in most cases for clinical reasons. Some stakeholder bodies have raised concerns, however, that access is being restricted. The Department has made clear that blanket bans on particular procedures are not permitted. It also told us that where it has been made aware of specific concerns, it has asked the relevant strategic health authority to investigate; these investigations have found that local commissioning decisions have been made in accordance with the established policies (paragraphs 2.33 to 2.37).
1 Comptroller and Auditor General, Securing the future financial sustainability of the NHS, Session 2012-13, HC 191, National Audit Office, July 2012.

8 Summary Progress in making NHS efficiency savings
It will be increasingly difficult for the NHS to generate new efficiency savings in future years
15 Understandably, the NHS has started by making the easiest savings first. The NHS benefited from the public sector pay freeze and action taken by the Department to control prices. It also adopted established ways of improving organisational efficiency, such as reducing back-office costs and the use of temporary staff (paragraph 3.3).
16 The savings made by NHS providers as a percentage of operating costs are increasing, but it is not clear what level of savings is sustainable over time. In 2012-13, a third of providers plan to make savings of 5 per cent or more of operating costs but evidence suggests that year-on-year savings of more than 5 per cent have not been achieved in any other hospital sector (paragraphs 3.5 to 3.8).
Service transformation is key to making future savings, but only limited action has been taken to date
17 There is broad consensus that changing how health services are provided is key to a financially sustainable NHS. Such changes will include integrating care, where multiple providers work together to provide a coordinated service for patients, and expanding community-based care. These measures are likely to reduce demand for acute hospital services (paragraphs 3.10 and 3.11).
18 Evidence indicates that the NHS has taken limited action to date to transform services. There are a number of challenges to delivering service transformation. Changes take time to implement and may initially cost, rather than save, money. In 2011-12, the proportion of cash-releasing savings reinvested in transforming services varied and there is no evidence of a shift in staff from the acute to the community sector (paragraphs 3.12 to 3.16).
19 Financial incentives do not always encourage NHS providers to undertake service transformation. The payment by results framework can create perverse incentives now that the NHS is seeking to reduce hospital activity; and in community settings, 90 per cent of care is reimbursed under block contracts, which do not provide an incentive to increase activity. The Department has introduced a number of measures, such as best practice tariffs, to incentivise service transformation and steps are also being taken at local level to address this issue (paragraphs 3.17 to 3.21).
20 There is a variety of support available to help the NHS generate efficiency savings, but there is a lack of evidence on the benefits of service transformation. Differences in the quality and format of information between care settings mean commissioners may find it hard to compare the relative cost and quality of care in different settings or to convince stakeholders of the benefits of moving more services into the community (paragraphs 3.23 to 3.25).

Progress in making NHS efficiency savings Summary 9
21 The NHS reorganisation generated administrative savings in 2011-12 but uncertainty remains about who will be responsible for the oversight of efficiency savings at local level from April 2013. Clinical commissioning groups are already working with primary care trusts in planning savings, and strong clinical engagement is regarded as key to success. It is not clear, however, who will take over the role of strategic health authorities in overseeing savings plans and providing strategic direction for local health economies (paragraphs 3.27 to 3.29).
Conclusion on value for money
22 The NHS has made a good start and clearly delivered substantial efficiency savings in 2011-12. These savings will need to be maintained and built on if up to £20 billion is to be generated by 2014-15. For the NHS to be financially sustainable and achieve value for money in the future, it will need to quicken the pace of service transformation and make significant changes to the way health services are provided.
23 Our overall positive comments reflect the fact that this report covers the early stages of the drive to secure efficiency savings and the Department is still developing its approach. We have highlighted a variety of shortcomings in areas such as whether demand management is having positive or negative effects on access to healthcare; how service transformation can best be achieved; and the reliability of the reported savings data. Unless the Department takes action in these areas quickly, there is a risk that confidence will be undermined and the likelihood of success reduced.
Recommendations
Access to healthcare
a The Department should take a more active interest in demand management and develop ways of gaining routine assurance that patients’ access to healthcare is not being inappropriately restricted. Monitoring access is not straightforward but the Department needs more evidence on the impact of demand management. It should also ensure that local policies on access to care are transparent so that commissioners can be held to account. For areas of concern, the NHS Commissioning Board should consider whether it would be useful to establish national access policies.
Supporting service transformation
b The Department and the NHS Commissioning Board should work with the NHS to reduce barriers to transforming services, and evaluate the impact of transformation initiatives, as they are implemented, to generate evidence about what works locally and on a larger scale. Better evidence is needed to convince stakeholders of the benefits of service transformation, to assess which changes are cost-effective, and to encourage the NHS to apply good practice more widely.

10 Summary Progress in making NHS efficiency savings
c In developing future mechanisms for paying for healthcare, the Department, Monitor and the NHS Commissioning Board should consider how these mechanisms can be used to drive service transformation and care that is integrated around the patient. Currently financial incentives do not always encourage providers to transform services or to work collaboratively with each other or with commissioners.
d The Department should develop better ways of monitoring progress on service transformation. Transformation comes in many different forms and progress is difficult to measure. Currently, NHS organisations report progress against project milestones but these can be achieved without the delivery of financial or other benefits. The Department should explore output measures that assess, for example, whether resources are shifting from hospitals to community services to provide a better indication of progress.
Reporting efficiency savings
e The Department should provide better guidance to the NHS on how to measure and report efficiency savings, so that the total savings reported are more strongly supported by robust data. Current reporting arrangements do not produce data that is either consistent for national reporting or useful to the organisations themselves. It is clear that not all the reported savings would meet our established criteria for assessing the validity of efficiency savings.
f The Department should improve transparency by making clear any caveats to data quality when it reports efficiency savings. The total reported for 2011-12 included non-recurrent savings and did not always take account of costs incurred in generating savings. Parliament and other users should be made aware of any data limitations and whether the data has been validated.
Oversight of efficiency savings
g The Department should clarify the arrangements for oversight of efficiency savings in the reformed NHS from April 2013. It is not clear who will oversee the efficiency plans of the new clinical commissioning groups. Neither is it clear who will make strategic decisions, for example on transforming services, that will benefit wider local health economies rather than individual NHS bodies.

Progress in making NHS efficiency savings Part One 11
Part One
NHS efficiency savings
1.1 This part of the report covers the need for the NHS to make efficiency savings, the organisations involved in delivering the savings, and how the savings are expected to be made.
The need for efficiency savings
1.2 In 2011-12, the NHS in England spent £106 billion. The majority of this money (£89 billion) was spent by primary care trusts on commissioning healthcare for their local populations from GPs, hospitals and other providers.
1.3 Total spending on the NHS more than doubled in cash terms in the last decade. This equated to average increases of over 6 per cent a year in real terms over the ten years to 2011-12. While the NHS has been protected compared with most other areas of government spending, the tighter financial climate has ended this period of significant growth. The spending review2 for the four years from 2011-12 to 2014-15 provided for spending on the NHS to increase by an average of 0.1 per cent a year in real terms.
1.4 At the same time, the NHS is facing continuing growth in the demand for healthcare. Demand is estimated to have increased by 5.5 per cent a year on average over the last decade as a result of the ageing population, developments in drugs and medical technology, and rising public expectations for high quality and accessible care.
1.5 The Department of Health (the Department) has estimated that, to keep pace with demand and live within its tighter means, the NHS must make recurrent efficiency savings of up to £20 billion over the four years to 2014-15. This estimate was partly based on work undertaken in 2009 for the Department by McKinsey and Company,3 which identified a possible NHS funding gap in 2013-14 of between £10 billion and £15 billion.
2 HM Treasury, Spending review 2010, Cm 7942, October 2010.3 McKinsey and Company, for the Department of Health, Achieving world class productivity in the NHS
2009‑10 to 2013‑14, March 2009.

12 Part One Progress in making NHS efficiency savings
1.6 Making up to £20 billion of efficiency savings by 2014-15 is equivalent to year-on-year savings of 4 per cent, or a cumulative saving of about 17 per cent. The total is framed as ‘up to £20 billion’, as it is based on assumptions, for example about the future demand for healthcare, which may change. The Department considers that the NHS will have successfully met the efficiency challenge if it continues to live within its budget and, as a minimum, maintains the quality of, and access to, healthcare.
1.7 The NHS is seeking to make efficiency savings by focusing on four areas: quality, innovation, productivity and prevention (together known as QIPP). In summary, by providing high quality care, innovation and prevention, the NHS expects to improve productivity and get the most value from its resources. The Department expects the NHS to reinvest the savings to meet the demand for healthcare.
The organisations involved in delivering efficiency savings
1.8 The drive to secure efficiency savings is taking place at a time of significant reform to the structures of the NHS following the passage of the Health and Social Care Act 2012. Figure 1 shows the organisations involved in planning and making NHS efficiency savings, both currently and from April 2013. Locally, the key players are as follows:
• Healthcare commissioners. These currently comprise primary care trusts, overseen by strategic health authorities on behalf of the Department; from April 2013, care will be commissioned by clinical commissioning groups and the NHS Commissioning Board.
• Acute, mental health and community service providers. These comprise NHS trusts and NHS foundation trusts. NHS trusts are overseen by strategic health authorities on behalf of the Department; NHS foundation trusts are overseen by the independent regulator, Monitor, and are directly accountable to Parliament.
1.9 Primary care trusts and strategic health authorities have been working together since 2009 to develop plans for making efficiency savings and improving quality and productivity. More recently, emerging clinical commissioning groups have increasingly been involved in planning efficiency savings, working with existing primary care trusts.
1.10 The Chief Executive of the NHS (and from April 2013 the Chief Executive of the NHS Commissioning Board) is ultimately accountable for delivering the efficiency savings, and in turn holds the NHS to account for doing so. The Department reviewed the savings plans of strategic health authorities and signed them off as workable. It tracks progress against the plans as part of its performance management of strategic health authorities. Strategic health authorities perform the same oversight in relation to primary care trusts.

Progress in making NHS efficiency savings Part One 13
Figure 1The organisations involved in planning and making NHS effi ciency savings
Planning and making efficiency savings involves the Department of Health and regional and local NHS bodies
Pre-April 2013 Post-April 2013 Current role in efficiency savings
National Department of Health
Department of Health
Reviews and approves the savings plans of strategic health authorities, and monitors progress against the plans. Provides support to the NHS through national policies (such as a pay freeze and reductions in the prices paid for NHS services) and national workstreams (to help identify areas where the NHS can improve quality and productivity).1
Chief Executive of the NHS
Chief Executive of the NHS Commissioning Board
Accountable to Parliament for the delivery of NHS efficiency savings.
Regional Ten strategic health authorities (in four clusters)
Four regional offices of the NHS Commissioning Board
Review and approve the savings plans of primary care trusts, and monitor progress against the plans. Create regional integrated savings plans.
Local 27 local area teams of the NHS Commissioning Board
Commissioners of services
151 primary care trusts (in 50 clusters)
211 clinical commissioning groups
Commissioners working with providers identify opportunities to improve quality and efficiency and produce local integrated plans to deliver efficiency savings.
Commissioners can achieve efficiency savings by reducing their costs, by securing the same services for a lower price, by reducing demand for services, or by redesigning services.
Providers of services
NHS trusts (107) and NHS foundation trusts (143)2
NHS trusts and NHS foundation trusts2
Providers can achieve efficiency savings by reducing their costs or by redesigning services to achieve the same or better outcomes with fewer resources.
NOTES1 In developing best practice, the Department is supported by the NHS Institute for Innovation and Improvement and the National Institute for
Health and Clinical Excellence.
2 In addition, approximately one to two per cent of hospital services in 2008-09 were provided by the independent sector.
Source: National Audit Offi ce

14 Part One Progress in making NHS efficiency savings
How efficiency savings are expected to be made
1.11 The Department expects efficiency savings to be generated in three main ways:
• Approximately forty per cent of the savings will come from nationally-driven changes such as pay restraint and reductions in the Department’s central budgets, for example for education and training. Savings will also be made by reducing the running costs of the Department’s arm’s-length bodies, and by clustering primary care trusts and strategic health authorities and then abolishing them in 2013.
• Approximately forty per cent of the savings will come from provider-driven changes, as NHS trusts and NHS foundation trusts become more efficient by improving productivity, procurement and medicine management, and reducing back-office costs.
• Approximately twenty per cent of the savings will come from transformational changes, that is changing how services are provided, with, for example, more care being provided in community rather than hospital settings. Such changes will require commissioners and providers to work together to redesign services. As well as generating savings, they are expected to improve the quality of care and patient experience. In the longer term, it is likely that transformational changes will account for a larger proportion of the savings.
1.12 Making efficiency savings is complicated for NHS providers because of the nature of their costs. Most costs are for staff and estates and are ‘step costs’. Such costs do not rise or fall steadily in response to changes in activity; rather they are fixed within certain parameters, beyond which they can change. For example, falling inpatient admissions will only significantly reduce costs for a hospital trust when the fall is large enough to allow the trust to reduce staff numbers and close beds and wards.
1.13 Decision-making in the NHS is devolved to local bodies and changes will occur in different ways in different places. Broadly, however, the Department expected that NHS bodies would generate savings in the first year, 2011-12, by becoming more efficient. The savings made could then be reinvested, for example, in supporting changes in how services are provided. The Department also expected NHS organisations to begin working together during 2011-12 to reduce hospital activity and provide more care in community settings.

Progress in making NHS efficiency savings Part One 15
1.14 Strategic health authorities’ plans for making efficiency savings, which built on the plans of primary care trusts, identified that the NHS could make savings of £17.4 billion over the four years 2011-12 to 2014-15. In addition, the Department identified potential savings of £1.5 billion from its own central budgets. The NHS expected to make almost a third of its savings in 2011-12, with the percentage decreasing in each subsequent year (Figure 2). The Department expected to make most of the central savings in 2011-12. In the event a considerable amount of these savings were realised in 2010-11.
Percentage of total savings (%)
0 20 40 60 80
Figure 2Expected timing of NHS efficiency savings, 2011-12 to 2014-15
2011-12
2013-14
2012-13
Source: National Audit Office analysis of NHS financial returns
The NHS expected to make nearly a third of its efficiency savings in 2011-12
100
2014-15
32 25 22 21

16 Part Two Progress in making NHS efficiency savings
Part Two
The delivery of efficiency savings in 2011-12
2.1 This part of the report covers the efficiency savings reported for 2011-12, the quality of the underlying data, what assurance there is that the reported savings were made, and the impact of the savings on NHS performance.
Reported efficiency savings for 2011-12
2.2 In June 2012, the Department reported that the NHS had made efficiency savings of £5.8 billion in 2011-12, virtually all of the forecast savings of £5.9 billion (Figure 3). The total is based on returns from primary care trusts on the savings made locally, including through the commissioning of healthcare. It does not include efficiency savings generated by the Department itself, its arm’s-length bodies and strategic health authorities. The Department estimates these savings amounted to £0.6 billion in 2011-12.
2.3 Forty-nine per cent of the reported savings (£2.9 billion) were delivered through the commissioning of acute services, 8 per cent below the forecast total for this area. Other areas, such as primary care, dental, pharmacy and ophthalmic services, made significantly more savings than forecast. The percentage of forecast savings delivered in each strategic health authority region ranged from 110 per cent in London to 77 per cent in the East Midlands (Figure 4 on page 18).
2.4 Savings can be separated into two types:
• Cash-releasing savings where the same service is provided for less money. Such savings are needed if money is to be reinvested to meet the growth in demand for healthcare.
• Cost-avoidance savings where growth in activity is controlled through better demand management. These include savings from, for example, primary care trusts setting tighter rules for GP referrals to hospital.

Progress in making NHS efficiency savings Part Two 17
Figure 3Forecast and reported NHS effi ciency savings, 2011-12
The Department reported that the NHS achieved almost all of its total forecast efficiency savings in 2011-12
Area Recurrent spending
(£bn)
Forecast savings
(£bn)
Reported savings
(£bn)
Reported savings as a percentage
of forecast savings (%)
Acute services 34.67 3.10 2.85 92
Community services 7.19 0.50 0.46 93
Mental health and learning disability services
6.78 0.40 0.44 110
Prescribing 8.19 0.40 0.42 104
Specialised commissioning1 5.47 0.30 0.31 103
Continuing healthcare 2.76 0.20 0.16 80
Non-NHS healthcare (including re-ablement2)
2.62 0.20 0.17 83
Primary care, dental, pharmacy and ophthalmic services
11.51 0.20 0.25 127
Ambulance services 1.57 0.10 0.07 73
Other3 3.59 0.50 0.69 137
Total 84.36 5.90 5.82 99
NOTES1 Specialised commissioning covers high cost, low volume interventions or treatments, such as heart,
lung and liver transplants.
2 Re-ablement services help people regain their independence after a period of illness.
3 Other includes administrative savings made by primary care trusts.
4 Totals may not sum due to rounding.
Source: Department of Health

18 Part Two Progress in making NHS efficiency savings
2.5 In 2011-12, primary care trusts classified 88 per cent of their reported savings as cash-releasing. Most of these savings were made through contractual levers. Almost half came from efficiencies built into commissioners’ contracts with providers, including by reducing the prices paid for healthcare under the ‘payment by results’ framework (Figure 5). This covers acute services only at present and provides approximately sixty per cent of trust income. Under the framework, primary care trusts pay NHS trusts and NHS foundation trusts set prices (tariffs), decided nationally, for each unit of care provided. Different kinds of care have different prices. For 2011-12, the Department reduced all national prices by 1.5 per cent to support the delivery of savings. The Department estimates that this equated to a price reduction of 4 per cent in real terms, assuming price inflation of 2.5 per cent. The Department expected the NHS to apply the same reductions to prices negotiated locally.
2.6 The Department has also introduced a number of best practice tariffs to encourage NHS providers to become more efficient. For example, the best practice tariffs for breast surgery and hernia repair incentivise hospital trusts to carry out the procedures as day cases, where clinically appropriate, rather than admitting patients overnight. This is intended to provide services that are more efficient and also improve the quality of care.
London
Percentage of forecast savings achieved (%)
Five strategic health authority regions made more than 100 per cent of their forecast savings in 2011-12
0 20 40 60 80 100 120
Figure 4NHS efficiency savings by region, 2011-12
Source: National Audit Office analysis of Department of Health data
South Central
East of England
South West
North West
Yorkshire and Humber
North East
West Midlands
South East Coast
East Midlands
110
106
103
102
101
100
99
96
86
77

Progress in making NHS efficiency savings Part Two 19
2.7 Cash-releasing savings were also generated through the Government’s two-year pay freeze for public sector workers from 1 April 2011. This reduced the growth in the NHS pay bill by an estimated £1.42 billion in 2011-12 (see paragraph 2.18). Eighty per cent of NHS trusts and NHS foundation trusts reported, through our survey, that pay was their most significant area of savings. Public sector pay awards will be limited to 1 per cent for the two years from 1 April 2013.
Quality of the data on efficiency savings
2.8 Primary care trusts report data on efficiency savings to the Department every quarter, using a standard form. The Department has provided limited guidance to primary care trusts on how to measure and report savings. For example, it has not set clear criteria for what types of savings should be reported or explained how to measure savings.
2.9 The limited guidance means that savings may not have been measured or reported consistently. Our discussions with staff at primary care trusts and our review of a small sample of savings confirmed that trusts were using different approaches, for example, in reporting savings from reduced acute activity – when activity was higher than the level initially contracted for, some trusts reported the savings expected from the initial contract, whereas others reduced the savings to take account of the additional cost associated with the additional activity. Staff also commented that they found the form for reporting savings onerous to complete, and the data breakdown they had to provide to the Department was not useful to them.
Figure 5Analysis of reported cash-releasing NHS efficiency savings, 2011-12
Efficiencies built into provider contracts 48%
Primary care trust action to reduce existing spending 34%
Planned disinvestment in services 6%Changes in care settings 5%
Other savings 7%
NOTE1 Figures need to be treated with caution as primary care trusts do not report savings consistently.
Source: National Audit Office analysis of Department of Health data
Almost half of the reported cash-releasing NHS efficiency savings came from efficiencies built into provider contracts

20 Part Two Progress in making NHS efficiency savings
2.10 Our work also indicated two more general issues about the savings data primary care trusts reported. Specifically:
• some of the savings reported were non-recurrent; and
• the costs associated with generating savings were not consistently deducted.
Non-recurrent savings
2.11 The estimate of up to £20 billion for the savings that the NHS needs to make is based on the savings being recurrent, rather than one-off in nature. Otherwise, in addition to the savings already planned for future years, NHS organisations will have to find new savings to replace the non-recurrent ones from previous years. Examples of non-recurrent items include income generated from selling surplus buildings or savings from leaving posts temporarily vacant.
2.12 The Department does not monitor whether savings are recurrent. Through our survey, 75 per cent of primary care trust clusters (Figure 6) and 85 per cent of NHS providers reported that some of their savings were non-recurrent. Using our survey data, we estimate that on average approximately nine per cent of clusters’ savings in 2011-12 were non-recurrent. Applying this rate across the board would mean that up to £520 million of the savings reported by primary care trusts for 2011-12 were non-recurrent.
Percentage of savings that were non-recurrent (%)
Three-quarters of primary care trust clusters reported that some of their savings were non-recurrent
Figure 6Percentage of primary care trust clusters' savings that werenon-recurrent, 2011-12
Percentage of primary care trust clusters (%)
0 5 10 15 20 25 30 35 40 45
Source: National Audit Office survey of primary care trust clusters
Zero
Greater than zeroto less than 10
10 to <20
20 to <30
30 to <40
40 to <50
50 to 100
Don’t know
23
25
2
2
0
5
2
41

Progress in making NHS efficiency savings Part Two 21
Costs associated with generating efficiency savings
2.13 In generating efficiency savings, organisations often incur additional costs, which should be netted off to calculate the true extent of the savings. Such costs may be one-off, such as redundancy payments, or recurrent. For example, if a saving is made by transferring administrative work from a nurse to a new administrative assistant, the wages of the assistant will be a recurrent cost associated with that saving.
2.14 Forty-four per cent of primary care trust clusters reported through our survey that costs were not consistently deducted from reported savings. In addition, the small sample of savings we examined often did not take account of related costs. For example, one primary care trust reported savings of £2.2 million from reduced running costs but did not take into account associated one-off redundancy payments of £1.1 million.
2.15 In cases where care is moved between settings, such as from a hospital to the community, the NHS may recognise the reduced spending on the old setting as an efficiency saving without deducting the cost of providing care in the new setting. Our review of the returns from primary care trusts indicated that savings of £261.2 million reported as arising from changes in care settings did not take into account associated recurrent costs of £112.3 million.
Assurance that the reported savings were made
2.16 The chief executives of primary care trusts are accountable for the delivery of efficiency savings and the accuracy of their savings data. They are required to confirm that the financial data, including on efficiency savings, that they submit to the Department is a true reflection of the actual and forecast position. Strategic health authority clusters check the reasonableness of the reported savings but do not validate individual savings.
2.17 The Department relies on these arrangements, together with primary care trusts’ wider governance and control systems, to provide assurance that the efficiency savings reported are accurate and evidence-based. It does not, however, validate or gain independent assurance about the data provided by primary care trusts. The Department gains some assurance about the total savings reported by carrying out a variety of analysis. It uses national data on activity, staff, pay, prices and spending to generate estimates of the efficiency savings achieved locally by the NHS and centrally by the Department.

22 Part Two Progress in making NHS efficiency savings
2.18 Our review of the Department’s analysis indicates that a total of £3.4 billion of NHS efficiency savings and £0.6 billion of central efficiency savings can be substantiated using national data for 2011-12, as in the examples below:
• Data on staff numbers, staff-mix and activity indicates that productivity in the NHS improved by 2.4 per cent in 2011-12, equivalent to an efficiency saving of £1 billion. This saving does not, however, take account of the one-off cost of redundancy and early retirement packages associated with reducing staff numbers, which totalled £426 million.
• Trend data indicates that NHS pay would have grown on average by 3.8 per cent, or £1.75 billion in 2011-12, without pay restraint. Pay actually increased by 0.8 per cent on average (£0.33 billion), indicating an efficiency saving of £1.42 billion.
Impact of the efficiency savings on NHS performance in 2011-12
2.19 As well as monitoring and reporting progress in making efficiency savings, the Department tracks the wider performance of the NHS to gain assurance about efficiency, specifically:
• The financial position of the NHS. The NHS as a whole was in financial surplus at the end of 2011-12, although a number of provider organisations were in financial difficulty.
• The quality of healthcare. Performance against headline indicators of quality was maintained or improved in 2011-12. However, the indicators focus mainly on the quality of hospital care and do not generally extend to other parts of the NHS.
• Access to healthcare. Growth in hospital activity slowed in 2011-12, although it is not clear whether this was the result of better demand management or whether access to services was inappropriately restricted.
The financial position of the NHS
2.20 Our report Securing the future financial sustainability of the NHS4 found that strategic health authorities, primary care trusts, NHS trusts and NHS foundation trusts reported a combined overall surplus of £2.1 billion for 2011-12.
2.21 Within this overall position, there was a large gap between the strongest and the weakest NHS bodies and there was some financial distress, particularly in a number of provider organisations. Twenty-one NHS foundation trusts (out of 143) finished the year in deficit, and had a combined deficit of £130 million. A further ten NHS trusts (out of 107) reported a combined deficit of £177 million.
4 Comptroller and Auditor General, Securing the future financial sustainability of the NHS, Session 2012-13, HC 191, National Audit Office, July 2012.

Progress in making NHS efficiency savings Part Two 23
2.22 The 4 per cent efficiency built into the prices paid for healthcare (see paragraph 2.5) is intended to compel NHS trusts and NHS foundation trusts to become more efficient. However, some providers are using other methods to live within their tighter means. For example, 32 per cent of providers reported, through our survey, that they had used some of their financial reserves in 2011-12 to achieve a sustainable position, and 7 per cent had borrowed money.
2.23 In addition, some NHS trusts and NHS foundation trusts in difficulty were given additional financial support in 2011-12. We estimated that strategic health authorities and primary care trusts provided £435 million in direct financial support and other non-recurrent funding. The Department also issued public dividend capital totalling £253 million to NHS trusts and NHS foundation trusts. This capital is given to organisations to ensure they have sufficient cash to pay creditors and staff.
2.24 Some of the additional financial support helped NHS trusts and NHS foundation trusts meet exceptional costs arising in the year. Nevertheless, without this support, an additional 31 NHS trusts and 11 NHS foundation trusts may have posted deficits. We concluded that it is hard to see that this approach will be a sustainable way of reconciling growing demand with the scale of efficiency gains required.
The quality of healthcare
2.25 Given the scale and range of services provided, the Department faces a significant challenge in monitoring the quality of healthcare across the NHS. In addition, some aspects of health services lend themselves readily to measurement, while for others activity, outputs and outcomes are more difficult to measure. Data to assess the quality of primary, community and mental health services in particular is limited.
2.26 The Department reports each quarter on a set of quality indicators, specified in the NHS Operating Framework.5 In 2011-12, reported performance against a range of headline measures including waiting times, infection control and patient experience, was stable or improved:
• Waiting times. Performance standards for waiting times for inpatient admissions, outpatient appointments and diagnostic tests were met nationally (Figure 7 on page 25). The number of local organisations breaching the standards showed improvement in most areas.
5 Department of Health, The Operating Framework for the NHS in England 2011‑12, December 2010.

24 Part Two Progress in making NHS efficiency savings
• Infection control. The number of healthcare associated infections in hospitals continued to decline. The number of patients with MRSA fell by 25 per cent during the year, and the infection rate for Clostridium difficile reduced by 17 per cent during 2011-12 to its lowest level since 2007.
• Patient experience. Patient surveys6 indicated that the quality of patient experience was maintained or improved. Since 2009, more people were: seen on time for their outpatient appointment; felt that they were treated with respect and dignity; and felt involved in decisions about their care and treatment. Patient-reported outcome measures for hip replacements, knee replacements, varicose vein and groin hernia surgeries also showed a marginal improvement.7
Growth in hospital activity and access to healthcare
2.27 An important way in which the NHS is seeking to make efficiency savings is by reducing the demand for health services, particularly for acute hospital care.
2.28 Almost all primary care trust clusters reported, through our survey, increased use of demand management measures. These included telecare,8 case management9 for patients with complex long-term conditions, and providing more care in the community. In addition, the Department introduced financial incentives in 2011-12 for providers to reduce emergency admissions and readmissions. For example, primary care trusts are not required to pay for emergency readmissions within 30 days of a patient being discharged after an elective admission.
2.29 Growth in all categories of NHS hospital activity slowed in 2011-12 (Figure 8 on page 26), although the slowdown in growth in elective admissions was marginal. The growth in cost-weighted hospital activity10 was 1.2 per cent, compared with 3.7 per cent in 2010-11 and 3.3 per cent in 2009-10. The Department estimated that this generated efficiency savings of £0.7 billion. The slower growth in 2011-12 came mainly from a reduction in non-elective admissions (emergency admissions and hospital transfers) and significantly reduced growth in first outpatient appointments.
6 For information on patient surveys: transparency.dh.gov.uk/2012/04/24/inpatient_survey_results_2011/, www.cqc.org.uk/public/reports-surveys-and-reviews/surveys/inpatient-survey-2011, and www.cqc.org.uk/Outpatientsurvey2011
7 For patient-reported outcome data: available at: www.hesonline.nhs.uk/Ease/ContentServer?siteID=1937&categoryID=1295
8 Telecare is the use of technology to help people live more independently at home, so that they can avoid a stay in hospital or moving to a residential care home. Personal alarms and health-monitoring devices may be part of the package as well as telephone support.
9 Case management covers a range of approaches to organise and coordinate health and other support services for people with complex long-term conditions.
10 A composite measure of hospital activity, combining inpatient, day case, accident and emergency, and outpatient episodes, to allow more meaningful comparison between years. Activity is weighted using the relevant national tariff prices.

Progress in making NHS efficiency savings Part Two 25
Figure 7Performance against performance standards for waiting times, 2011-12
Performance standards for waiting times for inpatient admissions, outpatient appointments and diagnostictests were met nationally
Indicator Performance standard
(%)
National performance Local performance (percentage of NHS trusts and NHS foundation trusts breaching the standard between quarter four in 2010-11 and in 2011-12)
Accident and emergency: percentage of patients who spend less than four hours from arrival to admission, transfer or discharge.
95 The standard was met throughout the year when aggregated for all admissions. For major accident and emergency admissions, the standard was met in 30 weeks of the year.
Decreased from 27 per cent to 25 per cent.
Elective procedures: percentage of patients who receive treatment within 18 weeks of referral.
90 The standard was met throughout the year.
Decreased from 30 per cent to 22 per cent.
Diagnostic services: percentage of patients waiting less than six weeks for diagnostic tests.
None The proportion of patients waiting six weeks or more decreased from 1.9 per cent to 1.0 per cent.
The performance of 14 per cent of providers worsened, with the proportion of patients waiting six weeks or more increasing by up to 15 per cent.
Cancer first outpatient appointments: percentage of patients waiting two weeks or less to see a specialist after being referred urgently with suspected cancer by a GP.
93 The standard was met throughout the year.
Decreased from 2 per cent to 1 per cent.
Cancer first definitive treatment: percentage of patients waiting 62 days or less after being referred urgently with suspected cancer by a GP.
85 The standard was met throughout the year.
Decreased from 24 per cent to 17 per cent.
Cancer treatment: percentage of patients beginning treatment within 31 days or less of diagnosis.
96 The standard was met throughout the year.
Decreased from 4 per cent to 2 per cent.
Source: National Audit Offi ce analysis of Department of Health data

26 Part Two Progress in making NHS efficiency savings
2.30 The lower rate of growth in first outpatient appointments may have resulted from demand management measures, such as those described in paragraph 2.28, and a small reduction in the number of GP written referrals (Figure 9). Many primary care trusts have schemes to reduce GP referrals. For example, GPs in one area we visited had developed condition-specific guides on when to refer a patient and the processes that the patient should go through, such as scans and diagnostic tests, before referral. The GPs told us that hospital referrals had fallen as a result of this guidance.
2.31 Although growth in total hospital activity slowed in 2011-12, 85 per cent of primary care trust clusters responding to our survey reported that acute activity had not fallen in line with their expectations. In addition, the local picture is mixed. For example, in 2011-12, the change in non-elective admissions varied from a reduction of 22 per cent to an increase of 11 per cent at different primary care trusts.
Percentage growth in activity compared with previous year (%)
Growth in all categories of NHS hospital activity slowed in 2011-12
-2 0 2 4 6 8
Figure 8Growth in NHS hospital activity, 2009-10 to 2011-12
2009-10
2011-12
2010-11
Source: National Audit Office analysis of Department of Health data
Accident and emergency attendances
First outpatient appointment
Total elective admissions
Non-elective admissions
1.5
1.2
0.8
7.5
3.7
3.3
3.6
3.5
2.9
4.2
-1.0
0.4

Progress in making NHS efficiency savings Part Two 27
2.32 It is unclear whether the slowdown in activity growth can be sustained. The growth rate in all areas of activity accelerated during the last three months of 2011-12. For example, elective admissions increased by 4.6 per cent in the last three months of the year, compared with 2.7 per cent in the first nine months. Growth in hospital activity has been cyclical over the last 15 years (Figure 10 overleaf).
2.33 Managing demand is not intended to restrict inappropriately patients’ access to healthcare. However, a number of the stakeholder bodies we consulted raised concerns about the impact the drive to secure efficiency savings was having on access. They highlighted that introducing eligibility criteria for ‘low priority’ procedures could limit patients’ access to timely and appropriate care. This, in turn, could increase the likelihood in the longer term of emergency presentation and worse clinical outcomes following treatment.
2.34 The Department does not routinely monitor to gain assurance that the NHS is reducing activity without inappropriately restricting access. The Department told us that, where it has been made aware of specific concerns about local commissioning decisions, it has asked the relevant strategic health authority to investigate; these investigations have found that local decisions have been made in accordance with the established policies.
Percentage growth in GP written referrals compared with previous year (%)
The number of GP written referrals fell in 2011-12
-2 0 2 4 6 8 10 12 14
Figure 9Growth in GP referrals, 2008-09 to 2011-12
Source: National Audit Office analysis of Department of Health data
2008-09
2009-10
2010-11
2011-12
12.2
5.5
4.4
-1.1

28 Part Two Progress in making NHS efficiency savings
2.35 Through our survey, 56 per cent of primary care trust clusters reported that they had introduced or raised eligibility criteria for at least one common elective procedure. For example, some clusters may no longer provide certain services to people who smoke or who have a body mass index above a certain level. And patients with cataracts may have to wait until their eyesight deteriorates to a greater degree before having surgery. This essentially defers, rather than avoids, spending. Activity data for 2011-12 confirms that the number of cataract procedures fell (Figure 11).
2.36 In most cases primary care trust clusters have tightened eligibility for clinical reasons, but 11 per cent of clusters reported introducing these types of measure mainly on financial grounds. Twenty-two per cent of clusters also reported that they had placed budget caps on GP referrals or set minimum waiting times for certain treatments.
Figure 10Growth in cost-weighted hospital activity,1 1997-98 to 2011-12
Percentage growth in activity (%)
6
5
4
3
2
1
0
1997-98
1998-99
1999-2000
2000-01
2001-02
2002-03
2003-04
2004-05
2005-06
2006-07
2007-08
2008-09
2009-10
2010-11
2011-12
NOTE1 A composite measure of hospital activity, combining inpatient, day case, accident and emergency, and outpatient episodes, to allow more
meaningful comparison between years. Activity is weighted using the relevant national tariff prices.
Source: National Audit Office analysis of Department of Health data
Growth rate 2.7 4.3 1.5 1.4 0.4 1.9 5.6 3.1 3.0 0.5 2.4 5.7 3.3 3.7 1.2
Growth in hospital activity has been cyclical over the last 15 years

Progress in making NHS efficiency savings Part Two 29
2.37 In September 2011, the NHS Medical Director wrote to primary care trusts about access to healthcare. The letter reiterated the Department’s position that, while there are likely to be services that local commissioners may regard as of lower clinical value than other interventions, this should not be interpreted as permitting blanket bans on particular procedures. Commissioners should take account of a patient’s individual circumstances in making decisions and patients should be entitled to have the decision reviewed where they are denied access to an intervention or treatment.
Percentage growth in the number of procedurescompared with previous year (%)
The number of cataract procedures carried out was 1.9 per cent lower in 2011-12 compared with 2010-11
Figure 11Growth in NHS procedures, 2010-11 and 2011-12
Source: National Audit Office analysis of Department of Health data
Cataract
Hip and kneereplacements
All procedures
-5 0 5 10
3.5
3.7
7.4
5.9
-1.9
0.3
2010-11
2011-12
30 Part Three Progress in making NHS efficiency savings
Part Three
Making efficiency savings over the three-year period 2012-13 to 2014-15
3.1 This part of the report covers the scale of the task facing the NHS and the challenges to be managed in making future efficiency savings.
The scale of the task
3.2 The NHS recognises that it will become increasingly difficult to generate new efficiency savings, and its plans are based on making a smaller amount of new savings in each of the four years to 2014-15 (see Figure 2).
3.3 Understandably, the NHS has started by making the easiest savings first. In 2011-12, savings were mainly made through contractual levers (pay restraint and reductions in the prices paid for healthcare) and through established ways of improving organisational efficiency (such as reducing back-office costs and the use of temporary staff). These kinds of changes are easier to make than the more transformational changes, which often require organisations to work together.
3.4 The savings made in 2011-12 will need to be sustained and built on in future years. Pay rises for public sector staff will be limited to an average of 1 per cent in 2012-13 and 2013-14. However, sustaining the savings made through pay restraint may not be easy in the longer term and may have a detrimental effect on staff morale and productivity.
3.5 The NHS has been making efficiency savings for a number of years through ‘cost improvement programmes’. These programmes are designed to close the gap between the costs a trust will incur in delivering services and its expected income for planned activity. Generating additional income from extra activity, as well as cost savings, may therefore form part of a trust’s programme.
3.6 Providers’ planned and achieved savings, as a percentage of operating costs, increased in each of the three years to 2011-12 (Figure 12). However, providers have found it difficult to deliver all their planned savings. In 2011-12, they made on average 92.5 per cent of planned savings, and one in five providers made less than 80 per cent of planned savings. The main reason for the shortfall was that trusts did not realise planned pay savings because demand for acute services did not fall as expected, constraining trusts’ ability to reduce staff numbers.

Progress in making NHS efficiency savings Part Three 31
2.9
2009-10
Efficiency savings as a percentage of providers' operating costs have increased year-on-year
Figure 12Efficiency savings as a percentage of operating costs, 2009-10 to 2012-13
2010-11
2011-12
2012-13
4.2
4.0
4.7
4.2
5.4
4.9
5.0
NHS trusts
Savings as a percentage of operating costs (%)
0 1 2 3 4 5 6
Plan
Outturn
Source: National Audit Office analysis of data from the Audit Commission and Monitor
2009-10
Savings as a percentage of operating costs (%)
0 1 2 3 4 5 6
2010-11
2011-12
2012-13
3.4
4.4
4.0
4.5
4.1
4.1
NHS foundation trusts

32 Part Three Progress in making NHS efficiency savings
3.7 The NHS bodies that responded to our survey were confident that they would achieve most of their planned savings for the four-year period (Figure 13). Seventy-eight per cent of commissioners, and 80 per cent of providers, considered that at least three-quarters of their planned savings are achievable.
3.8 It is unclear, however, what level of savings is sustainable. Work by McKinsey and Company for the Department looking at efficiencies made in public and private hospital sectors in different countries found that year-on-year savings of much more than 5 per cent had not been achieved elsewhere. In 2012-13, 32 per cent of providers plan to make savings of 5 per cent or more of operating costs (Figure 14).
Less than 25
25 to <50
Percentage of respondents (%)
Percentage of planned efficiency savings that NHS organisations consider achievable (%)
0 10 20 30 40 50 60
Figure 13Percentage of planned efficiency savings which NHS organisations consider are achievable
Commissioners
Providers
Source: National Audit Office survey of primary care trust clusters and NHS providers
Most commissioners and providers are confident that three-quarters or more of theirplanned efficiency savings are achievable
50 to <75
75 to <100
100 or more
Don’t know
20
0
1
2
1
15
56
56
22
24
3
0

Progress in making NHS efficiency savings Part Three 33
Challenges in making future efficiency savings
3.9 This section of the report sets out particular challenges that the NHS faces in making future efficiency savings.
Transforming services
3.10 The Department regards service transformation as key to a sustainable NHS in the future. The NHS Chief Executive has noted that the quality and productivity gains needed do not lie within individual NHS organisations but at the interfaces between primary and secondary care, between health and social care, and between patients and the NHS. At the heart of this is transforming ‘patient pathways’, leading to the integration of services and, in some cases, the integration of organisations.11
11 Department of Health, NHS Operating Framework 2010‑11, December 2009.
Nearly a third of providers plan to make efficiency savings of 5 per cent or more of operating costs in 2012-13
Efficiency savings as a percentage of operating costs (%)
NHS trusts and NHS foundation trusts
Figure 14Planned efficiency savings as a percentage of operating costs, 2012-13
Source: National Audit Office analysis of data from the Department of Health and Monitor
0
1
2
3
4
5
6
7
8
9
10

34 Part Three Progress in making NHS efficiency savings
3.11 A survey12 for the NHS Confederation in 2012 asked commissioners and providers what they thought needed to happen to ensure the NHS could readily respond to financial pressures and improve quality of service. There was broad consensus that the two most important changes were:
• integrating care (77 per cent of respondents), where multiple healthcare providers work together to provide a coordinated service for patients; and
• expanding community-based care (63 per cent of respondents), where services such as physiotherapy and podiatry are provided outside of hospital.
3.12 The Department considers that, given the devolved nature of the NHS, decisions about how health services are provided are a matter for local commissioners and providers. They face a number of challenges in transforming services. For example:
• providers may not have a financial incentive to make the changes (see paragraphs 3.17 to 3.19);
• moving care into the community may require significant up-front investment in community services and facilities;
• there are staffing implications, with more staff working in community services and a reduction in the numbers working in the acute sector;
• ultimately, moving care into community settings will lead to hospital wards, and sometimes whole hospitals, closing, which may be resisted locally; and
• costs may shift from the NHS to the social care sector, funded partly by local authorities; conversely cuts in social care funding may increase NHS costs, for example as elderly patients wait longer to be discharged from hospital.
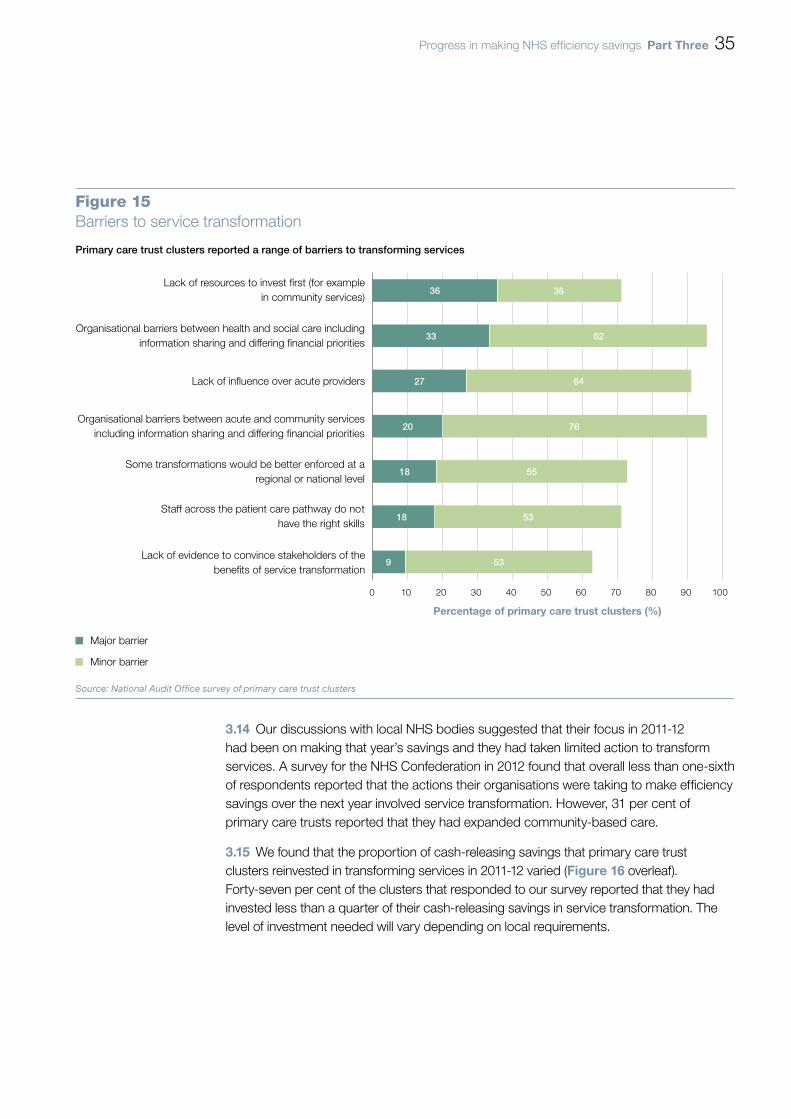
Figure 15 sets out the main barriers to transforming services reported by primary care trust clusters through our survey.
3.13 Where service transformation initiatives are underway, 84 per cent of primary care trust clusters reported that their projects were going very or fairly well. Measuring progress in this area is difficult, however, as service transformation takes time to implement and initially may cost, rather than save, money. Indicators that progress is being made include:
• NHS organisations focusing on delivering service transformation (see paragraph 3.14);
• savings being reinvested in transforming services (see paragraph 3.15); and
• resources moving from the acute sector to the community sector (see paragraph 3.16).
12 Picker Institute, NHS Confederation members’ survey wave 1 – final report, May 2012.
Progress in making NHS efficiency savings Part Three 35
Organisational barriers between health and social care includinginformation sharing and differing financial priorities
Organisational barriers between acute and community servicesincluding information sharing and differing financial priorities
Percentage of primary care trust clusters (%)
Primary care trust clusters reported a range of barriers to transforming services
Figure 15Barriers to service transformation
Major barrier
Minor barrier
Source: National Audit Office survey of primary care trust clusters
0 10 20 30 40 50 60 70 80 90 100
Lack of evidence to convince stakeholders of thebenefits of service transformation
Staff across the patient care pathway do nothave the right skills
Some transformations would be better enforced at aregional or national level
Lack of influence over acute providers
Lack of resources to invest first (for examplein community services)
36
33
27
20
18
18
9
36
62
64
76
55
53
53
3.14 Our discussions with local NHS bodies suggested that their focus in 2011-12 had been on making that year’s savings and they had taken limited action to transform services. A survey for the NHS Confederation in 2012 found that overall less than one-sixth of respondents reported that the actions their organisations were taking to make efficiency savings over the next year involved service transformation. However, 31 per cent of primary care trusts reported that they had expanded community-based care.
3.15 We found that the proportion of cash-releasing savings that primary care trust clusters reinvested in transforming services in 2011-12 varied (Figure 16 overleaf). Forty-seven per cent of the clusters that responded to our survey reported that they had invested less than a quarter of their cash-releasing savings in service transformation. The level of investment needed will vary depending on local requirements.

36 Part Three Progress in making NHS efficiency savings
3.16 There is no evidence of a shift in staff from the acute to the community sector, and spending on community services as a proportion of total NHS spending was the same in 2011-12 as in 2010-11 (8.4 per cent). About half of primary care trust clusters reported, through our survey, a lack of a local, regional or national workforce strategy to support the workforce change needed to match service transformation.
Aligning financial incentives
3.17 Most providers (86 per cent) reported, through our survey, that differing financial incentives between organisations are a major barrier to service transformation. Similarly, almost all primary care trust clusters (96 per cent) reported that organisational barriers (including differing financial priorities) between acute and community services are a major or minor barrier to transforming services. These findings are supported by a report for Monitor in February 2012, which found that NHS payment mechanisms sometimes hamper efforts to integrate or shift services.13
13 PricewaterhouseCoopers, An evaluation of the reimbursement system for NHS‑funded care, report for Monitor, February 2012.
Zero
Percentage of primary care trust clusters (%)
Forty-seven per cent of primary care trust clusters reinvested less than a quarter oftheir cash-releasing savings in transforming services in 2011-12
0 5 10 15 20 25 30 35 40 45
Figure 16Percentage of cash-releasing savings reinvested in servicetransformation, 2011-12
NOTE1 Totals may not sum due to rounding.
Source: National Audit Office survey of primary care trust clusters
Percentage of cash-releasing savings reinvested in transforming services (%)
Greater than zeroand less than 25
25 to <50
50 to <75
75 to <100
100
Don’t know
4
42
16
9
11
7
11
Progress in making NHS efficiency savings Part Three 37
3.18 NHS commissioners use three main mechanisms to pay providers for healthcare:
• national tariffs (also known as payment by results – see paragraph 2.5), where commissioners pay providers for each unit of care, with prices set nationally;
• local tariffs, where the prices are negotiated locally; and
• block contracts, where a fixed annual payment is made, irrespective of the number of patients treated.
3.19 These mechanisms do not always incentivise providers to transform services. For example, while payment by results was effective in incentivising trusts to increase activity, thereby reducing waiting lists, it can create perverse incentives now that the NHS is seeking to reduce hospital activity. Trusts will lose income if activity is transferred to another care setting. Conversely, in community settings, 90 per cent of care is reimbursed under block contracts, which do not provide incentives to increase activity.
3.20 Some steps are being taken to address these issues. For example, one primary care trust cluster we visited had a risk-sharing arrangement with its local NHS trust to support initiatives to reconfigure local services and move activity out of the hospital. Planned reductions in activity are agreed in advance of the contract period. Recognising the time lag between the reductions in activity and the provider’s ability to reduce costs (see paragraph 1.12), the cluster provides transitional financial support for a period to allow the provider time to adjust to lower levels of income and reduce its cost base. The risk-sharing arrangement means that the provider has a stronger incentive to cooperate with plans to reduce hospital activity.
3.21 Nationally, some of the best practice tariffs that the Department has introduced are designed to incentivise service transformation. For example, the tariff for cataract procedures encourages trusts to perform the operation as a day case and to carry out all follow-up assessments on one day around two weeks later. The Department is also developing a ‘year of care’ model for funding long-term conditions. This will involve a fixed payment for a whole year of care. If the total spent by the different NHS providers involved exceeds the fixed amount, the additional spending is split between them. This means that all parties have a financial incentive to act for the benefit of the NHS as a whole.

38 Part Three Progress in making NHS efficiency savings
Identifying and applying good practice
3.22 The NHS needs robust evidence to help it make informed decisions about how to make efficiency savings. Lessons from the implementation, and impact, of initiatives should be shared to encourage others to adopt good practice and discourage organisations from seeking to ‘reinvent the wheel’.
3.23 There is a variety of support available to help NHS bodies generate savings including the following:
• National workstreams, set up by the Department, provide support, training and tools to help NHS organisations make improvements and efficiency savings. There are currently 11 workstreams, mainly covering the commissioning of care, and the running and staffing of NHS organisations (Figure 17).
• A collection of examples of how health and social care staff are improving quality and productivity across the NHS and social care, are available on the NHS Evidence website, run by the National Institute for Health and Clinical Excellence.
3.24 Our survey confirmed that NHS organisations are aware of the information available to support them. Eighty-nine per cent of commissioners and 95 per cent of providers responded that they could draw on good practice examples when developing their efficiency initiatives. Primary care trust clusters commented, however, that there is scope for information and good practice to be shared more systematically.
3.25 One of the barriers to service transformation reported by primary care trust clusters was a lack of evidence to convince stakeholders of the benefits (see Figure 15). There is little good quality information on the costs of community care in particular. Differences in the quality and format of information between care settings can hinder integration, or the shifting of services, as commissioners may find it hard to compare the relative cost and quality of care in different settings, or to convince stakeholders of the benefits of moving more services into the community.
Exploiting the NHS reforms
3.26 The need for the NHS to make up to £20 billion of efficiency savings coincides with significant structural change, with in particular new structures for commissioning healthcare from April 2013 (see paragraph 1.8).
3.27 During 2011-12, transitional work to prepare for the changes generated administrative savings through the clustering of strategic health authorities and primary care trusts. Primary care trust clusters reported, through our survey, that the reorganisation had had a mixed impact on the day-to-day management and delivery of savings (Figure 18 on page 40). The one area where the majority of organisations (71 per cent) reported a negative impact was the clarity of roles and responsibilities.

Progress in making NHS efficiency savings Part Three 39
Figure 17Examples of national workstreams to help the NHS generate effi ciency savings
Workstream Aim
Back-office efficiency To show NHS providers ways to redesign back-office functions, to reduce inefficiencies and costs.
End-of-life care To reduce emergency attendances, inappropriate or unwanted treatment, and the number of complaints by improving systems and practices to identify people as they approach the end of life and better plan their care.
Medicines and procurement To improve cost-effective prescribing in primary care, improve medicines management in secondary care, support patients to get maximum benefit from their medicines, and improve patient safety.
Primary care commissioning To improve how the NHS commissions and contracts for primary care services to reduce unwarranted variation, deliver more consistently high quality services and contribute to the efficiency needs of the NHS.
Source: Department of Health
3.28 Primary care trust clusters reported that clinical commissioning groups had been involved in the planning process in all areas. Also, in almost all areas, responsibility for delivering at least half of the efficiency savings had been delegated to clinical commissioning groups. The areas we visited identified strong clinical engagement as a key success factor in making savings.
3.29 Our work for this report was carried out partway through the transition and some degree of uncertainty remains, particularly in relation to the roles currently performed by strategic health authorities. It is not clear who will be responsible for the oversight of efficiency savings at local level once strategic health authorities have been abolished. Strategic health authorities also provide direction and take decisions that are designed to benefit the local health economy as a whole, rather than any individual NHS body. It is not clear who will carry out these important functions in the reformed NHS.

40 Part Three Progress in making NHS efficiency savings
The NHS reorganisation has had a mixed impact on the day-to-day management and deliveryof efficiency savings
Figure 18The impact of the NHS reorganisation on the day-to-day management anddelivery of efficiency savings
Positive impact
No impact
Negative impact
Don’t know
NOTE1 The NHS is seeking to deliver efficiency savings by focusing on four areas: quality, innovation, productivity and prevention (QIPP).
2 Percentages may not sum to 100 due to rounding.
Source: National Audit Office survey of primary care trust clusters
Agreeing contracts with NHS providers for 2012-13
QIPP planning for 2012-13
Progress on service transformation projects
Continuity of delivery of QIPP plans for 2011-12
Performance management arrangements withNHS providers
Clarity of QIPP accountability arrangements across the NHS
Clarity of QIPP governance arrangements across the NHS
Clarity of roles and responsibilities in your cluster
Joint working with local authorities in relation to social care
2
2
Percentage of primary care trust clusters (%)
0 20 40 60 80 100
24
43
31
32
23
25
16
18
18 11
36
38
43
32
23
36
45
42 27 7
11
33
45
45
30
44
47
71

Progress in making NHS efficiency savings Appendix One 41
Appendix One
Our audit approach
1 The Department of Health (the Department) has estimated that, to keep pace with the growing demand for healthcare and live within its tighter means, the NHS needs to make recurrent efficiency savings of up to £20 billion over the four-year period, 2011-12 to 2014-15. This report examines progress in making NHS efficiency savings. We reviewed whether:
• the NHS delivered the forecast efficiency savings for 2011-12, while maintaining the quality of, and access to, healthcare;
• the programme to deliver efficiency savings is being implemented effectively; and
• the NHS is well placed to make the required efficiency savings over the three years, 2012-13 to 2014-15.
2 In reviewing these issues, we applied an analytical framework with evaluative criteria, which consider what arrangements would be optimal for making NHS efficiency savings. By ‘optimal’ we mean the most desirable possible, while acknowledging expressed or implied restrictions or constraints. In developing the framework, we drew on previous National Audit Office studies on government efficiency programmes.14
3 To inform our audit approach, we held a workshop of healthcare commissioners and providers (including a representative from the independent sector) to develop our understanding of how the NHS is approaching the need to make efficiency savings and the challenges it faces. We also reviewed literature on NHS efficiency programmes published between 2010 and 2012.
4 Our audit approach is summarised in Figure 19 overleaf. Our evidence base is described in Appendix Two.
14 Comptroller and Auditor General, Progress in improving government efficiency, Session 2005-06, HC 802, National Audit Office, February 2006; Comptroller and Auditor General, The efficiency programme – a second review of the progress, Session 2006-07, HC 156i & ii, National Audit Office, February 2007; and Comptroller and Auditor General, Independent reviews of reported CSR07 value for money savings, Session 2009-10, HC 86, National Audit Office, December 2009.

42 Appendix One Progress in making NHS efficiency savings
Figure 19Our audit approach
The Department’s objective
How this will be achieved
Our study
Our evaluative criteria
Our evidence
(see Appendix Two for details)
Our conclusions
We examined whether the NHS delivered the planned savings for 2011-12, while maintaining quality and access, by:
• analysing data on savings, care quality and NHS activity;
• reviewing a sample of reported savings;
• surveys of primary care trust clusters and NHS providers; and
• consultation with stakeholder bodies.
We examined whether the NHS is well placed to make efficiency savings in future years by:
• analysing data and reviewing documents;
• surveys of primary care trust clusters and NHS providers;
• interviews with NHS staff; and
• consultation with stakeholder bodies.
The NHS delivered the forecast efficiency savings for 2011-12, while maintaining the quality of, and access to, healthcare.
The NHS is well placed to make the required efficiency savings over the three years, 2012-13 to 2014-15.
The programme to deliver efficiency savings is being implemented effectively.
We examined whether the programme to deliver efficiency savings is being implemented effectively by:
• reviewing documents;
• surveys of primary care trust clusters and NHS providers;
• interviews with departmental and NHS staff; and
• consultation with stakeholder bodies.
The Department has estimated that, to keep pace with the growing demand for healthcare and live within its tighter means, the NHS needs to make recurrent efficiency savings of up to £20 billion over the four years, 2011-12 to 2014-15.
The NHS is seeking to make efficiency savings by focusing on four areas: quality, innovation, productivity and prevention (together known as QIPP). Measures range from nationally-driven changes, such as pay restraint; improvements in organisational efficiency, such as reductions in back-office costs; and transformational changes in the way services are provided.
The study examined progress in making efficiency savings in 2011-12 and whether the NHS is well placed to make the required efficiency savings in future years.
The NHS has made a good start and clearly delivered substantial efficiency savings in 2011-12. These savings will need to be maintained and built on if up to £20 billion is to be generated by 2014-15. For the NHS to be financially sustainable and achieve value for money in the future, it will need to quicken the pace of service transformation and make significant changes to the way health services are provided.

Progress in making NHS efficiency savings Appendix Two 43
Appendix Two
Our evidence base
1 Our independent conclusion on progress in making NHS efficiency savings was reached following our analysis of evidence collected between May and September 2012.
2 We applied an analytical framework which drew on previous National Audit Office studies on government efficiency programmes.15 Our audit approach is outlined in Appendix One.
3 We examined savings data reported by the NHS and the Department of Health to understand the nature of the reported savings. We reviewed a range of relevant documents, including plans, policies and guidance issued by the Department and strategic health authorities, to understand the approaches adopted in planning, measuring and reporting savings, including the baselines and assumptions used.
4 We reviewed and analysed trends in the delivery of savings by NHS trusts and NHS foundation trusts, including their performance in delivering cost improvement programmes.16
5 We drew on the National Audit Office report on the future financial sustainability of the NHS,17 which examined the financial position of NHS bodies in 2011-12, to assess whether the NHS was successfully living within its tighter means.
6 We analysed data to identify trends across a range of indicators relating to the quality of, and access to, healthcare. We used data published by the Department and The Information Centre for Health and Social Care, including on NHS activity, waiting times, healthcare associated infection rates and patient experience.
15 Comptroller and Auditor General, Progress in improving government efficiency, Session 2005-06, HC 802, National Audit Office, February 2006; Comptroller and Auditor General, The efficiency programme – a second review of the progress, Session 2006-07, HC 156i & ii, National Audit Office, February 2007; and Comptroller and Auditor General, Independent reviews of reported CSR07 value for money saving, Session 2009-10, HC 86, National Audit Office, December 2009.
16 Using data collected by Monitor and the Department of Health, and published reports such as Audit Commission and Monitor, Delivering sustainable cost improvement programmes, January 2012.
17 Comptroller and Auditor General, Securing the future financial sustainability of the NHS, Session 2012-13, HC 191, National Audit Office, July 2012.

44 Appendix Two Progress in making NHS efficiency savings
7 We undertook web-based surveys of all primary care trust clusters and NHS providers (NHS trusts and NHS foundation trusts). We received 45 responses from primary care trust clusters, a response rate of 90 per cent; and 177 responses from NHS providers, a response rate of 71 per cent. The surveys generated evidence on:
• how NHS bodies are planning the delivery of efficiency savings, including the use of demand management measures;
• how NHS bodies are monitoring and reporting efficiency savings, including the nature of the savings reported;
• whether NHS bodies are well placed to deliver savings in the next three years, including progress in transforming services and the impact of NHS restructuring; and
• how primary care trust clusters and NHS providers are working together to support the delivery of efficiency savings in their local area.
8 We visited five primary care trust clusters. During the visits:
• we examined a sample of the savings reported by each cluster against our criteria, to assess the robustness of the savings claimed. The criteria included whether the reported savings were: sustainable and recurrent; net of cost; properly calculated and evidence-based; cash-releasing or cash-avoiding; and not the result of costs being reallocated to another part of the organisation or sector;
• we interviewed staff from the primary care trust cluster involved in the delivery and reporting of efficiency savings. The issues covered included: the mechanisms and levers available to generate savings locally; the impact of savings on wider performance, including on the quality of, and access to, healthcare; and the barriers to delivering savings, now and in the future; and
• we interviewed staff from a local acute NHS trust or NHS foundation trust. The issues covered included: how provider organisations are making efficiency savings; the particular challenges providers face in making savings; and how commissioners and providers are working together to drive savings.
9 We carried out interviews with relevant officials from the Department of Health, including staff from the finance team, the performance team and the efficiency savings policy team, and from the NHS Chief Financial Controller’s office. The interviews generated evidence on: the Department’s approach to planning and implementation; the governance structures in place; and performance management arrangements including for monitoring progress and reporting savings.
10 We interviewed staff from the programme management offices of the four strategic health authority clusters, to understand how the drive to make efficiency savings is managed at national and regional level.

Progress in making NHS efficiency savings Appendix Two 45
11 We interviewed staff from HM Treasury involved in monitoring the Department of Health’s spending and efficiency savings, to understand the context and assumptions made in the spending review in relation to NHS efficiency savings, and the monitoring and reporting arrangements between HM Treasury and the Department.
12 We interviewed and/or consulted a range of stakeholders to obtain their views on:
• the progress being made in delivering efficiency savings across the NHS;
• the impact of delivering efficiency savings on the quality of, and access to, healthcare; and
• the challenges facing the NHS in delivering future efficiency savings.
13 The stakeholders included: the Audit Commission, the British Medical Association, the Centre for Health Economics, the Independent Healthcare Advisory Services, the King’s Fund, Monitor, the National Institute for Health and Clinical Excellence, the NHS Confederation, the NHS Institute for Innovation and Improvement, the NHS Partners Network, the Nuffield Trust, the Royal College of Nursing, and the Royal College of Surgeons.

Design and Production by NAO Communications DP Ref: 010018-001
This report has been printed on Consort 155 and contains material sourced from responsibly managed and sustainable forests certified in accordance with the FSC (Forest Stewardship Council).
The wood pulp is totally recyclable and acid-free. Our printers also have full ISO 14001 environmental accreditation, which ensures that they have effective procedures in place to manage waste and practices that may affect the environment.

Published by TSO (The Stationery Office) and available from:
Online www.tsoshop.co.uk
Mail, telephone, fax and email TSO PO Box 29, Norwich NR3 1GN Telephone orders/general enquiries: 0870 600 5522 Order through the Parliamentary Hotline Lo-Call 0845 7 023474 Fax orders: 0870 600 5533 Email: [email protected] Textphone: 0870 240 3701
The Houses of Parliament Shop 12 Bridge Street, Parliament Square, London SW1A 2JX Telephone orders/general enquiries: 020 7219 3890 Fax orders: 020 7219 3866 Email: [email protected] Internet: http://www.shop.parliament.uk
TSO@Blackwell and other accredited agents
£16.00
9 780102 980547
ISBN 978-0-10-298054-7