progress announces second quarter results€¦ · total daily production ... with the signing of a...
TRANSCRIPT
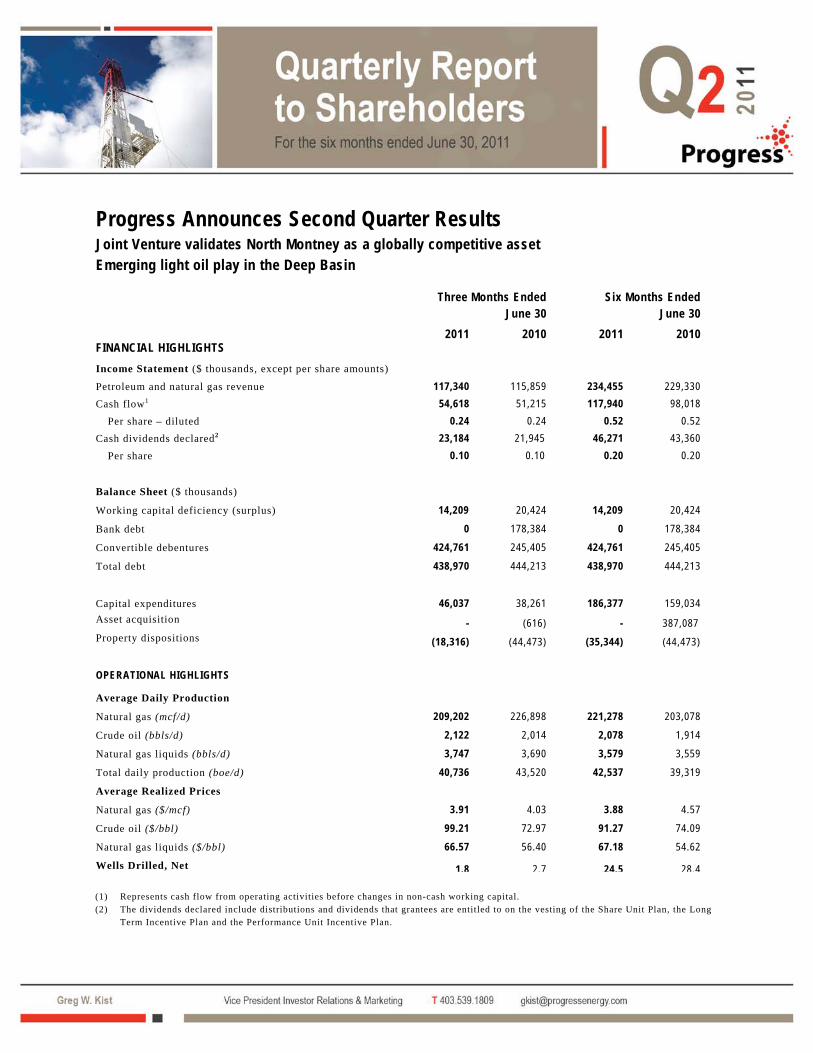
Progress Announces Second Quarter Results Joint Venture validates North Montney as a globally competitive asset Emerging light oil play in the Deep Basin
Three Months Ended June 30
Six Months Ended June 30
2011 2010 2011 2010 FINANCIAL HIGHLIGHTS Income Statement ($ thousands, except per share amounts) Petroleum and natural gas revenue 117,340 115,859 234,455 229,330 Cash flow1 54,618 51,215 117,940 98,018 Per share – diluted 0.24 0.24 0.52 0.52 Cash dividends declared2 23,184 21,945 46,271 43,360 Per share 0.10 0.10 0.20 0.20
Balance Sheet ($ thousands)
Working capital deficiency (surplus) 14,209 20,424 14,209 20,424
Bank debt 0 178,384 0 178,384
Convertible debentures 424,761 245,405 424,761 245,405
Total debt 438,970 444,213 438,970 444,213
Capital expenditures 46,037 38,261 186,377 159,034 Asset acquisition - (616) - 387,087 Property dispositions (18,316) (44,473) (35,344) (44,473) OPERATIONAL HIGHLIGHTS
Average Daily Production
Natural gas (mcf/d) 209,202 226,898 221,278 203,078
Crude oil (bbls/d) 2,122 2,014 2,078 1,914
Natural gas liquids (bbls/d) 3,747 3,690 3,579 3,559
Total daily production (boe/d) 40,736 43,520 42,537 39,319
Average Realized Prices
Natural gas ($/mcf) 3.91 4.03 3.88 4.57
Crude oil ($/bbl) 99.21 72.97 91.27 74.09
Natural gas liquids ($/bbl) 66.57 56.40 67.18 54.62 Wells Drilled, Net
1.8 2.7 24.5 28.4
(1) Represents cash flow from operating activities before changes in non-cash working capital. (2) The dividends declared include distributions and dividends that grantees are entitled to on the vesting of the Share Unit Plan, the Long
Term Incentive Plan and the Performance Unit Incentive Plan.
Progress Energy Resources Corp.
2
Progress Energy Resources Corp. (“Progress” or the “Company”) announced results for the second quarter of 2011 (the “Quarter”) which are consistent with the Company’s guidance. On June 2, 2011, Progress’ joint venture process came to fruition with the signing of a binding framework agreement with PETRONAS to form both an upstream North Montney Joint Venture and a downstream LNG Export Joint Venture. “The agreement we signed with PETRONAS during the Quarter represents a transforming transaction for Progress and its shareholders,” said Michael Culbert, President and Chief Executive Officer of Progress. “This partnership, with one of the leading energy and LNG companies in the world, will position us to unlock the significant value of our North Montney assets.”
Highlights
• On June 2, 2011 executed a CDN$1.07 billion binding framework agreement to create a strategic partnership with the Malaysian national oil company, PETRONAS;
• To date, Progress has drilled three horizontal Dunvegan light oil wells in the Deep Basin with first
month rates averaging 300 boe per day per well;
• Produced 40,736 boe per day, which includes the impact of the scheduled plant turnaround at the McMahon gas processing plant;
• Generated cash flow of $54.6 million in the Quarter or $0.24 per share, diluted;
• Drilled a total of 3 wells (net 1.8), all in the Foothills of northeast British Columbia at Town South,
Kobes and Nig and completed two wells drilled in the first quarter; one in the Deep Basin and one in the Blueberry area of the Foothills;
• As at June 30, 2011, Progress was undrawn on its $650 million covenant-based credit facility; • Maintained the second quarter dividend at $0.10 per common share and declared a third quarter
dividend of $0.10 per common share. Emerging Deep Basin Opportunity - Dunvegan Light Oil Play Progress has drilled and completed three horizontal, 100-percent working interest Dunvegan oil wells in the Deep Basin since the fourth quarter of 2010. The first well, a 2,750 meter test,produced an average of 250 boe per day of 40° API light oil over a 30 day test period and is still producing over 100 boe per day with no water after seven months of operation. Progress’ second well expanded the play 39 kilometers to the northwest from the original test. This well, post frac, produced an average of 355 boe per day over a 30 day test period and continues to produce over 300 boe per day after three months of production. The Company’s third test was recently placed on production and is expected to average 300 boe per day for the first month of production. Assuming four wells per section, Progress has identified more than fifty Dunvegan horizontal follow-up locations on its acreage position where the Company has deeper natural gas production. In addition, the Company is evaluating another 20 net prospective sections of land within the Deep Basin. The Dunvegan formation is a pervasive package of stacked marine and fluvial Cretaceous sands ranging in thickness from one meter units to over 25 meters of reservoir. Detailed in-house geologic mapping has illustrated several productive fairways across the Company’s lands where it has previously drilled deeper gas tests. A further three wells, at an all-in cost of $4 million per well, are planned to be drilled in 2011 with the potential to accelerate the program in 2012. In total, Progress drilled 11 wells (10.3 net) in the Deep Basin in the first half of 2011, with five wells being completed in the first quarter and one additional well being completed in the Quarter. The remaining wells are to be completed during the third quarter. Progress expects to drill a total of six wells in the Gold Creek, Wapiti and Elmworth areas over the remainder of 2011.
Progress Energy Resources Corp.
3
Progress holds a material land position covering approximately 280,000 net acres in the Deep Basin of northwest Alberta. Given the large and contiguous nature of the land base, the Company is able to test play concepts, including liquids-rich gas plays and light oil plays, and with success can quickly establish a meaningful position at lower cost than industry competitors. Progress has the proven expertise in unlocking new play types such as the Nikanassin formation for which the Company co-developed a slick-oil completion technique that is now widely used in the industry. PETRONAS Strategic Partnership During the Quarter, Progress executed a binding framework agreement to create a strategic partnership with the Malaysian national oil company, PETRONAS, to develop a portion of Progress’ Montney assets in the Foothills of northeast British Columbia. Progress will sell 50 percent of its working interest in its Altares, Lily, and Kahta properties (the “North Montney Joint Venture”) to PETRONAS for CDN$1.07 billion in cash and carried interest, as well as explore opportunities to develop liquefied natural gas (LNG) export capacity in British Columbia. Under the terms of the framework agreement, PETRONAS will pay 25 percent of the total consideration (CDN$267.5 million) in cash at closing and 75 percent of the total consideration in the form of a capital carry whereby PETRONAS will pay 75 percent of Progress’ share of future capital expenditures in the North Montney Joint Venture over the next five years to a total of CDN$802.5 million. The transaction is expected to close during the third quarter of 2011. Montney Program Update Progress has built the industry’s largest Montney land position at over 1,250 net sections, or approximately 900,000 net acres, spanning 560 kilometers from northwest Alberta to northeast British Columbia The primary focus of the Company’s Montney program remains in the Foothills of northeast British Columbia where Progress holds approximately 700,000 net acres of largely contiguous Montney rights. Progress continues to pursue the goal set out in November 2010 of doubling its production base over the next five years by developing multiple 50 mmcf per day development pods. Approximately 75 percent, of the Company’s capital spending in 2011 will be directed towards the Montney. Drilling plans will be focused on Progress’ core development pods for the remainder of 2011, including 17 horizontal and two vertical wells. At the Town South pod development (100 percent working interest), Progress drilled one horizontal well targeting the middle Montney in the Quarter. Town South is Progress’ most developed pod to date, with 16 horizontal wells drilled since the third quarter of 2010. At the Kobes pod development (30 percent working interest), one partner horizontal well was drilled in the Quarter and will be completed in the third quarter. The well was drilled in the southern area of the Kobes development, which is partner operated, while Progress operates the northern portion. The Kobes pod has proven to have among the strongest initial production rates in the entire Montney fairway. At the Nig exploration block (50 percent working interest),over 25 kilometers East of Town, a partner- operated Montney well was drilled in the Quarter. The well flowed up tubing at 4.2 mmcf per day and is currently shut-in for pressure build-up. Liquids production is expected to be 25 bbls per mmcf. Program Funding In the first half of 2011 Progress has taken considerable steps to ensure that the Company can fund its capital program in the near and long term. During the first four months of 2011, the Company divested of non-core assets with associated production of approximately 800 boe per day for proceeds of approximately $35 million. Upon closing of the transaction, the upfront cash proceeds from the PETRONAS strategic partnership totaling $267.5 million will provide Progress with an immediate source funding. Additionally, Progress is undrawn on its new $650 million covenant based credit facility which was established in the second quarter of 2011.

Progress Energy Resources Corp.
4
Financial Strength Cash flow for the Quarter was $54.6 million or $0.24 per share, diluted. Capital investment was $46 million. As at June 30, 2011, the Company was undrawn on its $650 million revolving credit facility. Debt-to-total capitalization as at June 30, 2011 was 13 percent. On April 29, 2011 the Company amended and restated its bank credit facility to be a covenant-based facility rather than a borrowing base facility. This facility is a 3-year extendible revolving secured facility in the amount of $650 million from a syndicate of lenders with an initial maturity date of April 29, 2014. As Progress continues to grow its production, reserves and cash flow with the objective of doubling the size of the Company in the next five years, this new facility will provide more certainty and flexibility to fund the Company’s growth program. Progress’ average gas price in the Quarter was 3.86 per thousand cubic feet (“mcf”), including the impact of the Company’s hedging program. The Company’s high heat content gas stream achieves a premium to AECO prices. Royalty rates averaged 13.8 percent in the Quarter as a result of lower natural gas prices and the impact of higher royalty incentives. Operating costs averaged $5.75 per boe, or $0.96 per mcf, in the Quarter reflecting the Company’s continued focus on operational efficiencies and maximization of volumes through existing facilities and includes the impact associated with the planned outage at the McMahon gas processing facility. In the first half of 2011, Progress entered into a series of hedges on a portion of its natural gas production buying puts on 30,000 gigajoule (“GJ”) per day at a net floor of $3.43 per GJ. The Company now has 60,000 GJ per day or approximately 22 percent of its natural gas production hedged at a net floor of approximately $3.41 per GJ or approximately $3.90 per mcf, based on Progress’ high heat content gas, for the period from May 1, 2011 to October 31, 2011. The Company also entered into a series of AECO basis swaps on 40,000 million British Thermal Units (“mmbtu”) per day for 2011 at a net differential of US$0.50 per mmbtu and on 40,000 mmbtu per day for 2012 at a net differential of US$0.62 per mmbtu.
Third Quarter Dividend and Dividend Reinvestment Program The Board of Directors of Progress today announced that the third quarter eligible dividend will be maintained at $0.10 per share. The eligible dividend will be payable on October 17, 2011 to common shareholders of record as of September 30, 2011. The ex-dividend date is expected to be September 28, 2011. Based on the July 27, 2011 closing share price on the Toronto Stock Exchange of $13.46, this represents an annualized yield of approximately three percent. The amount of future cash dividends, if any, is subject to the discretion of the Progress Board of Directors. Progress has a dividend reinvestment plan (the "DRIP") that allows eligible shareholders of Progress to direct that their cash dividends be reinvested in additional common shares which, when issued from treasury, will be issued at 95 percent of the Average Market Price (as defined in the DRIP) on the applicable dividend payment date. A registered shareholder who wishes to enroll in the DRIP may do so by contacting Computershare Trust Company of Canada, the Plan Agent. Beneficial shareholders who wish to participate in the DRIP should contact the broker or other nominee through which their common shares are held to provide appropriate enrollment instructions and to ensure any deadlines or other requirements that such broker or nominee may impose or be subject to are met.
Progress Energy Resources Corp.
5
Outlook Our 2011 capital program has been established at $350 million and is expected to result in year-over-year production growth of approximately 13 percent. Production is projected to exit 2011 at between 50,000 and 52,000 boe per day, before the impact of dispositions. We have a current productive capability of approximately 45,000 boe per day . The focus of our capital program for the remainder of the year will be the continued advancement of our highly economic Montney pod developments at Town South, Town North, Gundy and Kobes. Additionally, activity on our North Montney Joint Venture lands in the Altares, Lily and Kahta areas will commence upon closing of the strategic partnership in the third quarter of 2011. We will continue to take advantage of the factors that make the North Montney attractive; the natural gas we produce is sweet and therefore does not require expensive sour gas processing; we attract a deep drilling royalty credit of approximately $2.1 million per well; and, we produce approximately 20 barrels per million cubic feet of high-value natural gas liquids. Along with our experience in the area, evolving drilling and completions technologies and strong initial production rates and recoveries, we are well positioned to deliver value for shareholders. Natural gas prices weakened through the second quarter of 2011, a period when demand is typically low due to moderate temperatures; however heat in early June demonstrated that non-normal weather has the ability to significantly increase prices. We remain optimistic about the long-term prospects for natural gas in North America and increasingly view the natural gas market as a global, rather than regional, marketplace. As demonstrated by our LNG Export Joint Venture with PETRONAS, the resource potential of northeast British Columbia is globally recognized and supply from a stable OECD country is highly prized by Asian consumers. Momentum is building for the large scale development of LNG facilities on the West Coast, which will enable Progress to target more attractive markets. Progress is well positioned to execute on its growth plans. We have a strong balance sheet with no bank debt as at the end of the Quarter, an undrawn credit facility and expect to receive an upfront CDN$267.5 million cash payment upon closing of our strategic partnership with PETRONAS. These financial levers provide immediate and ongoing funding for our growth strategy. Non-core asset dispositions and the standby equity financing component of our strategic partnership with PETRONAS provide further support in the long term.
Consolidated Financial Statements and MD&A Second Quarter 2011 Consolidated Financial Statements and Notes to the Consolidated Financial Statements and Management’s Discussion and Analysis for Progress Energy Resources Corp. have been filed on SEDAR (www.sedar.com) under Progress Energy Resources Corp. and can also be accessed on the Company’s website at www.progressenergy.com. Progress is a Calgary based, mid-size energy Company primarily focused on natural gas exploration, development and production in northwest Alberta and northeast British Columbia. Common shares of Progress are listed on the Toronto Stock Exchange under the symbol PRQ. For further information: Greg Kist, Vice President, Investor Relations and Marketing Progress Energy Resources Corp. 403-539-1809 ([email protected]) Kurtis Barrett, Analyst, Investor Relations and Marketing Progress Energy Resources Corp. 403-539-1843([email protected])
Progress Energy Resources Corp.
6
MANAGEMENT’S DISCUSSION AND ANALYSIS The following discussion and analysis (“MD&A”) of financial results is dated July 28, 2011 and is to be read in conjunction with the accompanying unaudited interim consolidated financial statements and related notes for the period ended June 30, 2011 of Progress Energy Resources Corp. (“Progress” or the “Company”) and the audited consolidated financial statements and related notes and MD&A for the year ended December 31, 2010. The interim consolidated financial statements have been prepared in accordance with International Accounting Standard 34 “Interim Financial Reporting”. Previously the Company prepared its 2010 interim and annual consolidated financial statements in accordance with Canadian generally accepted accounting principles (“previous GAAP”). The adoption of IFRS has not had an impact on the Company’s operations, strategic decisions or cash flow from operations before changes in non-cash working capital. The reporting and the measurement currency is the Canadian dollar. Description of Business
Progress is a Calgary based, natural gas focused Company. The principal undertaking of the Company is to explore for, develop and hold interests in petroleum and natural gas properties. Primary operating regions include the Deep Basin of northwest Alberta and the northeast British Columbia Foothills. The common shares of the Company trade on the Toronto Stock Exchange (“TSX”) under the symbol PRQ. The 6.25 percent, 5.25 percent and 5.75 percent convertible unsecured subordinated debentures (the “Debentures”) trade on the TSX under the symbols PRQ.DB.A, PRQ.DB.B, and PRQ.DB.C, respectively.
NORTH MONTNEY UPSTREAM JOINT VENTURE
On June 2, 2011 Progress announced it had executed a binding framework agreement with the Malaysian national oil company, PETRONAS, to develop Progress’ Montney shale assets in the Altares, Lily, and Kahta areas in the Foothills of northeast British Columbia. Under the proposed arrangement, Progress will sell 50 percent of its working interest in these areas to PETRONAS, approximately 75,000 net acres of undeveloped land representing approximately nine percent of Progress’ total Montney land holdings. Progress expects to receive $267.5 million in cash on the closing of the transaction and an additional $802.5 million over the next five years in the form of a capital carry whereby PETRONAS would pay 75 percent of Progress’ share of future capital expenditures in the North Montney Upstream Joint Venture (the “Upstream Joint Venture”) for a total consideration of $1.07 billion. Progress would be the operator of the Upstream Joint Venture which would be comprised of approximately 150,000 total net acres of land, including both Progress’ and PETRONAS’ ownership share of the lands. The transaction is expected to close in the third quarter of 2011.
In addition to the Upstream Joint Venture, PETRONAS and Progress expect to establish a liquefied natural gas (“LNG”) export joint venture (the “LNG Joint Venture”) to be 80 percent and 20 percent owned, respectively. The LNG Joint Venture would initiate a feasibility study to evaluate building and operating a new LNG export facility on the west coast of British Columbia. PETRONAS would be the operator of this facility and PETRONAS and Progress would jointly market the LNG utilizing PETRONAS’ well-established and extensive network of customers in the largest LNG global markets.
OPERATING SUMMARY
In accordance with Canadian industry practice, production volumes, reserve volumes and revenues are reported on a Company interest basis (working interest plus royalty interest), before deduction of Crown and other royalties, unless otherwise indicated. The Company’s results of operations are dependent on production volumes of natural gas, crude oil and natural gas liquids and the prices received for this production. Prices for these commodities have shown significant volatility during recent years and are determined by supply and demand factors, including weather, general economic conditions and changes in the Canadian/United States (“US”) currency exchange rate.
Progress Energy Resources Corp.
7
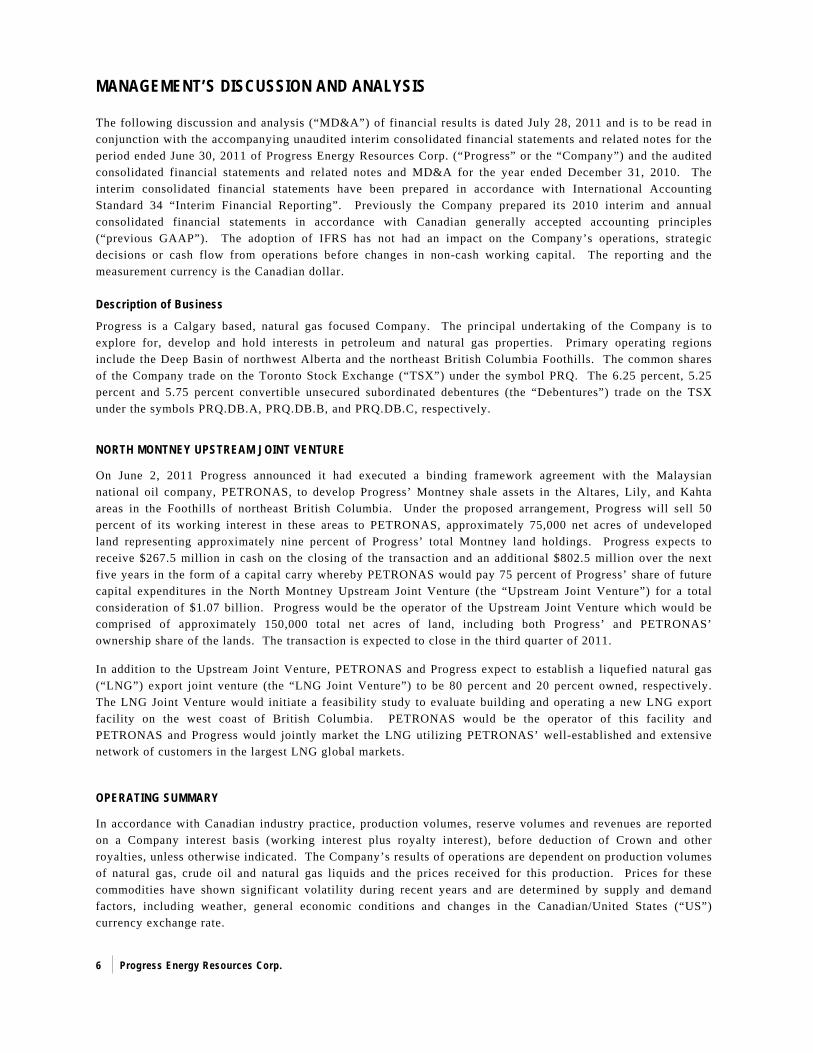
In this MD&A, production and reserves information may be presented on a “barrel of oil equivalent” or “boe” basis with six thousand cubic feet (“mcf”) of natural gas being equivalent to one barrel (“bbl”) of crude oil or natural gas liquids. Boe’s may be misleading, particularly if used in isolation. A boe conversion ratio of 6 mcf:1 bbl is based on an energy equivalency conversion method primarily applicable at the burner tip and does not represent a value equivalency at the wellhead. Production
Three Months Ended June 30
Six Months Ended June 30
2011 2010 2011 2010 Change Average Daily Production
Natural gas (mcf/d) 209,202 226,898 221,278 203,078 9%
Crude oil (bbls/d) 2,122 2,014 2,078 1,914 9%
Natural gas liquids (bbls/d) 3,747 3,690 3,579 3,559 1%
Total daily production (boe/d) 40,736 43,520 42,537 39,319 8%
Sulphur sales (tons/d) 119 76 72 98 (27%)
Progress’ production for the three months ended June 30, 2011 (the “Quarter”) averaged 40,736 boe per day consisting of 209,202 mcf per day of natural gas, 2,122 bbls per day of crude oil and 3,747 bbls per day of natural gas liquids. Production during the Quarter was six percent lower than the same period in 2010 of 43,520 boe per day due to a planned turnaround at the Spectra-owned McMahon gas processing facility (the “McMahon turnaround”). The 15 day McMahon turnaround, which is scheduled every three years, reduced production by approximately 4,000 boe per day for the Quarter. Successful drilling results in 2011 and 2010 more than offset the decrease in production from the dispositions completed in 2011 as described below, as well as the sale of the Company’s Central Alberta properties on June 30, 2010. The Company’s production portfolio for the Quarter was weighted 86 percent to natural gas, five percent to crude oil and nine percent to natural gas liquids.
Natural gas production decreased eight percent to 209,202 mcf per day for the Quarter compared to 226,898 mcf per day for the same period in 2010 due to the McMahon turnaround. Crude oil and natural gas liquids (“NGL”) production for the Quarter of 5,869 bbls per day was three percent higher than the same period in 2010 of 5,704 bbls per day.
Progress undertook an asset disposition program in early 2011 to further focus its asset base in the Deep Basin of northwest Alberta and the Foothills of northeast British Columbia. As a result, on March 31, 2011, the Company disposed of its Two Creek Alberta properties for approximately $12.7 million (approximately 260 boe per day) and disposed of certain royalty interests in the Copton, Alberta area for approximately $4.2 million (approximately 60 boe per day). In April 2011, the Company disposed of its Fort St. John Plains North properties for approximately $12.7 million (approximately 380 boe per day) as well as certain properties in the Copton, Alberta area for approximately $4.8 million (approximately 115 boe per day).
Year-to-date 2011 production was 42,537 boe per day consisting of 221,278 mcf per day of natural gas, 2,078 bbls per day of crude oil and 3,579 bbls per day of natural gas liquids. This production was eight percent higher than the same period in 2010 of 39,319 boe per day due to the Company’s acquisition of certain northeast British Columbia Foothills assets (the “Foothills Acquisition”) on March 31, 2010 as well as the successful drilling results which more than offset the impact of the McMahon turnaround and dispositions in 2010 and 2011. The Company’s production portfolio for the six months ended June 30, 2011 was weighted 87 percent to natural gas, five percent to crude oil and eight percent to natural gas liquids.
Production is projected to exit 2011 at between 50,000 and 52,000 boe per day, before the impact of the dispositions noted above. The Company has a current productive capability of approximately 45,000 boe per day.
Progress Energy Resources Corp.
8
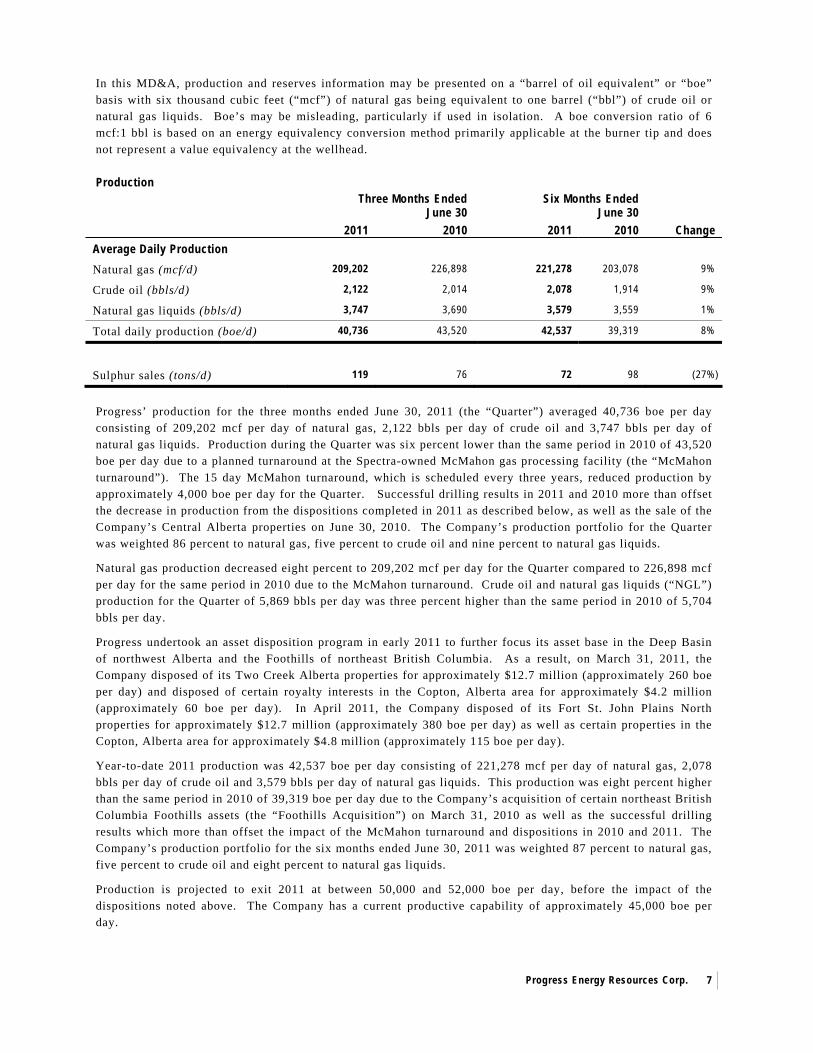
Production by Region Three Months Ended
June 30 Six Months Ended
June 30 2011 2010 2011 2010 Change Average Daily Production (boe/d)
Foothills 26,296 23,127 27,172 18,884 44%
Fort St. John Plains 1,165 1,837 1,457 1,921 (24%)
Other 451 594 471 623 (24%)
Total British Columbia 27,912 25,558 29,100 21,428 36%
Deep Basin 12,599 16,195 13,093 16,038 (18%)
Central Alberta - 1,238 - 1,298 (100%)
Other 225 529 344 555 (38%)
Total Alberta 12,824 17,962 13,437 17,891 (25%)
Total daily production 40,736 43,520 42,537 39,319 8% Excludes sulphur production
Pricing
Natural Gas Markets
Progress’ realized natural gas price for the Quarter was $3.91 per mcf ($3.40 per gigajoule (“gj”)) compared to $4.03 per mcf ($3.51 per gj) for the same period in 2010. The AECO daily index averaged $3.67 per gj in the Quarter (2010 - $3.69 per gj), the AECO monthly index averaged of $3.54 per gj (2010 - $3.66 per gj) and the Station #2 daily index averaged $3.40 per gj (2010 - $3.47 per gj). Progress markets its natural gas at a mix of daily and monthly pricing. For the six months ended June 30, 2011 Progress’ realized natural gas price was $3.88 per mcf ($3.36 per gj) compared to $4.57 per mcf ($4.00 per gj) for the same period in 2010. During the six months ended June 30, 2011 the AECO daily index averaged $3.62 per gj (2010 - $4.19 per gj), the AECO monthly index averaged of $3.56 per gj (2010 - $4.37 per gj) and the Station #2 daily index averaged $3.33 per gj (2010 - $4.00 per gj). Although natural gas prices during the Quarter were highly volatile, with Henry Hub trading within the range of $4.05 to $4.92 per mmbtu, they ended the Quarter down just 0.9 percent versus the first quarter of 2011. Despite domestic US production reaching a record high in early April, prices rose almost 7 percent in the month due to seasonally cool temperatures in consuming regions. Residential and commercial consumption for heating drove demand in the northeast, rockies and midcontinent regions of the US and cooling demand in the south provided support. A widespread selloff of commodities began a downward trend in prices in early May, with natural gas seeing its biggest one day drop in 19 months as market sentiment turned bearish. Prices remained depressed throughout May, as spring weather conditions were such that demand for both heating and cooling was low. The first major heat event of the year began in late May, as a heat wave spread across the northern US and into eastern Canada. Prices rose 21 percent from May 20th to June 9th, the peak of the heat wave, to $4.92 per mmbtu, a 10 month high. Normal weather and increased spare capacity at nuclear facilities led to prices falling consistently in June to end the Quarter at $4.28 per mmbtu. The late May/early June heat wave demonstrated that sustained, above-average temperatures have the ability to push prices significantly higher. Despite record US domestic production in the lower 48, storage levels remain nine percent below 2010 levels, a bullish signal that there is demand for the increased supply. In terms of the long term outlook for North American natural gas, the Quarter saw considerable attention paid to the development of LNG export off the west coast of British Columbia from both Canadian producers and Asian consumers.
Progress Energy Resources Corp.
9
Oil Markets
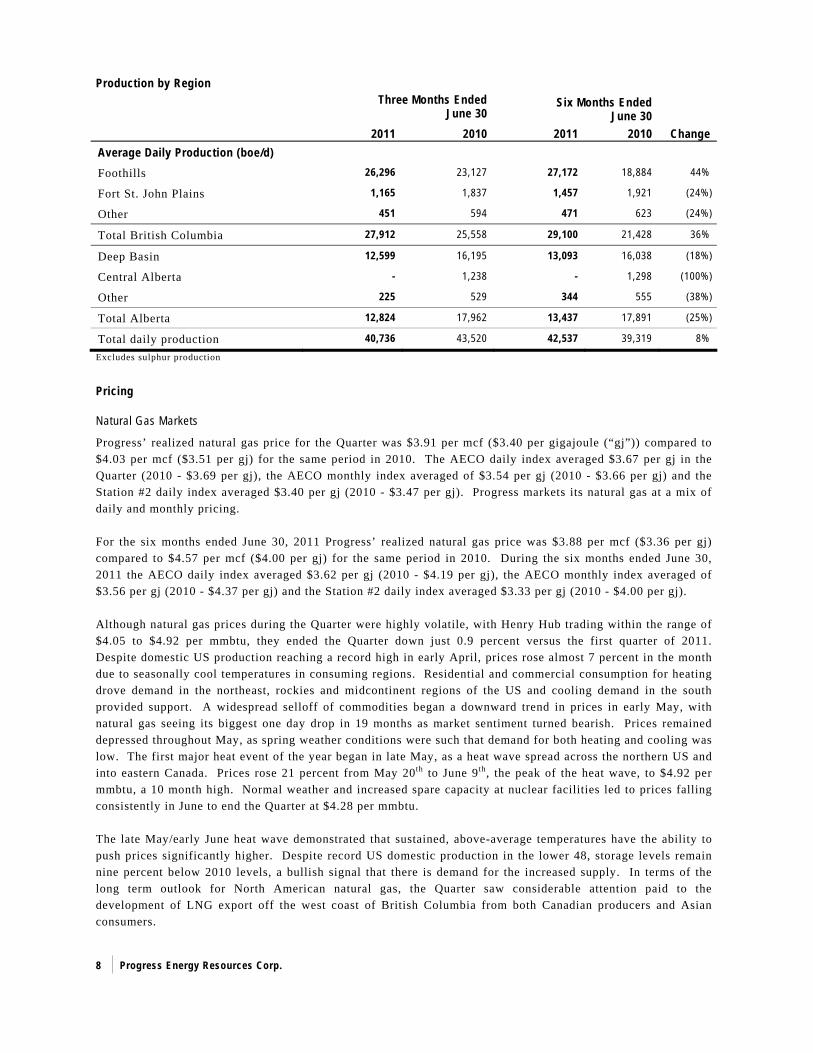
Progress’ realized prices for its liquids streams for the Quarter were $99.21 per bbl (2010 - $72.97 per bbl) for crude oil and $66.57 per bbl (2010 - $56.40 per bbl) for natural gas liquids. For the six months ended June 30, 2011 Progress realized $91.27 per bbl (2010 - $74.09 per bbl) for crude oil and $67.18 per bbl (2010 - $54.62 per bbl) for natural gas liquids. Oil prices fell sharply in the Quarter, losing almost 12 percent in the period after reaching a three year high of $113.93 per bbl in late April. The length and effects of the military campaign in Libya remained unclear, generating volatility and sustaining the geopolitical risk premium in the oil price that had grown throughout the first quarter of 2011. Bearish sentiment crept into the market in early May, as oil fell sharply (approximately 17 percent in five days) in the broader commodity selloff. Fears about further supply disruption in the Mid-East abated and concerns around demand increased, with the International Energy Agency (“IEA”) lowering its forecast for global demand and US reporting sluggish domestic demand. Prices traded in the $97-$102 per bbl range for the next month, and despite the precipitous drop, prices remained approximately 25 percent higher than 2010. Greek debt concerns began to weigh on oil prices as Greece and the European Union (“EU”) struggled to agree on revised bailout terms and worries about contagion in the Eurozone (which consumes 20 percent of the world’s oil) were bearish signals for demand. In terms of supply, OPEC failed to agree on increasing its output, but Saudi Arabia signalled it would boost production to meet any perceived supply shortfalls. The IEA also announced that its member states would release 60 million bbls of strategic reserves into the market, the first such release since Hurricane Katrina in 2005. The hefty risk premium that was added to the price of oil in the wake of the Arab Spring has been significantly reduced, with prices ending the Quarter 11 percent ahead of pre-crisis, after trading as much as 25 to 35 percent higher during most of the Quarter. Supply concerns have eased and recent price movements have focused on economic growth and the associated demand from the major consumers, China, the US and the EU.
Commodity Prices
Three Months Ended June 30
Six Months Ended June 30
2011 2010 2011 2010 Change Average Benchmark Prices Natural gas – AECO (daily) ($/gj) 3.67 3.69 3.62 4.19 (14%) Natural gas – AECO (monthly) ($/gj) 3.54 3.66 3.56 4.37 (19%) Natural gas – Station #2 (daily) ($/gj) 3.40 3.47 3.33 4.00 (17%) Crude oil – WTI (US$/bbl) 102.56 78.03 98.33 78.37 25% Crude oil – Edmonton par price (Cdn$/bbl) 103.28 75.21 95.52 77.66 23% Exchange rate (Cdn$/US$) 0.9676 1.2076 0.9768 1.0342 (6%)
Average Realized Prices Natural gas ($/mcf) 3.91 4.03 3.88 4.57 (15%) Crude oil ($/bbl) 99.21 72.97 91.27 74.09 23% Natural gas liquids ($/bbl) 66.57 56.40 67.18 54.62 23% Sulphur – net ($/ton) 104.26 39.98 101.06 22.18 356%
Progress Energy Resources Corp.
10
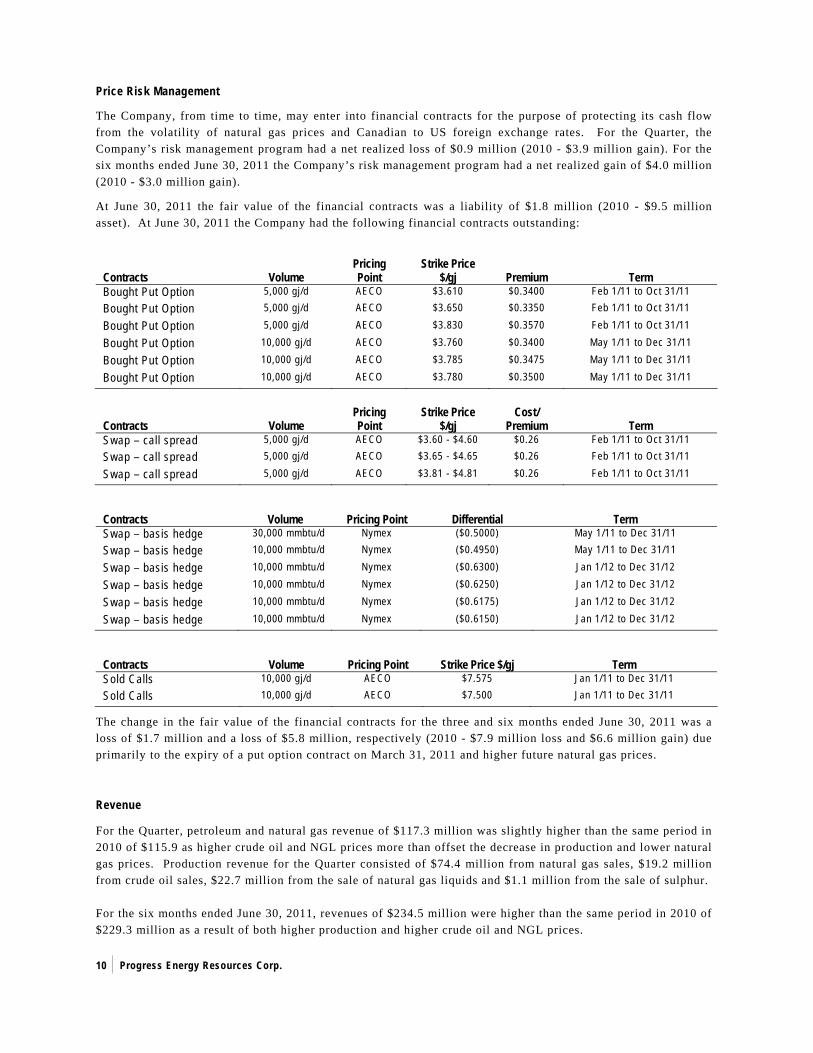
Price Risk Management
The Company, from time to time, may enter into financial contracts for the purpose of protecting its cash flow from the volatility of natural gas prices and Canadian to US foreign exchange rates. For the Quarter, the Company’s risk management program had a net realized loss of $0.9 million (2010 - $3.9 million gain). For the six months ended June 30, 2011 the Company’s risk management program had a net realized gain of $4.0 million (2010 - $3.0 million gain).
At June 30, 2011 the fair value of the financial contracts was a liability of $1.8 million (2010 - $9.5 million asset). At June 30, 2011 the Company had the following financial contracts outstanding:
Contracts Volume Pricing Point
Strike Price $/gj Premium Term
Bought Put Option 5,000 gj/d AECO $3.610 $0.3400 Feb 1/11 to Oct 31/11 Bought Put Option 5,000 gj/d AECO $3.650 $0.3350 Feb 1/11 to Oct 31/11 Bought Put Option 5,000 gj/d AECO $3.830 $0.3570 Feb 1/11 to Oct 31/11
Bought Put Option 10,000 gj/d AECO $3.760 $0.3400 May 1/11 to Dec 31/11
Bought Put Option 10,000 gj/d AECO $3.785 $0.3475 May 1/11 to Dec 31/11
Bought Put Option 10,000 gj/d AECO $3.780 $0.3500 May 1/11 to Dec 31/11
Contracts Volume Pricing Point
Strike Price $/gj
Cost/ Premium Term
Swap – call spread 5,000 gj/d AECO $3.60 - $4.60 $0.26 Feb 1/11 to Oct 31/11 Swap – call spread 5,000 gj/d AECO $3.65 - $4.65 $0.26 Feb 1/11 to Oct 31/11 Swap – call spread 5,000 gj/d AECO $3.81 - $4.81 $0.26 Feb 1/11 to Oct 31/11
Contracts Volume Pricing Point Differential Term Swap – basis hedge 30,000 mmbtu/d Nymex ($0.5000) May 1/11 to Dec 31/11 Swap – basis hedge 10,000 mmbtu/d Nymex ($0.4950) May 1/11 to Dec 31/11
Swap – basis hedge 10,000 mmbtu/d Nymex ($0.6300) Jan 1/12 to Dec 31/12
Swap – basis hedge 10,000 mmbtu/d Nymex ($0.6250) Jan 1/12 to Dec 31/12 Swap – basis hedge 10,000 mmbtu/d Nymex ($0.6175) Jan 1/12 to Dec 31/12 Swap – basis hedge 10,000 mmbtu/d Nymex ($0.6150) Jan 1/12 to Dec 31/12
Contracts Volume Pricing Point Strike Price $/gj Term Sold Calls 10,000 gj/d AECO $7.575 Jan 1/11 to Dec 31/11 Sold Calls 10,000 gj/d AECO $7.500 Jan 1/11 to Dec 31/11
The change in the fair value of the financial contracts for the three and six months ended June 30, 2011 was a loss of $1.7 million and a loss of $5.8 million, respectively (2010 - $7.9 million loss and $6.6 million gain) due primarily to the expiry of a put option contract on March 31, 2011 and higher future natural gas prices.
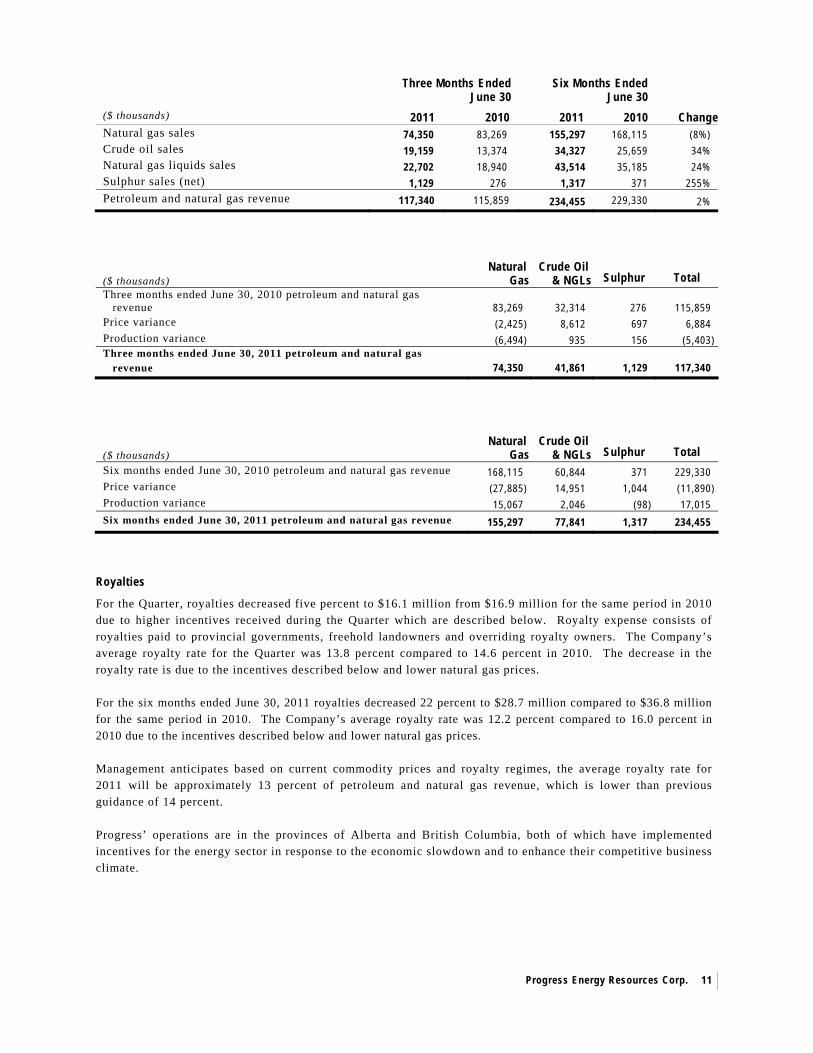
Revenue
For the Quarter, petroleum and natural gas revenue of $117.3 million was slightly higher than the same period in 2010 of $115.9 as higher crude oil and NGL prices more than offset the decrease in production and lower natural gas prices. Production revenue for the Quarter consisted of $74.4 million from natural gas sales, $19.2 million from crude oil sales, $22.7 million from the sale of natural gas liquids and $1.1 million from the sale of sulphur. For the six months ended June 30, 2011, revenues of $234.5 million were higher than the same period in 2010 of $229.3 million as a result of both higher production and higher crude oil and NGL prices.
Progress Energy Resources Corp.
11
Three Months Ended June 30
Six Months Ended June 30
($ thousands) 2011 2010 2011 2010 ChangeNatural gas sales 74,350 83,269 155,297 168,115 (8%) Crude oil sales 19,159 13,374 34,327 25,659 34% Natural gas liquids sales 22,702 18,940 43,514 35,185 24% Sulphur sales (net) 1,129 276 1,317 371 255% Petroleum and natural gas revenue 117,340 115,859 234,455 229,330 2%
($ thousands)
Natural
Gas Crude Oil
& NGLs Sulphur
Total Three months ended June 30, 2010 petroleum and natural gas revenue 83,269 32,314 276 115,859 Price variance (2,425) 8,612 697 6,884 Production variance (6,494) 935 156 (5,403) Three months ended June 30, 2011 petroleum and natural gas revenue 74,350 41,861 1,129 117,340
($ thousands)
Natural
Gas Crude Oil
& NGLs Sulphur
Total Six months ended June 30, 2010 petroleum and natural gas revenue 168,115 60,844 371 229,330 Price variance (27,885) 14,951 1,044 (11,890) Production variance 15,067 2,046 (98) 17,015 Six months ended June 30, 2011 petroleum and natural gas revenue 155,297 77,841 1,317 234,455
Royalties
For the Quarter, royalties decreased five percent to $16.1 million from $16.9 million for the same period in 2010 due to higher incentives received during the Quarter which are described below. Royalty expense consists of royalties paid to provincial governments, freehold landowners and overriding royalty owners. The Company’s average royalty rate for the Quarter was 13.8 percent compared to 14.6 percent in 2010. The decrease in the royalty rate is due to the incentives described below and lower natural gas prices. For the six months ended June 30, 2011 royalties decreased 22 percent to $28.7 million compared to $36.8 million for the same period in 2010. The Company’s average royalty rate was 12.2 percent compared to 16.0 percent in 2010 due to the incentives described below and lower natural gas prices. Management anticipates based on current commodity prices and royalty regimes, the average royalty rate for 2011 will be approximately 13 percent of petroleum and natural gas revenue, which is lower than previous guidance of 14 percent. Progress’ operations are in the provinces of Alberta and British Columbia, both of which have implemented incentives for the energy sector in response to the economic slowdown and to enhance their competitive business climate.
Progress Energy Resources Corp.
12
Alberta Royalties In regards to Progress’ operations, the current major incentives in Alberta are:
Five percent royalty rate on first year of production The Alberta government has implemented a five percent royalty rate on the first year of production on new natural gas and conventional oil wells up to a maximum 500,000 mcf of natural gas or 50,000 bbls of crude oil. This results in a lower royalty expense for Progress on its new wells. Deep drilling credit The Alberta government revised its deep drilling credit to wells deeper than 2,000 metres, compared to 2,500 metres previously. The deep drilling credit is $625 per metre on wells below 2,000 metres to 3,500 metres. A typical Progress Deep Basin well would qualify for approximately $0.2 million of deep drilling credits. The credit is collected through a reduction to the royalties paid on that well but cannot reduce the royalty rate below five percent. This credit is treated as a reduction to royalty expense. Drilling royalty credit A drilling royalty credit was implemented for new natural gas or conventional oil wells of up to $200 per metre drilled on crown land for wells spud on or after April 1, 2009 to March 31, 2011. As at June 30, 2011 approximately $22.7 million in Alberta drilling credits have been earned and recognized as a reduction to capital spending under this program. Other recent changes to the Alberta royalty regime include that the maximum royalty rate for natural gas at higher price levels will be 36 percent as opposed to 50 percent that was established previously.
British Columbia Royalties In regards to Progress’ operations, the current major incentives in British Columbia are:
Two percent royalty on first year of production The two percent royalty relief program is a one year, two percent royalty rate for all natural gas wells drilled in a 10 month window, spud on or after September 1, 2009 to June 30, 2010. The two percent royalty will apply to the first 12 months of production and production must commence before December 31, 2010. This results in a lower royalty expense for Progress on its new wells. Deep royalty credit program The current formula based deep royalty credit program includes horizontal wells drilled between 1,900 and 2,300 metres. The program has no expiration date. To date Progress has earned an average of $2.1 million per well of deep royalty credits on each of its Montney horizontal wells. As at June 30, 2011 approximately $7.7 million in deep royalty credits were offset against 2011 royalty expense ($3.4 million for the year ended 2010) with $51.6 million remaining to be recognized as a future reduction to royalty expense. The two percent royalty relief program and the deep royalty credit program will co-exist but a company will only benefit from one program at a time. The deep royalty credit will apply first. If it is exhausted before the first 12 months of production, the two percent royalty will be in effect for the remainder of the first 12 months. If the deep royalty credit is not exhausted before the first 12 months, the two percent royalty program will not apply. The deep royalty credit is treated as a reduction to royalty expense.
Progress Energy Resources Corp.
13
Operating Expenses
Operating expenses during the Quarter decreased 17 percent to $21.3 million from $25.5 million for the same period in 2010. On a boe basis, operating expenses for the Quarter decreased 11 percent to $5.75 from $6.45 in the same period in 2010 primarily as a result of efficiencies realized, drilling operations being focused in low operating cost areas and the sale of high operating expense assets in 2010 and 2011. For the six months ended June 30, 2011 operating expenses decreased five percent to $42.8 million compared to $44.8 million for the same period in 2010. On a boe basis, year-to-date operating expenses decreased 12 percent to $5.56 compared to $6.30 for the same period in 2010 as a result of efficiencies realized, growth in low operating cost areas and dispositions of high operating expense assets. Management anticipates operating expenses for 2011 to average between $5.50 to $5.75 per boe, which is lower than the previous guidance of between $5.75 to $6.00 per boe.
Transportation Expenses
Transportation expenses for the Quarter of $12.6 million were slightly lower than the same period in 2010 of $12.8 million due to lower production as a result of the McMahon turnaround during the Quarter. For the six months ended June 30, 2011 transportation expenses increased 12 percent to $25.1 million compared to $22.4 million for the same period in 2010 due to higher production. On a boe basis, transportation expenses for the Quarter of $3.41 were five percent higher than the same period in 2010 of $3.24 and for the six months ended June 30, 2011 transportation expenses of $3.26 were three percent higher than the same period in 2010 of $3.15. The slight increase is due to a higher proportion of the Company’s production coming from British Columbia where the Company pays an all-in charge for regulated gathering, processing and transmission fees on much of its production thereby avoiding facility construction. This all-in charge is included in transportation expenses. Management anticipates transportation expenses for 2011 to average $3.25 to $3.40 per boe which is consistent with guidance.
Progress Energy Resources Corp.
14
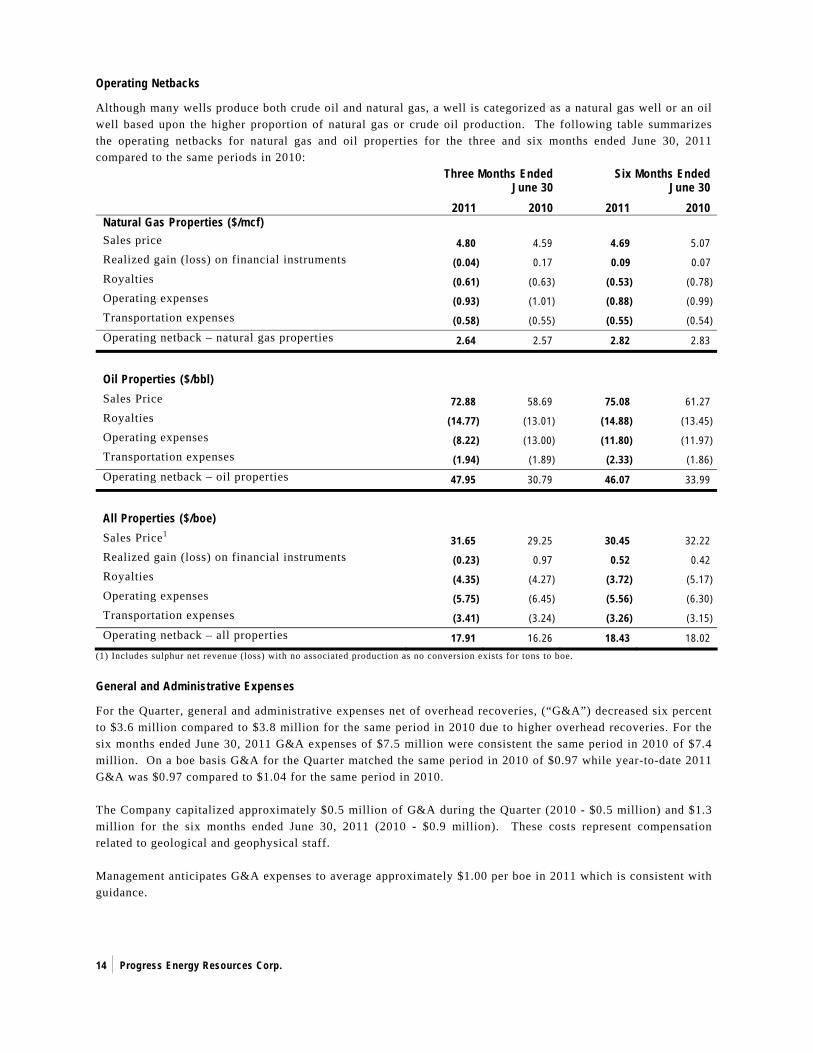
Operating Netbacks
Although many wells produce both crude oil and natural gas, a well is categorized as a natural gas well or an oil well based upon the higher proportion of natural gas or crude oil production. The following table summarizes the operating netbacks for natural gas and oil properties for the three and six months ended June 30, 2011 compared to the same periods in 2010:
Three Months Ended June 30
Six Months Ended June 30
2011 2010 2011 2010 Natural Gas Properties ($/mcf) Sales price 4.80 4.59 4.69 5.07 Realized gain (loss) on financial instruments (0.04) 0.17 0.09 0.07 Royalties (0.61) (0.63) (0.53) (0.78) Operating expenses (0.93) (1.01) (0.88) (0.99) Transportation expenses (0.58) (0.55) (0.55) (0.54) Operating netback – natural gas properties 2.64 2.57 2.82 2.83
Oil Properties ($/bbl) Sales Price 72.88 58.69 75.08 61.27 Royalties (14.77) (13.01) (14.88) (13.45) Operating expenses (8.22) (13.00) (11.80) (11.97) Transportation expenses (1.94) (1.89) (2.33) (1.86) Operating netback – oil properties 47.95 30.79 46.07 33.99
All Properties ($/boe) Sales Price1 31.65 29.25 30.45 32.22 Realized gain (loss) on financial instruments (0.23) 0.97 0.52 0.42 Royalties (4.35) (4.27) (3.72) (5.17) Operating expenses (5.75) (6.45) (5.56) (6.30) Transportation expenses (3.41) (3.24) (3.26) (3.15) Operating netback – all properties 17.91 16.26 18.43 18.02
(1) Includes sulphur net revenue (loss) with no associated production as no conversion exists for tons to boe.
General and Administrative Expenses
For the Quarter, general and administrative expenses net of overhead recoveries, (“G&A”) decreased six percent to $3.6 million compared to $3.8 million for the same period in 2010 due to higher overhead recoveries. For the six months ended June 30, 2011 G&A expenses of $7.5 million were consistent the same period in 2010 of $7.4 million. On a boe basis G&A for the Quarter matched the same period in 2010 of $0.97 while year-to-date 2011 G&A was $0.97 compared to $1.04 for the same period in 2010. The Company capitalized approximately $0.5 million of G&A during the Quarter (2010 - $0.5 million) and $1.3 million for the six months ended June 30, 2011 (2010 - $0.9 million). These costs represent compensation related to geological and geophysical staff. Management anticipates G&A expenses to average approximately $1.00 per boe in 2011 which is consistent with guidance.

Progress Energy Resources Corp.
15
Stock Based Compensation Expenses
Stock Options, Restricted Units and Performance Units The Company has a stock based compensation plan (the “Plan”) comprised of a Stock Option Plan, as well as a Share Unit Plan which includes both Restricted Unit Awards and Performance Unit Awards. Unless otherwise approved by the shareholders, the Company may grant up to a maximum of 1,700,000 common shares pursuant to the Share Unit Plan. The Restricted Unit Awards are whole share awards that entitle the holder to that number of shares at the end of the vesting period. Performance Unit Awards are similar to the Restricted Unit Awards however, a performance factor is applied to the grant on the vesting date. Both the Restricted Unit Awards and Performance Unit Awards vest at the end of a three year period and include accumulated dividends paid over the three year period, however for new employees, their initial grant will vest 20 percent on the first anniversary date, 30 percent on the second anniversary and 50 percent on the third anniversary. Under the Stock Option Plan, unless otherwise approved by the shareholders, the Company may grant up to a maximum of 10,000,000 stock options. The stock options granted under the Stock Option Plan prior to 2011 vest one third in each of the second, third and fourth year anniversary dates from the date of grant. Stock options granted in 2011 vest one third in each of the first, second and third year anniversary dates from the date of grant. The options expire in five years from the date of grant. On January 15, 2009 ProEx Energy Ltd. (“ProEx”) acquired Progress Energy Trust (the “Trust”) and changed its name to Progress Energy Resources Corp. (the “Arrangement”). As a result, grants that were outstanding from the Trust and ProEx, which include performance units and units granted under the Long Term Incentive Component (“LTI”) as well as stock options of ProEx, will continue until their original vesting dates. Long Term Incentive Component of the Trust Awards granted under the LTI component of the Trust’s compensation plan will vest over three years with 40 percent vesting on the second anniversary of the date of grant and 60 percent vesting on the third anniversary of the date of grant. An additional 15 percent grant will be paid if the holder holds the common shares they receive on the second anniversary date for one additional year.
Performance Units of the Trust The performance units granted by the Trust vest at the end of a three year performance period at which time they will be converted to common shares, or the cash equivalent, and include the accumulated distributions of the Trust and accumulated dividends of the Company over the three year period. For new employees, their initial grant will vest 20 percent on the first anniversary date, 30 percent on the second anniversary and 50 percent on the third anniversary. The actual number of common shares paid is dependent upon a performance factor that is determined based on the Company’s performance relative to its peers and ranges from 0.5 to 1.5 times the initial grant, except for performance units granted to the Trust’s executives effective July 2, 2008 which can range from 0 to 3 times. Payment may be in the form of cash or common shares, at the Company’s option. Management anticipates, at the end of the performance period, accumulated distributions and dividends will be paid in cash and common shares will be paid from treasury. Actual performance factors will not be determined until the end of the three year performance periods. For the Quarter, stock based compensation expenses of $2.0 million were 45 percent lower than the same period in 2010 of $3.7 million. On a boe basis, stock based compensation expense for the Quarter was $0.55 per boe compared to $0.94 per boe for the same period in 2010. The decrease was due to an adjustment during the Quarter to reduce the anticipated performance factor on the performance units granted in 2008 by the Trust from 1.5 times to 1.375 times. Alternatively, for the same period in 2010, an adjustment was made to increase the anticipated performance factors on the performance units granted in 2007 and 2008 by the Trust from 1.0 to 1.5 times. For the six months ended June 30, 2011 stock based compensation expenses decreased 24 percent to $4.9 million ($0.64 per boe) compared to $6.4 million ($0.91 per boe) for the same period in 2010 as a result of the performance factor adjustments.
Progress Energy Resources Corp.
16
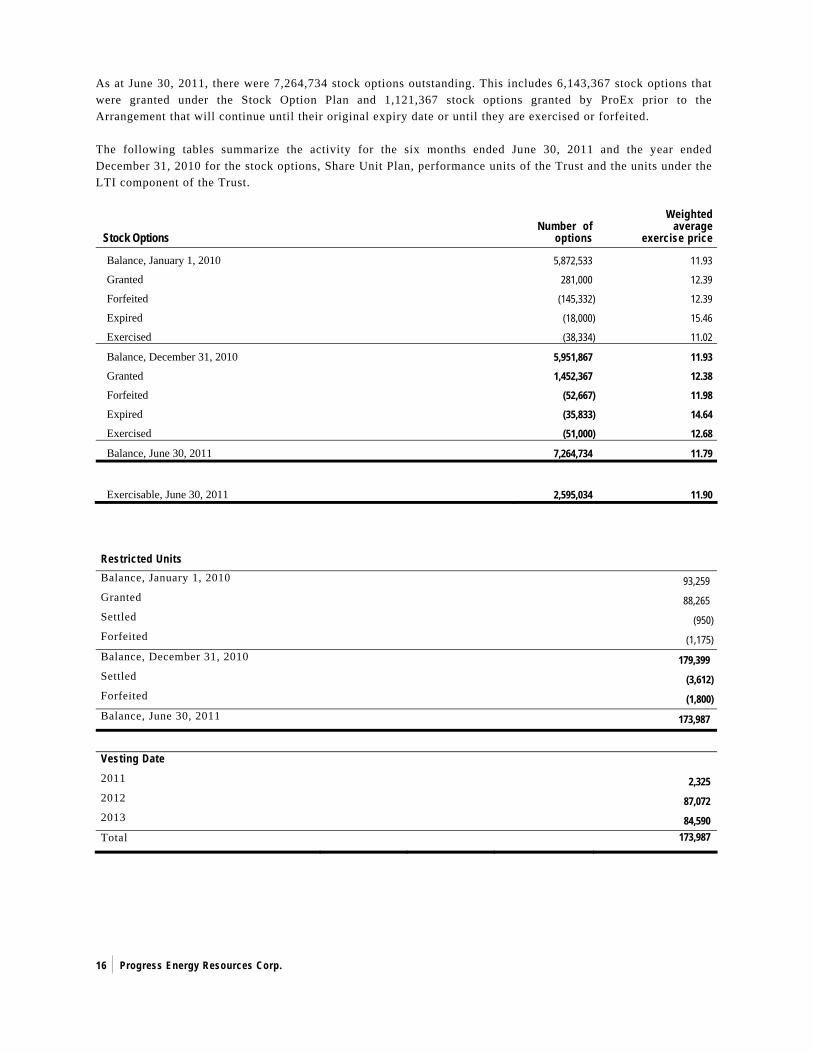
As at June 30, 2011, there were 7,264,734 stock options outstanding. This includes 6,143,367 stock options that were granted under the Stock Option Plan and 1,121,367 stock options granted by ProEx prior to the Arrangement that will continue until their original expiry date or until they are exercised or forfeited.
The following tables summarize the activity for the six months ended June 30, 2011 and the year ended December 31, 2010 for the stock options, Share Unit Plan, performance units of the Trust and the units under the LTI component of the Trust.
Stock Options Number of
options
Weighted average
exercise price
Balance, January 1, 2010 5,872,533 11.93
Granted 281,000 12.39
Forfeited (145,332) 12.39
Expired (18,000) 15.46
Exercised (38,334) 11.02
Balance, December 31, 2010 5,951,867 11.93 Granted 1,452,367 12.38
Forfeited (52,667) 11.98
Expired (35,833) 14.64
Exercised (51,000) 12.68
Balance, June 30, 2011 7,264,734 11.79
Exercisable, June 30, 2011 2,595,034 11.90 Restricted Units Balance, January 1, 2010 93,259 Granted 88,265 Settled (950) Forfeited (1,175) Balance, December 31, 2010 179,399 Settled (3,612) Forfeited (1,800) Balance, June 30, 2011 173,987
Vesting Date 2011 2,325 2012 87,072 2013 84,590 Total 173,987
Progress Energy Resources Corp.
17
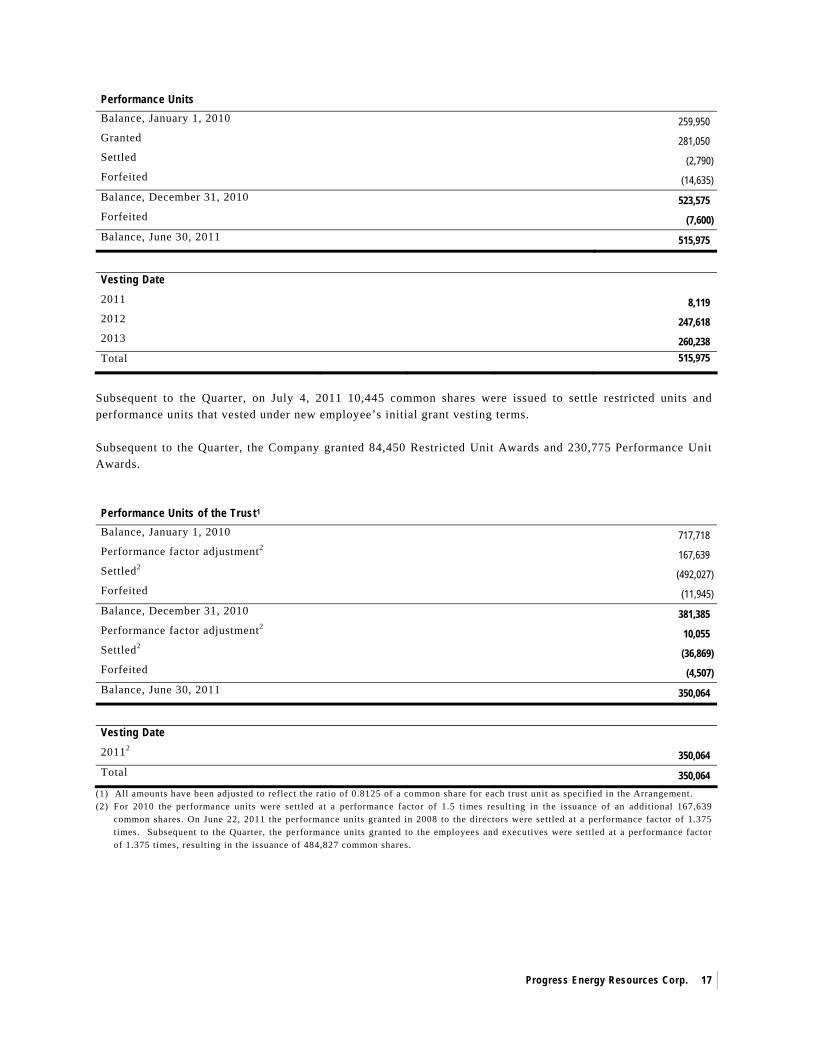
Performance Units Balance, January 1, 2010 259,950 Granted 281,050 Settled (2,790) Forfeited (14,635) Balance, December 31, 2010 523,575 Forfeited (7,600) Balance, June 30, 2011 515,975
Vesting Date 2011 8,119 2012 247,618 2013 260,238 Total 515,975
Subsequent to the Quarter, on July 4, 2011 10,445 common shares were issued to settle restricted units and performance units that vested under new employee’s initial grant vesting terms. Subsequent to the Quarter, the Company granted 84,450 Restricted Unit Awards and 230,775 Performance Unit Awards. Performance Units of the Trust1 Balance, January 1, 2010 717,718 Performance factor adjustment2 167,639 Settled2 (492,027) Forfeited (11,945) Balance, December 31, 2010 381,385 Performance factor adjustment2 10,055 Settled2 (36,869) Forfeited (4,507) Balance, June 30, 2011 350,064
Vesting Date 20112 350,064 Total 350,064
(1) All amounts have been adjusted to reflect the ratio of 0.8125 of a common share for each trust unit as specified in the Arrangement. (2) For 2010 the performance units were settled at a performance factor of 1.5 times resulting in the issuance of an additional 167,639
common shares. On June 22, 2011 the performance units granted in 2008 to the directors were settled at a performance factor of 1.375 times. Subsequent to the Quarter, the performance units granted to the employees and executives were settled at a performance factor of 1.375 times, resulting in the issuance of 484,827 common shares.

Progress Energy Resources Corp.
18
Units under LTI Component1 Balance, January 1, 2010 100,956 Additional grant2 18,189 Settled (104,348) Forfeited (1,837) Balance, December 31, 2010 12,960 Additional grant2 1,643 Settled (8,209) Forfeited (1,000) Balance, June 30, 2011 5,394
Vesting Date 2011 5,394
Total2 5,394
(1) All amounts have been adjusted to reflect the ratio of 0.8125 of a common share for each trust unit as specified in the Arrangement. (2) An additional 15 percent grant will be paid to LTI holders if a holder holds the shares they receive on the second anniversary date for one additional year. This would result in an additional 1,349 common shares being issued by the Company.
Interest and Finance Expense
Interest and finance expense is comprised of the following: Three Months Ended
June 30 Six Months Ended
June 30 ($ thousands) 2011 2010 2011 2010 Interest on bank debt 1,125 3,035 4,286 7,898 Interest on Debentures 6,647 4,727 11,148 9,395 Total interest and financing expense 7,772 7,762 15,434 17,293 Interest and finance expense ($/boe) 2.10 1.96 2.00 2.43
Interest and finance expense during the Quarter was consistent with the same period in 2010 of $7.8 million while year-to-date interest and financing expense decreased 11 percent to $15.4 million compared to $17.3 million for the same period in 2010. For the Quarter, interest on bank debt decreased 63 percent to $1.1 million, which included $0.9 million of standby fees on the undrawn portion of the credit facility, compared to $3.0 million for the same period in 2010. The decrease was due to lower average bank debt during the Quarter. The lower average bank debt was the result of a financing completed on March 7, 2011 which included $200.0 million principal amount of 5.75 percent convertible unsecured subordinated debentures (the “5.75 percent debentures”) and the issuance of 14,400,000 common shares for gross proceeds of $200.2 million (refer to Liquidity and Capital Resources below). The net proceeds were initially used to repay outstanding bank debt thereby freeing up borrowing capacity to fund a portion of Progress’ expanded capital program (refer to Capital Expenditures below). For the Quarter, interest on Debentures increased 41 percent as a result of the issuance of the 5.75 percent debentures. The decrease in interest and financing expense for the year-to-date 2011 was a result of lower average bank debt, partially offset by an increase in interest on Debentures due to the issuance of the 5.75 percent debentures.
Progress Energy Resources Corp.
19
Depletion and Depreciation
As a result of the conversion to IFRS, Progress now depletes its property, plant and equipment based on its proved plus probable reserves as opposed to proved reserves that were used under the previous GAAP. Plant turnarounds and major overhauls are depreciated over four years. The carrying value of undeveloped land in exploration and evaluation assets that expires is charged to depletion and depreciation expense. For the Quarter, depletion and depreciation (“D&D”) expense decreased 13 percent to $52.0 million compared to $59.6 million for the same period in 2010. The decrease was due to lower production in the Quarter as a result of the McMahon turnaround and the impact of an impairment charge of $119.9 million recognized in the fourth quarter of 2010 due to the impact of decreasing natural gas prices on the fair value of certain cash generating units (“CGUs”) of the Company. For the six months ended June 30, 2011 D&D expense decreased 14 percent to $110.3 million compared to $128.7 million for the same period in 2010. In the first quarter of 2010, D&D expense included an impairment charge of $19.7 million. On a boe basis, D&D expense for the Quarter was $14.03 compared to $15.05 for the same period in 2010 and for the six months ended June 30, 2011 was $14.33 compared to $18.09 for the same period in 2010. Taxes
The provision for deferred income taxes for the Quarter was a recovery of $2.7 million compared to a recovery of $6.9 million in same period in 2010. The lower recovery for the Quarter was the result of a lower pretax loss as compared to the same period in 2010. For the six months ended June 30, 2011 the provision for deferred income taxes was a recovery of $1.9 million compared to a recovery of $9.2 million for the same period in 2010 due to a lower pre-tax loss, primarily due to the first quarter of 2010 including an impairment charge of $19.7 million as a result of the impact of decreasing natural gas prices on the fair value of certain CGU’s. Estimated total tax pool balances as at June 30, 2011 is approximately $2.3 billion. Net Loss and Comprehensive Loss
The net loss and comprehensive loss for the Quarter of $11.4 million was lower than the net loss of $22.8 million for the same period in 2010. The lower net loss for the Quarter was primarily due to the second quarter of 2010 incurring a higher unrealized loss of financial instruments, higher depletion expense and a higher loss on divestitures than for the Quarter. The basic and diluted net loss for the Quarter was $0.05 per share and for the same period in 2010 the basic and diluted net loss was $0.11 per share.
The net loss and comprehensive loss for the six months ended June 30, 2011 decreased 85 percent to $9.8 million compared to a net loss and comprehensive loss of $67.5 million for the same period in 2010. The decrease was primarily due to 2010 incurring a $19.7 million impairment charge to D&D expense due to the impact of decreasing natural gas prices on the fair value of certain CGUs as well as an impairment charge of $34.2 million related to a decrease in the fair value of goodwill. The basic and diluted net loss for the year-to-date 2011 was $0.04 per share and for the same period in 2010 the basic and diluted net loss was $0.36 per share.
Dividends
Since January 15, 2009, Progress has declared quarterly cash dividends of $0.10 per common share, including the Quarter. The total amount of dividends for the Quarter is approximately $23.1 million (2010 - $21.3 million), excluding dividends accrued for certain share based compensation grants. Progress has a dividend reinvestment plan (“DRIP”) whereby common shareholders can elect to receive their dividend in shares. The number of shares issued is based on 95 percent of the average market price being the weighted average trading prices of the shares for the five consecutive trading days before the dividend payment date. On July 15, 2011 the Company issued 611,436 common shares in payment of $7.9 million of dividends for shareholders that elected to participate in the DRIP. Progress intends to pay quarterly dividends, however these dividends are not guaranteed.

Progress Energy Resources Corp.
20
Subsequent to the Quarter the Board of Directors declared that the 2011 third quarter dividend will be maintained at $0.10 per share. The dividend will be payable on October 17, 2011 to common shareholders of record as of September 30, 2011.
Quarterly Financial Summary ¹ Three Months Ended ($ thousands, except per share amounts)
June 30 2011
Mar 31 2011
Dec 31 2010
Sept 30 2010
June 30 2010
Mar 31 2010
Dec 31 2009
Sept 30 2009
Petroleum and natural gas revenue2 117,340 117,115 107,957 105,305 115,859 113,471 86,145 64,421 Net earnings (loss)2 (11,436) 1,626 (104,184) (7,644) (22,832) (44,708) (20,075) (26,877) Per share basic (0.05) 0.01 (0.49) (0.04) (0.11) (0.27) (0.12) (0.16) Per share diluted (0.05) 0.01 (0.49) (0.04) (0.11) (0.27) (0.12) (0.16)
(1) The 2010 and 2011 quarterly results have been adjusted to conform to IFRS. The quarterly results for 2009 have not been adjusted and reflect the results in accordance with the previous GAAP.
(2) Throughout 2009, lower commodity prices due to the global economic slowdown resulted in a net loss for each quarter in 2009. Petroleum and natural gas revenue for the first quarter of 2010 increased over the fourth quarter of 2009 due to higher production and higher crude oil and NGL prices. The higher net loss for the first quarter of 2010 was the result of a $19.7 million charge relating to the impairment of property, plant and equipment and a $34.2 million impairment to goodwill, both due to the impact of decreasing natural gas prices. Petroleum and natural gas revenue for the second quarter of 2010 increased slightly from the first quarter of 2010 due to higher production as a result of the Foothills Acquisition, however this was largely offset by lower commodity prices. The net loss for the second quarter of 2010 was due to higher D&D expense due to the Foothills Acquisition, a $9.6 million loss on the sale of its Central Alberta properties and an unrealized loss on financial instruments of $7.9 million. For the third quarter of 2010, petroleum and natural gas revenue decreased from the second quarter of 2010 as a result of lower commodity prices through the summer season. The net loss was lower than the previous quarter due to an unrealized gain on financial instruments of $1.1 million compared to a loss of $7.9 million in the previous quarter. Revenues for the fourth quarter of 2010 were slightly higher than the third quarter due to higher crude oil and NGL prices. The higher net loss was due to an impairment charge to property, plant and equipment of $119.9 million as a result of decreasing future natural gas prices. Revenues for the first quarter of 2011 were higher than the fourth quarter of 2010 due to both higher production and slightly higher natural gas prices. Net earnings were higher primarily due to the $119.9 million impairment charge recognized in the fourth quarter of 2010. During the Quarter, production was seven percent lower than the first quarter of 2011 due to a planned 15 day turnaround at the Spectra McMahon gas processing facility, however, higher crude oil prices and slightly higher natural gas prices, resulted in slightly higher revenues for the Quarter. The higher net loss for the Quarter as compared to the previous quarter was primarily due to a $6.6 million loss on divestitures for the Quarter, while the previous quarter had a $5.2 million net gain on divestitures.

Progress Energy Resources Corp.
21
Capital Expenditures During the Quarter, the Company invested $46.0 million in total capital expenditures, which includes capital expenditures on exploration and evaluation assets and property, plant and equipment, compared to $38.3 million in the same period in 2010. For the six months ended June 30, 2011, the Company invested $186.4 million compared to $159.0 million for the same period in 2010.
Three Months EndedJune 30
Six Months EndedJune 30
($ thousands) 2011 2010 2011 2010 Land acquisitions and retention 7,014 11,374 8,829 18,830 Geological and geophysical 1,396 1,422 7,472 7,253 Drilling and completions 22,309 15,094 128,403 105,054 Equipping and facilities 13,600 10,255 39,757 31,681 Turnarounds and overhauls 1,405 - 1,405 - Corporate assets 110 91 159 224 Exploration and development capital 45,834 38,236 186,025 163,042 Net property acquisitions (dispositions) 203 25 352 (4,008)
Total capital expenditures 46,037 38,261 186,377 159,034 Foothills Acquisition - (616) - 387,087 Central Alberta Disposition - (44,473) - (44,473) Property Dispositions (18,316) - (35,344) - Total investing activities (before changes in non-
cash working capital) 27,721 (6,828) 151,033 501,648 During the Quarter, the Company drilled 3 gross wells (1.8 net) in the Foothills region. For the six months ended June 30, 2011, the Company drilled 27 gross wells (24.5 net), including 16 gross wells (14.2 net) in the Foothills region and 11 gross wells (10.3 net) in the Deep Basin region. The drilling in the Foothills region included 11 horizontal and two vertical Montney wells drilled in four of the Company’s six Montney development pods at Town South, Town North, Kobes and Gundy. At the Town South pod development (100 percent working interest), Progress drilled one horizontal well targeting the middle Montney in the Quarter. Town South is Progress’ most developed pod to date, with 16 horizontal wells drilled since the third quarter of 2010. At the Kobes pod development (30 percent working interest), one partner operated horizontal well was drilled in the Quarter and will be completed in the third quarter. The well was drilled in the southern area of the Kobes development, which is partner operated, while Progress operates the northern portion. The Kobes pod has proven to have among the strongest initial production rates in the entire Montney fairway. At the Nig exploration block (50 percent working interest), over 25 kilometers east of Town, a partner-operated Montney well was drilled in the Quarter. The well flowed up tubing at 4.2 mmcf per day and is currently shut-in for pressure build-up. Liquids production is expected to be 25 bbls per mmcf. Progress has drilled and completed three horizontal, 100 percent working interest Dunvegan oil wells in the Deep Basin since the fourth quarter of 2010. The first well, a 2,750 meter test, produced an average of 250 boe per day of 40° API light oil over a 30 day test period and is still producing over 100 boe per day with no water after seven months of operation. Progress’ second well expanded the play 39 kilometers to the northwest from the original test. This well, post frac, produced an average of 355 boe per day over a 30 day test period and continues to produce over 300 boe per day after three months of production. The Company’s third test was recently placed on production and is expected to average 300 boe per day for the first month of production.
Progress Energy Resources Corp.
22
Assuming four wells per section, Progress has identified more than fifty Dunvegan horizontal follow-up locations on its acreage position where the Company has deeper natural gas production. In addition, the Company is evaluating another 20 net perspective sections of land within the Deep Basin. The Dunvegan formation is a pervasive package of stacked marine and fluvial Cretaceous sands ranging in thickness from one meter units to over 25 meters of reservoir. Detailed in-house geologic mapping has illustrated several productive fairways across the Company’s lands where it has previously drilled deeper gas tests. A further three wells, at an all-in cost of $4 million per well, are planned to be drilled in 2011 with the potential to accelerate the program in 2012. On February 14, 2011, Progress announced that it was expanding its 2011 capital program from $250 million to $350 million. Under the expanded program the Company intends to accelerate the number of Montney wells to be drilled in 2011 to approximately 30 to 35 horizontal wells. In connection with the expansion of the capital program the Company completed a financing comprised of the issuance of 14,400,000 common shares at $13.90 per share for gross proceeds of $200.2 million ($193.1 million net of issue costs), as well as $200 million principal amount of 5.75 percent convertible unsecured subordinated debentures (see “Liquidity and Capital Resources” section below). On March 31, 2011, Progress sold its Two Creek, Alberta properties for approximately $12.7 million, as well as certain royalty interests in the Copton, Alberta area for $4.2 million. In April 2011, the Company sold its Fort St. John Plains North properties for approximately $12.7 million, as well as certain properties in the Copton, Alberta area for approximately $4.8 million. On March 31, 2010, the Company completed the Foothills Acquisition for $389.2 million, including $2.1 million in transaction costs which were charged to other expenses in the statement of earnings. The net amount capitalized was $387.1 million. The Foothills Acquisition assets are immediately adjacent to the Company’s producing assets in the Town, Bubbles and Blueberry/Beg areas and represent a strategic fit with the Company’s existing northeast British Columbia Foothills properties. The assets included production of approximately 7,300 boe per day, 91 percent natural gas, and approximately 188,000 net acres of undeveloped land.
To finance the Foothills Acquisition and a portion of the Company’s 2010 capital investment program the Company issued 47,630,000 common shares at $12.60 per share for total gross proceeds of $600.1 million ($588.8 million net of issue costs of $11.3 million). The share issuance was comprised of a $350 million subscription receipt private placement with the Canada Pension Plan Investment Board (“CPPIB”) and a concurrent $250 million subscription receipt bought-deal financing through a syndicate of underwriters. Each subscription receipt represented the right to receive one common share of Progress, without the payment of any additional consideration, on the closing of the Foothills Acquisition which occurred on March 31, 2010. The private placement with CPPIB contains certain conditions in regards to their investment and ongoing relationship with Progress including:
• Lockup provision - requires CPPIB to not sell any shares for an 18 month period following the closing date and CPPIB shall elect to have the shares participate in the dividend reinvestment program.
• Governance - so long as CPPIB owns greater than 12.5 percent of the outstanding common shares they shall have the right to nominate one individual to be a director of Progress. If CPPIB owns greater than 10 percent of the outstanding common shares, Progress shall discuss with CPPIB any proposed transaction for which the Company will require equity financing before implementing such transaction.
• Registration rights – if CPPIB holds 10 percent or more of the outstanding common shares, they shall have the right to require Progress at CPPIB’s expense, to prepare, file and obtain receipt for a final prospectus offering for the sale of any portion of the common shares held by CPPIB.
• After 18 months from the closing of the private placement, CPPIB shall have the right to include common shares owned by CPPIB in a prospectus offering to the extent of 15 percent of
Progress Energy Resources Corp.
23
such offering. • Right to participate in future offerings – so long as CPPIB owns greater than 10 percent of the
outstanding common shares, CPPIB shall have the pre-emptive right to participate in future offerings up to CPPIB’s pro-rata ownership interest immediately prior to the offering.
CPPIB, having greater than 12.5 percent of the outstanding common shares, nominated R. Scott Lawrence, Vice President, Head of Relationship Investments of CPPIB to the Progress Board of Directors. The Progress Board of Directors, upon review of Mr. Lawrence’s qualifications by the Corporate Governance and Nominating Committee, appointed Mr. Lawrence to the Board on October 12, 2010. Goodwill For goodwill impairment tests under IFRS, goodwill that arises from a business combination is allocated to the specific CGUs that are expected to benefit from the business combination. The carrying value of the CGU including goodwill is compared to the fair value of the CGU and any excess of the carrying value over the fair value is considered an impairment. As the goodwill impairment is performed on a much smaller portion of the Company’s assets (i.e. at the CGU level), approximately $371.4 million of Progress’ goodwill was impaired on the transition to IFRS on January 1, 2010 and was charged to the deficit on the opening IFRS statement of financial position. As a result of continued decreases in natural gas prices and their impact on the value of the Company’s reserves for certain CGU’s, an additional goodwill impairment of $34.2 million was recognized at March 31, 2010. As at June 30, 2011 the goodwill balance of $9.0 million was the result of an acquisition that included the Company’s Town properties in the Foothills region of British Columbia. In accordance with IFRS, goodwill is not amortized but is subject to an annual impairment test. Goodwill may be tested for impairment between annual tests in certain situations. Liquidity and Capital Resources
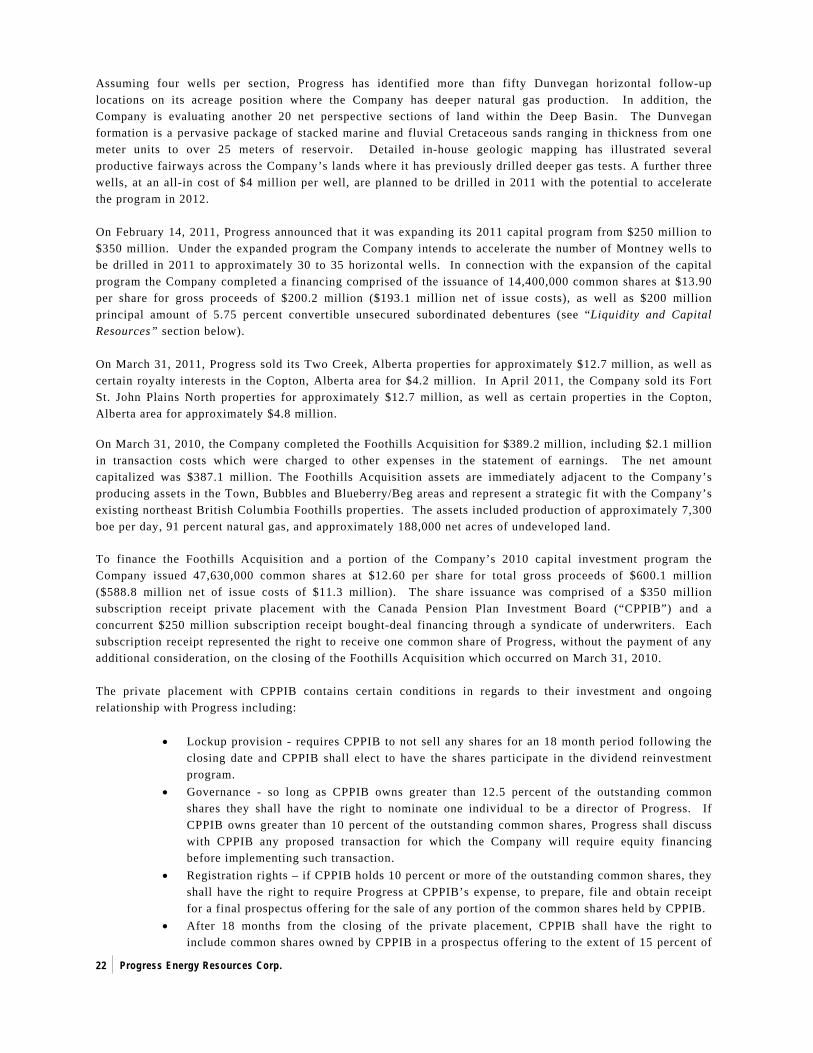
($ thousands, except per share amounts)
June 30 2011
December 31 2010
Working capital deficiency(1) 14,209 21,271 Bank debt - 312,508 Convertible debentures 424,761 249,313 Total debt 438,970 583,092 Shares outstanding (thousands) 230,529 214,877 Market price per share, end of period 13.73 12.70 Market value of shares 3,165,163 2,728,938
(1) Excludes the fair value of financial instruments.
At June 30, 2011 the Company was undrawn on its credit facility of $650.0 million as a result of the financing completed on March 7, 2011 as described below. Outstanding as at June 30, 2011 were $424.8 million for the debt portion of the Debentures and a working capital deficit of $14.2 million, resulting in $439.0 million of total debt. On April 29, 2011 the Company amended and restated its bank credit facility to be a covenant-based facility rather than a borrowing base facility. This facility is a 3-year extendible revolving facility in the amount of $650 million from a syndicate of lenders with an initial maturity date of April 29, 2014. The maturity date may, at the request of the Company and with the consent of the lenders, be extended on an annual basis. The facilities remain secured over substantially all of the assets of the Company and its material subsidiaries. The facilities bear interest at a rate based on bankers acceptance rates (or LIBOR, for US dollar borrowings) plus a specified margin, which margin varies based on the Company’s senior debt to EBITDA ratio (as calculated below). The facilities contain customary restrictions on the disposition of assets and the granting of security, as well as on the making of distributions (including the declaration of dividends) if there is then a default under the facilities
Progress Energy Resources Corp.
24
(or if a default would reasonably be expected to occur as a result of such distribution). The facilities also contain customary events of default, including on a change of control of the Company where lender consent was not obtained, which could occur if a person or persons acting jointly or in concert acquired more than 30 percent of the outstanding voting securities of the Company. Under the terms of the bank credit facilities, Progress has provided its covenant that, on a rolling 4-quarter basis: (i) its consolidated senior debt will not exceed three times its consolidated EBITDA, increasing to 3.5 times upon the consummation of a material acquisition and for a period extending to the end of the second full quarter after completion of that acquisition. Senior debt is defined to exclude subordinated debt and non-recourse debt from total debt. EBITDA is calculated as net earnings before unrealized gains and losses on financial instrument contracts, interest and financing expense, acquisition costs, taxes, depreciation, depletion and accretion and any other non-cash amounts which are added back or deducted from net income in accordance with IFRS in the statement of cash flows; (ii) its consolidated total debt (excluding, for certainty, any convertible debentures) will not exceed four times its consolidated EBITDA (similarly calculated), and (iii) its consolidated senior debt will not exceed one-half of its total capitalization (calculated as the aggregate of consolidated total debt, the principal amount of convertible debentures and consolidated shareholders’ equity), increasing to 55 percent upon the consummation of a material acquisition and for a period extending to the end of the second full quarter after completion of that acquisition.
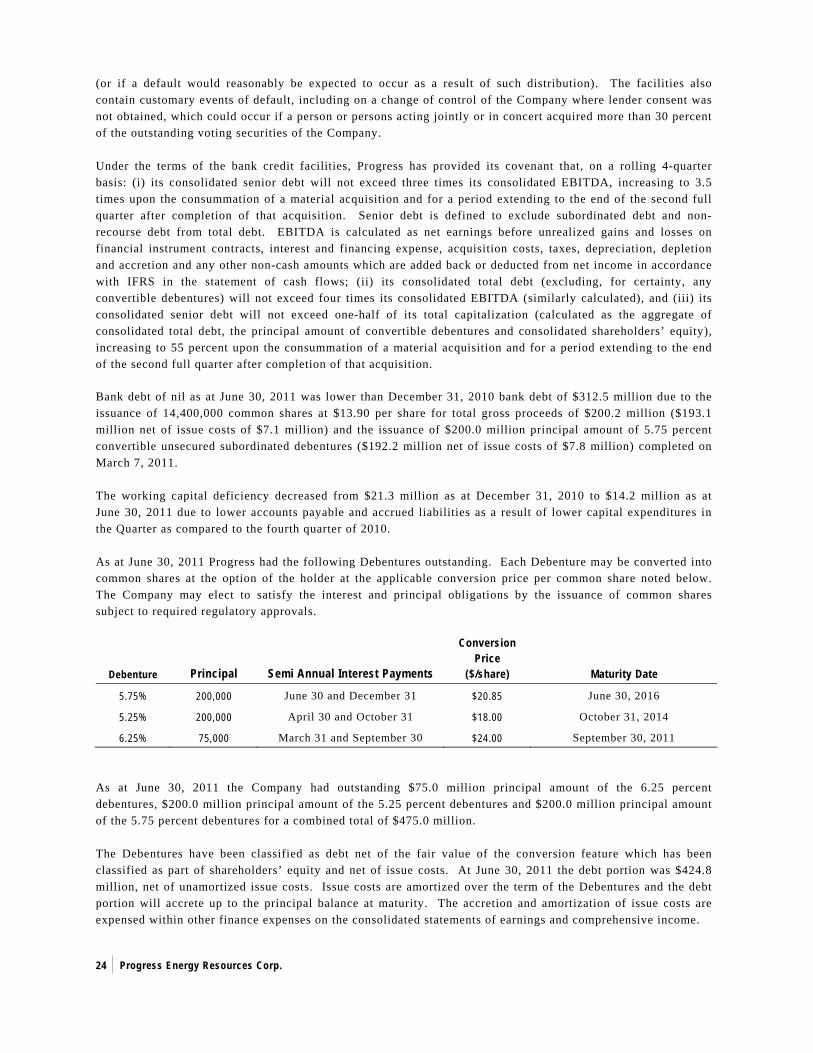
Bank debt of nil as at June 30, 2011 was lower than December 31, 2010 bank debt of $312.5 million due to the issuance of 14,400,000 common shares at $13.90 per share for total gross proceeds of $200.2 million ($193.1 million net of issue costs of $7.1 million) and the issuance of $200.0 million principal amount of 5.75 percent convertible unsecured subordinated debentures ($192.2 million net of issue costs of $7.8 million) completed on March 7, 2011. The working capital deficiency decreased from $21.3 million as at December 31, 2010 to $14.2 million as at June 30, 2011 due to lower accounts payable and accrued liabilities as a result of lower capital expenditures in the Quarter as compared to the fourth quarter of 2010. As at June 30, 2011 Progress had the following Debentures outstanding. Each Debenture may be converted into common shares at the option of the holder at the applicable conversion price per common share noted below. The Company may elect to satisfy the interest and principal obligations by the issuance of common shares subject to required regulatory approvals.
Debenture Principal Semi Annual Interest Payments
Conversion Price
($/share) Maturity Date
5.75% 200,000 June 30 and December 31 $20.85 June 30, 2016
5.25% 200,000 April 30 and October 31 $18.00 October 31, 2014
6.25% 75,000 March 31 and September 30 $24.00 September 30, 2011 As at June 30, 2011 the Company had outstanding $75.0 million principal amount of the 6.25 percent debentures, $200.0 million principal amount of the 5.25 percent debentures and $200.0 million principal amount of the 5.75 percent debentures for a combined total of $475.0 million. The Debentures have been classified as debt net of the fair value of the conversion feature which has been classified as part of shareholders’ equity and net of issue costs. At June 30, 2011 the debt portion was $424.8 million, net of unamortized issue costs. Issue costs are amortized over the term of the Debentures and the debt portion will accrete up to the principal balance at maturity. The accretion and amortization of issue costs are expensed within other finance expenses on the consolidated statements of earnings and comprehensive income.
Progress Energy Resources Corp.
25
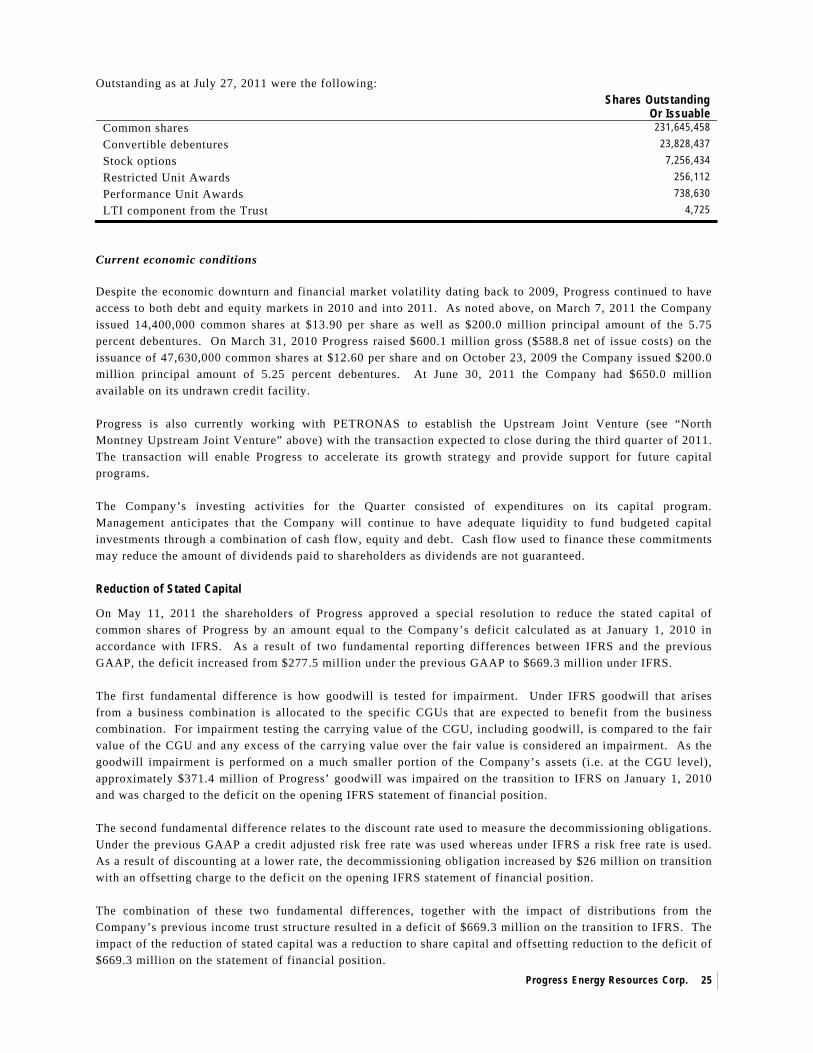
Outstanding as at July 27, 2011 were the following:
Shares Outstanding Or Issuable
Common shares 231,645,458 Convertible debentures 23,828,437 Stock options 7,256,434 Restricted Unit Awards 256,112 Performance Unit Awards 738,630 LTI component from the Trust 4,725
Current economic conditions Despite the economic downturn and financial market volatility dating back to 2009, Progress continued to have access to both debt and equity markets in 2010 and into 2011. As noted above, on March 7, 2011 the Company issued 14,400,000 common shares at $13.90 per share as well as $200.0 million principal amount of the 5.75 percent debentures. On March 31, 2010 Progress raised $600.1 million gross ($588.8 net of issue costs) on the issuance of 47,630,000 common shares at $12.60 per share and on October 23, 2009 the Company issued $200.0 million principal amount of 5.25 percent debentures. At June 30, 2011 the Company had $650.0 million available on its undrawn credit facility. Progress is also currently working with PETRONAS to establish the Upstream Joint Venture (see “North Montney Upstream Joint Venture” above) with the transaction expected to close during the third quarter of 2011. The transaction will enable Progress to accelerate its growth strategy and provide support for future capital programs. The Company’s investing activities for the Quarter consisted of expenditures on its capital program. Management anticipates that the Company will continue to have adequate liquidity to fund budgeted capital investments through a combination of cash flow, equity and debt. Cash flow used to finance these commitments may reduce the amount of dividends paid to shareholders as dividends are not guaranteed. Reduction of Stated Capital
On May 11, 2011 the shareholders of Progress approved a special resolution to reduce the stated capital of common shares of Progress by an amount equal to the Company’s deficit calculated as at January 1, 2010 in accordance with IFRS. As a result of two fundamental reporting differences between IFRS and the previous GAAP, the deficit increased from $277.5 million under the previous GAAP to $669.3 million under IFRS. The first fundamental difference is how goodwill is tested for impairment. Under IFRS goodwill that arises from a business combination is allocated to the specific CGUs that are expected to benefit from the business combination. For impairment testing the carrying value of the CGU, including goodwill, is compared to the fair value of the CGU and any excess of the carrying value over the fair value is considered an impairment. As the goodwill impairment is performed on a much smaller portion of the Company’s assets (i.e. at the CGU level), approximately $371.4 million of Progress’ goodwill was impaired on the transition to IFRS on January 1, 2010 and was charged to the deficit on the opening IFRS statement of financial position. The second fundamental difference relates to the discount rate used to measure the decommissioning obligations. Under the previous GAAP a credit adjusted risk free rate was used whereas under IFRS a risk free rate is used. As a result of discounting at a lower rate, the decommissioning obligation increased by $26 million on transition with an offsetting charge to the deficit on the opening IFRS statement of financial position. The combination of these two fundamental differences, together with the impact of distributions from the Company’s previous income trust structure resulted in a deficit of $669.3 million on the transition to IFRS. The impact of the reduction of stated capital was a reduction to share capital and offsetting reduction to the deficit of $669.3 million on the statement of financial position.
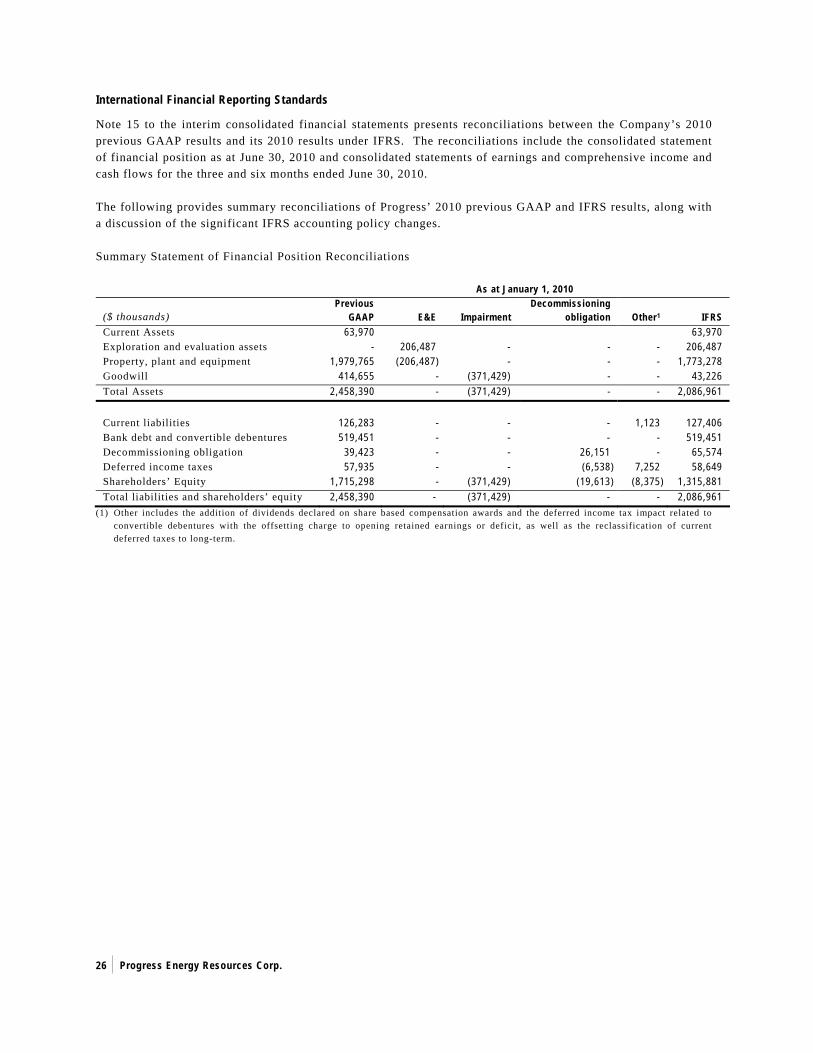
Progress Energy Resources Corp.
26
International Financial Reporting Standards
Note 15 to the interim consolidated financial statements presents reconciliations between the Company’s 2010 previous GAAP results and its 2010 results under IFRS. The reconciliations include the consolidated statement of financial position as at June 30, 2010 and consolidated statements of earnings and comprehensive income and cash flows for the three and six months ended June 30, 2010. The following provides summary reconciliations of Progress’ 2010 previous GAAP and IFRS results, along with a discussion of the significant IFRS accounting policy changes. Summary Statement of Financial Position Reconciliations
As at January 1, 2010
($ thousands) Previous
GAAP E&E Impairment Decommissioning
obligation Other1 IFRS Current Assets 63,970 63,970 Exploration and evaluation assets - 206,487 - - - 206,487 Property, plant and equipment 1,979,765 (206,487) - - - 1,773,278 Goodwill 414,655 - (371,429) - - 43,226 Total Assets 2,458,390 - (371,429) - - 2,086,961 Current liabilities 126,283 - - - 1,123 127,406 Bank debt and convertible debentures 519,451 - - - - 519,451 Decommissioning obligation 39,423 - - 26,151 - 65,574 Deferred income taxes 57,935 - - (6,538) 7,252 58,649 Shareholders’ Equity 1,715,298 - (371,429) (19,613) (8,375) 1,315,881 Total liabilities and shareholders’ equity 2,458,390 - (371,429) - - 2,086,961
(1) Other includes the addition of dividends declared on share based compensation awards and the deferred income tax impact related to convertible debentures with the offsetting charge to opening retained earnings or deficit, as well as the reclassification of current deferred taxes to long-term.

Progress Energy Resources Corp.
27
As at December 31, 2010
($ thousands) Previous
GAAP E&E Impairment Decommissioning
obligation Other1 IFRS Current Assets 85,406 - - - - 85,406 Exploration and evaluation assets - 307,132 - - - 307,132 Property, plant and equipment 2,432,398 (323,507) (139,624) 26,337 37,758 2,033,362 Goodwill 414,655 - (405,655) - - 9,000 Total Assets 2,932,459 (16,375) (545,279) 26,337 37,758 2,434,900 Current liabilities 176,461 - - - 55 176,516 Bank debt and convertible debentures 488,054 - - - - 488,054 Decommissioning obligation 42,297 - - 52,163 (7,642) 86,818 Deferred income taxes 40,547 - (34,906) (8,465) 15,194 12,370 Shareholders’ Equity 2,185,100 (16,375) (510,373) (17,361) 30,151 1,671,142 Total liabilities and shareholders’ equity 2,932,459 (16,375) (545,279) 26,337 37,758 2,434,900
(1) The property, plant and equipment (“PP&E”) adjustment under “other” includes the impact of lower depletion as a result of using proved plus probable reserves ($54.1 million), the net reduction to PP&E related to the Central Alberta disposition ($17.0 million), the reclassification of transaction costs on the Foothills Acquisition ($2.1 million reduction to PP&E) a net increase to PP&E related to property swaps of $2.4 million, and an additional $0.4 million capitalized regarding share based compensation. The increase to current liabilities under “other” relates to the recognition of dividends declared on share based compensation awards, which was mostly offset by the reclassification of current deferred taxes to long-term. The reduction to the decommissioning obligation relates to the Central Alberta disposition. The deferred income tax adjustment relates to the tax impact on the lower depletion of PP&E, the deferred tax treatment for convertible debentures and reclassification of current deferred taxes to long-term. The offset to these adjustments was through retained earnings or deficit.
Summary Net Earnings Reconciliation
2010 ($ thousands) Annual Q4 Q3 Q2 Q1 Net earnings/(loss) – previous GAAP (62,438) (21,491) (18,423) (23,288) 764 After-tax addition/(deduction): Operating expense1 356 230 126 - - General and administrative2 223 - - 215 8 Share based compensation (1,439) (752) (372) (356) 41 Depletion and depreciation 28,247 6,033 10,157 7,563 4,494 Decommissioning obligation accretion 244 50 91 51 52 Gain/(loss) on divestitures (5,728) 1,108 389 (7,225) - Property, plant and equipment impairment (104,718) (89,919) - - (14,799) Goodwill impairment (34,226) - - - (34,226) Other expenses (transaction costs) (1,610) - - (180) (1,430) Deferred income tax on debenture accretion 1,721 557 388 388 388 (116,930) (82,693) 10,779 456 (45,472) Net loss – IFRS (179,368) (104,184) (7,644) (22,832) (44,708)
(1) Relates to the capitalization of turnaround and major overhaul costs to PP&E. (2) Relates to the reclass of dividends paid on the Trust LTI, previously treated as additional compensation.
Progress Energy Resources Corp.
28
On transition to IFRS on January 1, 2010 Progress used certain exemptions allowed under IFRS 1 First Time Adoption of International Reporting Standards. The exemptions used were as follows:
Full Cost Accounting – IFRS 1 allows an entity that used full cost accounting under its previous GAAP to elect, at its time of adoption, to measure exploration and evaluation assets at the amount determined under the entity’s previous GAAP and to measure oil and gas assets in the development and production phases by allocating the amount determined under the entity’s previous GAAP for those assets to the underlying assets pro rata using reserve volumes or reserve values as of that date. Progress used the value of proved plus probable reserves to allocate its opening value of development and production assets.
Business Combinations – IFRS 1 allows an entity to use the IFRS rules for business combinations on a prospective basis rather than re-stating all business combinations. Share-based compensation – IFRS 1 allows an entity an exemption on IFRS 2, “Share-Based Payments” to equity instruments which vested before Progress’ transition date to IFRS.
Decommissioning Obligation – As Progress elected to use the oil and gas exemption, a decommissioning obligation exemption was also used that allows for the re-measurement of decommissioning obligations on IFRS transition to be offset to retained earnings/deficit.
Accounting Policy Changes and the Impact of Transition to IFRS
• Exploration and Evaluation (“E&E”) assets – On transition to IFRS Progress reclassified $206.5 million of E&E assets that were previously included in the PP&E balance on the consolidated statement of financial position. This consisted of the book value of undeveloped land that relates to exploration properties. E&E assets are not depleted and must be assessed for impairment at the transition date and when indicators of impairment exist. There was no transitional impairment of the E&E assets. The cost of undeveloped land that expires or any impairment recognized during a period, is charged as additional depletion and depreciation expense.
• Property, plant and equipment (“PP&E”) – This includes oil and gas assets in the development and
production phases. The Company has allocated the amount recognized under the previous GAAP as at January 1, 2010 to CGUs using reserve values.
• Divestitures – Under previous GAAP, proceeds from divestitures were deducted from the full cost
pool without recognition of a gain or loss unless the deduction resulted in a change in the depletion rate of 20 percent or greater, in which case a gain or loss was recorded. Under IFRS, gains and losses are recorded on divestitures and are calculated as the difference between the proceeds and the net book value of the asset disposed. For the year ended December 31, 2010, Progress recognized a $7.6 million ($5.7 million after tax) net loss on divestitures under IFRS compared to nil under the previous GAAP.
• Impairment of PP&E assets – Under IFRS, impairment tests of PP&E must be performed at the
CGU level as opposed to the entire PP&E balance which was required under the previous GAAP through the full cost ceiling test. An impairment is recognized if the carrying value exceeds the recoverable amount for a CGU. The recoverable amount is determined using fair value less cost to sell based on discounted future cash flows of proved plus probable reserves using forecast prices and costs. There was no impairment to PP&E on January 1, 2010 under IFRS. In the first quarter of 2010, as a result of continued decreases in natural gas prices and the impact on future natural gas prices used in evaluating the Company’s reserves, Progress incurred a charge of $19.7 million ($14.8 million after tax) on the impairment of PP&E for certain CGU’s. In the fourth quarter of 2010, an additional impairment charge of $119.9 million ($89.9 million after tax) was recognized
Progress Energy Resources Corp.
29
due to continued decreasing natural gas prices. PP&E impairments can be reversed in the future if the recoverable amount increases.
• Impairment of goodwill – For goodwill impairment tests under IFRS, goodwill that arises from a
business combination is allocated to the specific CGUs that are expected to benefit from the business combination. The carrying value of the CGU including goodwill is compared to the fair value of the CGU and any excess of the carrying value over the fair value is considered an impairment. As the goodwill impairment is performed on a much smaller portion of the Company’s assets (i.e. at the CGU level), $371.4 million of Progress’ goodwill was impaired on transition at January 1, 2010 and was charged through the opening deficit on its opening IFRS statement of financial position. As a result of continued decreases in natural gas prices and their impact on the value of the Company’s reserves for certain CGU’s an additional goodwill impairment charge was recognized in the first quarter of 2010 of $34.2 million. Goodwill impairments can not be reversed in the future.
• Decommissioning Obligation – Under the previous GAAP a credit adjusted risk free rate was used
to measure the obligation. Under IFRS Progress has used a risk free rate given the expected cash flows are risked. The result of using a lower discount rate was an increase to the obligation on transition of $26.2 million with an offsetting charge to the opening deficit, net of the deferred income tax effect of $6.5 million.
• Depletion and depreciation expense – Under IFRS Progress has chosen to base the depletion
calculation using proved plus probable reserves. This resulted in a decrease to depletion and depreciation expense in 2010 as compared to the previous GAAP and before the impact of the PP&E impairments described above which were recognized as additional depletion in the first and fourth quarters of 2010.
• Share based compensation –The major differences from the previous GAAP are the treatment of
graded vesting awards as multiple separate awards with different lives and estimating forfeiture rates in advance as opposed to recognizing the impact when the forfeiture occurs. For awards in which employees are entitled to dividends declared over the vesting period, those dividends are charged to equity and recognized as a liability when declared. Progress recognized a $1.7 million increase to dividends payable with an offsetting charge to equity at transition.
DISCLOSURE CONTROLS AND PROCEDURES
The Chief Executive Officer (“CEO”) and the Chief Financial Officer (“CFO”) have designed, or caused to be designed under their supervision, disclosure controls and procedures (“DC&P) and internal controls over financial reporting (“ICOFR”) as defined in National Instrument 52-109 Certification of Disclosure in Issuer’s Annual and Interim Filings in order to provide reasonable assurance regarding the reliability of financial reporting and the preparation of the financial statements for external purposes in accordance with IFRS. The DC&P have been designed to provide reasonable assurance that material information relating to Progress is made known to the CEO and CFO by others and that information required to be disclosed by the Company in its annual filings, interim filings or other reports filed or submitted by Progress under securities legislation is recorded, processed, summarized and reported within the time periods specified in securities legislation. The Company’s CEO and CFO have concluded, based on their evaluation as of the end of the period covered by the interim filings that the Company’s disclosure controls and procedures are effective to provide reasonable assurance that material information related to the issuer, is made known to them by others within the Company. The CEO and CFO are required to cause the Company to disclose any change in the Company’s ICOFR that occurred during the most recent interim period that has materially affected, or is reasonably likely to materially affect, the Company’s ICOFR. No changes in ICOFR were identified during such period that have materially
Progress Energy Resources Corp.
30
affected or are reasonably likely to materially affect, the Company’s ICOFR. There were no changes to ICOFR as a result of the transition to IFRS. It should be noted a control system, including the Company’s DC&P and ICOFR, no matter how well conceived or operated, can provide only reasonable, not absolute, assurance that the objective of the control system will be met and it should not be expected that DC&P and ICOFR will prevent all errors or fraud. Additional Information Additional information regarding the Company and its business and operations, including the annual information form (“AIF”) is available on the Company’s profile at www.sedar.com. Copies of the AIF can also be obtained by contacting the Company at Progress Energy Resources Corp. 1200, 205 – 5th Avenue S.W., Calgary, Alberta, Canada T2P 2V7 or by e-mail at [email protected]. This information is also accessible on the Company’s web site at www.progressenergy.com.
Progress Energy Resources Corp.
31
OUTLOOK
Our 2011 capital program has been established at $350 million and is expected to result in year-over-year production growth of approximately 13 percent. Production is projected to exit 2011 at between 50,000 and 52,000 boe per day, before the impact of dispositions. We have a current productive capability of approximately 45,000 boe per day. The focus of our capital program for the remainder of the year will be the continued advancement of our highly economic Montney pod developments at Town South, Town North, Gundy and Kobes. Additionally, activity on our North Montney Joint Venture lands in the Altares, Lily and Kahta areas will commence upon closing of the strategic partnership in the third quarter of 2011. We will continue to take advantage of the factors that make the North Montney attractive; the natural gas we produce is sweet and therefore does not require expensive sour gas processing; we attract a deep drilling royalty credit of approximately $2.1 million per well; and, we produce approximately 20 barrels per million cubic feet of high-value natural gas liquids. Along with our experience in the area, evolving drilling and completions technologies and strong initial production rates and recoveries, we are well positioned to deliver value for shareholders. Natural gas prices weakened through the Quarter, a period when demand is typically low due to moderate temperatures; however heat in early June demonstrated that non-normal weather has the ability to significantly increase prices. We remain optimistic about the long-term prospects for natural gas in North America and increasingly view the natural gas market as a global, rather than regional, marketplace. As demonstrated by our LNG Joint Venture with PETRONAS, the resource potential of northeast British Columbia is globally recognized and supply from a stable OECD country is highly prized by Asian consumers. Momentum is building for the large scale development of LNG facilities on the West Coast, which will enable Progress to target more attractive markets. Progress is well positioned to execute on its growth plans. We have a strong balance sheet with no bank debt as at the end of the Quarter, an undrawn credit facility and expect to receive an upfront $267.5 million cash payment upon closing of our strategic partnership with PETRONAS. These financial levers provide immediate and ongoing funding for our growth strategy. Non-core asset dispositions and the standby equity financing component of our strategic partnership with PETRONAS provide further support in the long term. On behalf of the Board of Directors, (Signed) “Michael R. Culbert”
Michael R. Culbert President & CEO July 28, 2011
Progress Energy Resources Corp.
32
Forward-Looking Statements Certain information regarding Progress set forth in this document, including Management's assessment of the Company’s future plans and operations, contains forward-looking statements that involve substantial known and unknown risks and uncertainties. The use of any of the words "anticipate", "continue", "estimate", "expect", "may", "will", "project", "should", "believe" and similar expressions are intended to identify forward looking statements. Such statements represent Progress' internal projections, estimates or beliefs concerning, among other things, an outlook on the estimated amounts and timing of capital investment, anticipated future debt, revenues or other expectations, beliefs, plans, objectives, assumptions, intentions or statements about future events or performance. These statements are only predictions and actual events or results may differ materially. Although Progress believes that the expectations reflected in the forward-looking statements are reasonable, it cannot guarantee future results, levels of activity, performance or achievement since such expectations are inherently subject to significant business, economic, competitive, political and social uncertainties and contingencies. Many factors could cause Progress' actual results to differ materially from those expressed or implied in any forward-looking statements made by, or on behalf of, Progress. In particular, forward-looking statements included in this MD&A include, but are not limited to, statements with respect to terms of binding framework agreement with PETRONAS, including terms of Upstream Joint Venture and LNG Joint Venture; the effect of LNG Joint Venture on British Columbia natural resources; targeted 2011 exit production; expected average third quarter production; anticipated average royalty rates and effect of government incentives on Progress' results of operations; future royalty rates; anticipated average operating expenses, transportation expenses and G&A expenses for 2011; terms of the Stock Option Plan, Performance Units Awards and Restricted Unit Awards; dividend policy and payment of future dividends; expected timing of completion of well at Kobes pod development; drilling plans; plans for 2011 expanded capital program; terms of credit facility; terms of convertible debentures; effect of the Upstream Joint Venture on Progress' growth strategy and future capital programs; anticipated liquidity to fund budgeted capital investments; capital investment programs and effect on production growth; focus of capital program for remainder of 2011; timing of commencement of activity on North Montney Joint Venture lands; benefits of development of LNG facilities; future prospects; the focus of and timing of capital expenditures; projections of market prices and costs and the related sensitivity of dividends; the performance characteristics of the Company's crude oil and natural gas properties; Progress’ future operating and financial results; supply and demand for crude oil and natural gas; drilling, development and completion plans and the timing of and results therefrom; treatment under governmental regulatory regimes and tax laws; and estimated tax pool balances. . In addition, statements relating to "reserves" or "resources" are deemed to be forward looking statements, as they involve the implied assessment, based on certain estimates and assumptions, that the resources and reserves described can be profitably produced in the future. These forward-looking statements are subject to numerous risks and uncertainties, certain of which are beyond the Company’s control, including the impact of general economic conditions; volatility in market prices for crude oil and natural gas; industry conditions; volatility of commodity prices; currency fluctuation; imprecision of reserve estimates; liabilities inherent in crude oil and natural gas operations; environmental risks; incorrect assessments of the value of acquisitions and exploration and development programs; competition from other producers; the lack of availability of qualified personnel or management; changes in income tax laws or changes in tax laws and incentive programs relating to the oil and gas industry; hazards such as fire, explosion, blowouts, cratering, and spills, each of which could result in substantial damage to wells, production facilities, other property and the environment or in personal injury; failure to complete the Upstream Joint Venture and/or the LNG Joint Venture on the terms described or at all; failure to realize the anticipated benefits of the Upstream Joint Venture and/or the LNG Joint Venture; failure to receive all required regulatory approvals for the Upstream Joint Venture and/or the LNG Joint Venture; stock market volatility; ability to access sufficient capital from internal and external sources and the other risks considered under "Risk Factors" in our annual information form for the year ended December 31, 2010 which is available on www.sedar.com.

Progress Energy Resources Corp.
33
With respect to forward-looking statements contained in this MD&A, Progress has made assumptions regarding: current commodity prices and royalty regimes; availability of skilled labour; North American sulphur prices; timing and amount of capital expenditures; future exchange rates; the price of oil and natural gas; the impact of increasing competition; conditions in general economic and financial markets; completion of definitive documentation and receipt of all required regulatory approvals for the Upstream Joint Venture and the LNG Joint Venture; availability of drilling and related equipment; effects of regulation by governmental agencies; royalty rates and future operating costs. Management has included the above summary of assumptions and risks related to forward-looking information provided in this MD&A in order to provide shareholders with a more complete perspective on Progress' current and future operations and such information may not be appropriate for other purposes. Progress’ actual results, performance or achievement could differ materially from those expressed in, or implied by, these forward-looking statements and, accordingly, no assurance can be given that any of the events anticipated by the forward-looking statements will transpire or occur, or if any of them do so, what benefits that the Company will derive there from. Readers are cautioned that the foregoing lists of factors are not exhaustive. These forward-looking statements are made as of the date of this MD&A and the Company disclaim any intent or obligation to update publicly any forward-looking statements, whether as a result of new information, future events or results or otherwise, other than as required by applicable securities laws. Non-GAAP Measurements Management uses the industry benchmark operating netback to analyze financial and operating performance. This benchmark as presented does not have any standardized meaning prescribed by IFRS and prior thereto, Canadian GAAP and therefore may not be comparable with the calculation of similar measures for other entities. Operating netback is used by research analysts to compare operating performance and the Company’s ability to maintain current operations and meet the forecasted capital program. Operating netback is the net result of the Company’s revenue, net of realized gains and losses on financial instruments, and royalty, operating and transportation expenses as found in the accompanying interim financial statements
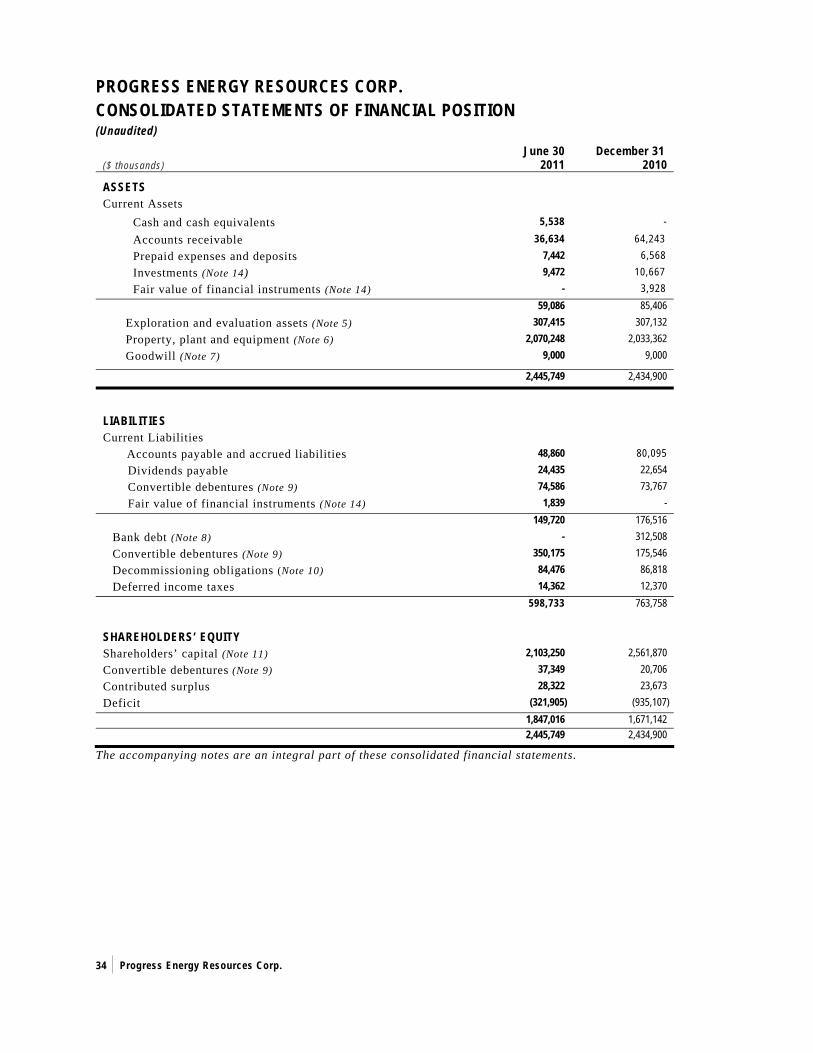
Progress Energy Resources Corp.
34
PROGRESS ENERGY RESOURCES CORP. CONSOLIDATED STATEMENTS OF FINANCIAL POSITION (Unaudited)
($ thousands) June 30
2011 December 31
2010
ASSETS
Current Assets Cash and cash equivalents 5,538 - Accounts receivable 36,634 64,243 Prepaid expenses and deposits 7,442 6,568 Investments (Note 14) 9,472 10,667 Fair value of financial instruments (Note 14) - 3,928 59,086 85,406
Exploration and evaluation assets (Note 5) 307,415 307,132 Property, plant and equipment (Note 6) 2,070,248 2,033,362 Goodwill (Note 7) 9,000 9,000
2,445,749 2,434,900
LIABILITIES
Current Liabilities
Accounts payable and accrued liabilities 48,860 80,095 Dividends payable 24,435 22,654 Convertible debentures (Note 9) 74,586 73,767 Fair value of financial instruments (Note 14) 1,839 -
149,720 176,516 Bank debt (Note 8) - 312,508 Convertible debentures (Note 9) 350,175 175,546 Decommissioning obligations (Note 10) 84,476 86,818 Deferred income taxes 14,362 12,370
598,733 763,758 SHAREHOLDERS’ EQUITY Shareholders’ capital (Note 11) 2,103,250 2,561,870 Convertible debentures (Note 9) 37,349 20,706 Contributed surplus 28,322 23,673 Deficit (321,905) (935,107) 1,847,016 1,671,142 2,445,749 2,434,900
The accompanying notes are an integral part of these consolidated financial statements.
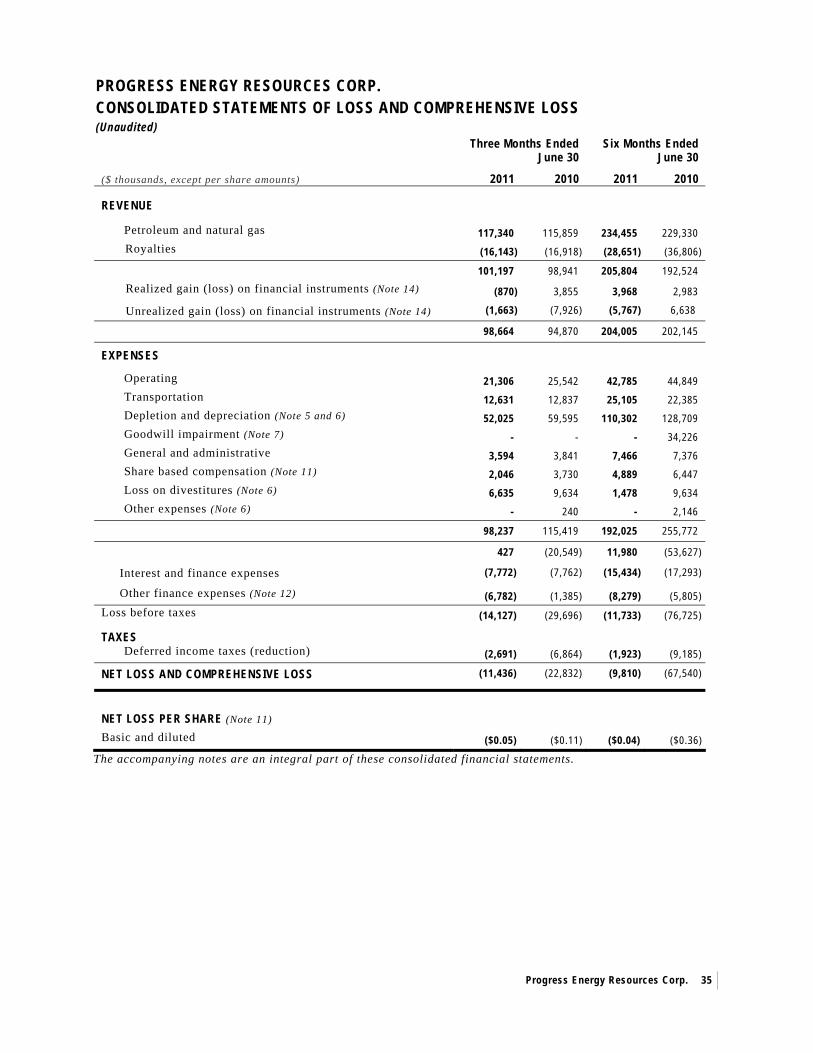
Progress Energy Resources Corp.
35
PROGRESS ENERGY RESOURCES CORP. CONSOLIDATED STATEMENTS OF LOSS AND COMPREHENSIVE LOSS (Unaudited)
Three Months Ended June 30
Six Months Ended June 30
($ thousands, except per share amounts) 2011 2010 2011 2010 REVENUE
Petroleum and natural gas 117,340 115,859 234,455 229,330 Royalties (16,143) (16,918) (28,651) (36,806)
101,197 98,941 205,804 192,524 Realized gain (loss) on financial instruments (Note 14) (870) 3,855 3,968 2,983
Unrealized gain (loss) on financial instruments (Note 14) (1,663) (7,926) (5,767) 6,638
98,664 94,870 204,005 202,145
EXPENSES
Operating 21,306 25,542 42,785 44,849 Transportation 12,631 12,837 25,105 22,385 Depletion and depreciation (Note 5 and 6) 52,025 59,595 110,302 128,709 Goodwill impairment (Note 7) - - - 34,226 General and administrative 3,594 3,841 7,466 7,376 Share based compensation (Note 11) 2,046 3,730 4,889 6,447 Loss on divestitures (Note 6) 6,635 9,634 1,478 9,634 Other expenses (Note 6) - 240 - 2,146
98,237 115,419 192,025 255,772
427 (20,549) 11,980 (53,627)
Interest and finance expenses
(7,772) (7,762) (15,434) (17,293)
Other finance expenses (Note 12) (6,782) (1,385) (8,279) (5,805) Loss before taxes (14,127) (29,696) (11,733) (76,725)
TAXES Deferred income taxes (reduction) (2,691) (6,864) (1,923) (9,185)
NET LOSS AND COMPREHENSIVE LOSS (11,436) (22,832) (9,810) (67,540)
NET LOSS PER SHARE (Note 11)
Basic and diluted ($0.05) ($0.11) ($0.04) ($0.36)
The accompanying notes are an integral part of these consolidated financial statements.
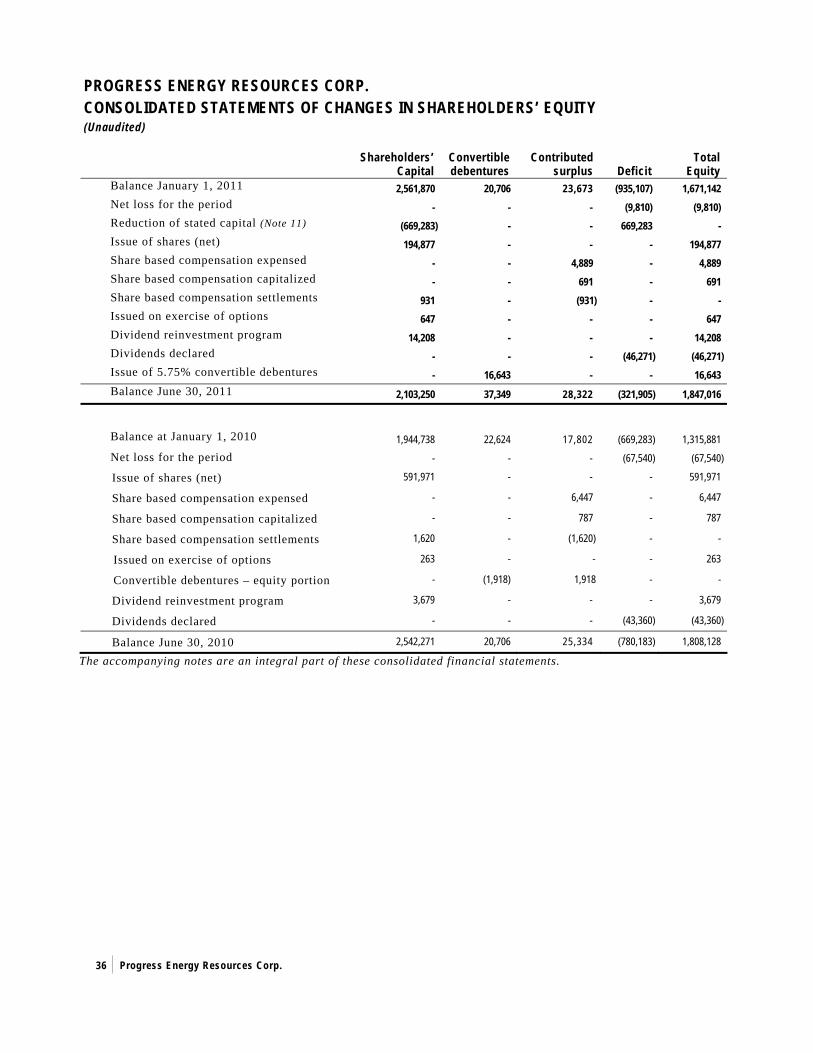
Progress Energy Resources Corp.
36
PROGRESS ENERGY RESOURCES CORP. CONSOLIDATED STATEMENTS OF CHANGES IN SHAREHOLDERS’ EQUITY (Unaudited)
Shareholders’
Capital Convertible debentures
Contributed surplus Deficit
Total Equity
Balance January 1, 2011 2,561,870 20,706 23,673 (935,107) 1,671,142 Net loss for the period - - - (9,810) (9,810) Reduction of stated capital (Note 11) (669,283) - - 669,283 - Issue of shares (net) 194,877 - - - 194,877 Share based compensation expensed - - 4,889 - 4,889 Share based compensation capitalized - - 691 - 691 Share based compensation settlements 931 - (931) - - Issued on exercise of options 647 - - - 647 Dividend reinvestment program 14,208 - - - 14,208 Dividends declared - - - (46,271) (46,271) Issue of 5.75% convertible debentures - 16,643 - - 16,643 Balance June 30, 2011 2,103,250 37,349 28,322 (321,905) 1,847,016
Balance at January 1, 2010 1,944,738 22,624 17,802 (669,283) 1,315,881 Net loss for the period - - - (67,540) (67,540)
Issue of shares (net) 591,971 - - - 591,971
Share based compensation expensed - - 6,447 - 6,447
Share based compensation capitalized - - 787 - 787
Share based compensation settlements 1,620 - (1,620) - -
Issued on exercise of options 263 - - - 263
Convertible debentures – equity portion - (1,918) 1,918 - -
Dividend reinvestment program 3,679 - - - 3,679
Dividends declared - - - (43,360) (43,360)
Balance June 30, 2010 2,542,271 20,706 25,334 (780,183) 1,808,128
The accompanying notes are an integral part of these consolidated financial statements.
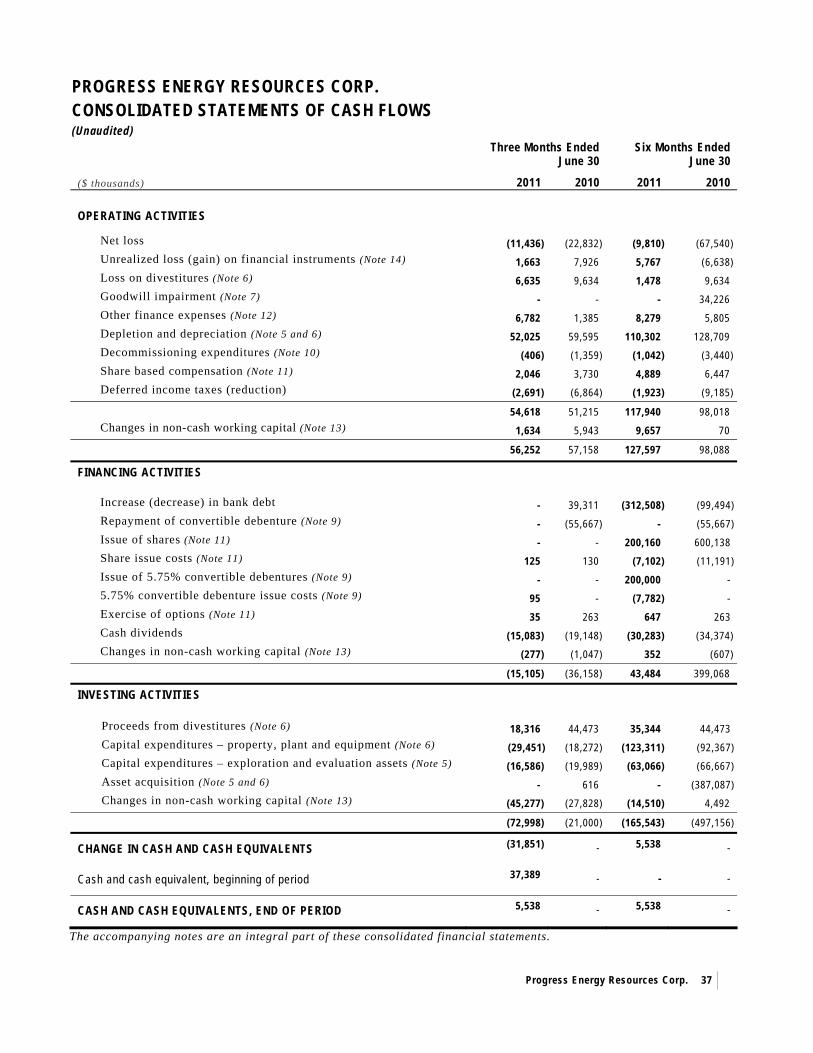
Progress Energy Resources Corp.
37
PROGRESS ENERGY RESOURCES CORP. CONSOLIDATED STATEMENTS OF CASH FLOWS (Unaudited)
Three Months Ended June 30
Six Months Ended June 30
($ thousands) 2011 2010 2011 2010 OPERATING ACTIVITIES
Net loss (11,436) (22,832) (9,810) (67,540) Unrealized loss (gain) on financial instruments (Note 14) 1,663 7,926 5,767 (6,638) Loss on divestitures (Note 6) 6,635 9,634 1,478 9,634 Goodwill impairment (Note 7) - - - 34,226 Other finance expenses (Note 12) 6,782 1,385 8,279 5,805 Depletion and depreciation (Note 5 and 6) 52,025 59,595 110,302 128,709 Decommissioning expenditures (Note 10) (406) (1,359) (1,042) (3,440) Share based compensation (Note 11) 2,046 3,730 4,889 6,447 Deferred income taxes (reduction) (2,691) (6,864) (1,923) (9,185) 54,618 51,215 117,940 98,018 Changes in non-cash working capital (Note 13) 1,634 5,943 9,657 70
56,252 57,158 127,597 98,088
FINANCING ACTIVITIES
Increase (decrease) in bank debt - 39,311 (312,508) (99,494) Repayment of convertible debenture (Note 9) - (55,667) - (55,667) Issue of shares (Note 11) - - 200,160 600,138 Share issue costs (Note 11) 125 130 (7,102) (11,191) Issue of 5.75% convertible debentures (Note 9) - - 200,000 - 5.75% convertible debenture issue costs (Note 9) 95 - (7,782) - Exercise of options (Note 11) 35 263 647 263 Cash dividends (15,083) (19,148) (30,283) (34,374) Changes in non-cash working capital (Note 13) (277) (1,047) 352 (607)
(15,105) (36,158) 43,484 399,068
INVESTING ACTIVITIES
Proceeds from divestitures (Note 6) 18,316 44,473 35,344 44,473 Capital expenditures – property, plant and equipment (Note 6) (29,451) (18,272) (123,311) (92,367) Capital expenditures – exploration and evaluation assets (Note 5) (16,586) (19,989) (63,066) (66,667) Asset acquisition (Note 5 and 6) - 616 - (387,087) Changes in non-cash working capital (Note 13) (45,277) (27,828) (14,510) 4,492 (72,998) (21,000) (165,543) (497,156)
CHANGE IN CASH AND CASH EQUIVALENTS (31,851) - 5,538 -
Cash and cash equivalent, beginning of period 37,389 - - -
CASH AND CASH EQUIVALENTS, END OF PERIOD 5,538 - 5,538 -
The accompanying notes are an integral part of these consolidated financial statements.
Progress Energy Resources Corp.
38
PROGRESS ENERGY RESOURCES CORP. NOTES TO INTERIM CONSOLIDATED FINANCIAL STATEMENTS (Unaudited) (tabular amounts are in $ thousands except for share and per share amounts)
1. REPORTING ENTITY
Progress Energy Resources Corp. (“Progress” or the “Company”) is engaged in the exploration for, and the acquisition, development and production of, oil and natural gas reserves in the provinces of British Columbia and Alberta. The Company conducts many of its activities jointly with others and these financial statements reflect only Progress’ proportional interest in such activities. Progress was incorporated on April 8, 2004 under the name ProEx Energy Ltd. (“ProEx”) and commenced commercial operations on July 2, 2004. On January 15, 2009, in connection with a plan of arrangement, ProEx was renamed Progress Energy Resources Corp. The Company currently has one wholly owned subsidiary and is a partner in a general partnership. 2. BASIS OF PREPARATION:
(a) Statement of compliance:
These interim consolidated financial statements have been prepared in accordance with International Accounting Standard (“IAS”) 34, “Interim Financial Reporting”. These interim consolidated financial statements are for part of the period covered by the first International Financial Reporting Standards (“IFRS”) annual financial statements of the Company and IFRS 1, “First-time Adoption of International Financial Reporting Standards” has been applied. These interim consolidated financial statements do not include all of the information required for full annual financial statements. The impact of the new standards, including reconciliations presenting the change from previous GAAP to IFRS as at June 30, 2010 and for the three and six months ended June 30, 2010, is presented in note 15.
The consolidated financial statements were authorized for issuance by the Board of Directors on July 28, 2011.
(b) Basis of measurement: The consolidated financial statements have been prepared on the historical cost basis except for the following:
(i) derivative financial instruments are measured at fair value; and
(ii) held for trading financial assets are measured at fair value with changes in fair value recorded in earnings.
The methods used to measure fair values are discussed in note 4.
(c) Functional and presentation currency: These interim consolidated financial statements are presented in Canadian dollars, which is the Company’s functional currency.
(d) Use of estimates and judgments: The preparation of financial statements requires management to make estimates and use judgment regarding the reported amounts of assets and liabilities and disclosures of contingent assets and liabilities as at the date of the interim consolidated financial statements and the reported amounts of revenues and expenses during the period. By their nature, estimates are subject to measurement uncertainty and changes in such estimates in future periods could require a material change in the financial statements. Accordingly, actual results may differ from the estimated amounts as future confirming events occur. Significant estimates and judgments made by management in the preparation of these interim consolidated financial statements are as follows:
Progress Energy Resources Corp.
39
Amounts recorded for depletion and depreciation and amounts used for impairment calculations are based on estimates of petroleum and natural gas reserves. By their nature, the estimates of reserves, including the estimates of future prices, costs, discount rates and the related future cash flows, are subject to measurement uncertainty. Accordingly, the impact to the consolidated financial statements in future periods could be material.
Amounts recorded for decommissioning obligations and the related accretion expense requires the use of estimates with respect to the amount and timing of decommissioning expenditures. Other provisions are recognized in the period when it becomes probable that there will be a future cash outflow.
The estimated fair value of derivative financial instruments resulting in financial assets and liabilities, by their very nature are subject to measurement uncertainty.
Compensation costs recognized for share based compensation plans are subject to the estimation of what the ultimate payout will be using pricing models such as the Black-Scholes-Merton model which is based on significant assumptions such as volatility, dividend yield and expected term. Several compensation plans are also performance based and are subject to management’s judgment as to whether or not performance criteria will be met.
Tax interpretations, regulations and legislation in the various jurisdictions in which the Company operates are subject to change. As such income taxes are subject to measurement uncertainty. Deferred income tax assets are assessed by management at the end of the reporting period to determine the likelihood that they will be realized from future taxable earnings.
3. SIGNIFICANT ACCOUNTING POLICIES
The interim consolidated financial statements have been prepared following the same accounting policies and methods of computation as the interim consolidation financial statements as at March 31, 2011. The significant accounting policies are described in note 3 of the March 31, 2011 interim consolidated financial statements.
(a) New standards and interpretations not yet adopted: In May 2011, the IASB issued four new standards and two amendments. Five of these items related to consolidation, while the remaining one addresses fair value measurement. All of the new standards are effective for annual periods beginning on or after January 1, 2013. Early adoption is permitted.
IFRS 10, “Consolidated Financial Statements” replaces IAS 27 “Consolidated Separate Financial Statements”. It introduces a new principle-based definition of control, applicable to all investees to determine the scope of consolidation. The standard provides the framework for consolidated financial statements and their preparation based on the principle of control.
IFRS 11 “Joint Arrangements” replaces IAS 31, “Interests in Joint Ventures”. IFRS 11 divides joint arrangements into two types, each having its own accounting model. A “joint operation” continues to be accounted for using proportionate consolidation, where a “joint venture” must be accounted for using equity accounting. This differs from IAS 31, where there was the choice to use proportionate consolidation or equity accounting for joint ventures. A “joint operation” is defined as the joint operators having rights to the assets, and obligations for the liabilities, relating to the arrangement. In a “joint venture”, the joint ventures’ have rights to the net assets of the arrangement, typically through their investment in a separate joint venture entity.
IFRS 12 “Disclosure of Interests in Other Entities” is a new standard, which combines all of the disclosure requirements for subsidiaries, associates and joint arrangements, as well as unconsolidated structured entities.
IFRS 13 “Fair Value Measurement” is a new standard meant to clarify the definition of fair value, provide guidance on measuring fair value and improve disclosure requirements related to fair value measurement.
IAS 28 “Investments in Associates and Joint Ventures” has been amended as a result of the issuance of IFRS 11 and the withdrawal of IAS 31. The amended standard sets out the requirements for the application of the equity method when accounting for interest in joint ventures, in addition to interests in associates.

Progress Energy Resources Corp.
40
IAS 27 “Separate Financial Statements” has been amended to focus solely on accounting and disclosure requirements when an entity presents separate financial statements, due to the issuance of the new IFRS 10 which is specific to consolidated financial statements.
In November 2009, the IASB published IFRS 9, “Financial Instruments,” which covers the classification and measurement of financial assets as part of its project to replace IAS 39, “Financial Instruments: Recognition and Measurement.” In October 2010, the requirements for classifying and measuring financial liabilities were added to IFRS 9. Under this guidance, entities have the option to recognize financial liabilities at fair value through earnings. If this option is elected, entities would be required to reverse the portion of the fair value change due to a company’s own credit risk out of earnings and recognize the change in other comprehensive income. IFRS 9 is effective for the Company on January 1, 2013. Early adoption is permitted and the standard is required to be applied retrospectively.
The Company is currently evaluating the impact of adopting all of the newly issued and amended standards.
4. DETERMINATION OF FAIR VALUES A number of the Company’s accounting policies and disclosures require the determination of fair value, for both financial and non-financial assets and liabilities. Fair values have been determined for measurement and/or disclosure purposes based on the following methods. When applicable, further information about the assumptions made in determining fair values is disclosed in the notes specific to that asset or liability.
(i) Property, plant and equipment and exploration and evaluation assets:
The fair value of property, plant and equipment and exploration and evaluation assets recognized in a business combination, is based on market values. The market value of property, plant and equipment and exploration and evaluation assets is the estimated amount for which the assets could be exchanged on the acquisition date between a willing buyer and a willing seller in an arm’s length transaction after proper marketing wherein the parties had each acted knowledgeably, prudently and without compulsion. The market value of oil and natural gas interests (included in property, plant and equipment) and intangible exploration assets is estimated with reference to the discounted cash flows expected to be derived from oil and natural gas production based on externally prepared reserve reports. The risk-adjusted discount rate is specific to the asset with reference to general market conditions.
The market value of other items of property, plant and equipment is based on the quoted market prices for similar items.
(ii) Cash and cash equivalents, accounts receivable, accounts payable and accrued liabilities, cash dividends payable and bank debt:
The fair value of cash and cash equivalents, accounts receivable, accounts payable and accrued liabilities, cash dividends payable and bank debt is estimated as the present value of future cash flows, discounted at the market rate of interest at the reporting date. At June 30, 2011 and December 31, 2010, the fair value of these balances approximated their carrying value due to their short term to maturity or in the case of bank debt, the fair value approximates its carrying value as it bears interest at floating rates and the premium charged was indicative of the Company’s current credit premium.
(iii) Derivatives:
The fair value of forward contracts and swaps is determined by discounting the difference between the contracted prices and published forward price curves as at the reporting date, using the remaining contracted oil and natural gas volumes and a risk-free interest rate (based on published government rates). The fair value of options and costless collars is based on option models that use published information with respect to volatility, prices and interest rates.
(iv) Convertible debentures:
The convertible debentures trade on the Toronto stock exchange under the symbols PRQ.DB.A, PRQ.DB.B and PRQ.DB.C. The fair value of the convertible debentures is based on quoted market prices.
(v) Stock options:
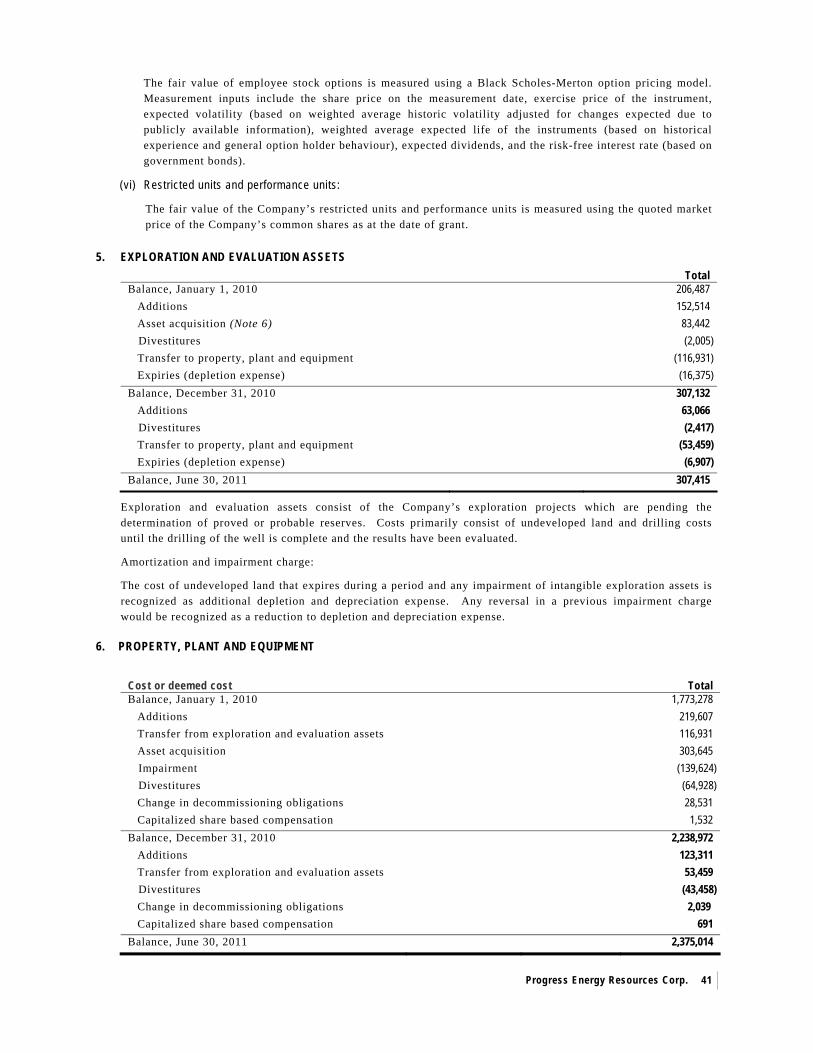
Progress Energy Resources Corp.
41
The fair value of employee stock options is measured using a Black Scholes-Merton option pricing model. Measurement inputs include the share price on the measurement date, exercise price of the instrument, expected volatility (based on weighted average historic volatility adjusted for changes expected due to publicly available information), weighted average expected life of the instruments (based on historical experience and general option holder behaviour), expected dividends, and the risk-free interest rate (based on government bonds).
(vi) Restricted units and performance units:
The fair value of the Company’s restricted units and performance units is measured using the quoted market price of the Company’s common shares as at the date of grant.
5. EXPLORATION AND EVALUATION ASSETS
Total Balance, January 1, 2010 206,487 Additions 152,514 Asset acquisition (Note 6) 83,442 Divestitures (2,005) Transfer to property, plant and equipment (116,931) Expiries (depletion expense) (16,375) Balance, December 31, 2010 307,132 Additions 63,066 Divestitures (2,417) Transfer to property, plant and equipment (53,459) Expiries (depletion expense) (6,907) Balance, June 30, 2011 307,415
Exploration and evaluation assets consist of the Company’s exploration projects which are pending the determination of proved or probable reserves. Costs primarily consist of undeveloped land and drilling costs until the drilling of the well is complete and the results have been evaluated.
Amortization and impairment charge:
The cost of undeveloped land that expires during a period and any impairment of intangible exploration assets is recognized as additional depletion and depreciation expense. Any reversal in a previous impairment charge would be recognized as a reduction to depletion and depreciation expense.
6. PROPERTY, PLANT AND EQUIPMENT
Cost or deemed cost Total Balance, January 1, 2010 1,773,278 Additions 219,607 Transfer from exploration and evaluation assets 116,931 Asset acquisition 303,645 Impairment (139,624) Divestitures (64,928) Change in decommissioning obligations 28,531 Capitalized share based compensation 1,532 Balance, December 31, 2010 2,238,972 Additions 123,311 Transfer from exploration and evaluation assets 53,459 Divestitures (43,458) Change in decommissioning obligations 2,039 Capitalized share based compensation 691 Balance, June 30, 2011 2,375,014
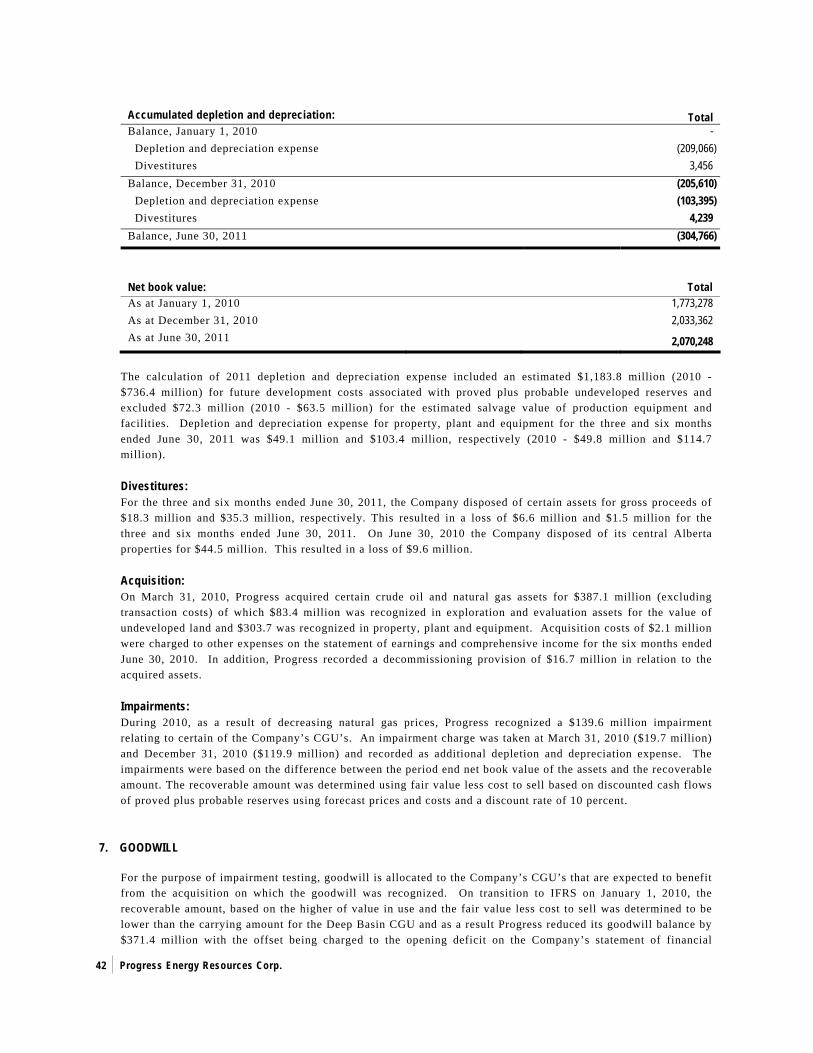
Progress Energy Resources Corp.
42
Accumulated depletion and depreciation: Total Balance, January 1, 2010 - Depletion and depreciation expense (209,066) Divestitures 3,456 Balance, December 31, 2010 (205,610) Depletion and depreciation expense (103,395) Divestitures 4,239 Balance, June 30, 2011 (304,766)
Net book value:
Total As at January 1, 2010 1,773,278 As at December 31, 2010 2,033,362 As at June 30, 2011 2,070,248
The calculation of 2011 depletion and depreciation expense included an estimated $1,183.8 million (2010 - $736.4 million) for future development costs associated with proved plus probable undeveloped reserves and excluded $72.3 million (2010 - $63.5 million) for the estimated salvage value of production equipment and facilities. Depletion and depreciation expense for property, plant and equipment for the three and six months ended June 30, 2011 was $49.1 million and $103.4 million, respectively (2010 - $49.8 million and $114.7 million). Divestitures: For the three and six months ended June 30, 2011, the Company disposed of certain assets for gross proceeds of $18.3 million and $35.3 million, respectively. This resulted in a loss of $6.6 million and $1.5 million for the three and six months ended June 30, 2011. On June 30, 2010 the Company disposed of its central Alberta properties for $44.5 million. This resulted in a loss of $9.6 million.
Acquisition: On March 31, 2010, Progress acquired certain crude oil and natural gas assets for $387.1 million (excluding transaction costs) of which $83.4 million was recognized in exploration and evaluation assets for the value of undeveloped land and $303.7 was recognized in property, plant and equipment. Acquisition costs of $2.1 million were charged to other expenses on the statement of earnings and comprehensive income for the six months ended June 30, 2010. In addition, Progress recorded a decommissioning provision of $16.7 million in relation to the acquired assets.
Impairments: During 2010, as a result of decreasing natural gas prices, Progress recognized a $139.6 million impairment relating to certain of the Company’s CGU’s. An impairment charge was taken at March 31, 2010 ($19.7 million) and December 31, 2010 ($119.9 million) and recorded as additional depletion and depreciation expense. The impairments were based on the difference between the period end net book value of the assets and the recoverable amount. The recoverable amount was determined using fair value less cost to sell based on discounted cash flows of proved plus probable reserves using forecast prices and costs and a discount rate of 10 percent.
7. GOODWILL
For the purpose of impairment testing, goodwill is allocated to the Company’s CGU’s that are expected to benefit from the acquisition on which the goodwill was recognized. On transition to IFRS on January 1, 2010, the recoverable amount, based on the higher of value in use and the fair value less cost to sell was determined to be lower than the carrying amount for the Deep Basin CGU and as a result Progress reduced its goodwill balance by $371.4 million with the offset being charged to the opening deficit on the Company’s statement of financial
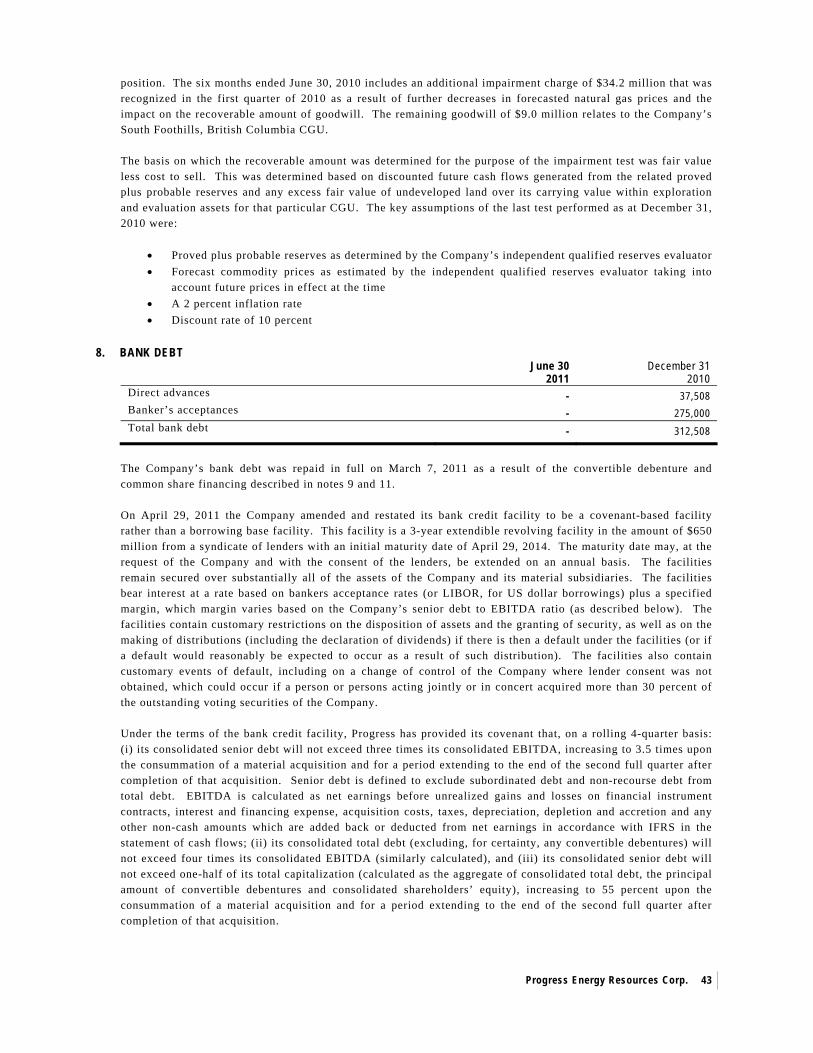
Progress Energy Resources Corp.
43
position. The six months ended June 30, 2010 includes an additional impairment charge of $34.2 million that was recognized in the first quarter of 2010 as a result of further decreases in forecasted natural gas prices and the impact on the recoverable amount of goodwill. The remaining goodwill of $9.0 million relates to the Company’s South Foothills, British Columbia CGU. The basis on which the recoverable amount was determined for the purpose of the impairment test was fair value less cost to sell. This was determined based on discounted future cash flows generated from the related proved plus probable reserves and any excess fair value of undeveloped land over its carrying value within exploration and evaluation assets for that particular CGU. The key assumptions of the last test performed as at December 31, 2010 were:
• Proved plus probable reserves as determined by the Company’s independent qualified reserves evaluator • Forecast commodity prices as estimated by the independent qualified reserves evaluator taking into
account future prices in effect at the time • A 2 percent inflation rate • Discount rate of 10 percent
8. BANK DEBT
June 30
2011 December 31
2010 Direct advances - 37,508 Banker’s acceptances - 275,000 Total bank debt - 312,508
The Company’s bank debt was repaid in full on March 7, 2011 as a result of the convertible debenture and common share financing described in notes 9 and 11. On April 29, 2011 the Company amended and restated its bank credit facility to be a covenant-based facility rather than a borrowing base facility. This facility is a 3-year extendible revolving facility in the amount of $650 million from a syndicate of lenders with an initial maturity date of April 29, 2014. The maturity date may, at the request of the Company and with the consent of the lenders, be extended on an annual basis. The facilities remain secured over substantially all of the assets of the Company and its material subsidiaries. The facilities bear interest at a rate based on bankers acceptance rates (or LIBOR, for US dollar borrowings) plus a specified margin, which margin varies based on the Company’s senior debt to EBITDA ratio (as described below). The facilities contain customary restrictions on the disposition of assets and the granting of security, as well as on the making of distributions (including the declaration of dividends) if there is then a default under the facilities (or if a default would reasonably be expected to occur as a result of such distribution). The facilities also contain customary events of default, including on a change of control of the Company where lender consent was not obtained, which could occur if a person or persons acting jointly or in concert acquired more than 30 percent of the outstanding voting securities of the Company. Under the terms of the bank credit facility, Progress has provided its covenant that, on a rolling 4-quarter basis: (i) its consolidated senior debt will not exceed three times its consolidated EBITDA, increasing to 3.5 times upon the consummation of a material acquisition and for a period extending to the end of the second full quarter after completion of that acquisition. Senior debt is defined to exclude subordinated debt and non-recourse debt from total debt. EBITDA is calculated as net earnings before unrealized gains and losses on financial instrument contracts, interest and financing expense, acquisition costs, taxes, depreciation, depletion and accretion and any other non-cash amounts which are added back or deducted from net earnings in accordance with IFRS in the statement of cash flows; (ii) its consolidated total debt (excluding, for certainty, any convertible debentures) will not exceed four times its consolidated EBITDA (similarly calculated), and (iii) its consolidated senior debt will not exceed one-half of its total capitalization (calculated as the aggregate of consolidated total debt, the principal amount of convertible debentures and consolidated shareholders’ equity), increasing to 55 percent upon the consummation of a material acquisition and for a period extending to the end of the second full quarter after completion of that acquisition.

Progress Energy Resources Corp.
44
9. CONVERTIBLE DEBENTURES
On March 7, 2011 the Company completed a convertible debenture and common share financing that included $200.0 million principal amount of 5.75 percent convertible unsecured subordinated debentures and 14,400,000 common shares at $13.90 per share as described in note 11. The 5.75 percent debenture issue costs were approximately $7.8 million.
As at June 30, 2011 Progress had the following convertible unsecured subordinated debentures (the “Debentures”) outstanding. Each Debenture may be converted into common shares at the option of the holder at the applicable conversion price per common share noted below. The Company may elect to satisfy the interest and principal obligations by the issuance of common shares.
Debenture Principal Semi Annual Interest Payments Conversion
Price ($/share) Maturity Date
5.75% 200,000 June 30 and December 31 $20.85 June 30, 2016
5.25% 200,000 April 30 and October 31 $18.00 October 31, 2014
6.25% 75,000 March 31 and September 30 $24.00 September 30, 2011 The 6.75 percent debentures matured and were settled on June 30, 2010. After October 31, 2012, the Company may redeem the 5.25 percent debentures in whole or in part provided the common shares weighted average trading price during a specified period prior to redemption is at least 125 percent of the conversion price. The Company may satisfy the payment of principal or interest in common shares under certain circumstances. After July 1, 2014, the Company may redeem the 5.75 percent debentures in whole or in part provided the common shares weighted average trading price during a specified period prior to redemption is at least 125 percent of the conversion price. The Company may satisfy the payment of principal or interest in common shares under certain circumstances.
The Debentures have been classified as debt, net of issue costs and net of the fair value of the conversion feature at the date of issue which has been classified as part of shareholders’ equity. The issue costs will be amortized over the term of the Debentures and the debt portion will accrete up to the principal balance at maturity. The accretion and amortization of issue costs are expensed within other finance expenses on the consolidated statement of earnings and comprehensive income. The fair value of the conversion feature was determined at the time of issue as the difference between the principal value of the debentures and the discounted cash flows assuming an eight percent rate for the 6.25 percent debentures, 8.3 percent for the 5.25 percent debentures and 8.75 percent for the 5.75 percent debentures which were the estimated rates for debt with similar terms at the time. If the Debentures are converted to shares, a portion of the value of the conversion feature under shareholders’ equity will be reclassified to shareholders’ capital along with the conversion price paid.
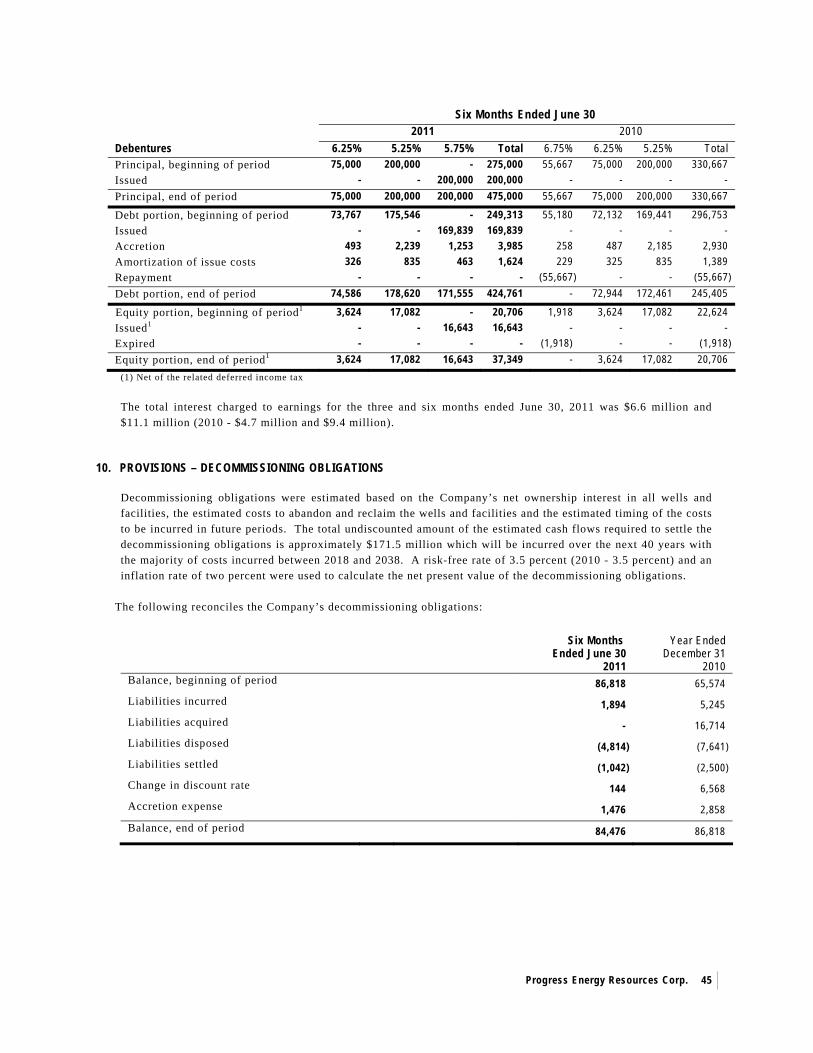
Progress Energy Resources Corp.
45
Six Months Ended June 30 2011 2010 Debentures 6.25% 5.25% 5.75% Total 6.75% 6.25% 5.25% Total Principal, beginning of period 75,000 200,000 - 275,000 55,667 75,000 200,000 330,667 Issued - - 200,000 200,000 - - - - Principal, end of period 75,000 200,000 200,000 475,000 55,667 75,000 200,000 330,667
Debt portion, beginning of period 73,767 175,546 - 249,313 55,180 72,132 169,441 296,753 Issued - - 169,839 169,839 - - - - Accretion 493 2,239 1,253 3,985 258 487 2,185 2,930 Amortization of issue costs 326 835 463 1,624 229 325 835 1,389 Repayment - - - - (55,667) - - (55,667) Debt portion, end of period 74,586 178,620 171,555 424,761 - 72,944 172,461 245,405
Equity portion, beginning of period1 3,624 17,082 - 20,706 1,918 3,624 17,082 22,624 Issued1 - - 16,643 16,643 - - - - Expired - - - - (1,918) - - (1,918) Equity portion, end of period1 3,624 17,082 16,643 37,349 - 3,624 17,082 20,706
(1) Net of the related deferred income tax The total interest charged to earnings for the three and six months ended June 30, 2011 was $6.6 million and $11.1 million (2010 - $4.7 million and $9.4 million).
10. PROVISIONS – DECOMMISSIONING OBLIGATIONS
Decommissioning obligations were estimated based on the Company’s net ownership interest in all wells and facilities, the estimated costs to abandon and reclaim the wells and facilities and the estimated timing of the costs to be incurred in future periods. The total undiscounted amount of the estimated cash flows required to settle the decommissioning obligations is approximately $171.5 million which will be incurred over the next 40 years with the majority of costs incurred between 2018 and 2038. A risk-free rate of 3.5 percent (2010 - 3.5 percent) and an inflation rate of two percent were used to calculate the net present value of the decommissioning obligations.
The following reconciles the Company’s decommissioning obligations:
Six Months Ended June 30
2011
Year Ended December 31
2010 Balance, beginning of period 86,818 65,574 Liabilities incurred 1,894 5,245 Liabilities acquired - 16,714 Liabilities disposed (4,814) (7,641) Liabilities settled (1,042) (2,500) Change in discount rate 144 6,568 Accretion expense 1,476 2,858 Balance, end of period 84,476 86,818

Progress Energy Resources Corp.
46
11. SHAREHOLDERS’ EQUITY
An unlimited number of voting common shares may be authorized and issued. Each common share is transferable, carries the right to one vote and represents an equal undivided beneficial interest in any dividends from the Company and in the assets in the event of termination or winding-up of the Company. All common shares are of the same class with equal rights and privileges.
Shareholders’ Capital Common Shares of Progress Energy Resources Corp.
Six Months Ended June 30
2011 2010 Number Amount Number Amount Common Shares Balance, beginning of period 214,876,567 2,561,870 165,283,517 1,944,738 Reduction of stated capital - (669,283) - - Share based compensation 48,690 931 92,562 1,620 Dividend reinvestment program 1,153,029 14,208 298,569 3,679 Exercise of options 51,000 647 25,000 263 Issued for cash 14,400,000 200,160 47,630,000 600,138 Share issue costs (net of tax of $1,819 and $3,024, respectively) (5,283) (8,167) Balance, end of period 230,529,286 2,103,250 213,329,648 2,542,271
On May 11, 2011, the shareholders of Progress approved a special resolution to reduce the stated capital of the common shares of Progress by $669.3 million, an amount equal to the Company’s deficit as at January 1, 2010 in accordance with IFRS. The deficit arose out of two fundamental reporting differences between IFRS and the previous GAAP, being the method of performing the impairment test for goodwill and the discount rate used to measure decommissioning obligations (refer to note 15) as well as the impact of distributions from the Company’s previous income trust structure. On March 7, 2011, Progress issued 14,400,000 common shares at a price of $13.90 per share for gross proceeds of $200.2 million ($193.1 million net of issue costs). Pursuant to its existing subscription right, CPPIB agreed to subscribe for 2,116,800 common shares of Progress at a price of $13.90 per share, for gross proceeds of $29.4 million, which is included in the aggregate proceeds of the offering. The closing of the offering and CPPIB subscription were contingent upon one another.
On March 2, 2010, Progress issued 47,630,000 subscription receipts at a price of $12.60 per subscription receipt for total gross proceeds of $600.1 million ($588.9 million net of issue costs). The financing was comprised of a $350 million subscription receipt private placement with the Canada Pension Plan Investment Board (“CPPIB”) and a concurrent $250 million subscription receipt bought deal financing through a syndicate of underwriters. Each private placement subscription receipt and public subscription receipt represented the right to receive one common share of Progress, without the payment of any additional consideration, subject to the closing of the asset acquisition which occurred on March 31, 2010.
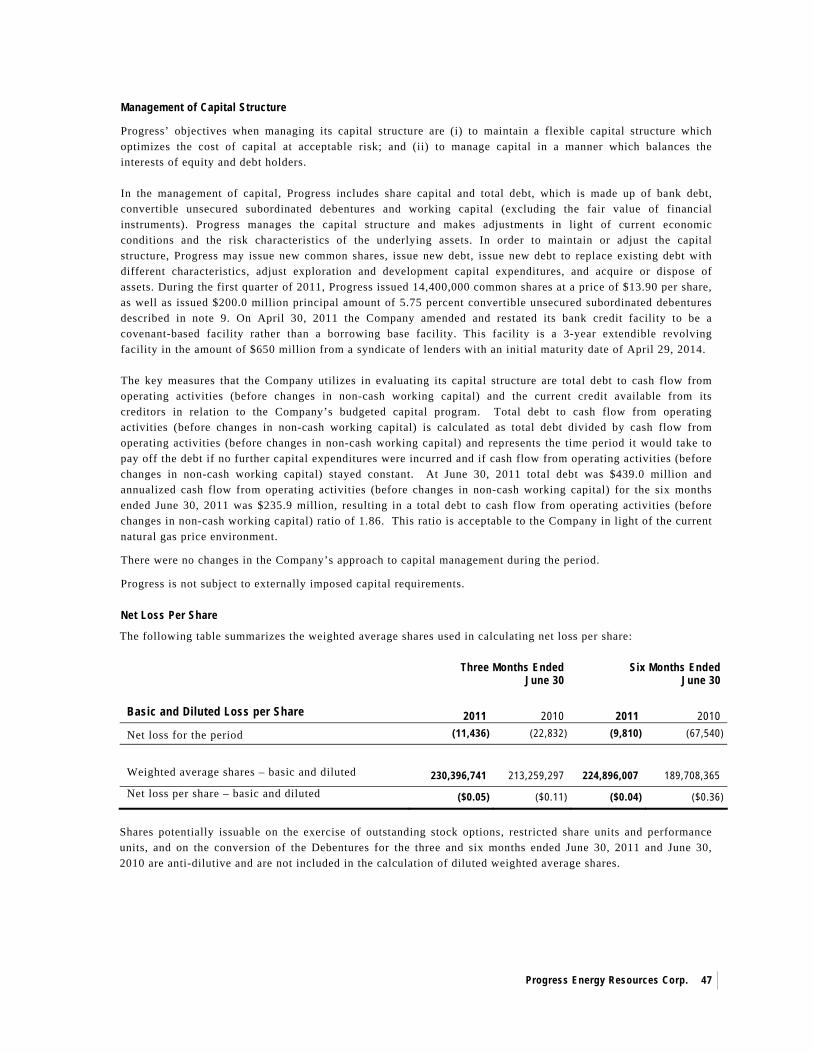
Progress Energy Resources Corp.
47
Management of Capital Structure
Progress’ objectives when managing its capital structure are (i) to maintain a flexible capital structure which optimizes the cost of capital at acceptable risk; and (ii) to manage capital in a manner which balances the interests of equity and debt holders. In the management of capital, Progress includes share capital and total debt, which is made up of bank debt, convertible unsecured subordinated debentures and working capital (excluding the fair value of financial instruments). Progress manages the capital structure and makes adjustments in light of current economic conditions and the risk characteristics of the underlying assets. In order to maintain or adjust the capital structure, Progress may issue new common shares, issue new debt, issue new debt to replace existing debt with different characteristics, adjust exploration and development capital expenditures, and acquire or dispose of assets. During the first quarter of 2011, Progress issued 14,400,000 common shares at a price of $13.90 per share, as well as issued $200.0 million principal amount of 5.75 percent convertible unsecured subordinated debentures described in note 9. On April 30, 2011 the Company amended and restated its bank credit facility to be a covenant-based facility rather than a borrowing base facility. This facility is a 3-year extendible revolving facility in the amount of $650 million from a syndicate of lenders with an initial maturity date of April 29, 2014. The key measures that the Company utilizes in evaluating its capital structure are total debt to cash flow from operating activities (before changes in non-cash working capital) and the current credit available from its creditors in relation to the Company’s budgeted capital program. Total debt to cash flow from operating activities (before changes in non-cash working capital) is calculated as total debt divided by cash flow from operating activities (before changes in non-cash working capital) and represents the time period it would take to pay off the debt if no further capital expenditures were incurred and if cash flow from operating activities (before changes in non-cash working capital) stayed constant. At June 30, 2011 total debt was $439.0 million and annualized cash flow from operating activities (before changes in non-cash working capital) for the six months ended June 30, 2011 was $235.9 million, resulting in a total debt to cash flow from operating activities (before changes in non-cash working capital) ratio of 1.86. This ratio is acceptable to the Company in light of the current natural gas price environment.
There were no changes in the Company’s approach to capital management during the period.
Progress is not subject to externally imposed capital requirements.
Net Loss Per Share
The following table summarizes the weighted average shares used in calculating net loss per share:
Three Months Ended June 30
Six Months Ended June 30
Basic and Diluted Loss per Share 2011 2010 2011 2010 Net loss for the period (11,436) (22,832) (9,810) (67,540) Weighted average shares – basic and diluted 230,396,741 213,259,297 224,896,007 189,708,365 Net loss per share – basic and diluted ($0.05) ($0.11) ($0.04) ($0.36)
Shares potentially issuable on the exercise of outstanding stock options, restricted share units and performance units, and on the conversion of the Debentures for the three and six months ended June 30, 2011 and June 30, 2010 are anti-dilutive and are not included in the calculation of diluted weighted average shares.
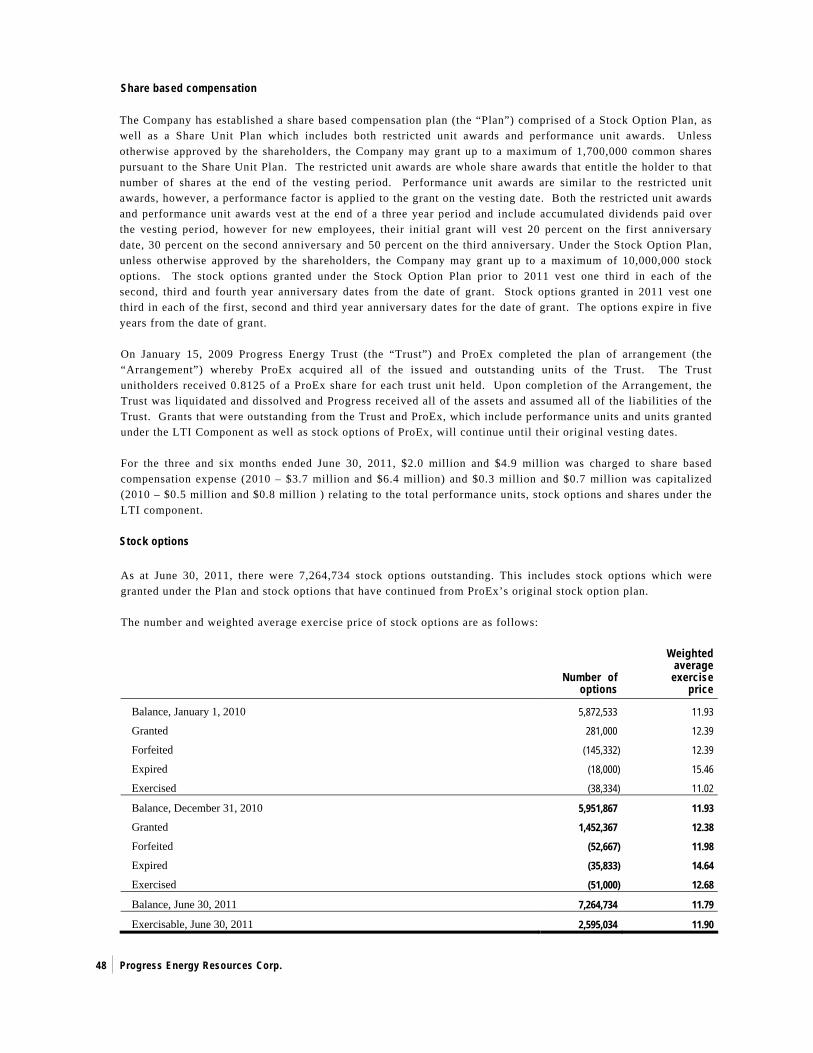
Progress Energy Resources Corp.
48
Share based compensation The Company has established a share based compensation plan (the “Plan”) comprised of a Stock Option Plan, as well as a Share Unit Plan which includes both restricted unit awards and performance unit awards. Unless otherwise approved by the shareholders, the Company may grant up to a maximum of 1,700,000 common shares pursuant to the Share Unit Plan. The restricted unit awards are whole share awards that entitle the holder to that number of shares at the end of the vesting period. Performance unit awards are similar to the restricted unit awards, however, a performance factor is applied to the grant on the vesting date. Both the restricted unit awards and performance unit awards vest at the end of a three year period and include accumulated dividends paid over the vesting period, however for new employees, their initial grant will vest 20 percent on the first anniversary date, 30 percent on the second anniversary and 50 percent on the third anniversary. Under the Stock Option Plan, unless otherwise approved by the shareholders, the Company may grant up to a maximum of 10,000,000 stock options. The stock options granted under the Stock Option Plan prior to 2011 vest one third in each of the second, third and fourth year anniversary dates from the date of grant. Stock options granted in 2011 vest one third in each of the first, second and third year anniversary dates for the date of grant. The options expire in five years from the date of grant. On January 15, 2009 Progress Energy Trust (the “Trust”) and ProEx completed the plan of arrangement (the “Arrangement”) whereby ProEx acquired all of the issued and outstanding units of the Trust. The Trust unitholders received 0.8125 of a ProEx share for each trust unit held. Upon completion of the Arrangement, the Trust was liquidated and dissolved and Progress received all of the assets and assumed all of the liabilities of the Trust. Grants that were outstanding from the Trust and ProEx, which include performance units and units granted under the LTI Component as well as stock options of ProEx, will continue until their original vesting dates. For the three and six months ended June 30, 2011, $2.0 million and $4.9 million was charged to share based compensation expense (2010 – $3.7 million and $6.4 million) and $0.3 million and $0.7 million was capitalized (2010 – $0.5 million and $0.8 million ) relating to the total performance units, stock options and shares under the LTI component.
Stock options
As at June 30, 2011, there were 7,264,734 stock options outstanding. This includes stock options which were granted under the Plan and stock options that have continued from ProEx’s original stock option plan. The number and weighted average exercise price of stock options are as follows:
Number of
options
Weighted average
exercise price
Balance, January 1, 2010 5,872,533 11.93
Granted 281,000 12.39
Forfeited (145,332) 12.39
Expired (18,000) 15.46
Exercised (38,334) 11.02
Balance, December 31, 2010 5,951,867 11.93 Granted 1,452,367 12.38
Forfeited (52,667) 11.98
Expired (35,833) 14.64
Exercised (51,000) 12.68
Balance, June 30, 2011 7,264,734 11.79
Exercisable, June 30, 2011 2,595,034 11.90
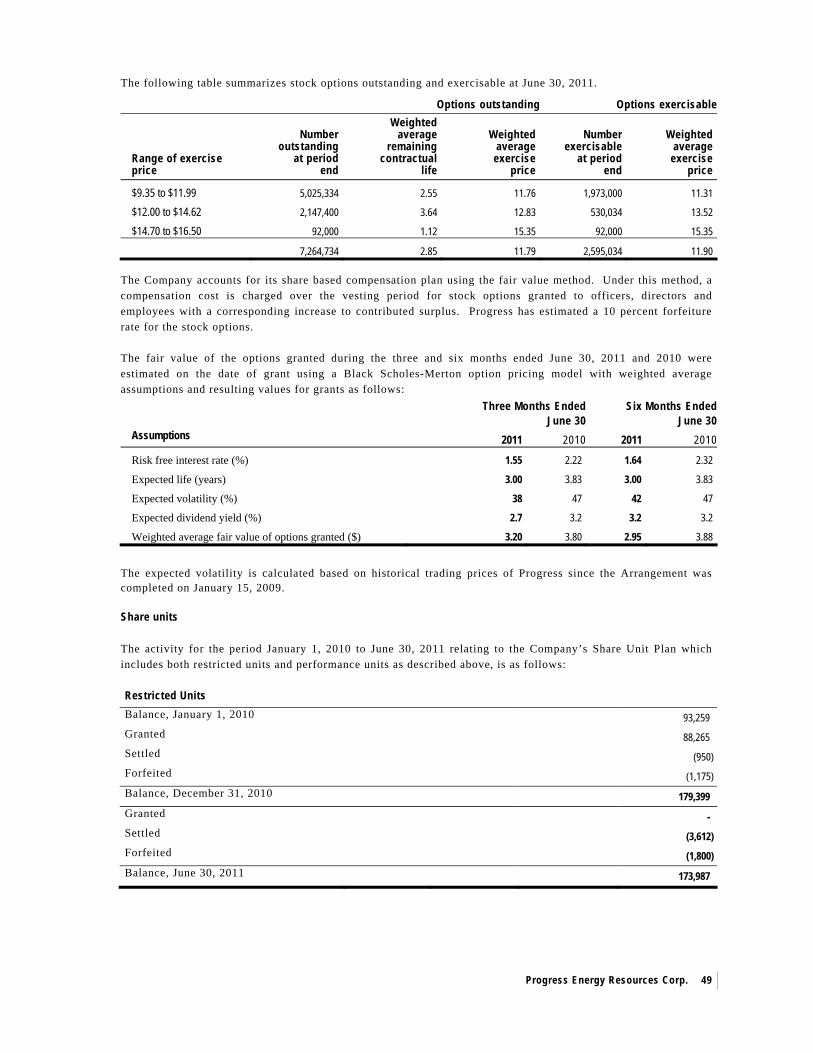
Progress Energy Resources Corp.
49
The following table summarizes stock options outstanding and exercisable at June 30, 2011.
Options outstanding Options exercisable
Range of exercise price
Number
outstanding at period
end
Weighted average
remaining contractual
life
Weighted average
exercise price
Number exercisable
at period end
Weighted average
exercise price
$9.35 to $11.99 5,025,334 2.55 11.76 1,973,000 11.31
$12.00 to $14.62 2,147,400 3.64 12.83 530,034 13.52
$14.70 to $16.50 92,000 1.12 15.35 92,000 15.35
7,264,734 2.85 11.79 2,595,034 11.90 The Company accounts for its share based compensation plan using the fair value method. Under this method, a compensation cost is charged over the vesting period for stock options granted to officers, directors and employees with a corresponding increase to contributed surplus. Progress has estimated a 10 percent forfeiture rate for the stock options. The fair value of the options granted during the three and six months ended June 30, 2011 and 2010 were estimated on the date of grant using a Black Scholes-Merton option pricing model with weighted average assumptions and resulting values for grants as follows:
Three Months Ended June 30
Six Months Ended June 30
Assumptions 2011 2010 2011 2010
Risk free interest rate (%) 1.55 2.22 1.64 2.32
Expected life (years) 3.00 3.83 3.00 3.83
Expected volatility (%) 38 47 42 47
Expected dividend yield (%) 2.7 3.2 3.2 3.2
Weighted average fair value of options granted ($) 3.20 3.80 2.95 3.88
The expected volatility is calculated based on historical trading prices of Progress since the Arrangement was completed on January 15, 2009. Share units The activity for the period January 1, 2010 to June 30, 2011 relating to the Company’s Share Unit Plan which includes both restricted units and performance units as described above, is as follows:
Restricted Units Balance, January 1, 2010 93,259 Granted 88,265 Settled (950) Forfeited (1,175) Balance, December 31, 2010 179,399 Granted - Settled (3,612) Forfeited (1,800) Balance, June 30, 2011 173,987

Progress Energy Resources Corp.
50
Vesting Date 2011 2,325 2012 87,072 2013 84,590 Total 173,987
Performance Units Balance, January 1, 2010 259,950 Granted 281,050 Settled (2,790) Forfeited (14,635) Balance, December 31, 2010 523,575 Forfeited (7,600) Balance, June 30, 2011 515,975
Vesting Date 2011 8,119 2012 247,618 2013 260,238 Total 515,975
On July 4, 2011 10,445 common shares were issued to settle those share units vesting under an employee’s initial grant. Subsequent to June 30, 2011, the Company granted 84,450 restricted units and 230,775 performance units. Share Appreciation Rights (SARs) ProEx had a Share Appreciation Rights (SARs) plan that allowed for the issuance of SARs to certain employees, which entitle the holder to receive a cash payment equal to the difference between the stated exercise price and the market price of common shares on the date of surrender. SARs vest equally over a three year period. The exercise price was based on the market price at the time of grant. At June 30, 2011, 65,000 (2010 – 65,000) SARs were outstanding at an average price of $13.99. Compensation expense relating to the SARs for the three and six months ended June 30, 2011 was $nil (2010 – $nil). Long Term Incentive Component of the Trust Awards granted under the LTI component will vest over three years with 40 percent vesting on the second anniversary of the date of grant and 60 percent vesting on the third anniversary of the date of grant. An additional 15 percent grant will be paid if the holder holds the common shares they receive on the second anniversary date for one additional year. For the six months ended June 30, 2011, 8,209 common shares were issued to settle LTI amounts that vested. As at June 30, 2011 5,394 common shares remain outstanding under the LTI component at an average value of approximately $17.13 per share.
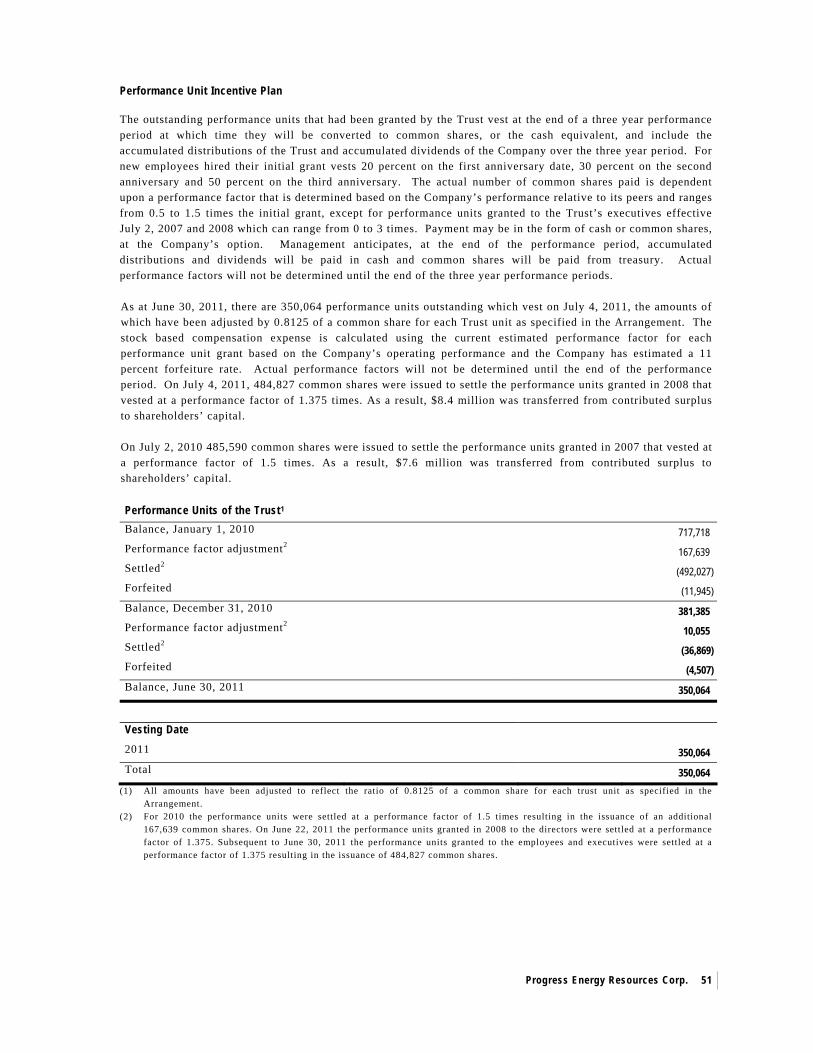
Progress Energy Resources Corp.
51
Performance Unit Incentive Plan The outstanding performance units that had been granted by the Trust vest at the end of a three year performance period at which time they will be converted to common shares, or the cash equivalent, and include the accumulated distributions of the Trust and accumulated dividends of the Company over the three year period. For new employees hired their initial grant vests 20 percent on the first anniversary date, 30 percent on the second anniversary and 50 percent on the third anniversary. The actual number of common shares paid is dependent upon a performance factor that is determined based on the Company’s performance relative to its peers and ranges from 0.5 to 1.5 times the initial grant, except for performance units granted to the Trust’s executives effective July 2, 2007 and 2008 which can range from 0 to 3 times. Payment may be in the form of cash or common shares, at the Company’s option. Management anticipates, at the end of the performance period, accumulated distributions and dividends will be paid in cash and common shares will be paid from treasury. Actual performance factors will not be determined until the end of the three year performance periods.
As at June 30, 2011, there are 350,064 performance units outstanding which vest on July 4, 2011, the amounts of which have been adjusted by 0.8125 of a common share for each Trust unit as specified in the Arrangement. The stock based compensation expense is calculated using the current estimated performance factor for each performance unit grant based on the Company’s operating performance and the Company has estimated a 11 percent forfeiture rate. Actual performance factors will not be determined until the end of the performance period. On July 4, 2011, 484,827 common shares were issued to settle the performance units granted in 2008 that vested at a performance factor of 1.375 times. As a result, $8.4 million was transferred from contributed surplus to shareholders’ capital. On July 2, 2010 485,590 common shares were issued to settle the performance units granted in 2007 that vested at a performance factor of 1.5 times. As a result, $7.6 million was transferred from contributed surplus to shareholders’ capital.
Performance Units of the Trust1 Balance, January 1, 2010 717,718 Performance factor adjustment2 167,639 Settled2 (492,027) Forfeited (11,945) Balance, December 31, 2010 381,385 Performance factor adjustment2 10,055 Settled2 (36,869) Forfeited (4,507) Balance, June 30, 2011 350,064
Vesting Date 2011 350,064 Total 350,064
(1) All amounts have been adjusted to reflect the ratio of 0.8125 of a common share for each trust unit as specified in the Arrangement.
(2) For 2010 the performance units were settled at a performance factor of 1.5 times resulting in the issuance of an additional 167,639 common shares. On June 22, 2011 the performance units granted in 2008 to the directors were settled at a performance factor of 1.375. Subsequent to June 30, 2011 the performance units granted to the employees and executives were settled at a performance factor of 1.375 resulting in the issuance of 484,827 common shares.
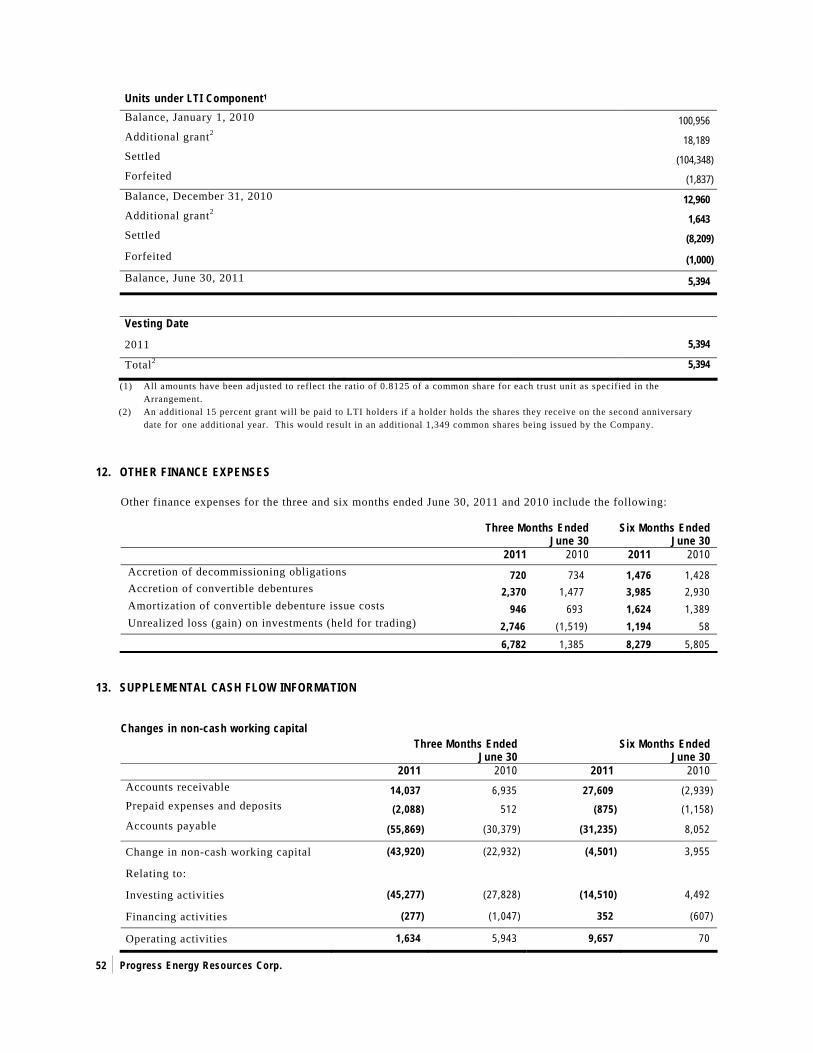
Progress Energy Resources Corp.
52
Units under LTI Component1 Balance, January 1, 2010 100,956 Additional grant2 18,189 Settled (104,348) Forfeited (1,837) Balance, December 31, 2010 12,960 Additional grant2 1,643 Settled (8,209) Forfeited (1,000) Balance, June 30, 2011 5,394
Vesting Date 2011 5,394
Total2 5,394
(1) All amounts have been adjusted to reflect the ratio of 0.8125 of a common share for each trust unit as specified in the Arrangement.
(2) An additional 15 percent grant will be paid to LTI holders if a holder holds the shares they receive on the second anniversary date for one additional year. This would result in an additional 1,349 common shares being issued by the Company.
12. OTHER FINANCE EXPENSES
Other finance expenses for the three and six months ended June 30, 2011 and 2010 include the following:
Three Months Ended June 30
Six Months Ended June 30
2011 2010 2011 2010 Accretion of decommissioning obligations 720 734 1,476 1,428
Accretion of convertible debentures 2,370 1,477 3,985 2,930 Amortization of convertible debenture issue costs 946 693 1,624 1,389 Unrealized loss (gain) on investments (held for trading) 2,746 (1,519) 1,194 58 6,782 1,385 8,279 5,805
13. SUPPLEMENTAL CASH FLOW INFORMATION
Changes in non-cash working capital Three Months Ended
June 30 Six Months Ended
June 30 2011 2010 2011 2010 Accounts receivable 14,037 6,935 27,609 (2,939) Prepaid expenses and deposits (2,088) 512 (875) (1,158) Accounts payable (55,869) (30,379) (31,235) 8,052
Change in non-cash working capital (43,920) (22,932) (4,501) 3,955
Relating to:
Investing activities (45,277) (27,828) (14,510) 4,492
Financing activities (277) (1,047) 352 (607)
Operating activities 1,634 5,943 9,657 70

Progress Energy Resources Corp.
53
14. FINANCIAL INSTRUMENTS
Fair Value of Financial Instruments The following tables provide fair value measurement information for financial assets and liabilities as of June 30, 2011 and December 31, 2010. The carrying value of cash and cash equivalents, accounts receivable, accounts payable and accrued liabilities, dividends payable and bank debt included in the consolidated statement of financial position approximate their fair value due to the short term nature of those instruments or the indexed rate of interest on the bank debt. These assets and liabilities, except cash and cash equivalents, are not included in the following tables. The fair value of the cash and cash equivalents, derivative natural gas contracts (“financial instruments”), investments and the convertible debentures as at June 30, 2011 and December 31, 2010 are as follows:
June 30, 2011 Carrying Amount
Fair Value
Quoted prices in active markets
(level 1)
Significant other observable inputs
(level 2)
Significant unobservable
inputs (level 3)
Financial assets:
Cash and cash equivalents 5,538 5,538 5,538 Investments 9,472 9,472 9,472 - - Financial liabilities: Convertible debentures1 475,396 491,835 - - - Derivative natural gas contracts 1,839 1,839 - 1,839 -
(1) Carrying value includes the debt and equity portion of the convertible debentures and excludes the deferred income tax impact of the debentures charged against the equity portion.
December 31, 2010 Carrying Amount
Fair Value
Quoted prices in active markets
(level 1)
Significant other observable inputs
(level 2)
Significant unobservable
inputs (level 3)
Financial assets:
Derivative natural gas contracts 3,928 3,928 - 3,928 - Investments 10,667 10,667 10,667 - - Financial liabilities: Convertible debentures1 277,570 278,708 - - -
(1) Carrying value includes the debt and equity portion of the convertible debentures and excludes the deferred income tax impact of the debentures charged against the equity portion.
All of Progress’ cash and cash equivalents, derivative natural gas contracts and investments are transacted in active markets. Progress classifies the fair value of these transactions according to the following hierarchy based on the amount of observable inputs used to value the instrument.
• Level 1 – Quoted prices are available in active markets for identical assets or liabilities as of the reporting date. Active markets are those in which transactions occur in sufficient frequency and volume to provide pricing information on an ongoing basis.
• Level 2 – Pricing inputs are other than quoted prices in active markets included in Level 1. Prices are either directly or indirectly observable as of the reporting date. Level 2 valuations are based on inputs, including quoted forward prices for commodities, time value and volatility factors, which can be substantially observed or corroborated in the marketplace.
• Level 3 – Valuations in this level are those with inputs for the asset or liability that are not based on observable market data.
In light of the current economic conditions, the Company continues to monitor its accounts receivable and its allowance for doubtful accounts. As at June 30, 2011 there have been no impairment issues. The Company has an allowance for doubtful accounts of approximately $0.9 million.
Progress Energy Resources Corp.
54
Investments include 8,300,000 Class A common shares of Seaview Energy Inc. (“Seaview”) and 431,379 shares of Crocotta Energy Inc. (“Crocotta”). Both investments have been classified as held for trading and are measured at fair value each reporting period. Based on Seaview’s closing trading price on June 30, 2011 of $0.99 per share, an unrealized loss of $3.0 million and $1.7 million, respectively, were recognized for the three and six months ended June 30, 2011 (2010 - $1.4 million gain and $0.3 million loss) on the revaluation of the shares to $8.2 million at June 30, 2011 (2010 - $8.8 million). The fair value of the investment in Crocotta, based on the closing trading price on June 30, 2011 of $2.91 per share, was $1.3 million (2010 - $0.7 million), resulting in an unrealized gain of $0.3 million and $0.5 million, respectively, for the three and six months ended June 30, 2011 (2010 - $0.1 million and $0.2 million gain).
Credit risk The Company’s accounts receivable are with customers and joint venture partners in the petroleum and natural gas business and are subject to normal credit risks. Concentration of credit risk is mitigated by marketing production to numerous purchasers under normal industry sale and payment terms. The Company routinely assesses the financial strength of its customers.
The Company may be exposed to certain losses in the event of non-performance by counterparties to commodity price contracts. The Company mitigates this risk by entering into transactions with highly rated major financial institutions.
At June 30, 2011, financial assets on the balance sheet are comprised of cash and cash equivalents, accounts receivables and held for trading investments.
The maximum credit exposure at June 30, 2011 is the carrying amount of cash and cash equivalents and accounts receivable of $42.2 million combined. The cash and cash equivalents are held by a major Canadian chartered bank with an investment grade credit rating. As is common in the petroleum and natural gas industry in western Canada, receivables relating to the sale of petroleum and natural gas are received on or about the 25th day of the following month. The Company markets its production to customers with investment grade credit ratings, if available in the area of production, or seeks parental guarantees and letters of credit. Included in accounts receivable is $26.2 related to the sale of petroleum and natural gas and was received April 25, 2011. The Company’s most significant customer, a Canadian petroleum and natural gas marketer, accounts for $6.4 million of the accounts receivable balance at June 30, 2011. The accounts receivable balance also includes $13.6 million from joint venture partners relating to the recovery of their interest in operating costs and capital spent. The largest amount owing from one partner was $4.2 million. As the operator of properties, Progress has the ability to not allocate production to joint venture partners who are in default of amounts owing. At June 30, 2011 the allowance for doubtful accounts was $0.9 million. Liquidity risk
Liquidity risk relates to the risk the Company will encounter difficulty in meeting obligations associated with its financial liabilities. The financial liabilities on its statement of financial position consist of accounts payable, bank debt and the Debentures. As described in note 8, Progress amended and restated its bank credit facility in the amount of $650 million to be a covenant-based facility rather than a borrowing base facility. The facility is a three year extendible revolving facility with a syndicate of lenders with an initial maturity of April 29, 2014. The Debentures mature on September 30, 2011, October 31, 2014 and June 30, 2016. The Company anticipates it will continue to have adequate liquidity to fund its financial liabilities through its future cash flows (see also “Management of Capital Structure” in note 11). The Company had no defaults or breaches on its bank debt or any of its financial liabilities. In addition, to achieve the objective of meeting obligations associated with its financial liabilities, the Company prepares annual capital expenditure budgets, which are regularly monitored and updated as considered necessary. As a result, the Company may adjust capital expenditures if necessary and may consider acquisition and disposition opportunities.
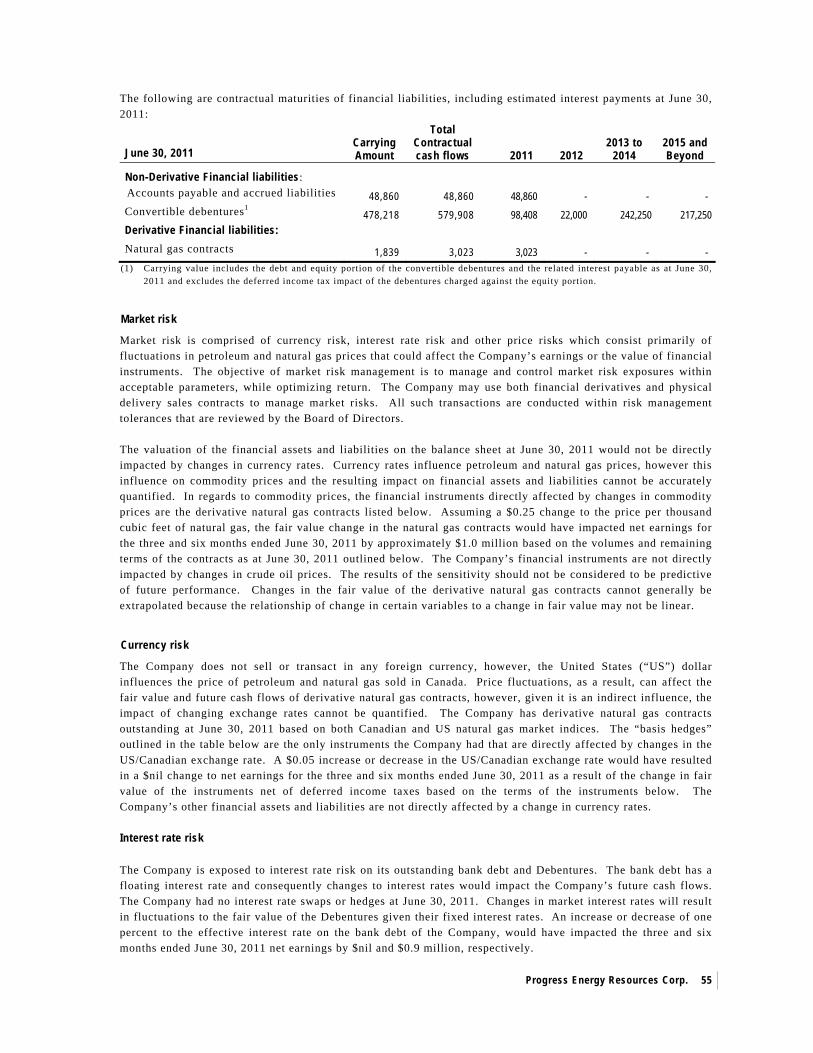
Progress Energy Resources Corp.
55
The following are contractual maturities of financial liabilities, including estimated interest payments at June 30, 2011:
June 30, 2011 Carrying Amount
Total Contractual cash flows 2011 2012
2013 to 2014
2015 and Beyond
Non-Derivative Financial liabilities:
Accounts payable and accrued liabilities 48,860 48,860 48,860 - - - Convertible debentures1 478,218 579,908 98,408 22,000 242,250 217,250 Derivative Financial liabilities: Natural gas contracts 1,839 3,023 3,023 - - -
(1) Carrying value includes the debt and equity portion of the convertible debentures and the related interest payable as at June 30, 2011 and excludes the deferred income tax impact of the debentures charged against the equity portion.
Market risk
Market risk is comprised of currency risk, interest rate risk and other price risks which consist primarily of fluctuations in petroleum and natural gas prices that could affect the Company’s earnings or the value of financial instruments. The objective of market risk management is to manage and control market risk exposures within acceptable parameters, while optimizing return. The Company may use both financial derivatives and physical delivery sales contracts to manage market risks. All such transactions are conducted within risk management tolerances that are reviewed by the Board of Directors.
The valuation of the financial assets and liabilities on the balance sheet at June 30, 2011 would not be directly impacted by changes in currency rates. Currency rates influence petroleum and natural gas prices, however this influence on commodity prices and the resulting impact on financial assets and liabilities cannot be accurately quantified. In regards to commodity prices, the financial instruments directly affected by changes in commodity prices are the derivative natural gas contracts listed below. Assuming a $0.25 change to the price per thousand cubic feet of natural gas, the fair value change in the natural gas contracts would have impacted net earnings for the three and six months ended June 30, 2011 by approximately $1.0 million based on the volumes and remaining terms of the contracts as at June 30, 2011 outlined below. The Company’s financial instruments are not directly impacted by changes in crude oil prices. The results of the sensitivity should not be considered to be predictive of future performance. Changes in the fair value of the derivative natural gas contracts cannot generally be extrapolated because the relationship of change in certain variables to a change in fair value may not be linear.
Currency risk
The Company does not sell or transact in any foreign currency, however, the United States (“US”) dollar influences the price of petroleum and natural gas sold in Canada. Price fluctuations, as a result, can affect the fair value and future cash flows of derivative natural gas contracts, however, given it is an indirect influence, the impact of changing exchange rates cannot be quantified. The Company has derivative natural gas contracts outstanding at June 30, 2011 based on both Canadian and US natural gas market indices. The “basis hedges” outlined in the table below are the only instruments the Company had that are directly affected by changes in the US/Canadian exchange rate. A $0.05 increase or decrease in the US/Canadian exchange rate would have resulted in a $nil change to net earnings for the three and six months ended June 30, 2011 as a result of the change in fair value of the instruments net of deferred income taxes based on the terms of the instruments below. The Company’s other financial assets and liabilities are not directly affected by a change in currency rates. Interest rate risk The Company is exposed to interest rate risk on its outstanding bank debt and Debentures. The bank debt has a floating interest rate and consequently changes to interest rates would impact the Company’s future cash flows. The Company had no interest rate swaps or hedges at June 30, 2011. Changes in market interest rates will result in fluctuations to the fair value of the Debentures given their fixed interest rates. An increase or decrease of one percent to the effective interest rate on the bank debt of the Company, would have impacted the three and six months ended June 30, 2011 net earnings by $nil and $0.9 million, respectively.
Progress Energy Resources Corp.
56
Commodity Price Risk
Commodity price risk is the risk that the fair value of financial instruments or future cash flows will fluctuate as a result of changes in commodity prices. Petroleum and natural gas prices are impacted by not only the relationship between the Canadian and US dollar but also world economic events that dictate the levels of supply and demand. The Company has entered into several financial instruments for the purpose of protecting its cash flow from operations before changes in non-cash working capital. The Company does not apply hedge accounting for these contracts. The Company’s production is usually sold using “spot” or near term contracts, with prices fixed at the time of transfer of custody or on the basis of a monthly average market price. For the three months ended June 30, 2011 the Company’s risk management program had a net realized loss of $0.9 million (2010 - $3.9 million gain). For the six months ended June 30, 2011 the Company’s risk management program had a net realized gain of $4.0 million (2010 - $3.0 million gain).
At June 30, 2011 the fair value of the derivative natural gas contracts, determined based on the amounts the Company would receive or pay to terminate the contracts was a liability of $1.8 million (2010 - $9.5 million asset), resulting in an unrealized loss of $1.7 million and $5.8 million for the three and six months ended June 30, 2011 (2010 - $7.9 million loss and $6.6 million gain). Contracts outstanding in respect to financial instruments are as follows: Natural gas
Contracts Volume Pricing Point
Strike Price $/gj Premium Term
Bought Put Option 5,000 gj/d AECO $3.610 $0.3400 Feb 1/11 to Oct 31/11 Bought Put Option 5,000 gj/d AECO $3.650 $0.3350 Feb 1/11 to Oct 31/11 Bought Put Option 5,000 gj/d AECO $3.830 $0.3570 Feb 1/11 to Oct 31/11
Bought Put Option 10,000 gj/d AECO $3.760 $0.3400 May 1/11 to Dec 31/11
Bought Put Option 10,000 gj/d AECO $3.785 $0.3475 May 1/11 to Dec 31/11
Bought Put Option 10,000 gj/d AECO $3.780 $0.3500 May 1/11 to Dec 31/11
Contracts Volume Pricing Point
Strike Price $/gj
Cost/ Premium Term
Swap – call spread 5,000 gj/d AECO $3.60 - $4.60 $0.26 Feb 1/11 to Oct 31/11 Swap – call spread 5,000 gj/d AECO $3.65 - $4.65 $0.26 Feb 1/11 to Oct 31/11 Swap – call spread 5,000 gj/d AECO $3.81 - $4.81 $0.26 Feb 1/11 to Oct 31/11
Contracts Volume Pricing Point Differential Term Swap – basis hedge 30,000 mmbtu/d Nymex ($0.5000) May 1/11 to Dec 31/11 Swap – basis hedge 10,000 mmbtu/d Nymex ($0.4950) May 1/11 to Dec 31/11
Swap – basis hedge 10,000 mmbtu/d Nymex ($0.6300) Jan 1/12 to Dec 31/12
Swap – basis hedge 10,000 mmbtu/d Nymex ($0.6250) Jan 1/12 to Dec 31/12 Swap – basis hedge 10,000 mmbtu/d Nymex ($0.6175) Jan 1/12 to Dec 31/12 Swap – basis hedge 10,000 mmbtu/d Nymex ($0.6150) Jan 1/12 to Dec 31/12
Contracts Volume Pricing Point Strike Price $/gj Term Sold Calls 10,000 gj/d AECO $7.575 Jan 1/11 to Dec 31/11 Sold Calls 10,000 gj/d AECO $7.500 Jan 1/11 to Dec 31/11
Progress Energy Resources Corp.
57
15. TRANSITION TO IFRS
Progress’ accounting policies under IFRS differ from those followed under previous GAAP. These accounting policies have been applied for the three and six months ended June 30, 2011 and the comparative information for the three and six months ended June 30, 2010.
The adjustments arising from the application of IFRS to amounts on the statement of financial position on the transition date and on transactions prior to that date, were recognized as an adjustment to the Company’s opening deficit category on the statement of financial position when appropriate.
On transition to IFRS on January 1, 2010 Progress used certain exemptions allowed under IFRS 1 “First Time Adoption of International Reporting Standards”. The exemptions used were:
Full Cost Accounting – IFRS 1 allows an entity that used full cost accounting under its previous GAAP to elect, at the time of adoption to IFRS, to measure oil and gas assets in the development and production phases by allocating the amount determined under the entity’s previous GAAP for those assets to the underlying assets pro rata using reserve volumes or reserve values as of that date. Progress has used reserve values as at January 1, 2010 to allocate the cost of development and production assets to CGUs.
Business Combinations – IFRS 1 allows an entity to use the IFRS rules for business combinations on a prospective basis rather than re-stating all business combinations. In respect of acquisitions prior to January 1, 2010, goodwill represents the amount recognized under the Company’s previous GAAP.
Share based compensation – IFRS 1 allows an entity an exemption on IFRS 2, “Share-Based Payments” to equity instruments which vested before Progress’ transition date to IFRS.
Decommissioning Obligation – As Progress elected to use the oil and gas exemption, a decommissioning obligation exemption was also used that allows for the remeasurement of decommissioning obligations on IFRS transition to be offset to retained earnings/deficit.
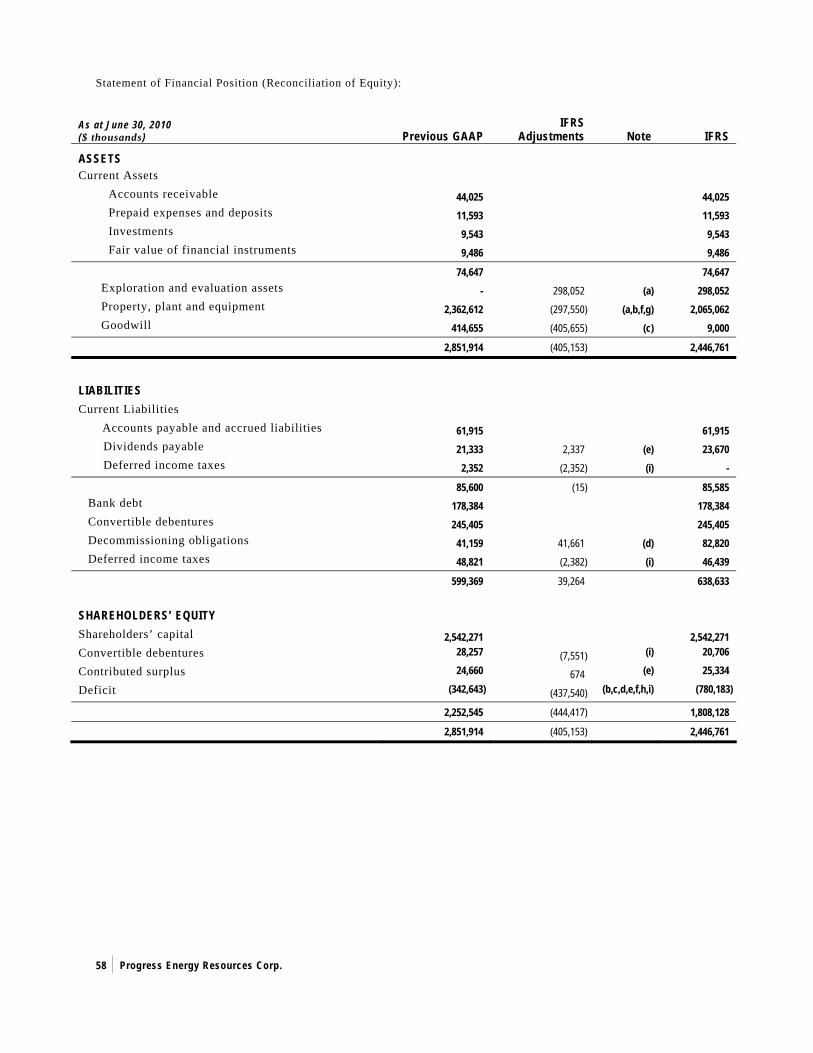
Progress Energy Resources Corp.
58
Statement of Financial Position (Reconciliation of Equity):
As at June 30, 2010 ($ thousands) Previous GAAP
IFRS Adjustments Note IFRS
ASSETS
Current Assets Accounts receivable 44,025 44,025 Prepaid expenses and deposits 11,593 11,593 Investments 9,543 9,543 Fair value of financial instruments 9,486 9,486 74,647 74,647
Exploration and evaluation assets - 298,052 (a) 298,052 Property, plant and equipment 2,362,612 (297,550) (a,b,f,g) 2,065,062 Goodwill 414,655 (405,655) (c) 9,000
2,851,914 (405,153) 2,446,761
LIABILITIES Current Liabilities Accounts payable and accrued liabilities 61,915 61,915
Dividends payable 21,333 2,337 (e) 23,670 Deferred income taxes 2,352 (2,352) (i) -
85,600 (15) 85,585 Bank debt 178,384 178,384 Convertible debentures 245,405 245,405 Decommissioning obligations 41,159 41,661 (d) 82,820 Deferred income taxes 48,821 (2,382) (i) 46,439
599,369 39,264 638,633 SHAREHOLDERS’ EQUITY Shareholders’ capital 2,542,271 2,542,271 Convertible debentures 28,257 (7,551) (i) 20,706
Contributed surplus 24,660 674 (e) 25,334
Deficit (342,643) (437,540) (b,c,d,e,f,h,i) (780,183)
2,252,545 (444,417) 1,808,128 2,851,914 (405,153) 2,446,761
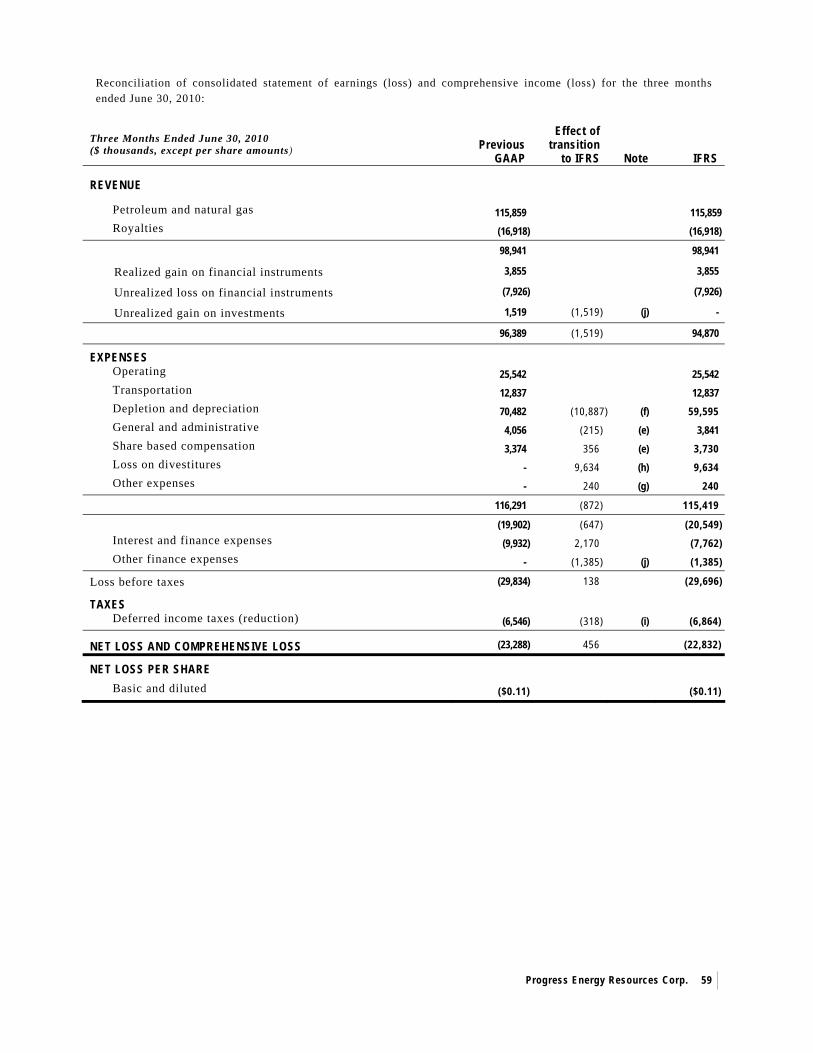
Progress Energy Resources Corp.
59
Reconciliation of consolidated statement of earnings (loss) and comprehensive income (loss) for the three months ended June 30, 2010:
Three Months Ended June 30, 2010 ($ thousands, except per share amounts) Previous
GAAP
Effect of transition
to IFRS Note IFRS REVENUE
Petroleum and natural gas 115,859 115,859 Royalties (16,918) (16,918)
98,941 98,941
Realized gain on financial instruments 3,855 3,855
Unrealized loss on financial instruments (7,926) (7,926)
Unrealized gain on investments 1,519 (1,519) (j) -
96,389 (1,519) 94,870
EXPENSES Operating 25,542 25,542 Transportation 12,837 12,837 Depletion and depreciation 70,482 (10,887) (f) 59,595 General and administrative 4,056 (215) (e) 3,841 Share based compensation 3,374 356 (e) 3,730 Loss on divestitures - 9,634 (h) 9,634 Other expenses - 240 (g) 240 116,291 (872) 115,419 (19,902) (647) (20,549) Interest and finance expenses (9,932) 2,170 (7,762) Other finance expenses - (1,385) (j) (1,385)
Loss before taxes (29,834) 138 (29,696)
TAXES Deferred income taxes (reduction) (6,546) (318) (i) (6,864)
NET LOSS AND COMPREHENSIVE LOSS (23,288) 456 (22,832)
NET LOSS PER SHARE
Basic and diluted ($0.11) ($0.11)
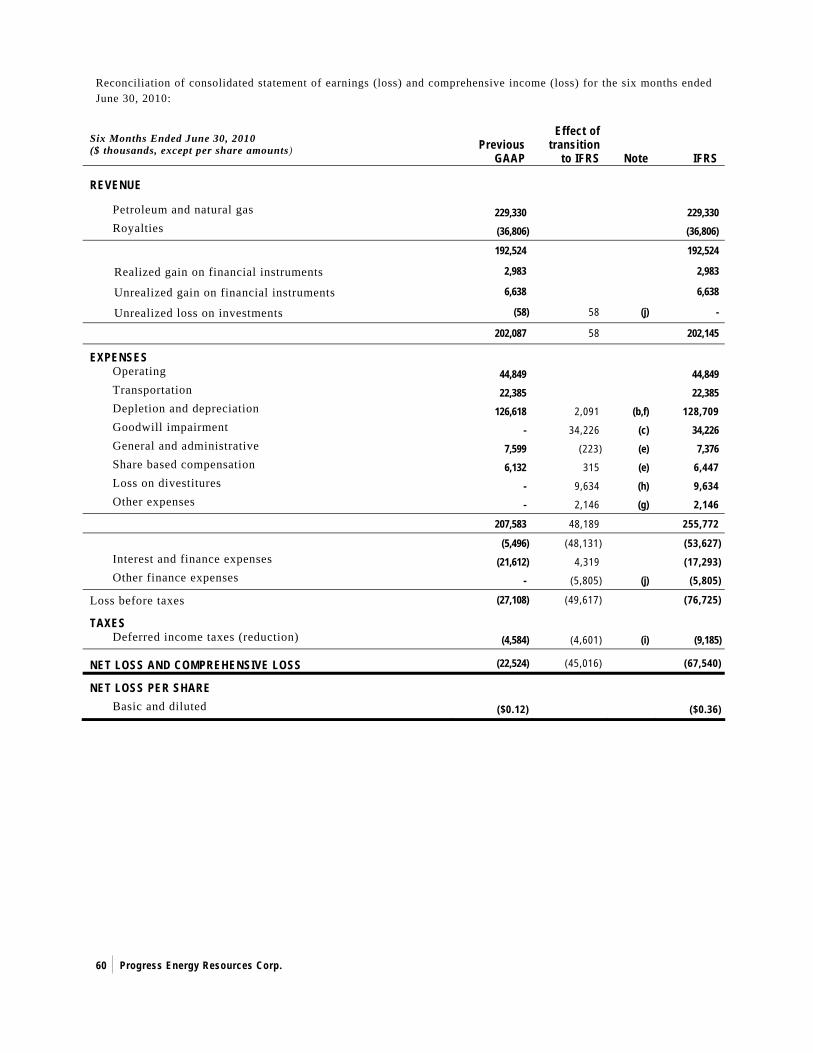
Progress Energy Resources Corp.
60
Reconciliation of consolidated statement of earnings (loss) and comprehensive income (loss) for the six months ended June 30, 2010:
Six Months Ended June 30, 2010 ($ thousands, except per share amounts) Previous
GAAP
Effect of transition
to IFRS Note IFRS REVENUE
Petroleum and natural gas 229,330 229,330 Royalties (36,806) (36,806)
192,524 192,524
Realized gain on financial instruments 2,983 2,983
Unrealized gain on financial instruments 6,638 6,638
Unrealized loss on investments (58) 58 (j) -
202,087 58 202,145
EXPENSES Operating 44,849 44,849 Transportation 22,385 22,385 Depletion and depreciation 126,618 2,091 (b,f) 128,709 Goodwill impairment - 34,226 (c) 34,226 General and administrative 7,599 (223) (e) 7,376 Share based compensation 6,132 315 (e) 6,447 Loss on divestitures - 9,634 (h) 9,634 Other expenses - 2,146 (g) 2,146 207,583 48,189 255,772 (5,496) (48,131) (53,627) Interest and finance expenses (21,612) 4,319 (17,293) Other finance expenses - (5,805) (j) (5,805)
Loss before taxes (27,108) (49,617) (76,725)
TAXES Deferred income taxes (reduction) (4,584) (4,601) (i) (9,185)
NET LOSS AND COMPREHENSIVE LOSS (22,524) (45,016) (67,540)
NET LOSS PER SHARE
Basic and diluted ($0.12) ($0.36)
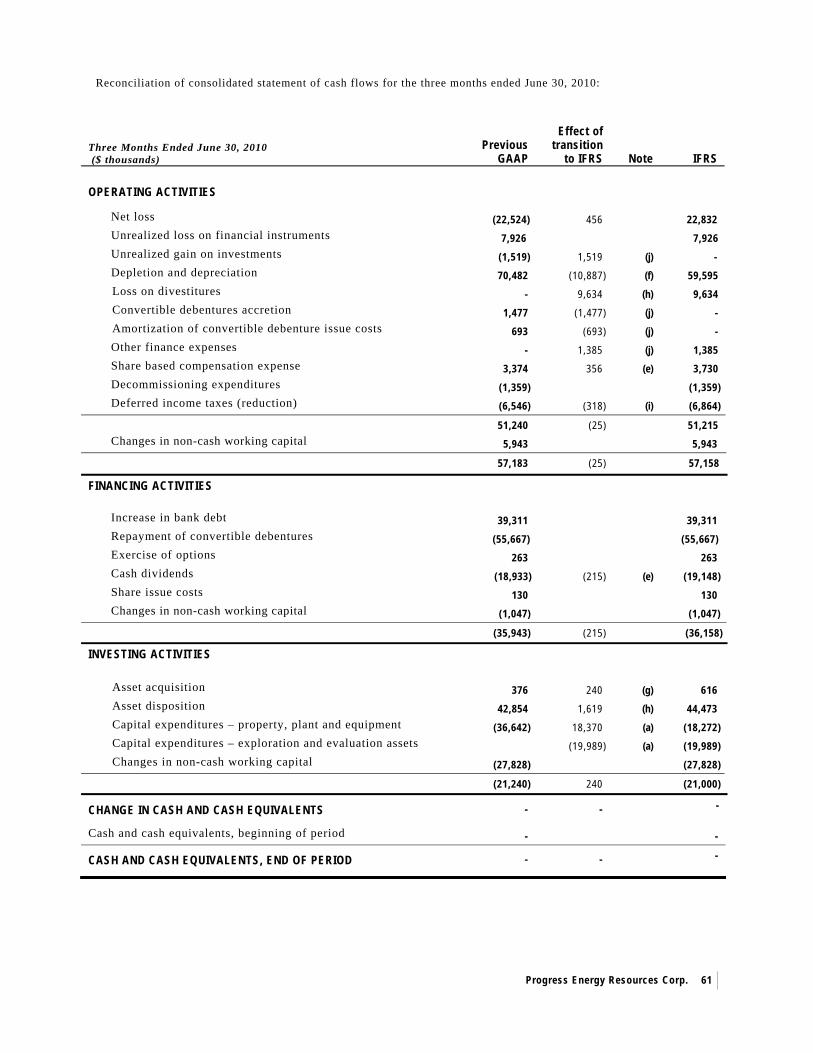
Progress Energy Resources Corp.
61
Reconciliation of consolidated statement of cash flows for the three months ended June 30, 2010:
Three Months Ended June 30, 2010 ($ thousands)
Previous GAAP
Effect of transition
to IFRS Note IFRS OPERATING ACTIVITIES
Net loss (22,524) 456 22,832 Unrealized loss on financial instruments 7,926 7,926 Unrealized gain on investments (1,519) 1,519 (j) - Depletion and depreciation 70,482 (10,887) (f) 59,595 Loss on divestitures - 9,634 (h) 9,634 Convertible debentures accretion 1,477 (1,477) (j) - Amortization of convertible debenture issue costs 693 (693) (j) - Other finance expenses - 1,385 (j) 1,385 Share based compensation expense 3,374 356 (e) 3,730 Decommissioning expenditures (1,359) (1,359) Deferred income taxes (reduction) (6,546) (318) (i) (6,864) 51,240 (25) 51,215 Changes in non-cash working capital 5,943 5,943
57,183 (25) 57,158
FINANCING ACTIVITIES
Increase in bank debt 39,311 39,311 Repayment of convertible debentures (55,667) (55,667) Exercise of options 263 263 Cash dividends (18,933) (215) (e) (19,148) Share issue costs 130 130 Changes in non-cash working capital (1,047) (1,047)
(35,943) (215) (36,158)
INVESTING ACTIVITIES
Asset acquisition 376 240 (g) 616 Asset disposition 42,854 1,619 (h) 44,473 Capital expenditures – property, plant and equipment (36,642) 18,370 (a) (18,272) Capital expenditures – exploration and evaluation assets (19,989) (a) (19,989) Changes in non-cash working capital (27,828) (27,828) (21,240) 240 (21,000)
CHANGE IN CASH AND CASH EQUIVALENTS - - -
Cash and cash equivalents, beginning of period - -
CASH AND CASH EQUIVALENTS, END OF PERIOD - - -
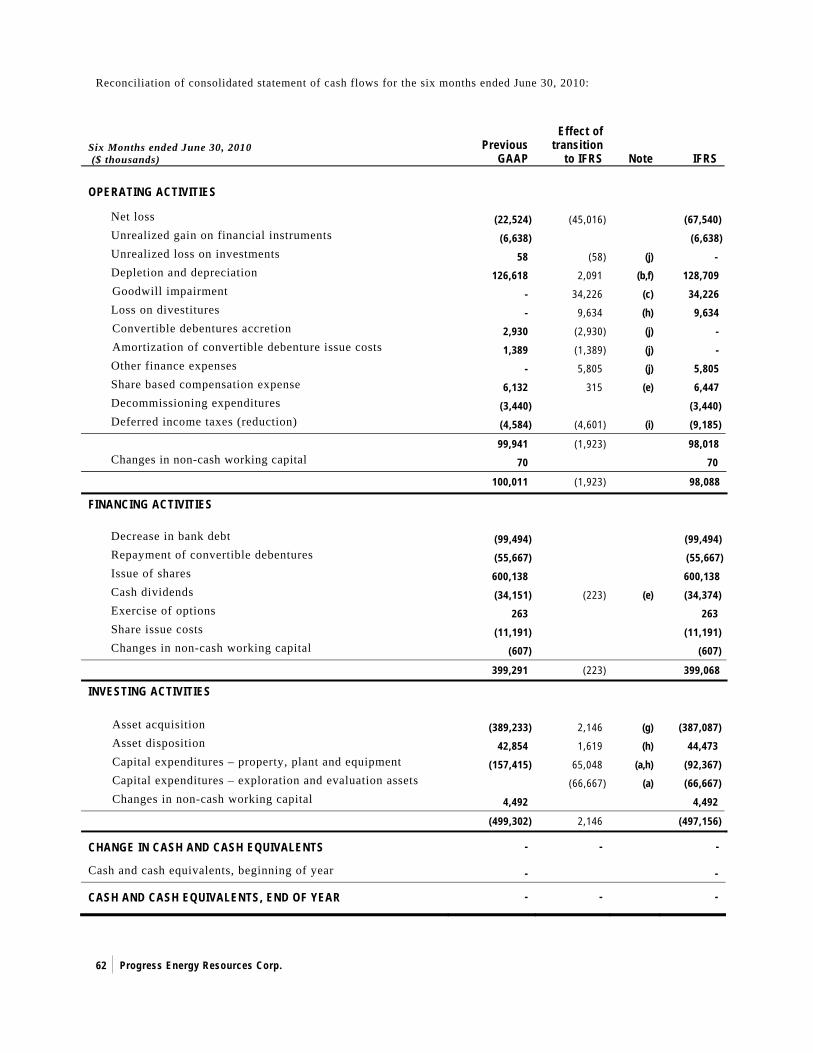
Progress Energy Resources Corp.
62
Reconciliation of consolidated statement of cash flows for the six months ended June 30, 2010:
Six Months ended June 30, 2010 ($ thousands)
Previous GAAP
Effect of transition
to IFRS Note IFRS OPERATING ACTIVITIES
Net loss (22,524) (45,016) (67,540) Unrealized gain on financial instruments (6,638) (6,638) Unrealized loss on investments 58 (58) (j) - Depletion and depreciation 126,618 2,091 (b,f) 128,709 Goodwill impairment - 34,226 (c) 34,226 Loss on divestitures - 9,634 (h) 9,634 Convertible debentures accretion 2,930 (2,930) (j) - Amortization of convertible debenture issue costs 1,389 (1,389) (j) - Other finance expenses - 5,805 (j) 5,805 Share based compensation expense 6,132 315 (e) 6,447 Decommissioning expenditures (3,440) (3,440) Deferred income taxes (reduction) (4,584) (4,601) (i) (9,185) 99,941 (1,923) 98,018 Changes in non-cash working capital 70 70
100,011 (1,923) 98,088
FINANCING ACTIVITIES
Decrease in bank debt (99,494) (99,494) Repayment of convertible debentures (55,667) (55,667) Issue of shares 600,138 600,138 Cash dividends (34,151) (223) (e) (34,374) Exercise of options 263 263 Share issue costs (11,191) (11,191) Changes in non-cash working capital (607) (607)
399,291 (223) 399,068
INVESTING ACTIVITIES
Asset acquisition (389,233) 2,146 (g) (387,087) Asset disposition 42,854 1,619 (h) 44,473 Capital expenditures – property, plant and equipment (157,415) 65,048 (a,h) (92,367) Capital expenditures – exploration and evaluation assets (66,667) (a) (66,667) Changes in non-cash working capital 4,492 4,492 (499,302) 2,146 (497,156)
CHANGE IN CASH AND CASH EQUIVALENTS - - -
Cash and cash equivalents, beginning of year - -
CASH AND CASH EQUIVALENTS, END OF YEAR - - -
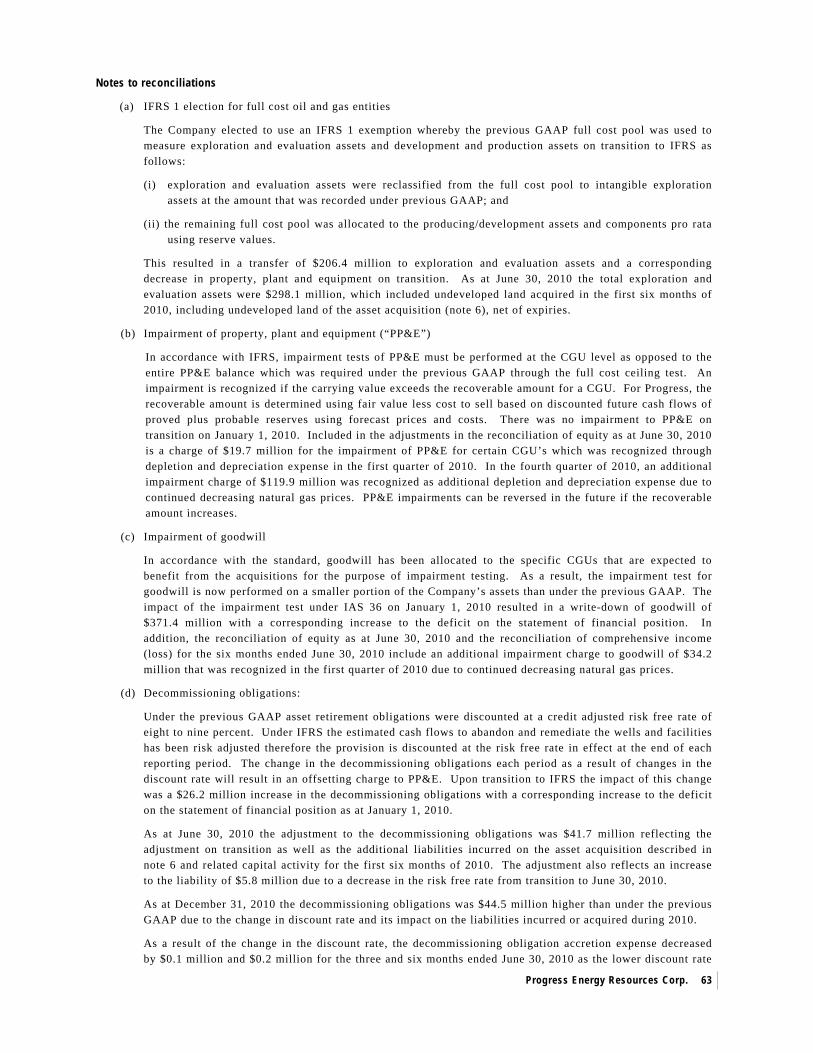
Progress Energy Resources Corp.
63
Notes to reconciliations
(a) IFRS 1 election for full cost oil and gas entities
The Company elected to use an IFRS 1 exemption whereby the previous GAAP full cost pool was used to measure exploration and evaluation assets and development and production assets on transition to IFRS as follows:
(i) exploration and evaluation assets were reclassified from the full cost pool to intangible exploration assets at the amount that was recorded under previous GAAP; and
(ii) the remaining full cost pool was allocated to the producing/development assets and components pro rata using reserve values.
This resulted in a transfer of $206.4 million to exploration and evaluation assets and a corresponding decrease in property, plant and equipment on transition. As at June 30, 2010 the total exploration and evaluation assets were $298.1 million, which included undeveloped land acquired in the first six months of 2010, including undeveloped land of the asset acquisition (note 6), net of expiries.
(b) Impairment of property, plant and equipment (“PP&E”)
In accordance with IFRS, impairment tests of PP&E must be performed at the CGU level as opposed to the entire PP&E balance which was required under the previous GAAP through the full cost ceiling test. An impairment is recognized if the carrying value exceeds the recoverable amount for a CGU. For Progress, the recoverable amount is determined using fair value less cost to sell based on discounted future cash flows of proved plus probable reserves using forecast prices and costs. There was no impairment to PP&E on transition on January 1, 2010. Included in the adjustments in the reconciliation of equity as at June 30, 2010 is a charge of $19.7 million for the impairment of PP&E for certain CGU’s which was recognized through depletion and depreciation expense in the first quarter of 2010. In the fourth quarter of 2010, an additional impairment charge of $119.9 million was recognized as additional depletion and depreciation expense due to continued decreasing natural gas prices. PP&E impairments can be reversed in the future if the recoverable amount increases.
(c) Impairment of goodwill
In accordance with the standard, goodwill has been allocated to the specific CGUs that are expected to benefit from the acquisitions for the purpose of impairment testing. As a result, the impairment test for goodwill is now performed on a smaller portion of the Company’s assets than under the previous GAAP. The impact of the impairment test under IAS 36 on January 1, 2010 resulted in a write-down of goodwill of $371.4 million with a corresponding increase to the deficit on the statement of financial position. In addition, the reconciliation of equity as at June 30, 2010 and the reconciliation of comprehensive income (loss) for the six months ended June 30, 2010 include an additional impairment charge to goodwill of $34.2 million that was recognized in the first quarter of 2010 due to continued decreasing natural gas prices.
(d) Decommissioning obligations:
Under the previous GAAP asset retirement obligations were discounted at a credit adjusted risk free rate of eight to nine percent. Under IFRS the estimated cash flows to abandon and remediate the wells and facilities has been risk adjusted therefore the provision is discounted at the risk free rate in effect at the end of each reporting period. The change in the decommissioning obligations each period as a result of changes in the discount rate will result in an offsetting charge to PP&E. Upon transition to IFRS the impact of this change was a $26.2 million increase in the decommissioning obligations with a corresponding increase to the deficit on the statement of financial position as at January 1, 2010.
As at June 30, 2010 the adjustment to the decommissioning obligations was $41.7 million reflecting the adjustment on transition as well as the additional liabilities incurred on the asset acquisition described in note 6 and related capital activity for the first six months of 2010. The adjustment also reflects an increase to the liability of $5.8 million due to a decrease in the risk free rate from transition to June 30, 2010.
As at December 31, 2010 the decommissioning obligations was $44.5 million higher than under the previous GAAP due to the change in discount rate and its impact on the liabilities incurred or acquired during 2010.
As a result of the change in the discount rate, the decommissioning obligation accretion expense decreased by $0.1 million and $0.2 million for the three and six months ended June 30, 2010 as the lower discount rate
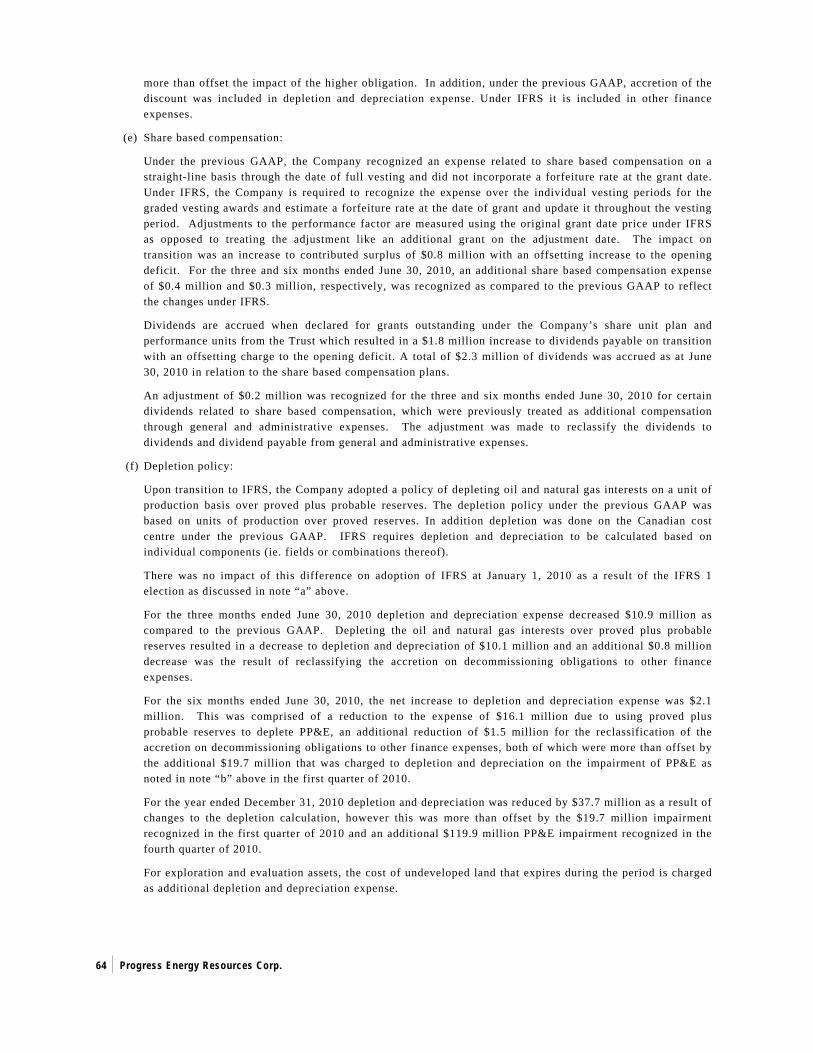
Progress Energy Resources Corp.
64
more than offset the impact of the higher obligation. In addition, under the previous GAAP, accretion of the discount was included in depletion and depreciation expense. Under IFRS it is included in other finance expenses.
(e) Share based compensation:
Under the previous GAAP, the Company recognized an expense related to share based compensation on a straight-line basis through the date of full vesting and did not incorporate a forfeiture rate at the grant date. Under IFRS, the Company is required to recognize the expense over the individual vesting periods for the graded vesting awards and estimate a forfeiture rate at the date of grant and update it throughout the vesting period. Adjustments to the performance factor are measured using the original grant date price under IFRS as opposed to treating the adjustment like an additional grant on the adjustment date. The impact on transition was an increase to contributed surplus of $0.8 million with an offsetting increase to the opening deficit. For the three and six months ended June 30, 2010, an additional share based compensation expense of $0.4 million and $0.3 million, respectively, was recognized as compared to the previous GAAP to reflect the changes under IFRS.
Dividends are accrued when declared for grants outstanding under the Company’s share unit plan and performance units from the Trust which resulted in a $1.8 million increase to dividends payable on transition with an offsetting charge to the opening deficit. A total of $2.3 million of dividends was accrued as at June 30, 2010 in relation to the share based compensation plans.
An adjustment of $0.2 million was recognized for the three and six months ended June 30, 2010 for certain dividends related to share based compensation, which were previously treated as additional compensation through general and administrative expenses. The adjustment was made to reclassify the dividends to dividends and dividend payable from general and administrative expenses.
(f) Depletion policy:
Upon transition to IFRS, the Company adopted a policy of depleting oil and natural gas interests on a unit of production basis over proved plus probable reserves. The depletion policy under the previous GAAP was based on units of production over proved reserves. In addition depletion was done on the Canadian cost centre under the previous GAAP. IFRS requires depletion and depreciation to be calculated based on individual components (ie. fields or combinations thereof).
There was no impact of this difference on adoption of IFRS at January 1, 2010 as a result of the IFRS 1 election as discussed in note “a” above.
For the three months ended June 30, 2010 depletion and depreciation expense decreased $10.9 million as compared to the previous GAAP. Depleting the oil and natural gas interests over proved plus probable reserves resulted in a decrease to depletion and depreciation of $10.1 million and an additional $0.8 million decrease was the result of reclassifying the accretion on decommissioning obligations to other finance expenses.
For the six months ended June 30, 2010, the net increase to depletion and depreciation expense was $2.1 million. This was comprised of a reduction to the expense of $16.1 million due to using proved plus probable reserves to deplete PP&E, an additional reduction of $1.5 million for the reclassification of the accretion on decommissioning obligations to other finance expenses, both of which were more than offset by the additional $19.7 million that was charged to depletion and depreciation on the impairment of PP&E as noted in note “b” above in the first quarter of 2010.
For the year ended December 31, 2010 depletion and depreciation was reduced by $37.7 million as a result of changes to the depletion calculation, however this was more than offset by the $19.7 million impairment recognized in the first quarter of 2010 and an additional $119.9 million PP&E impairment recognized in the fourth quarter of 2010.
For exploration and evaluation assets, the cost of undeveloped land that expires during the period is charged as additional depletion and depreciation expense.
Progress Energy Resources Corp.
65
(g) Business combinations
In accordance with IFRS, internal transaction costs incurred on a business combination are expensed. Under the previous GAAP, these costs were capitalized as part of the acquisition. As a result, $0.2 million and $2.1 million was charged to other expenses for transaction costs incurred on the Asset Acquisition for the three and six months ended June 30, 2010.
(h) Gains and losses on divestitures
Under previous GAAP, proceeds from divestitures were deducted from the full cost pool without recognition of a gain or loss unless the deduction resulted in a change in the depletion rate of 20 percent or greater, in which case a gain or loss was recorded. Under IFRS, gains and losses are recorded on divestitures and are calculated as the difference between the proceeds and the net book value of the asset disposed. For the three and six months ended June 30, 2010, Progress recognized a $9.6 million net loss sale of its central Alberta properties on June 30, 2010. On the statement of cash flows for the three and six months ended June 30, 2010, the proceeds for the central Alberta disposition were increased by $1.6 million for a second minor disposition in central Alberta, previously deducted from the full cost pool.
(i) Deferred income taxes:
The adjustment to deferred income taxes on transition relates to both the opening adjustment to the decommissioning obligations and the treatment of temporary differences on convertible debentures. The opening adjustment for the decommissioning obligations was charged through the deficit on the statement of financial position thereby creating a temporary difference on the liability. The deferred income tax impact of the opening adjustment was a deferred income tax asset of $6.5 million.
Under IFRS, the equity portion of the convertible debenture is treated as a temporary difference and deferred income tax is recognized. As the discounted amount is accreted up to the principal balance over time, the accretion results in a reversal of the temporary difference and reduction to the deferred tax liability originally recognized. A deferred income tax liability of $6.5 million was recognized on transition.
Under IFRS there is no requirement to separate the portion of deferred income taxes related to current assets or liabilities. The amounts previously classified as current have been reclassified to long-term.
Adjustments to deferred income taxes have been made in regards to the adjustments noted above that resulted in a change to the temporary difference between tax and accounting values.
(j) Finance expenses
Under IFRS, finance expenses are separately reported in the statement of earnings and comprehensive income. Interest and financing expenses and other finance expenses are now reported below the first group of expenses on the statement of earnings and comprehensive income. Other finance expenses include the accretion and amortized issue costs of the Debentures, the accretion on the decommissioning obligations and unrealized gains or losses on investments.
(k) Major turnaround and overhaul expenditures
Under IFRS Progress capitalizes the cost of major plant turnarounds and overhauls and depreciates these costs over their useful life. Previously these were charged to operating expenses. No amount was capitalized for the three and six months ended June 30, 2010.

Progress Energy Resources Corp.
66
2011 SELECTED QUARTERLY INFORMATION FINANCIAL HIGHLIGHTS
(unaudited) 2010 2011
($ thousands except per share amounts) March 31 June 30 Sept. 30 Dec. 31 March 31 June 30
Income Statement
Petroleum and natural gas revenue 113,471 115,859 105,305 107,957 117,115 117,340 Cash flow (1) 46,803 51,215 44,764 59,115 63,320 54,618 Per share – diluted 0.28 0.24 0.21 0.27 0.29 0.24 Cash dividends declared(2) 21,415 21,945 22,886 21,594 23,087 23,184 Per share 0.10 0.10 0.10 0.10 0.10 0.10 Net earnings (44,708) (22,832) (7,644) (104,184) 1,626 (11,436) Per share – basic and diluted (0.27) (0.11) (0.04) (0.49) 0.01 (0.05) Capital Investment
Total capital expenditures 120,773 38,261 107,689 100,817 140,340 46,037
Asset Acquisitions(3) 387,703 (616) - - - - Asset Dispositions(4) - (44,473) 680 140 (17,028) (18,316) Total Debt
Working capital deficiency (surplus) 44,456 20,424 59,320 21,271 23,339 14,209 Bank debt 139,074 178,384 218,133 312,508 0 0 Convertible debentures 298,902 245,405 247,355 249,313 421,350 424,761
Total debt 482,432 444,213 524,808 583,092 444,689 438,970
Shareholders' capital 2,537,951 2,542,271 2,555,642 2,561,807 2,763,811 2,103,250
Common Shares (thousands except where otherwise stated)
Shares outstanding, end of period 213,014 213,330 214,296 214,877 229,851 230,529 Weighted average shares - basic 165,896 213,259 214,222 214,787 219,334 230,397 Weighted average shares - diluted 166,763 214,004 214,735 215,430 220,179 232,000
Common Share Trading Statistics ($) High 14.70 12.97 12.95 13.15 14.84 15.65 Low 11.25 10.67 10.86 10.30 11.88 13.60 Closing 11.77 12.37 11.67 12.70 13.96 13.73 Share volume traded (thousands) 49,171 58,964 42,396 41,164 47,742 53,836
(1) Cash flow represents the cash flow from operations before changes in non-cash working capital, which as presented does not have any standardized meaning prescribed by IFRS and therefore it may not be comparable with the calculation of similar measures for other entities. (2) The dividends declared include distributions and dividends that grantees are entitled to on the vesting of the Share Unit Plan, the Long Term Incentive Plan and the Performance Unit Incentive Plan. (3) Foothills asset acquisition on March 31, 2010. (4) West Central Alberta asset disposition on June 30, 2010.

Progress Energy Resources Corp.
67
2011 SELECTED QUARTERLY INFORMATION
Operational Highlights 2010 2011 (unaudited) March 31 June 30 Sept. 30 Dec. 31 March 31 June 30 Daily Production Natural gas (mcf/d) 178,993 226,898 222,540 225,594 233,488 209,202 Crude oil (bbls/d) 1,812 2,014 1,872 2,127 2,033 2,122 Natural gas liquids (bbls/d) 3,426 3,690 3,373 2,974 3,408 3,747 Total daily production (boe/d) 35,070 43,520 42,335 42,700 44,356 40,736 Average Realized Prices Natural gas ($/mcf) 5.27 4.03 3.78 3.68 3.85 3.91 Crude oil ($/bbl) 75.33 72.97 69.79 74.79 82.89 99.21 Natural gas liquids ($/bbl) 52.68 56.40 51.35 60.48 67.85 66.57 Highlights ($/boe) Weighted average sales price (1) 35.95 29.25 27.04 27.48 29.34 31.65 Realized gain (loss) on financial instruments (0.28) 0.97 1.47 1.88 1.21 (0.23) Royalties (6.30) (4.27) (4.12) (3.93) (3.13) (4.35) Operating expenses (6.12) (6.45) (6.07) (5.58) (5.38) (5.75) Transportation expenses (3.02) (3.24) (3.24) (3.22) (3.13) (3.41)
Operating Netbacks 20.23 16.26 15.08 16.63 18.91 17.91 General and administrative expense (1.12) (0.97) (0.93) (0.77) (0.97) (0.97) Stock based compensation expense (0.86) (0.94) (0.72) (0.71) (0.71) (0.55) Goodwill impairment (10.85) - - - - - Unrealized gain (loss) on financial instruments 4.61 (2.00) 0.29 (1.71) (1.03) (0.45)
Gain (loss) on divestitures - (2.44) 0.14 0.38 1.29 (1.79) Other expenses (0.60) (0.05) - - - -
Depletion and depreciation (21.90) (15.05) (14.14) (46.14) (14.60) (14.03)
(10.49) (5.19) (0.28) (32.32) 2.89 0.12
Interest and finance expenses (3.01) (1.96) (1.61) (1.82) (1.91) (2.10) Other finance expenses (1.40) (0.35) (0.52) (0.60) (0.38) (1.83)
Net earnings (loss) before taxes (14.90) (7.50) (2.41) (34.74) 0.60 (3.81) Deferred income taxes (reduction) (0.74) (1.73) (0.45) (8.22) 0.19 (0.72)
Net earnings (loss) (14.16) (5.77) (1.96) (26.52) 0.41 (3.09) (1) Includes sulphur net revenue with no associated production as no conversion exists for tons to boe.

Progress Energy Resources Corp.
68
CORPORATE INFORMATION OF PROGRESS ENERGY RESOURCES CORP.
DIRECTORS David D. Johnson Chairman Progress Energy Resources Corp. Calgary, Alberta Donald F. Archibald (1)(4) President Cypress Energy Corp. Calgary, Alberta John A. Brussa (3)(4) Partner Burnet, Duckworth and Palmer LLP Calgary, Alberta Howard J. Crone (1)(2) Executive Vice President & COO Cequence Energy Ltd. Calgary, Alberta Michael R. Culbert President and CEO Progress Energy Resources Corp. Calgary, Alberta R. Scott Lawrence(1) Vice President – Head of Relationship Investments of Canadian Pension Plan Investment Board Toronto, Ontario Brian A. McLachlan(2)(3) President & CEO Yoho Resources Inc. Calgary, Alberta Gary E. Perron (1)(3) Senior Vice President and Managing Director BMO Nesbitt Burns Calgary, Alberta Terrance D. Svarich(2)(4) President Devsun Ltd. Calgary, Alberta (1 ) Member of Audit Committee (2 ) Member of Reserve Committee (3 ) Member of Compensation Committee (4 ) Member of Corporate Governance and Nominating
Committee Environment, Health and Safety matters are addressed by the entire Board of Directors
OFFICERS Michael R. Culbert President and CEO Daniel C. Topolinsky Executive Vice President, Exploration and Development Greg W. Kist Vice President, Investor Relations and Marketing Art A. MacNichol Vice President, Finance & Chief Financial Officer Gary A. Miller Vice President, Operations Cindy R. Rutherford Vice President, Land James L. Stannard Vice President, Engineering Gary R. Bugeaud Secretary
CORPORATE OFFICE
1200, 205 – 5th Avenue S.W. Calgary, Alberta T2P 2V7 Telephone: (403) 216-2510 Fax: (403) 216-2514
TRUSTEE AND TRANSFER AGENT Computershare Trust Company of Canada Calgary, Alberta
STOCK EXCHANGE The Toronto Stock Exchange trading symbols: Common Shares- PRQ 6.25% Debentures – PRQ.DB.A 5.25% Debentures – PRQ.DB.B 5.75% Debentures –PRQ.DB.C
SOLICITOR Burnet, Duckworth & Palmer LLP Calgary, Alberta
AUDITOR KPMG LLP Calgary, Alberta
CONSULTING ENGINEERS GLJ Petroleum Consultants Calgary, Alberta INVESTOR RELATIONS Greg Kist Vice President, Investor Relations and Marketing 403-539-1809 [email protected] or toll free at 1-866-216-2510 (in Canada only) [email protected] Visit our website at www.progressenergy.com

Progress Energy Resources Corp.
69