programming of proforma used in the simulation of solar dryer
TRANSCRIPT

Uniabuja Journal of Engineering and Technology Vol. 1 (1), 2021; p. xxx
ISSN: 2714-3236 (Online); 2714-3228 (Print); http://uniabuja.ujet.ng
Received: 27-04-2020 / Accepted: 25-06-2021 /Published: 28-06-2021
19
Programming Of Proforma Used in the Simulation of Solar Dryer
Isaac. AJUNWA1, Danjuma. S. YAWAS1, Dangana. M. KULLA1, Ibrahim. U. IBRAHIM1*, Albright. A. EDET1, Inniyaka. R. IRMIYA1, and Najib. A. ISMAIL1
1Department of Mechanical Engineering, Ahmadu Bello University Zaria, Nigeria
* Corresponding author: [email protected]
Abstract The need for simulation cannot be over-emphasized. Project feasibility births the need for simulation. The simulation, therefore, creates a research path to save cost, provide initial design data for a project, and ensuring the success of the project. One good tool for running a simulation with TRNSYS which is observed wanting in research works is developed proformas in FORTRAN/C++. This work, therefore, aims at creating or developing a programming proforma used in the simulation of the solar dryer with TRNSYS 16.1. This simulation tool was used to mimic real-time scenario of solar insolation on solar harvesters as well as other functions besides solar power drives was used to simulate the performance of a solar dryer with the proformas created with FORTRAN/C++ programming language. To achieve this, adopted and derived mathematical equations critical to the proformas functionality using the FORTRAN/C++ programming language were used. The system’s performance in terms of the moisture content, drying rate, collector efficiency, and drying efficiency modeled using FORTRAN and simulated in TRNYSIS 16.1 showed that 5.49%, 2.86×10⁻⁵ kg/s, 44.24%, and 29.38% were respectively obtained for the moisture content, drying rate, collector efficiency, and drying efficiency. When compared to the experimental values results shows there is a small difference between these performance parameters values and the Experimental values. Keywords Simulation, TRNSYS, proformas, FORTRAN, mimic, solar harvesters.
1.0 Introduction The activities of post-harvesting of farm produce especially drying is
one major crop preservation method employed to see that crops are preserved with little or no nutritional value loss and made valuable in times of scarcity (control market). It is a well-known fact that the availability of most crops in Nigeria and other countries around the world is seasonal. Therefore, there is a need to preserve them in times of abundance for use in times of scarcity. Unfortunately, in Nigeria and many other developing countries, there is a lack of these processing and storage facilities. Weiss and Buchinger (2002) suggested

AJUNWA, I., et al./ UJET/ Vol. 1 (2), (2021, xx-xx
20
that locally made solar dryers of low cost can provide a means of reducing postharvest wastages.
Globally, today there has been an increase in the awareness that renewable energy plays an important role in extending technology to the farmers in developing nations to increase their yields (Waewsak et al., 2006; Ibrahim 2016). The technology of solar energy is a technique that is quickly gaining acceptability as a means of saving energy in agricultural applications. As an alternative source of energy, Bolaji and Olalusi (2008) reported that it is preferred because it is in abundance, renewable and non-polluting.
Recently, the traditional method of drying crops has been widely replaced with mechanized dryers, which have their source of heat or power-driven by electricity/fossil fuels. Although, the mechanized drying process is much faster, uses less drying area than the open sun drying process, the equipment is very expensive and requires a substantial quantity of fossil fuel to operate (Matthew and Schwarz, 200l). It is reported that crops normally cultivated in developing nations may be suited for solar drying than for fossil fuel drying systems because case-hardening is likely to be less at a low temperature of solar drying (Ezekwe, 1995). The rise in the cost of fossil fuels, the uncertainty of its availability, and the emission it produces has indeed necessitated a serious quest for a relatively safe and cheap alternative to agricultural product drying – the use of the solar dryer.
Simulation can be employed to determine the extent of application of these dryers in achieving a drying process with TRNSYS 16.1. software however has no inbuilt “dryer” simulation studio tool among its processing components but allows for the importation of codes written in other software for the “dryer” component. Base on this, codes were created with the FORTRAN/C++ programming language and used in the simulation of a solar dryer. Therefore, these codes are presented in this work. Few models have been presented in reviewed works across the globe.
Karim and Hawlader (2005) developed a mathematical model to solve the heat and mass transfer equations for drying of convective tropical fruits. The predicted results from their model were compared with experimental data for banana slices drying. The experimental results were reported to validate the model developed. Kooli et al., (2007) also analyze red pepper drying in greenhouse conditions and open sun using a model for drying experiments at constant laboratory conditions and varying outdoor conditions. It was reported that the drying process was overestimated by the laboratory model.

AJUNWA, I., et al./ UJET/ Vol. 1 (2), (2021, xx-xx
21
Simulation of a solar crop dryer for agricultural products drying was developed by Habtamu (2007). Results of the system simulation were presented in a graphical form suitable for system performance determination. A model developed reduced the initial moisture content of local cereal from a range of about 16–30% to the final moisture content range of 10–12% wet basis. However, the materials at the entrance are dried, while those at the exhaust are under-dried.
Forson et al., (2007) present a mathematical model for agricultural products drying in a natural convection solar dryer. Experimental data were compared with the results of the simulation performed with the model. The model was reported to predict the performance of the dryer fairly. Janjai et al., (2008) also simulated the performance of a solar dryer used for drying herbs and spices. The simulated air temperatures at the collector outlet were reported to agree with the observed air temperatures. The experimental and the simulated moisture contents also gave good agreement.
Kituu et al., (2010) developed and simulated in Visual Basic 6 mathematical models for predicting the plenum chamber temperatures in a solar tunnel dryer for Tilapia fish (Oreochromisniloticus) drying. For the t-test, the actual data and the simulated result for both plenum chamber temperature and moisture ratio did not differ significantly at a 5% level of significance. The simulated and the actual moisture ratios were also reported to show a similar trend and exponentially reduced with time. Musa (2016) designed, constructed, and simulated using TRANSYS and Engineering Equation Solver (EES) a 6 kg indirect passive solar dryer for tomatoes. The test of the dryer shows that the percentage moisture loss was 92.4% wet basis. The calculated system drying efficiency and the collector efficiency were 69.6% and 31.33%. The simulated results were compared with the experimental results to determine the level of agreement between the experimental and the simulated results. However, there was a significant variation of drying rates with the coordinate position of the trays. Wilkins et al., (2018) reported on a kiln-dried fruit model which they used in predicting drying time. A set of linear and quadratic models for drying rate were tested with the best yielding a 39% reduction in Root Means Square Error (RMSE) over traditional models. The results also showed that the modelling approach is likely to be useful for open solar dryers where the temperature and the drying rate are not controlled.
Tarigan (2018) presents the mathematical modeling and simulation of a solar agricultural dryer with a backup biomass burner and thermal storage. Thermodynamic and numerical simulations of the solar collector and drying

AJUNWA, I., et al./ UJET/ Vol. 1 (2), (2021, xx-xx
22
chamber are performed, while the backup heater operation is simulated using a computational fluid dynamics (CFD) simulation. The computed results showed that there is a small difference in temperature between the bottom three trays, while the temperature on the top tray is significantly higher. The CFD simulation showed that the average drying air temperature in the drying chamber was 56 °C, which is suitable for the drying of agricultural products.
Moradi et al., (2019) evaluated the drying kinetics of mint leaves in a newly introduced solar dryer. To assess the drying kinetics of mint leaves, 11 semi-empirical models were applied to find the best-fitted thin-layer drying model. It was reported that an approximation of the diffusion model recorded the highest correlation (R2 = 0.98, root mean square error = 0.041, k2 = 0.0017) with the experimental moisture ratio than the other models.
Suherman et al., (2020) evaluated fitting models in a hybrid solar dryer system for cassava drying. In comparison of the fitting models, it was reported that the Page model was the most suitable model for describing the experimental drying performances. The effective diffusivity constant and the activation energy during the drying process from the temperature of50 °C to 60 °C were respectively calculated as 3·× 10−10 m2/s and 15.3 kJ/mole. This paper presents the simulation and experimental results of a natural solar dryer with a tracking flat plate collector system which allows just a fraction of the inlet air into the dryer. To achieve the simulation process, codes were modeled in FORTRAN (as presented in the appendix) and simulated using TRNSYS 16 to validate the experimental results.
2.0 Materials and Methods 2.1 Description of the dryer system
The system is made up of two major sections – the solar collector system and the drying chamber system. The solar dryer system is as shown in figure 3.1.

AJUNWA, I., et al./ UJET/ Vol. 1 (2), (2021, xx-xx
23
Figure 1: Schematic diagram of the solar dryer
2.1.1 The flat plate collector (FPC) The FPC provides the platform where solar energy is harvested. It has
the following parts: a. Absorber plate: treated black material with high absorptance and low
long wave emittance is the most preferred absorber material (Foster, 2013). The aluminum sheet metal was used as the absorber plate. The sheet metal was made of length 797 mm, width 531 mm with an approximate thickness of 0.08 mm.
b. Glazing or glass cover: this is the top cover of a solar collector. Prasad et al., (2010) reported that glass has been the principal material used to glaze solar collectors. The transparent glass of length 797 mm, width 531

AJUNWA, I., et al./ UJET/ Vol. 1 (2), (2021, xx-xx
24
mm, and thickness 4 mm was also selected as the glazing material for this work.
c. Insulation: this minimizes heat loss to the surrounding. The sawdust was used for this work because it has low thermal conductivity, economically cheap, and readily available.
d. Reflectors: the back silvered glass was used for this work since it has excellent specular reflectance and excellent durability. The approximate dimensions of 797 mm x 265.5 mm were used on both mirrors such as to make it serve as a cover to the solar collector plate and positioned facing east and west of the FPC.
2.1.2 Drying Chamber This is an enclosed structure where drying takes place. It is made with
a mild steel frame and plywood body screwed in place with a protruding chimney on top. It consists of the following parts:
a. Casing or dryer’s body: the casing is made of plywood of about 10 mm thickness with 753 mm × 531 mm dimensions.
b. Trays: the wire mesh was used for making the trays in this work. The wire mesh was made to the dimensions of 753 mm × 531 mm.
c. Chimney: this serves as an air vent to the drying chamber. A cylindrically shaped mild steel of 2 mm thickness was used to make the chimney. It is made of diameter 53.1 mm and height 407 mm.
d. Support frame: this is made to support the drying chamber. The support frame is made of mild steel of 3 mm thickness. The support frame has a total height of 1000 mm from the ground.
2.2 Working principle of the conventional solar dryer
The system is designed with a flat plate solar collector (incorporated with reflectors) and opened at one end for the inflow of air while the other end is linked to the drying chamber by a circular pipe. The collector is energized by solar insolation entering through the glazing cover. The glazing cover traps the heat from the sun by converting high frequency, low wavelength radiations into low frequency, high wavelength radiations (greenhouse). The trapping of the sun rays is enhanced by the inner surface of the collector made of aluminum sheet painted black; the trapped energy then heats the air inside the collector. The greenhouse effect achieved within the collector drives the air current from the inlet to the outlet of the collector setting a thermo-siphoning effect creating

AJUNWA, I., et al./ UJET/ Vol. 1 (2), (2021, xx-xx
25
an updraft of the heated air into the drying chamber. The heated air is then circulated by natural convection, transferring energy to the crop in the drying chamber where it evaporates and removes water from the crops and finally expelled through the chimney depending on the humidity factor of the air. The exit of air from the collector plate creates a vacuum in the system aiding a natural convection current process to be regenerated thereby causing the whole process to undergo a repetition as the dryer is placed in the path of airflow until the crop is brought to drying or the desired moisture content.
2.3 Methodology involved in the creation of the proforma
On the creation and programming of the proforma, the following methods were followed:
i. proforma design within TRNSYS 16.1 based on a mathematical model ii. variable declaration and assignment (input, output, and derivative)
iii. export of proforma for programming with FORTRAN compiler
iv. programming of proforma using FORTRAN programming language
v. use of proforma within TRNSYS assembly window
2.4 Modeling of the dryer TRNSYS Simulation Studio is a simulation package that contains
many tools. Tools ranging from simulation engine programs and graphical connection programs to plotting and spreadsheet software. It is an integrated tool that can be used from the design of a project to its simulation. Simulation models were developed in FORTRAN and run in TRYNSIS to help in predicting the performance of the system. The dryer’s performance was simulated using TRNSYS 16 software using Zaria weather data on Typical Meteorological Year (TMY) for the experimental day of the month. The components were linked together in such a way that a given output serves as input to other components TRNSYS 16 (2007) as seen in Figure 2. The major components of TRNSYS models used included:
Solar collector (Type 73_solar collector): using user-defined parameters like collector area, emittance, and absorptance of the absorber plate, this component theoretically models the thermal performance of the flat plate collector.
Solar dryer (Type 161): this was modelled using relevant drying equations in the FORTRAN environment and imputed into TRNSYS.

AJUNWA, I., et al./ UJET/ Vol. 1 (2), (2021, xx-xx
26
Weather data (Type 109_TMY 2): this model functions by reading the meteorological data from a specified data file and furnish them as outputs to other components of the simulation. The file contains hourly data of ambient temperature, solar insolation, wind velocity, and other meteorological measurements.
Printer (Type 65a, 65a-3): this model serves to print selected user quantities over a time period. Figure 2 shows the TRNSYS simulation process interface of the solar system.
Figure 2: The simulation interface of the dryer system
2.5 Design assumption in the modelling of the solar dryer performance
In modelling the solar dryer, a proforma / model was created as type 16.1 based on the following assumptions:
i. the mass flow rate of air into the drying chamber is uniformly distributed in the dryer.
ii. the thickness of the tomato slices is uniform within the drying chamber iii. heat within the drying chamber is evenly distributed. iv. humidity within the drying chamber is uniform across the three (3)
trays. v. the pressure inside the drying chamber is negligible.
vi. the airflow is in a steady state.

AJUNWA, I., et al./ UJET/ Vol. 1 (2), (2021, xx-xx
27
vii. all phases are continuous in thermal, mechanical and chemical equilibrium.
viii. collector output temperature is in equilibrium with the drying chamber temperature.
ix. no heat loss in the storage volume collector output temperature, it is in equilibrium with the absorber bed temperature.
2.6 Solar dryer performance equation analysis For evaluating the performance of the dryer, the profile was modelled
according to the following equations: 1. Percentage (%) moisture content: the quantity of moisture in the
percentage of the initial mass of a material can be represented on the wet basis as (Zaman and Bala, 1989):
𝑀𝑤𝑏 =𝑤𝑤−𝑤𝑑
𝑤𝑤× 100% 1
Where = 𝑤𝑤 − 𝑤𝑑 = 𝑀𝑤 For the percentage (%) moisture content over the simulation time
𝑚𝑤𝑏 = [𝑤𝑤−𝑤𝑑
𝑤𝑤× 100%]/𝑡𝑖𝑚𝑒 2
2. Average drying rate: the quantity of moisture removed from the food
item over the drying time is computed from (Tonui et al., 2014):
𝑚𝑑𝑟 =𝑤𝑤−𝑤𝑑
𝑡𝑑 3
For average drying rate over the simulation time
𝑚𝑑𝑟 =𝑤𝑤−𝑤𝑑
𝑡𝑖𝑚𝑒 4
3. Solar collector efficiency: the steady-state thermal efficiency of the solar
collector is given by Hottel-Whillier- Bliss equation as (Forson et al., 2007):
𝜂𝑐 =�̇�𝑎𝐶𝑝(𝑇𝑜−𝑇𝑎)
𝐴𝑐𝐼𝑇∗ 100 5
For collector efficiency over simulation time
𝜂𝑐 =�̇�𝑎𝐶𝑝(𝑄𝑐−𝑇𝑎)
𝐴𝑐𝐼𝑇∗ 100/𝑡𝑖𝑚𝑒 6
4. Dryer efficiency: for natural convection solar dryer, the system dryer
efficiency is expressed as (Drew, 2011):

AJUNWA, I., et al./ UJET/ Vol. 1 (2), (2021, xx-xx
28
𝜂𝑑 =(𝑤𝑤−𝑤𝑑)𝐿𝑣
𝐼𝑇𝐴𝑐𝑡*100 7
For dryer efficiency over simulation time
𝜂𝑑 = [𝑄𝑐∗𝐴𝑑𝑐/(𝑤𝑤−𝑤𝑑)𝐿𝑣
𝑡𝑖𝑚𝑒∗ 100/𝑡𝑖𝑚𝑒] 8
2.7 The flow chart of the simulation process
Figure 3: Flow chart showing the flow of the simulation process.
AJUNWA, I., et al./ UJET/ Vol. 1 (2), (2021, xx-xx
29
3.0 Results and Discussion 3.1 Moisture content
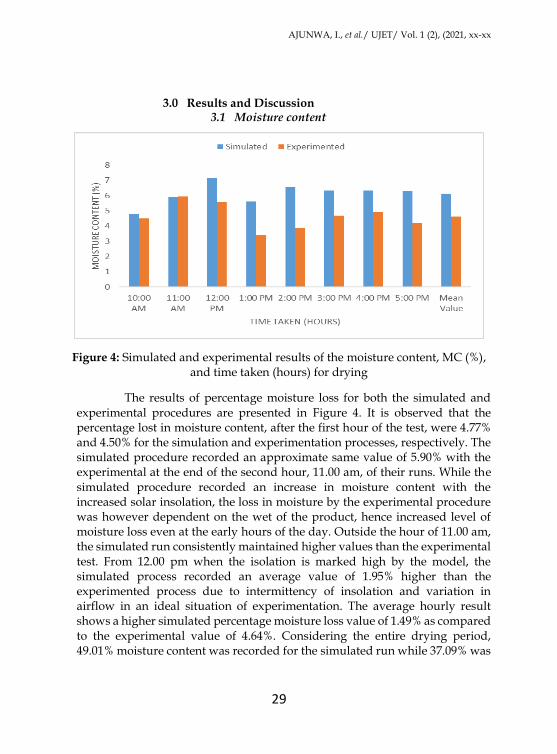
Figure 4: Simulated and experimental results of the moisture content, MC (%), and time taken (hours) for drying
The results of percentage moisture loss for both the simulated and experimental procedures are presented in Figure 4. It is observed that the percentage lost in moisture content, after the first hour of the test, were 4.77% and 4.50% for the simulation and experimentation processes, respectively. The simulated procedure recorded an approximate same value of 5.90% with the experimental at the end of the second hour, 11.00 am, of their runs. While the simulated procedure recorded an increase in moisture content with the increased solar insolation, the loss in moisture by the experimental procedure was however dependent on the wet of the product, hence increased level of moisture loss even at the early hours of the day. Outside the hour of 11.00 am, the simulated run consistently maintained higher values than the experimental test. From 12.00 pm when the isolation is marked high by the model, the simulated process recorded an average value of 1.95% higher than the experimented process due to intermittency of insolation and variation in airflow in an ideal situation of experimentation. The average hourly result shows a higher simulated percentage moisture loss value of 1.49% as compared to the experimental value of 4.64%. Considering the entire drying period, 49.01% moisture content was recorded for the simulated run while 37.09% was

AJUNWA, I., et al./ UJET/ Vol. 1 (2), (2021, xx-xx
30
recorded for the experimentation. As reported by Forson et al., (2007), the result of the experimentation here also shows a fair agreement with that of the model. There was also an increase in percentage moisture loss with time as reported by Musembi et al., (2016).
3.2 Drying rate
Figure 5: Simulated graphical representation of the drying rate (kg/s) and time taken (hours) for drying.
The results of the drying rate for both the simulated and experimental runs are presented in Figure 5. It can be observed from Figure 5, that the drying rate at the first hour of the test for both the simulated and the experimental runs gave an approximate same value of 2.50×10⁻⁵ kg/s. For the second hour of drying, the experimental result recorded a value of 6.0×10⁻⁷ kg/s higher than the simulated result. After this period, however, the simulated procedure maintained a higher drying rate than the experimental procedure throughout drying. From 12.00 pm when the isolation is marked high by the model to the end of the drying time, 5.00 pm, the simulated process recorded an average value of 1.25×10⁻⁵ kg/s higher than the experimented process. The average hourly result shows a higher simulated drying rate value by 9.40×10⁻⁶ kg/s as compare to the experimental value of 2.19×10⁻⁵ kg/s obtained. Considering the entire drying period, 2.50×10⁻⁴ kg/s drying rate was recorded for the simulated run while 1.75×10⁻⁴ kg/s was recorded for the experimentation. The simulated model in this work recorded an average drying rate of 2.50×10⁻⁴ kg/s showing
0
0.00001
0.00002
0.00003
0.00004
10:00AM
11:00AM
12:00PM
1:00PM
2:00PM
3:00PM
4:00PM
5:00PM
MeanValue
dry
ing
rate
(kg
/s)
time taken (hours)
Simulated Experimented

AJUNWA, I., et al./ UJET/ Vol. 1 (2), (2021, xx-xx
31
an improvement over what is obtained by Bolaji and Olalusi who reported a drying rate of 0.62kg/hr (1.72×10⁻⁴ kg/s) in their work. The experimental result here however showed an approximate same value with their finding. The result of the drying rate here also shows an improvement for both the experimental and the model over the average drying rate of (9.0 g/hr) 2.50×10⁻⁶ kg/s reported by Ajao and Adedeji (2008). Again, for the drying rate, a fair fit was also observed between the simulated and the experimental result with the simulated result having a higher value though.
3.3 Drying efficiency
Figure 6: Simulated graphical representation of the drying efficiency (%) and time taken (hours) for drying.
The results of drying efficiency for both the simulated and experimental procedures are presented in Figure 6. It is observed from Figure 6 that the drying efficiencies after the first hour of the test were 23.58% and 26.83% for the simulation and experimentation processes, respectively. The simulated procedure recorded an approximate same value of 32.00% with the experimental at the end of the second hour, 11.00 am, of their runs. Outside the hour of 11.00 am, the simulated results consistently recorded higher values of drying efficiencies than that of the experimental. From 12.00 pm the simulated process recorded an average value of 11.30% higher than the experimented process. The average hourly result shows a higher simulated drying efficiency value of 8.05% as compared to the experimental value of 23.27%. The average simulated finding in this work shows an improvement of 13.32% and 13.43%
00.000010.000020.000030.00004
10:00AM
11:00AM
12:00PM
1:00PM
2:00PM
3:00PM
4:00PM
5:00PM
MeanValued
ryin
g ra
te (
kg/s
)
time taken (hours)
Simulated Experimented

AJUNWA, I., et al./ UJET/ Vol. 1 (2), (2021, xx-xx
32
over that reported by Ajao and Adedeji (2008) and Musembi et al. (2016) who respectively reported dryer efficiencies of 18% and 17.89%. The experimental result respectively has an improvement of 5.27% and 5.38% over the dryer efficiencies reported by Ajao and Adedeji (2008) and Musembi et al. (2016). For this report, there was a slight overestimation of the simulated results as also observed by Kooli et al., (2007) in their model. Experimental results could hence be said to fairly validate the simulated results as reported also by Karim and Hawlader (2005). Assumptions made in the modeling and running of the software favored the simulated results.
3.4 Collector efficiency
Figure 7: Simulated graphical representation of the collector efficiency (%) and time taken (hours) for drying.
Figure 7 shows the collector efficiency both for the simulated and the experimental results. From Figure 7, it can be seen that the simulated result recorded higher values from the hours of 10.00 am to 3.00 pm as compare to the experimental result. The average value of collector efficiency recorded in this period is 81.36% for the simulated and 69.44% for the experimental. The hours 4.00 and 5.00 pm however had the experimental result yielding a higher average value than the simulation runs by 6.90%. Assumptions made in modeling and use of the software are also focused on the drying products (drying chamber) excluding the collector plate, hence the reason for its unique
0
10
20
30
40
10:00AM
11:00AM
12:00PM
1:00PM
2:00PM
3:00PM
4:00PM
5:00PM
MeanValue
Dry
ing
effi
cien
cy (
%)
time taken (hours)
Simulated Experimented

AJUNWA, I., et al./ UJET/ Vol. 1 (2), (2021, xx-xx
33
bars. For the period of drying of 8 hours, the average value of the collector efficiency for the experimentation was lesser when compared with the simulated value by 7.22%. The experimental average value of the collector efficiency was found to be 69.09%. The average simulated result reported here shows an improvement of 29.91% and 44.81% over that reported by Adelaja and Babatope (2013) and Lingayat et al. (2016) who respectively reported collector efficiencies of 46.4% and 31.5%. The experimental result respectively has an improvement of 22.69% and 37.59% over the collector efficiencies reported by Adelaja and Babatope (2013) and Lingayat et al. (2016). A fair result is observed between the experimental and the result of the model in this work.
4.0 Conclusion A natural solar dryer was simulated using the meteorological
conditions of Zaria, Nigeria. Written codes/proformas developed with FORTRAN/C++ programming language were used in the simulation of the solar dryer with TRNSYS 16. The modelled/predicted results were also compared with the experimental results of the dryer test in terms of the moisture content, drying rate, collector efficiency, and drying efficiency. The result showed that for the entire drying period, 49.01% moisture content was recorded for the simulated run while 37.09% was recorded for the experimentation, 2.50×10⁻⁴ kg/s drying rate was recorded for the simulated run, and 1.75×10⁻⁴ kg/s for the experimentation. The average value of the collector efficiency for the experimentation was lesser when compared with the simulated value by 7.22%. The experimental average value of the collector efficiency was found to be 69.09%. The average hourly drying efficiency of the simulated result showed a higher value of 8.05% as compared to the experimental value of 23.27%.
5. References
Adelaja, A. O. and Babatope, B. I. (2013). Analysis and testing of a natural convection solar dryer for the tropics. Journal of Energy, Volume 2013, Article ID 479894:8.
Ajao, K.R. and Adedeji, A. A. (2008). Assessing the Drying Rates of Some Crops in Solar Dryer. Journal of Research Information in Civil Eng., vol 5, pp 1-12.

AJUNWA, I., et al./ UJET/ Vol. 1 (2), (2021, xx-xx
34
Ajunwa, I., Yawas, D. S., Kulla, D. M., & Ibrahim, I. U. (2020a). Thermal Performance Optimization of Flat Plate Solar Collector using MATLAB. Jurnal Mekanikal, 43(2).
Ajunwa, I., Yawas, D. S., Kulla, D. M., & Ibrahim, I. U. (2020b). Experimental Evaluation of a Natural Indirect Solar-Biomass Dryer with Automated Single Axis Solar Tracking System for Urban Dwellers. Jurnal Mekanikal, 43(2).
Ajunwa, I., Yawas, D. S., Kulla, D. M., Abdullahi, M. B., Ibrahim, I. U., & Jnr, M. I. (2020). Performance Improvement of an Indirect Solar Dryer with Single Axis Manual Tracking System and Angular Simulation of the Flat Plate Collector Reflectors. Arid Zone Journal of Engineering, Technology and Environment, 16(2), 293-308.
Bolaji, B. O., and Olalusi, A. P. (2008). Performance evaluation of a mixed-mode solar dryer. Technical Report, AU J.T, 11(4):225-231
Bolaji, B.O. and Olalusi, A.P. (2008). Performance evaluation of a mixed-mode solar dryer. Technical Report, AU Journal of Technology, vol 11, pp 225-231.
Drew, F. S. (2011). Development and Evaluation of a Natural Convection Solar Dryer for Mango in Rural Haitian Communities. (Unpublished) M.Sc. Thesis, Agricultural and Biological Engineering, University of Florida.
Ezekwe, C. I. (1995). Introduction to solar drying. Natural Centre for Energy Research and Development Journal, 2-8.
Forson, F. K., Nazha, M. A. A., Akuffo, F. O., and Rajakaruna, H. (2007). Design of mixed-mode natural convection solar crop dryers: application of principles and rules of thumb. Renewable Energy, 32(14), 2306-2319.
Forson, F. K., Nazha, M. A. and Rajakaruna, H. (2007). Modelling and experimental studies on a mixed-mode natural convection solar crop-dryer. Solar Energy, vol 81, pp 346-357.

AJUNWA, I., et al./ UJET/ Vol. 1 (2), (2021, xx-xx
35
Foster, S. A. (2013). Construction and Performance Testing of a Mixed Mode Solar Food Dryer for Use in Developing Countries. All Theses and Dissertations. Brigham Young University, Provo.
Habtamu, T. E. (2007). Simulation of Solar Cereal Dryer using TRNSYS. (Unpublished) MSc. Thesis, Department of Mechanical Engineering, Addis Ababa University, Ethiopia.
Ibrahim, I. U. (2016). Estimations of Solar Energy Potentials of Sokoto State Using Temperature Base Model of Amstrong Empherical Equations. International Journal of Innovative Research in Science , Engineering and Technology. https://doi.org/10.15680/ijirset.2016.0503195
Janjai, S., Srisittipokakun, N., and Bala, B. K. (2008). Experimental and modelling performances of a roof-integrated solar drying system for drying herbs and spices. Energy, 33(1), 91-103.
Karim, M. A., and Hawlader, M. N. A. (2005). Mathematical modelling and experimental investigation of tropical fruits drying. International Journal of Heat and Mass Transfer, 48(23-24), 4914-4925.
Karim, M. A., and Hawlader, M. N. A. (2005). Mathematical modelling and experimental investigation of tropical fruits drying. International Journal of Heat and Mass Transfer, vol 48, pp 4914-4925.
Kituu, G. M., Shitanda, D., Kanali, C. L., Mailutha, J. T., Njoroge, C. K., Wainaina, J. K., and Silayo, V. K. (2010). Thin layer drying model for simulating the drying of Tilapia fish (Oreochromisniloticus) in a solar tunnel dryer. Journal of Food Engineering, 98(3), 325-331.
Kooli, S., Fadhel, A., Farhat, A., and Belghith, A. (2007). Drying of red pepper in open sun and greenhouse conditions: mathematical modeling and experimental validation. Journal of food engineering, 79(3), 1094-1103.
Kooli, S., Fadhel, A., Farhat, A., and Belghith, A. (2007). Drying of red pepper in open sun and greenhouse conditions: mathematical modeling and experimental validation. Journal of food engineering, vol 79, pp 1094-1103.
AJUNWA, I., et al./ UJET/ Vol. 1 (2), (2021, xx-xx
36
Lingayat, A., Chandramohan, V. P., and Raju, V. R. K. (2016). Design, development and performance of indirect type solar dryer for banana drying. Energy Procedia, vol 109, pp 409-416.
Matthew, G. G., and Schwarz, D. (2001). Solar drying technology for food preservation. Germany: GTZ-GATE Eschborn.
Moradi, M., Fallahi, M. A., and Mousavi Khaneghah, A. (2020). Kinetics and mathematical modeling of thin layer drying of mint leaves by a hot water recirculating solar dryer. Journal of Food Process Engineering, 43(1), e13181.
Musa, I. H., (2016): Design, Construction, Simulation and Performance Evaluation of a 6 kg Tomato Indirect Solar Dryer. (Unpublished) Masters Dissertation Submitted to the Department of Mechanical Engineering, Ahmadu Bello University, Zaria, Nigeria.
Musembi, M. N., Kiptoo, KS. and Yuichi, N. (2016). Design and Analysis of Solar Dryer for Mid-Latitude Region. Energy procedia, vol 100, pp 98-110
Prasad, P. R., Byregowda, H. V., and Gangavati, P. B. (2010). Experiment analysis of flat plate collector and comparison of performance with tracking collector. European journal of scientific research, 40(1), 144-155.
Tarigan, E. (2018). Mathematical modeling and simulation of a solar agricultural dryer with back-up biomass burner and thermal storage. Case studies in thermal engineering, 12, 149-165.
Tonui, K. S., Mutai, E. B. K., Mutuli, D. A., Mbuge, D. O., and Too, K. V. (2014). Design and evaluation of solar grain dryer with a back-up heater. Res J Appl Sci Eng Technol, 7(15), 3036-3043.
TRNSYS. (2007). Programmers guide (Vol. 8). Wisconsin.
Waewsak, J., Chindaruksa, S., and Punlek, C. (2006). A mathematical modelling study of hot air drying for some agricultural products. Thammasat international Journal of science and Technology, 11(1), 14-20.
AJUNWA, I., et al./ UJET/ Vol. 1 (2), (2021, xx-xx
37
Weiss, W., and Buchinger, J. (2002). Solar drying–Austrian Development Cooperation. AEE INTEC, Gleisdorf, 110. Available from ˂http://t.aee-intec.at/0uploads/dateien553.pdf>.
Wilkins, R., Brusey, J., and Gaura, E. (2018). Modelling uncontrolled solar drying of mango waste. Journal of Food Engineering, 237, 44-51.
Zaman, M. A., and Bala, B. K. (1989). Thin layer solar drying of rough rice. Solar Energy, 42(2), 167-171.