programming in stata - erin hengel · 2015-10-16 · including version vnum tells stata which...
TRANSCRIPT
Programming in StataErin Hengel
Basic syntax

[prefix :] command [varlist] [=exp] [if] [in] [weight] [using filename] [, options]
Source: Social Science Computing Cooperative, University of Wisconsin, Madison

Navigating within Stata

cd
mkdir
copy
pwd
dir/ls
erase
rmdir
shell

Macros

Two different ways to define a macro
★ local macroname "text"/number/expression
★ local macroname = "text"/number/expression
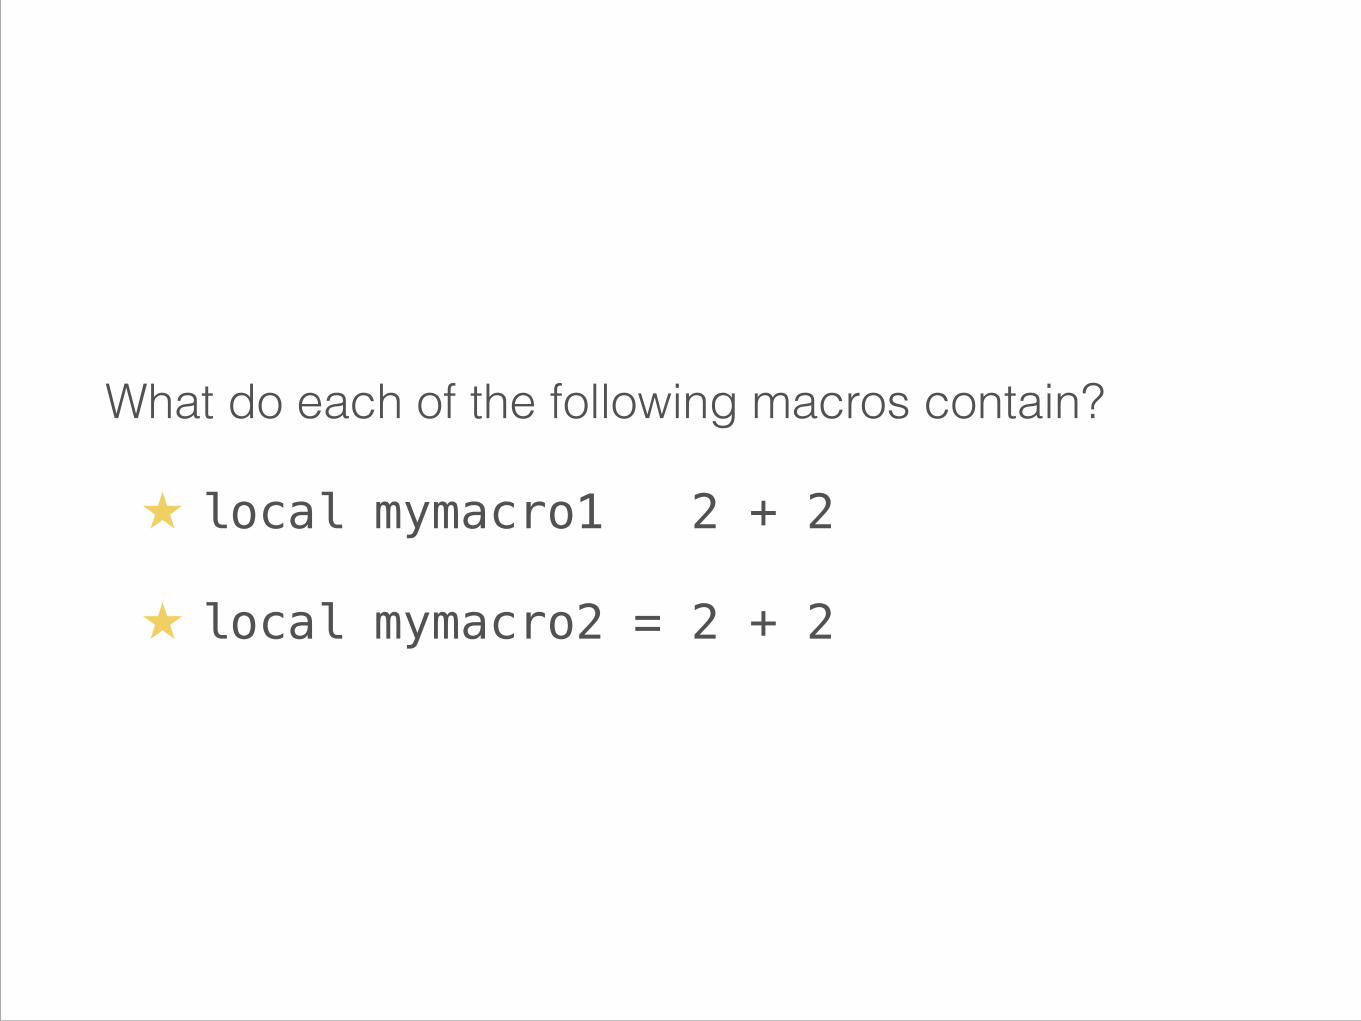
What do each of the following macros contain?
★ local mymacro1 2 + 2
★ local mymacro2 = 2 + 2
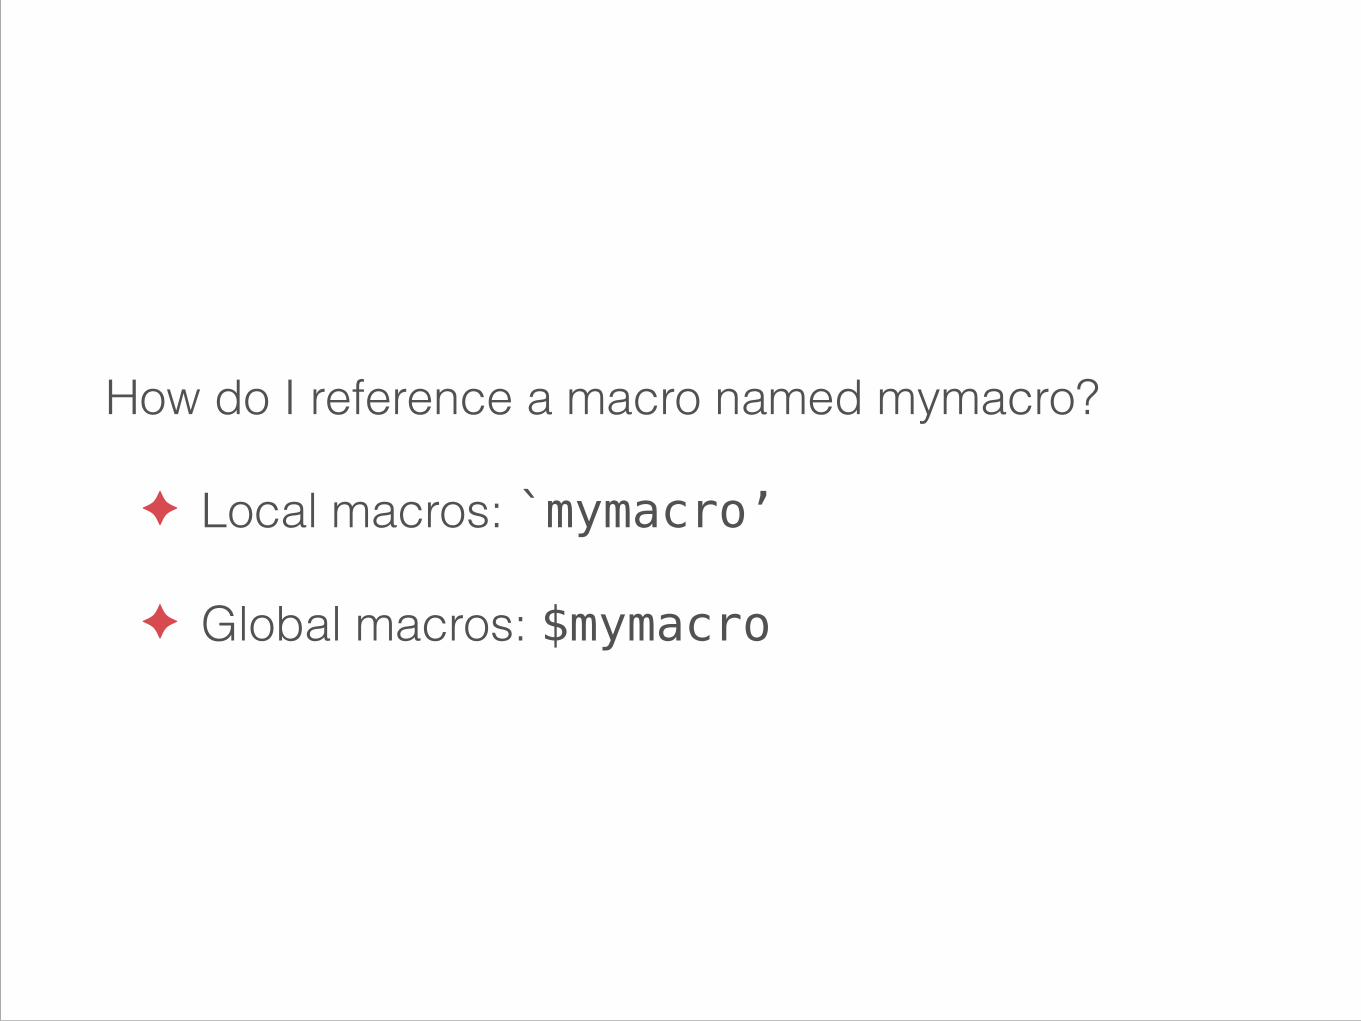
How do I reference a macro named mymacro?
✦ Local macros: `mymacro’
✦ Global macros: $mymacro

Exercise
✦ Load the example auto.dta dataset (hint: see the help files for sysuse).
✦ Define a macro called controls which contains mpg, rep78 and headroom.
✦ Regress price on `controls' for foreign vehicles and then again for domestic vehicles.

Macro expressions
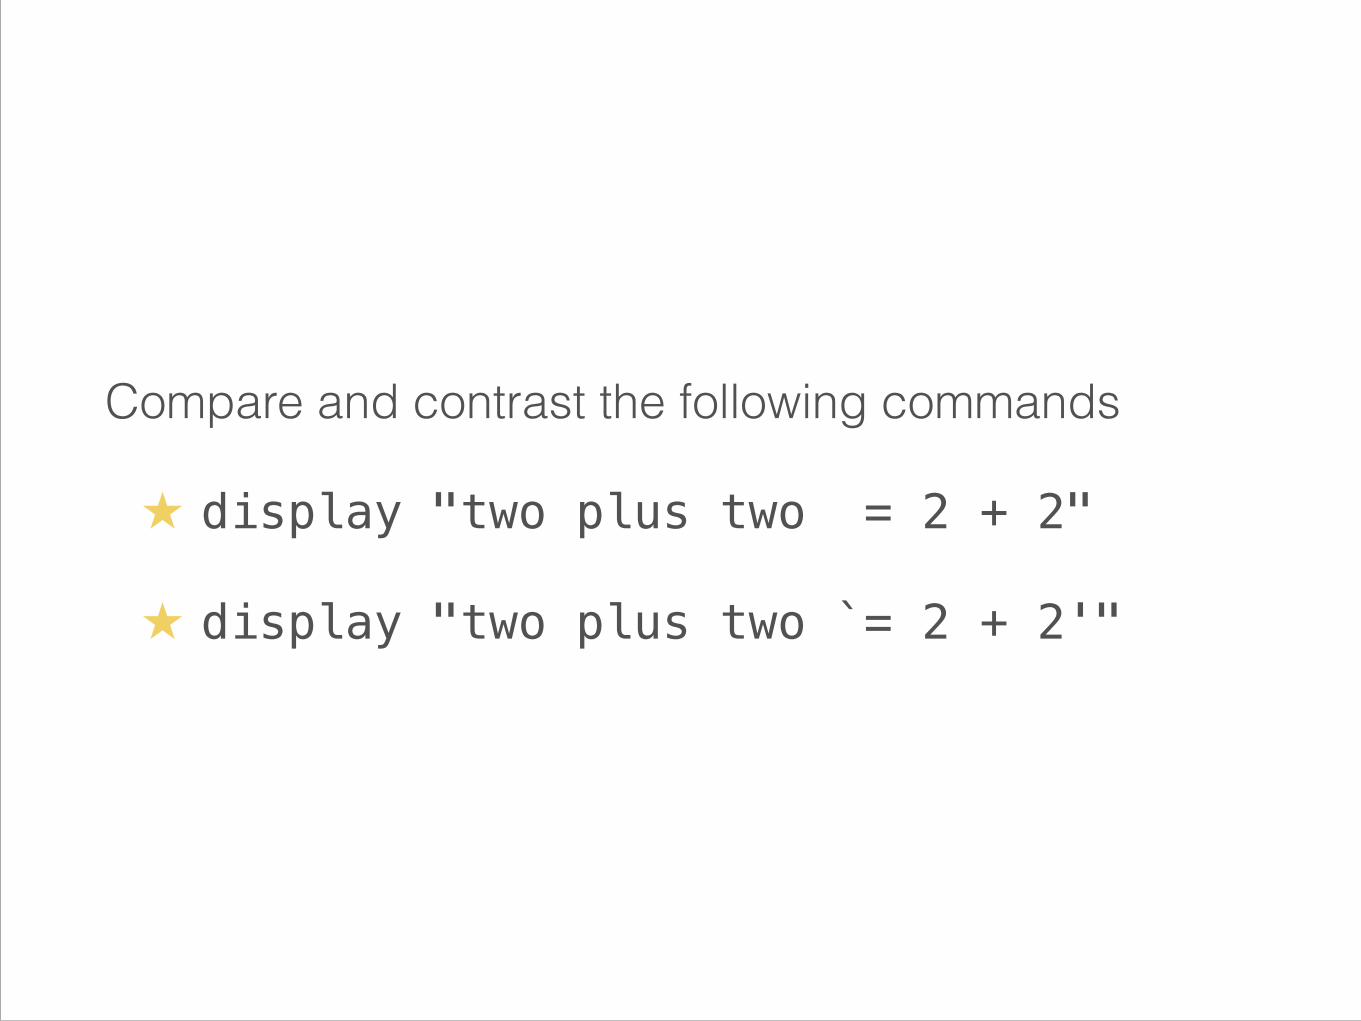
Compare and contrast the following commands
★ display "two plus two = 2 + 2"
★ display "two plus two `= 2 + 2'"
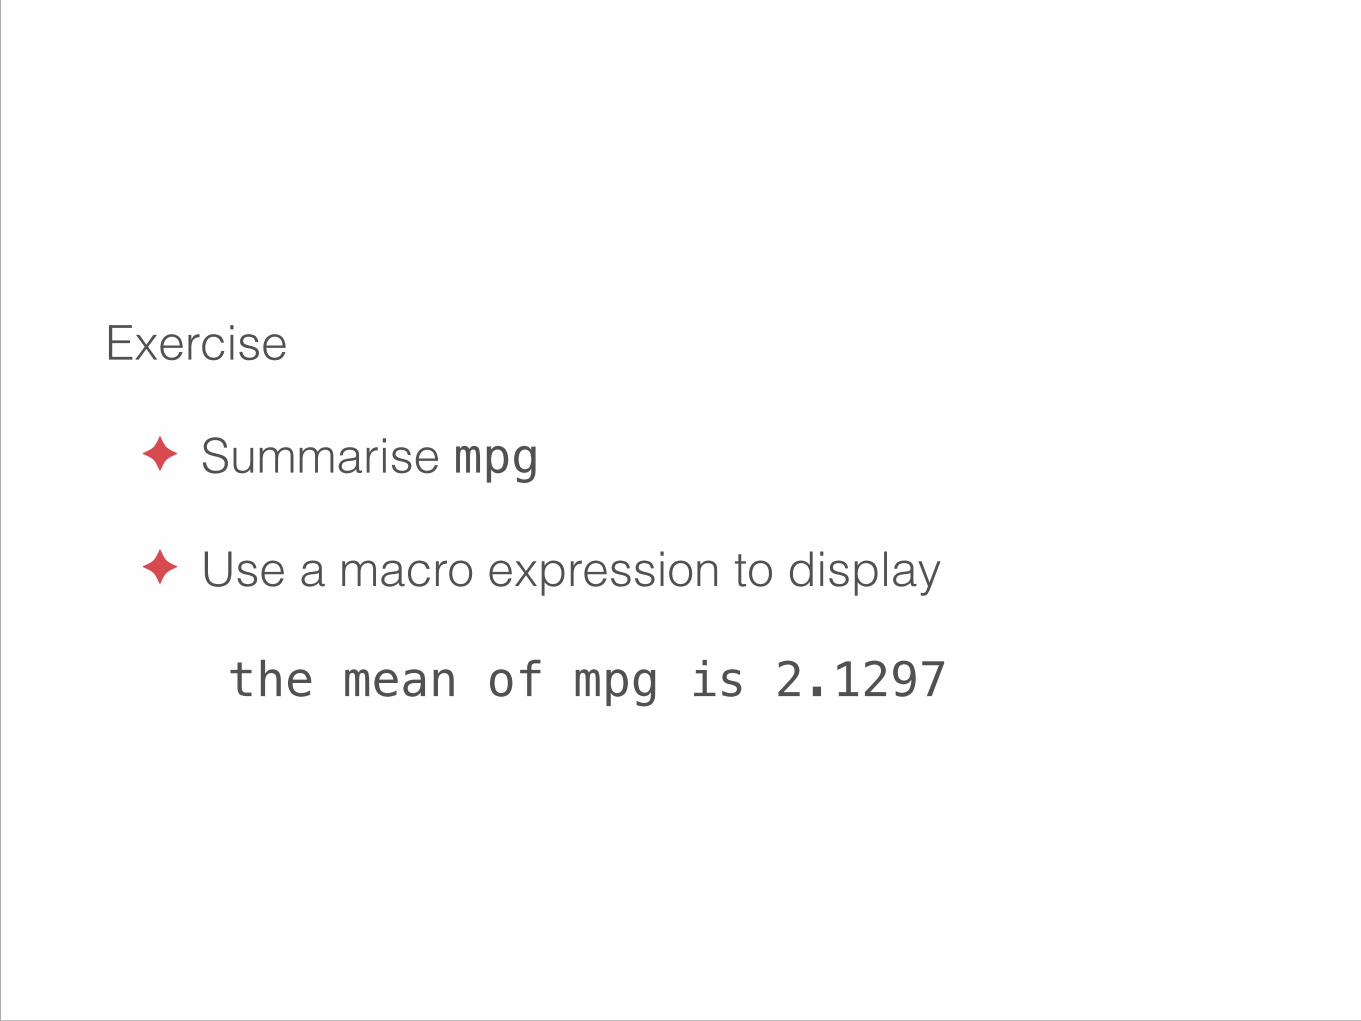
Exercise
✦ Summarise mpg
✦ Use a macro expression to display
the mean of mpg is 2.1297
Macro extended functions
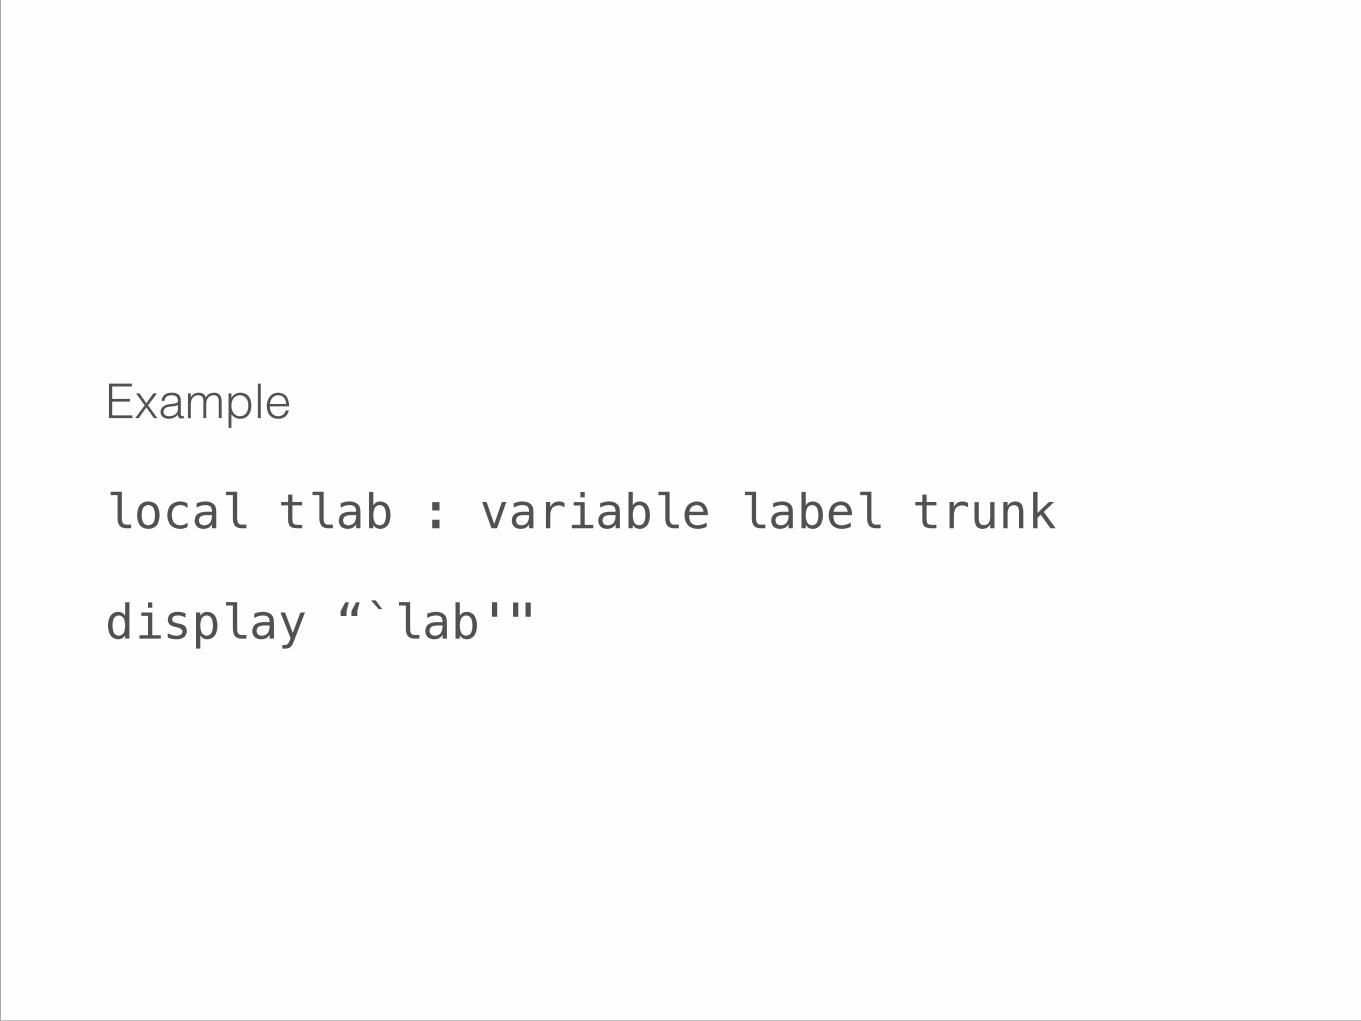
Example
local tlab : variable label trunk
display “`lab'"
Syntax
★ local macroname : extended macro function

Exercises
✦ Use a macro extended expression to display the variable label on make without first assigning it to a macro name (hint: the colon is equivalent to the equal sign in the earlier macro expression `=2+2’.
✦ Use a macro extended function to display the storage type (e.g., int, float, long, str1,…) of make (hint: see help extended_fcn).
✦ Use a macro extended function to return the value label associated to foreign when it equals 1.
Parsing strings
✦Counting elements
✦Returning parts of strings
✦Replacing parts of strings
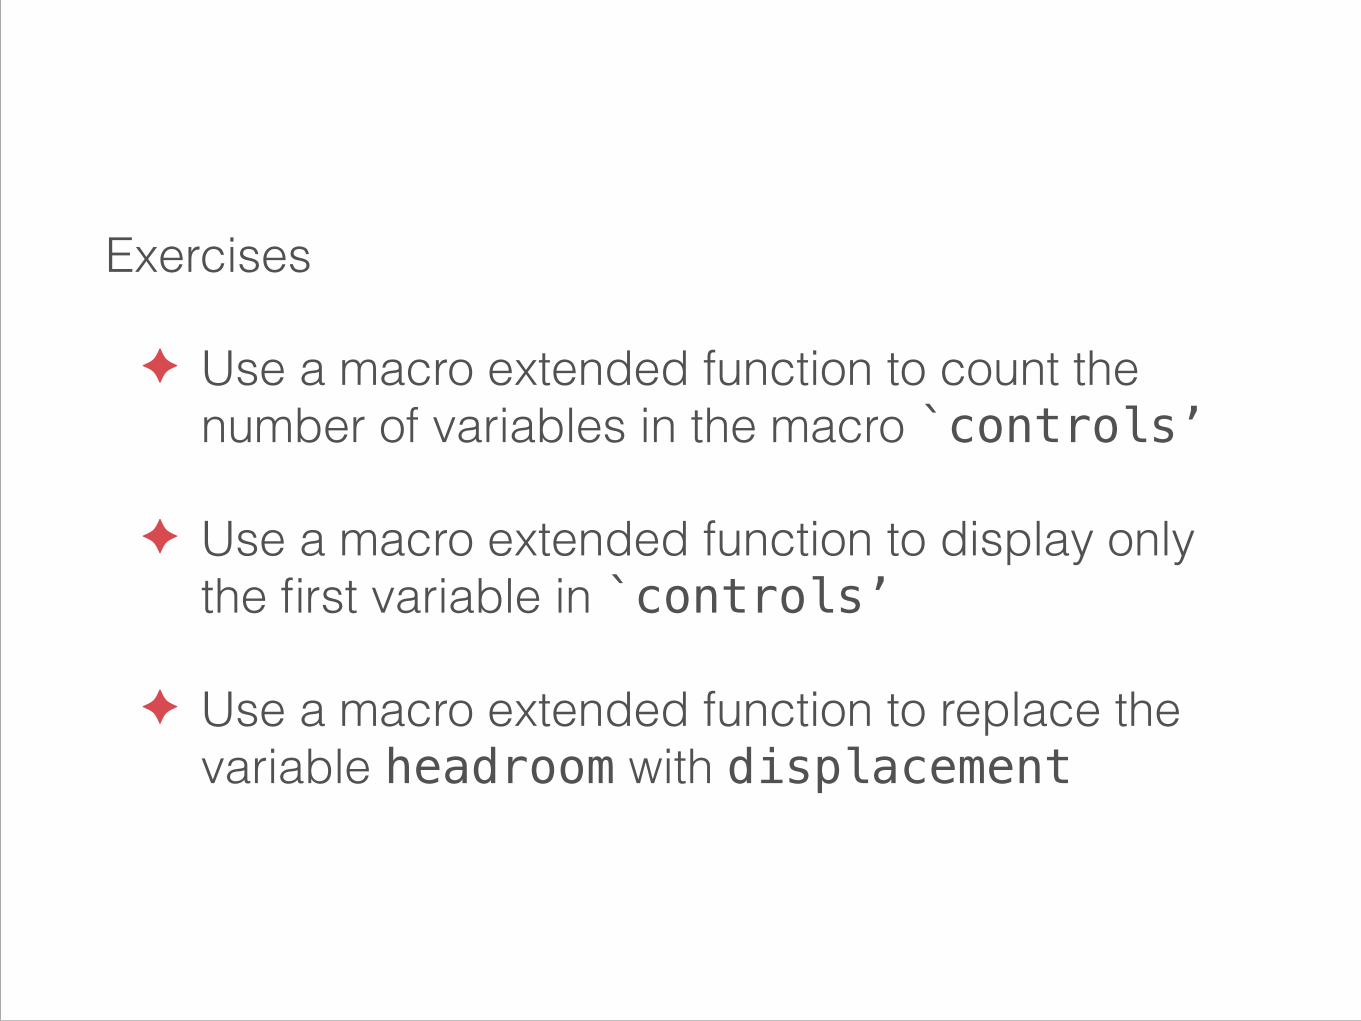
Exercises
✦ Use a macro extended function to count the number of variables in the macro `controls’
✦ Use a macro extended function to display only the first variable in `controls’
✦ Use a macro extended function to replace the variable headroom with displacement
Macro list functions

Syntax
★ local macroname : list function

✦Extract unique elements of lists
✦Alphabetise lists
✦Compare and combine lists
Exercises
✦ Define a macro called animals exactly equal to the following text: “cat dog cat parrot parrot”. Use a macro list function to display only the unique elements in `animals’.
✦ Define a macro called groceries with the following elements in it: pears apples strawberries yoghurt wine cheese. Use a macro list function to alphabetise `groceries’. Display your alphabetised `groceries’.
✦ Define a macro called union which contains all members of `animals’ and `groceries’. Use a macro list function to display its size.
✦ Sort `union’ and display the position of the element wine using a macro list function.

Compound double quotes
Example
local answers yes no “do not know”
display “`answers’”

display “yes no “do not know””
Openquote
Closequote
Example
local answers yes no “do not know”
display `“`answers’”’

Exercises
✦ Use a macro extended function to display all files in your current directory.

foreach loop

Syntax
foreach thing in list {
do something
}

Exercises
✦ Loop over the list alpha, beta and gamma and display each in turn.
✦ Loop over the macro `union’ and display each element in turn.

Syntax
foreach thing of listype list {
do something
}
Example
foreach item of local union {
display “`item’”
}

Exercises
✦ Loop over the macro `controls’ and summarise each in turn.
✦ Using a loop, create new variables for all items in `groceries’ equal to a random number between 0 and 1 (hint: use the function runiform()).
✦ Using a loop, display the variable labels of all variables from make to foreign without typing the variable names individually.
✦ Using a loop, display all odd numbers between 3 and 13 (hint: see help numlist).
forvalues loop
Syntax
forvalues i = range {
do something
}

Exercises
✦ Loop from 1 to 10 and display each number in turn.
✦ Using a loop, create 100 variables named x1, x2, …, x100 each equal to a random draw from a standard normal distribution.
✦ Loop through every third x starting at x3 (i.e., x3, x6, …, x99) and list its storage type.
while loop
Syntax
while exp is true {
do something
}
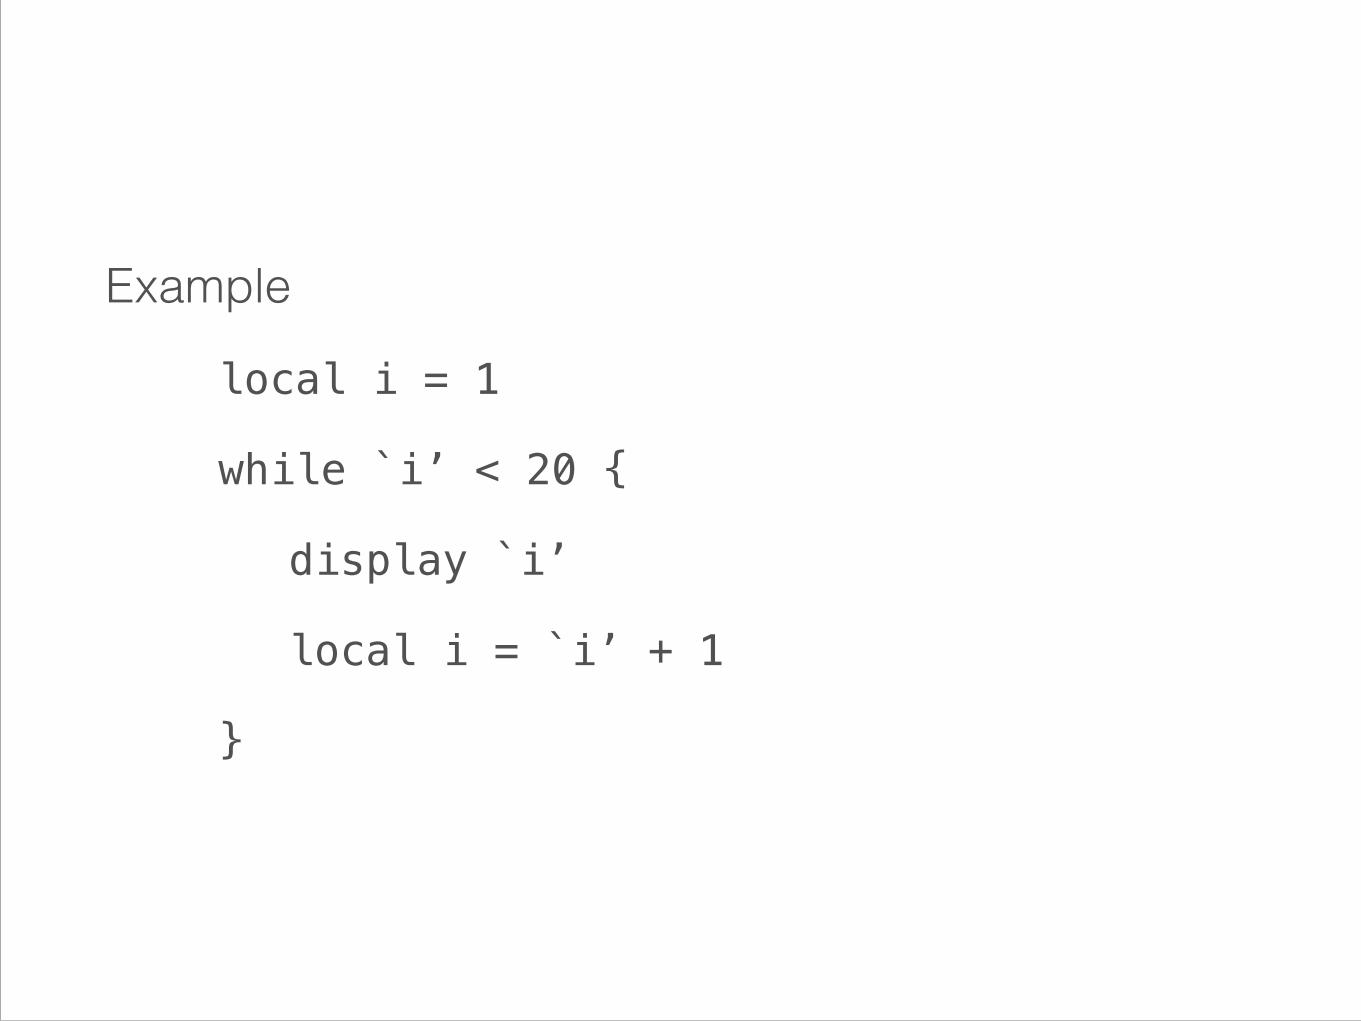
Example
local i = 1
while `i’ < 20 {
display `i’
local i = `i’ + 1
}
Exercises
✦ Drop variables x1 through x100 and regenerate them with a while loop.
✦ Use while to display the numbers 1-20 but use an expansion operator to increment `i’ (hint: scroll to the end of the pdf documentation on extended macro functions).

if clauses

Syntax
if exp is true {
do this
}
else {
do that
}

Example
local mymac = 7
if mod(`mymac’,2) == 1 {
display `mymac’ “ is odd”
}
else {
display `mymac’ “ is even”
}
Exercises
✦ Redefine `mymac’ so it’s equal to a random integer between 1 and 99 (hint: use runiform()*100 to generate a random number between 1 and 100 and then find a function which will turn that number into an integer). Does your if clause still work?

Indexing
Syntax
varname[i]
Exercises
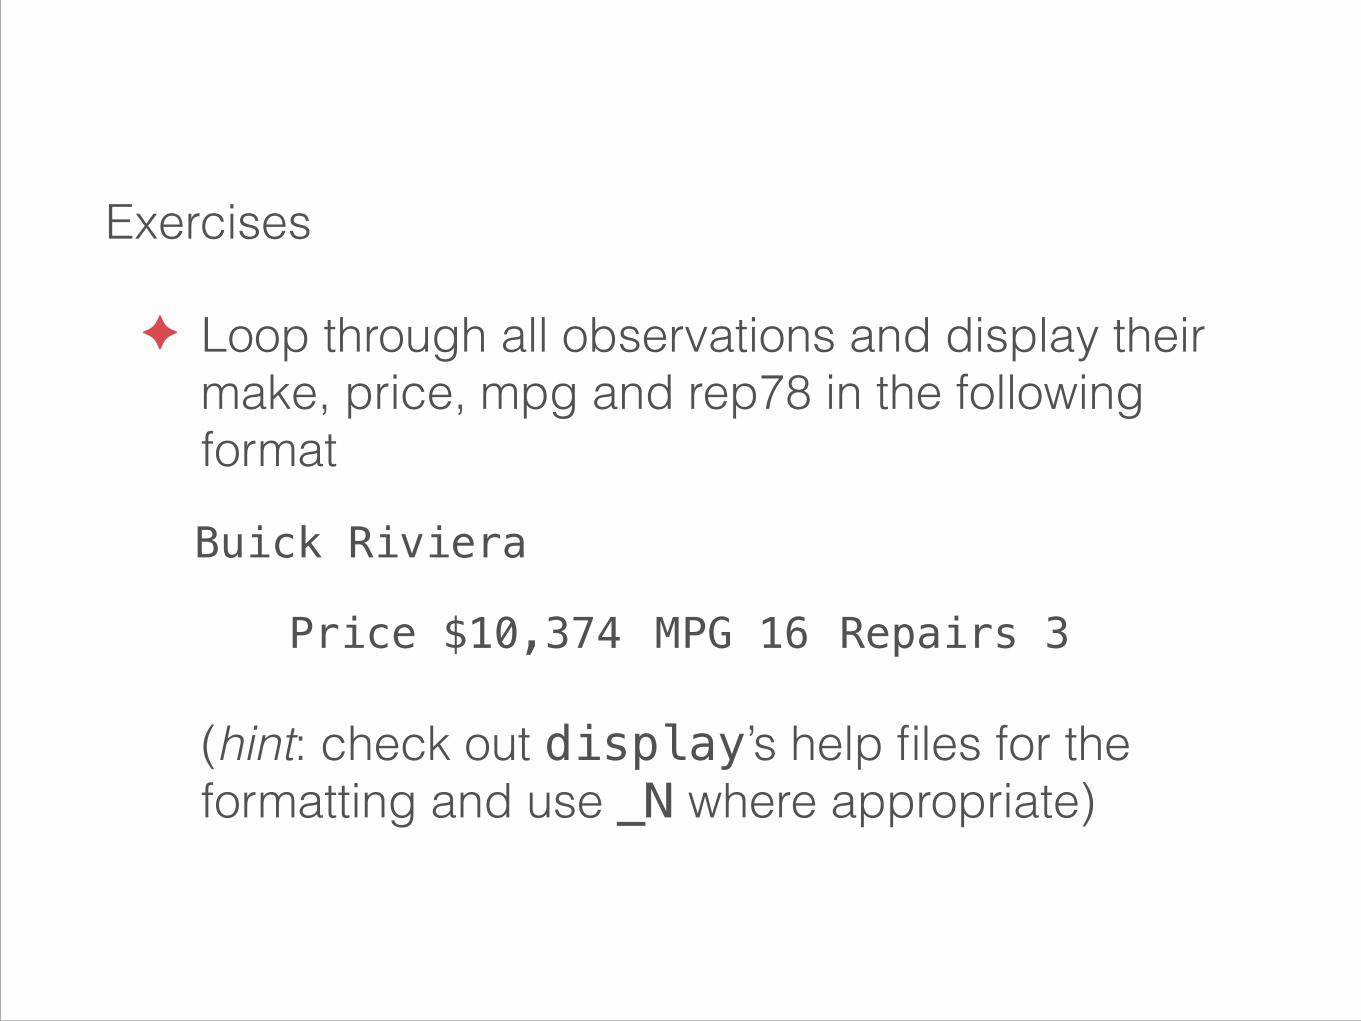
✦ Loop through all observations and display their make, price, mpg and rep78 in the following format
Buick Riviera
Price $10,374 MPG 16 Repairs 3
(hint: check out display’s help files for the formatting and use _N where appropriate)
Stata’s constants
✦ _N: total number of observations
✦ _n: number of the current observation
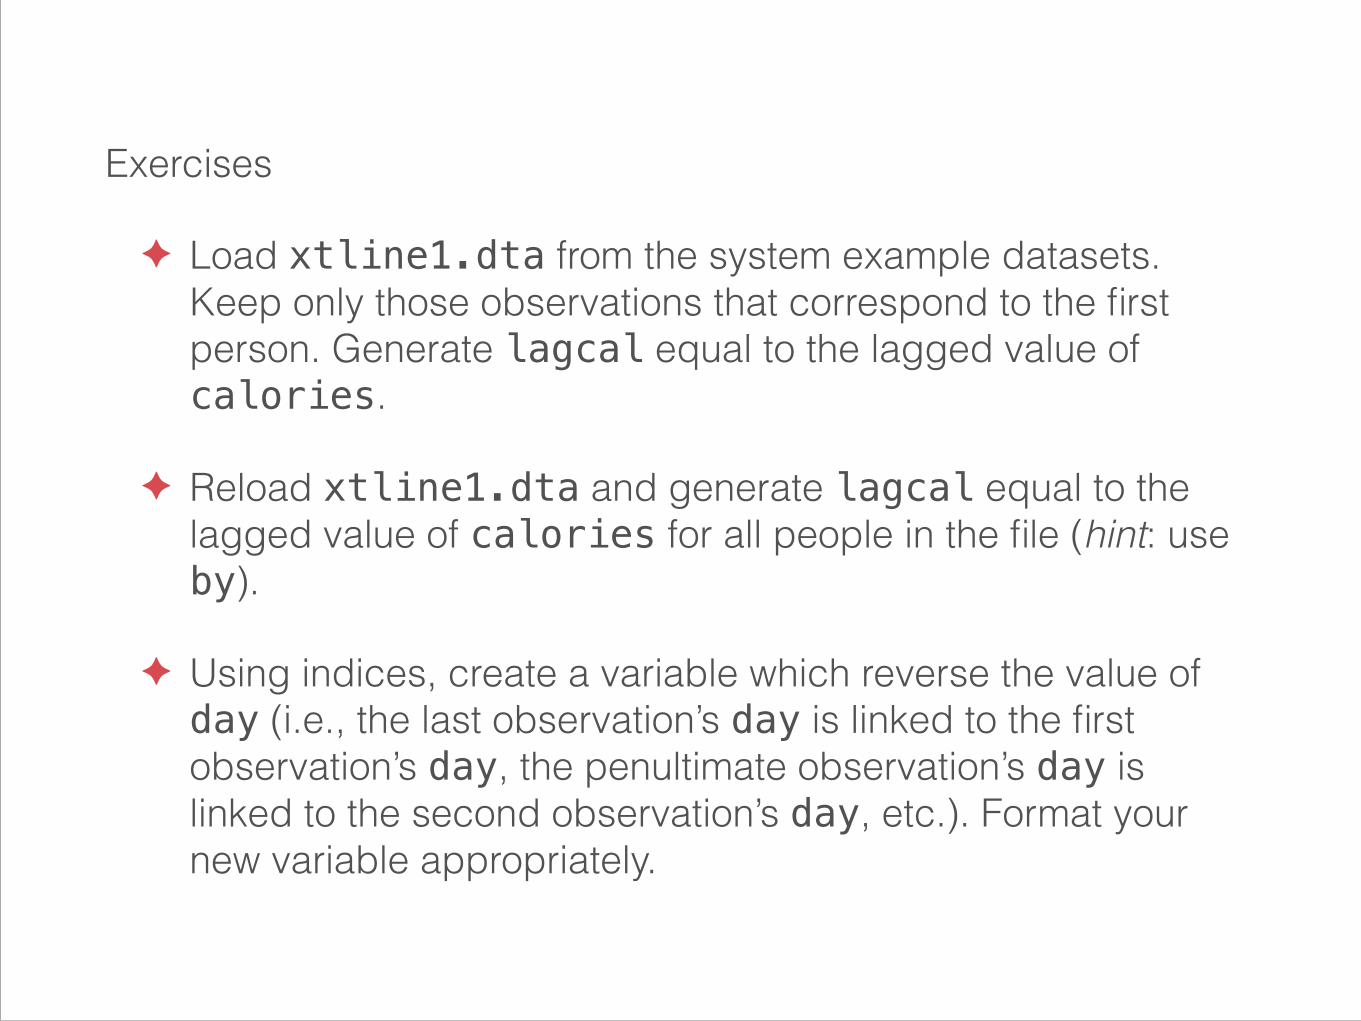
Exercises
✦ Load xtline1.dta from the system example datasets. Keep only those observations that correspond to the first person. Generate lagcal equal to the lagged value of calories.
✦ Reload xtline1.dta and generate lagcal equal to the lagged value of calories for all people in the file (hint: use by).
✦ Using indices, create a variable which reverse the value of day (i.e., the last observation’s day is linked to the first observation’s day, the penultimate observation’s day is linked to the second observation’s day, etc.). Format your new variable appropriately.

program

Syntax
program progname {
whatever your program does
end

Exercises
✦ Create a program called whatsmyname which displays “hello, my name is”
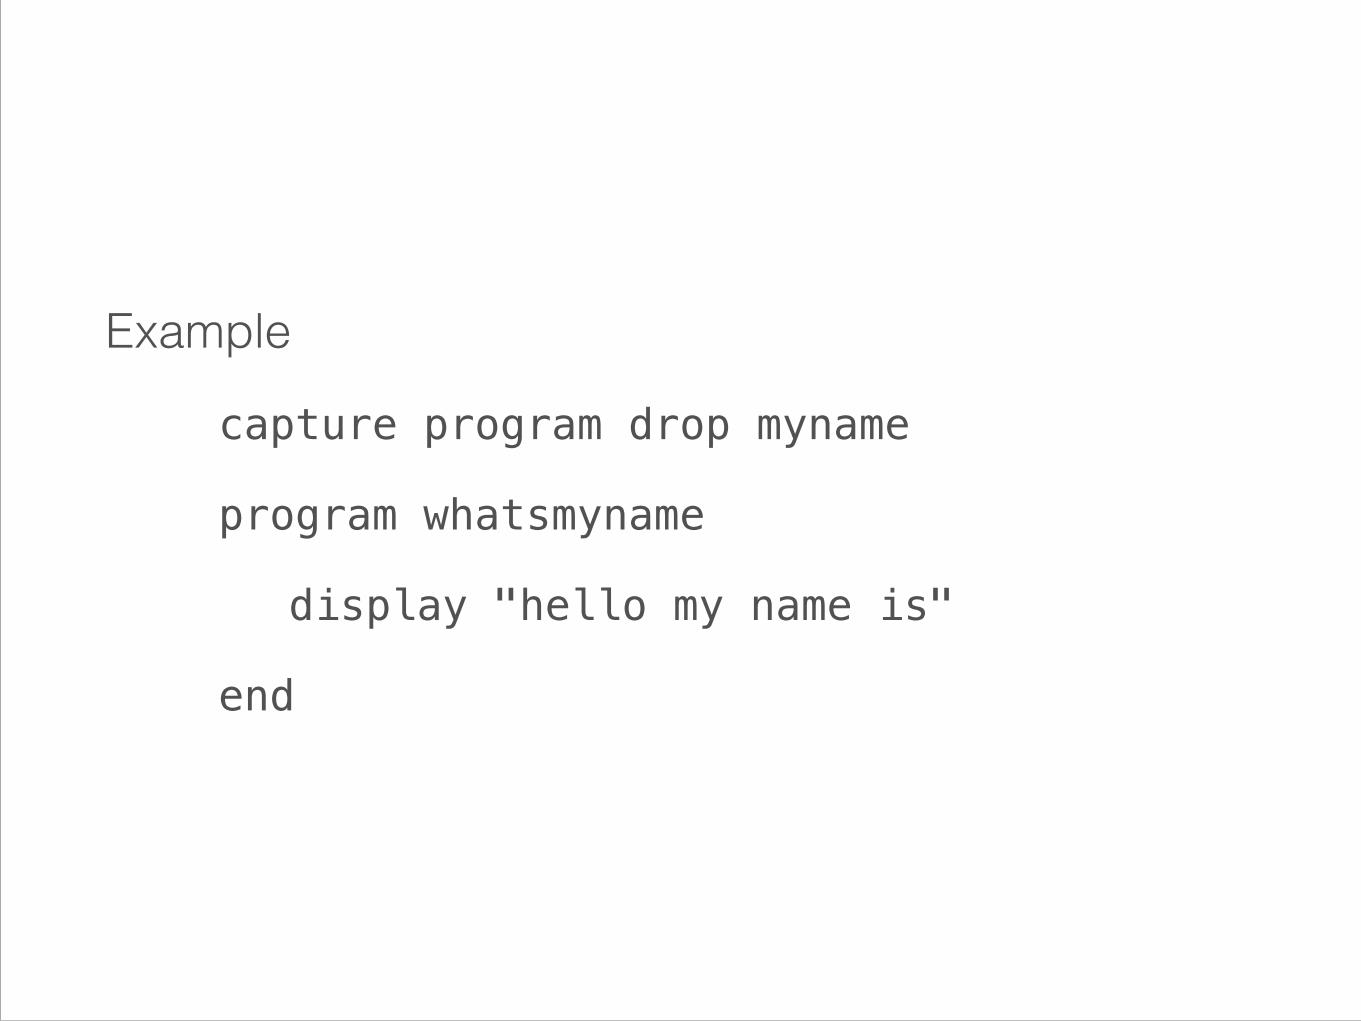
Example
capture program drop myname
program whatsmyname
display "hello my name is"
end

Passing arguments
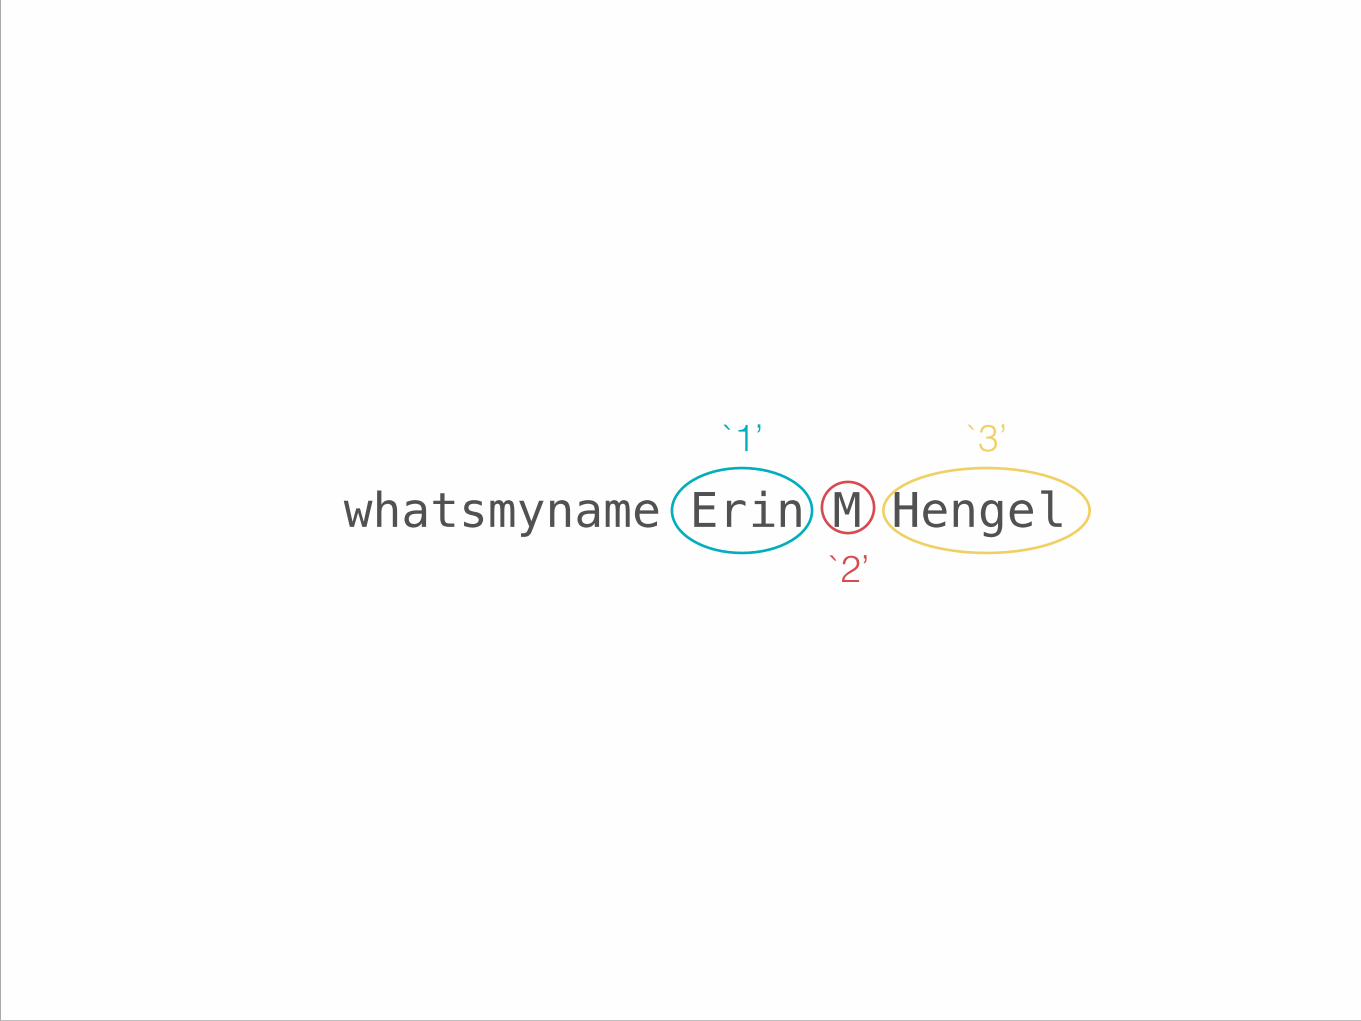
whatsmyname Erin M Hengel`2’
`1’ `3’

`*’ All arguments
`0’ All arguments (same as `*’)
`1’ First argument
`2’ Second argument
`3’ Third argument
… …
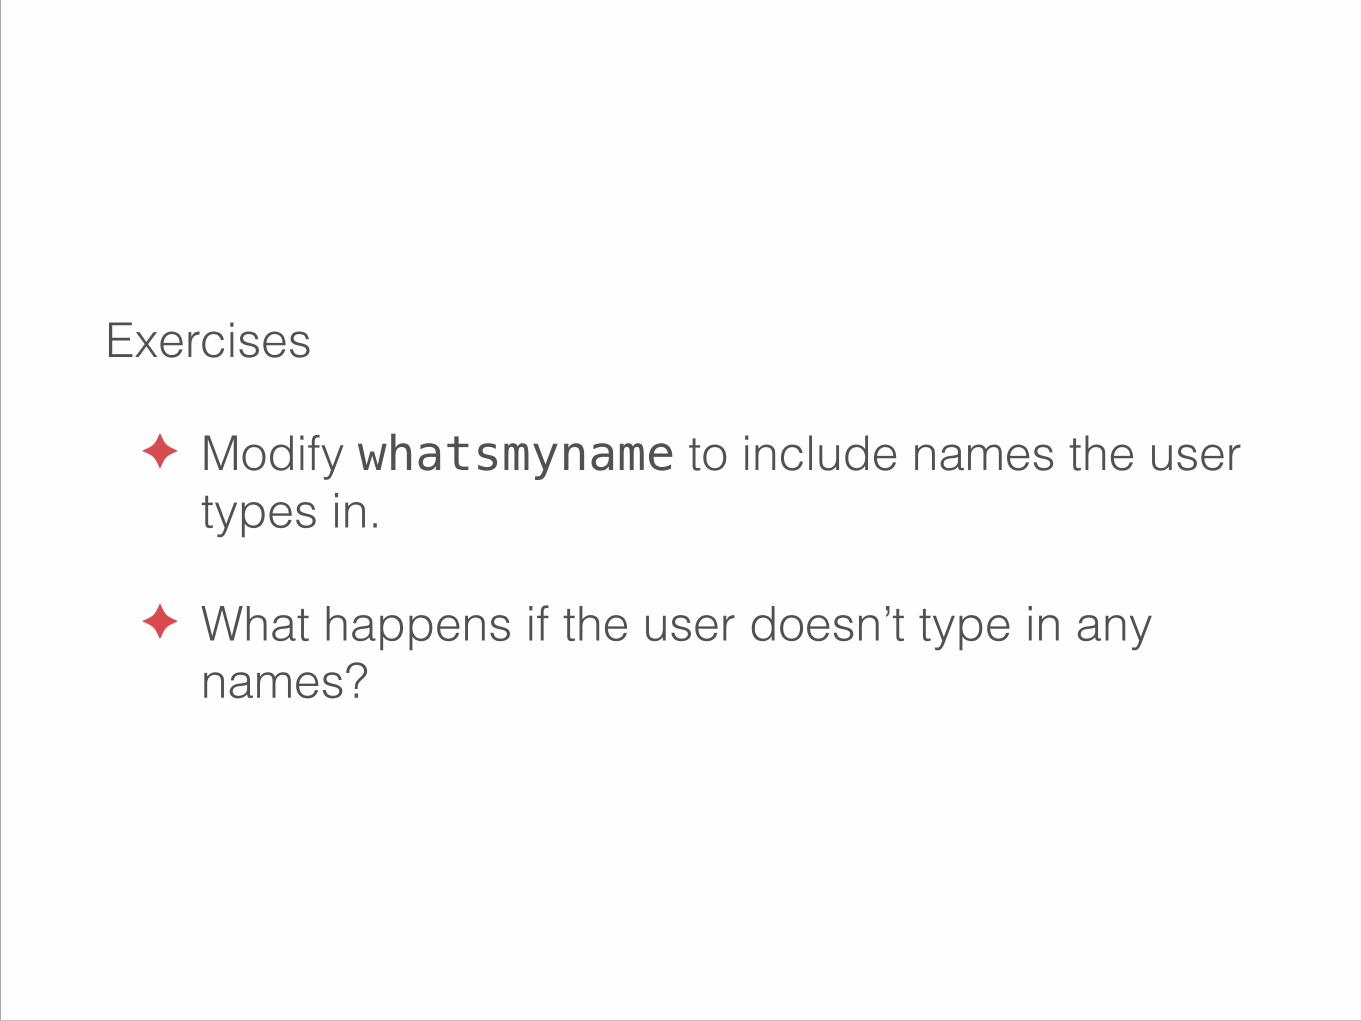
Exercises
✦ Modify whatsmyname to include names the user types in.
✦ What happens if the user doesn’t type in any names?
Automatically loaded do-files(ado-files)
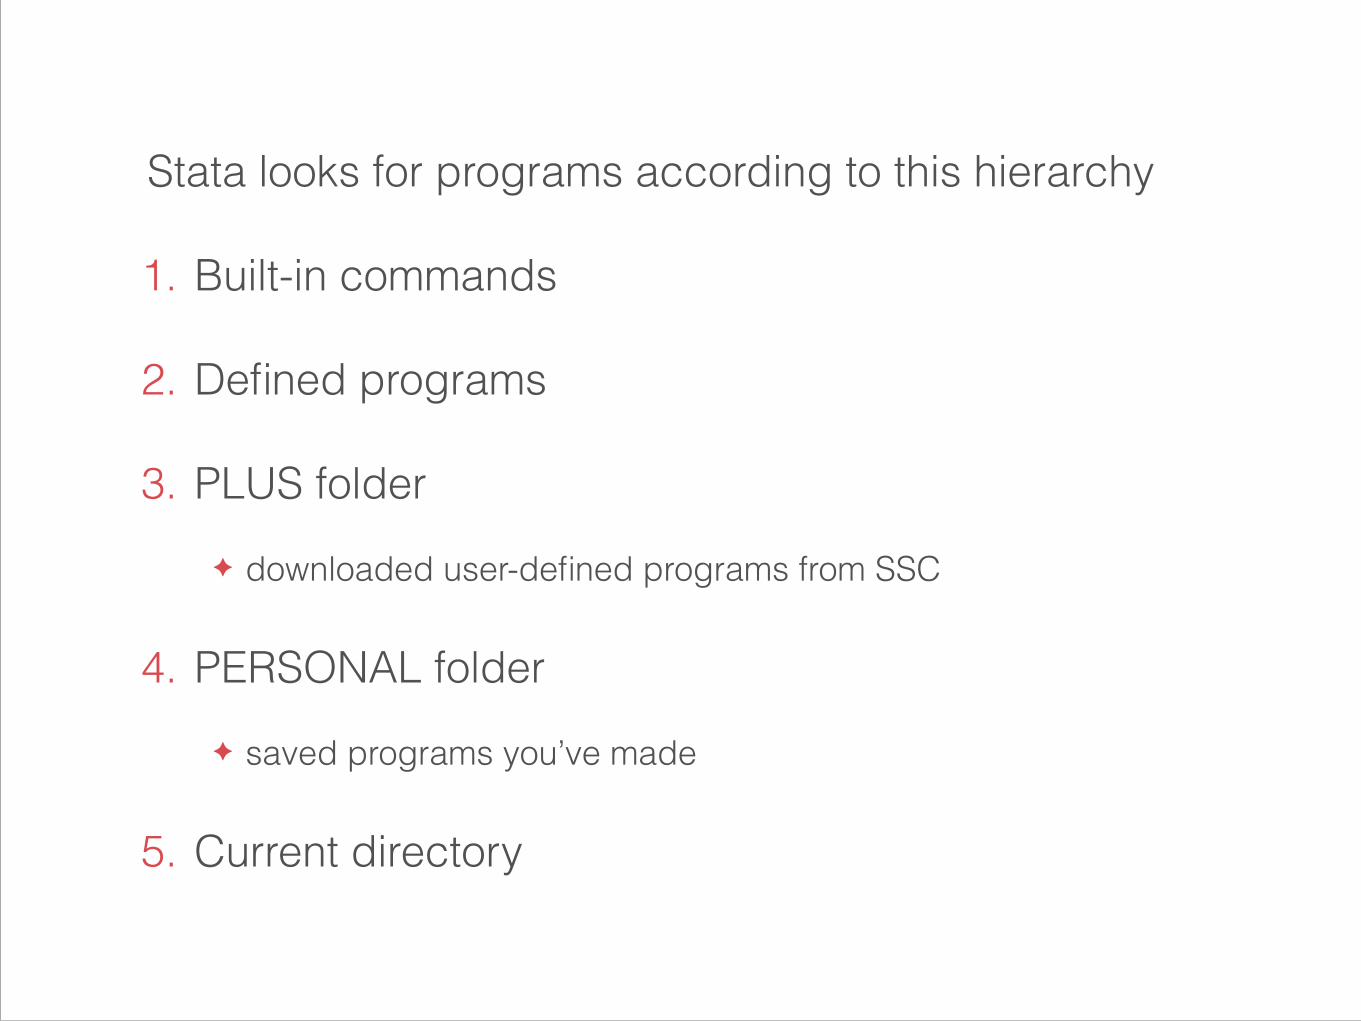
Stata looks for programs according to this hierarchy
1. Built-in commands
2. Defined programs
3. PLUS folder ✦ downloaded user-defined programs from SSC
4. PERSONAL folder ✦ saved programs you’ve made
5. Current directory

When should I use do-files, programs within do-files and ado-files?
1. Never use Stata interactively.
2. Use do-files for sequential analysis.
3. Store programs in do-files if blocks of code will be used more than once.
4. Store ado-files in a project directory if it’s specific to that project (e.g., customised for a particular dataset) but used by more than one do-file.
5. Store ado-files in your PERSONAL ado-directory for programs specific to you but used in various projects.
6. Store ado-files in the SITE ado-directory for programs your team will use.
7. Submit your ado-file to Boston College Statistical Software Components (SSC) if you think other people will want to use it, too.
Source: Adapted from Stata NetCourse 151: Indtroduction to Stata Programming
Exercises
✦ Save whatsmyname as an ado-file in your current directory.
✦ Change whatsmyname.ado to display the last name then the first name. Did it work? Why not?
✦ Now change whatsmyname.ado back. Did it work? Why not?
Example
discard
whatsmyname Iko Hengel

Writing a help-file

✦ If you use a program regularly, a simple help-file isn’t a bad idea.
✦ help-files are just text-files saved with the same name as the ado-file it “help” and an .sthlp ending.
✦ Keep it in the same directory as its corresponding ado-file.
Source: Adapted from Stata NetCourse 151: Indtroduction to Stata Programming
Exercises
✦ Write a simple help-file for whatsmyname.ado and save it. Does it come up when you type help whatsmyname in the console?
Version control

✦ Start every do-file and ado-program with version vnum
✦ Stata changes, so some features which worked one way in one version don’t work that same way in another version
✦ Including version vnum tells Stata which version to use when interpreting the do-file or program so it does what you want it to do
✦ Use a version marker comment
✦ *! myprogram 20 Feb 2014 version 13.1
Source: Adapted from Stata NetCourse 151: Indtroduction to Stata Programming

Exercises
✦ Modify whatsmyname so it includes the version of Stata you coded it in and an appropriate version marker.

Organising do-files

Organising do-files: Stata’s method
✦ One directory per project.
✦ No analysis should be done interactively.
✦ All do-files create logs
✦ Separate dataset creation do-files from analysis do-files, naming the former cr*.do and the latter an*.do.
✦ do-file execution is organised by a master.do which lists the do-files in the order that they are run
do file1 do file2 …
✦ Once a do-file has been listed in master.do, it is never, ever edited again. Instead, add more do-files.
Source: Adapted from Stata NetCourse 151: Indtroduction to Stata Programming
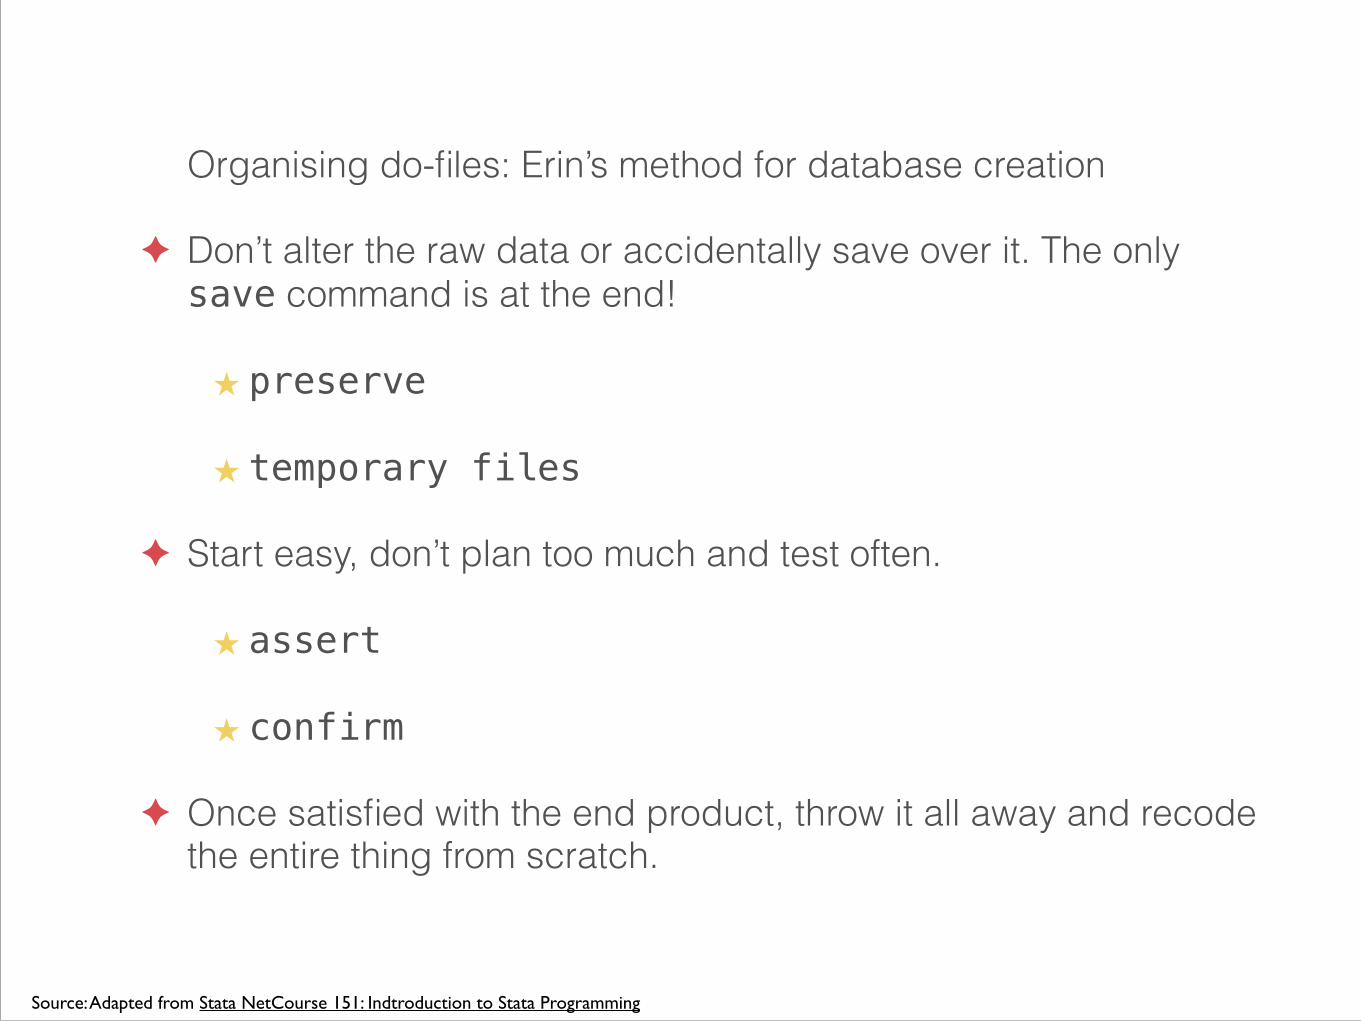
Organising do-files: Erin’s method for database creation
✦ Don’t alter the raw data or accidentally save over it. The only save command is at the end!
★ preserve
★ temporary files
✦ Start easy, don’t plan too much and test often.
★ assert
★ confirm
✦ Once satisfied with the end product, throw it all away and recode the entire thing from scratch.
Source: Adapted from Stata NetCourse 151: Indtroduction to Stata Programming

Introducing Mata
Should I use Mata?
✦ Probably not
✦ But if you are familiar with R or Matlab or just love linear algebra, thinking in matrix terms may be easier for you
✦ Or if you really need to speed up your code
Source: Adapted from Stata NetCourse 151: Indtroduction to Stata Programming

How do I use it?
✦ Just type mata in the prompt or within your do-file to invoke a Mata session.
✦ Type end to quit Mata.
Source: Adapted from Stata NetCourse 151: Indtroduction to Stata Programming

Example
mata
emat = 7 + 3
emat
emat = “Iko” + “Hengel”
emat
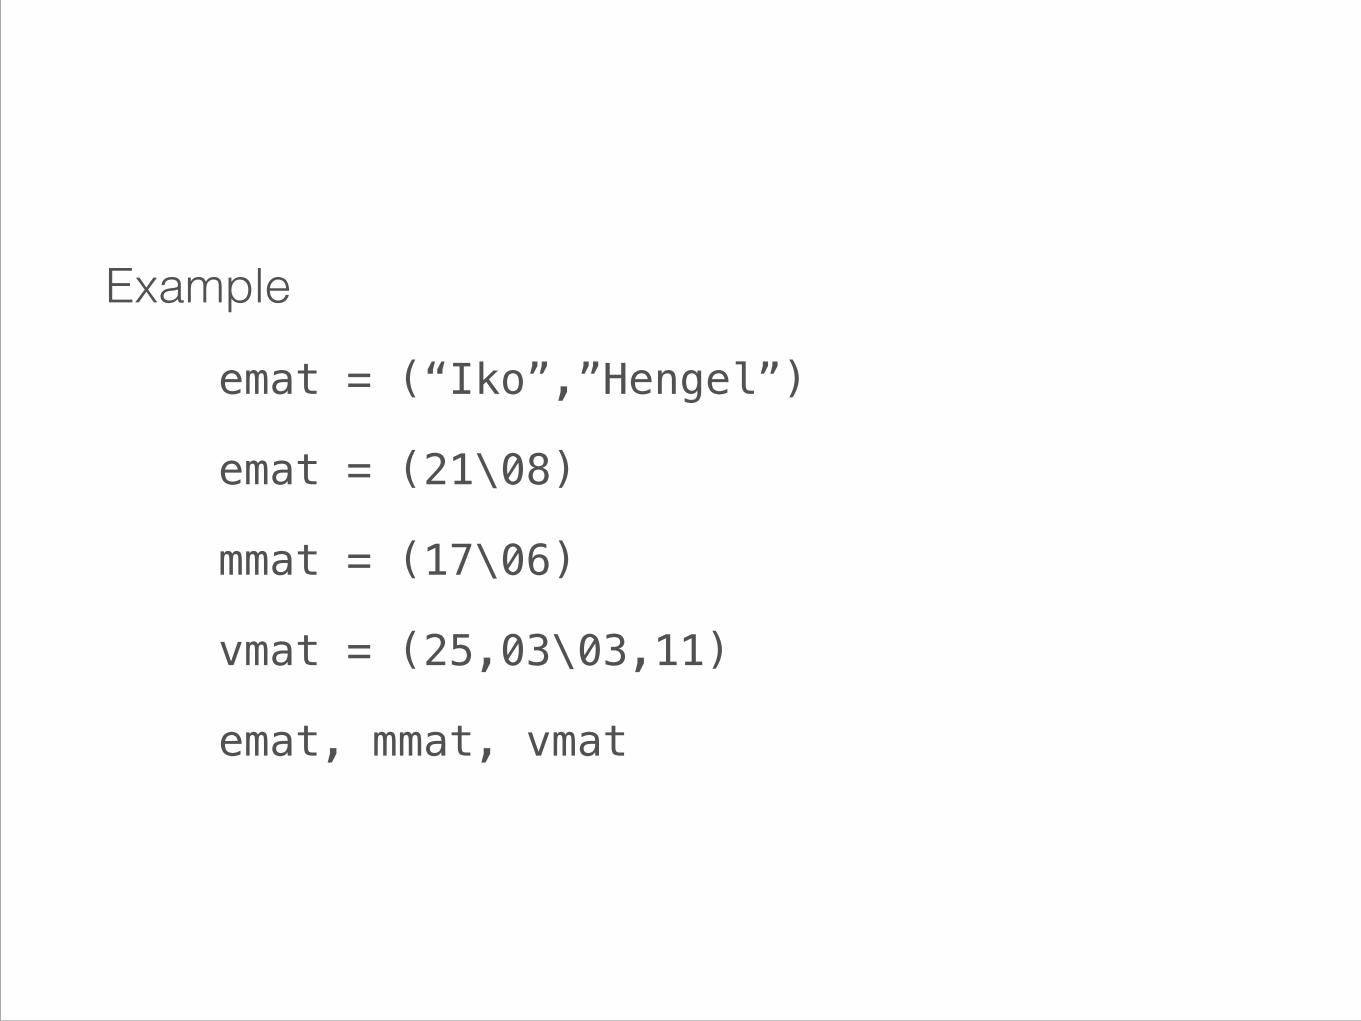
Example
emat = (“Iko”,”Hengel”)
emat = (21\08)
mmat = (17\06)
vmat = (25,03\03,11)
emat, mmat, vmat
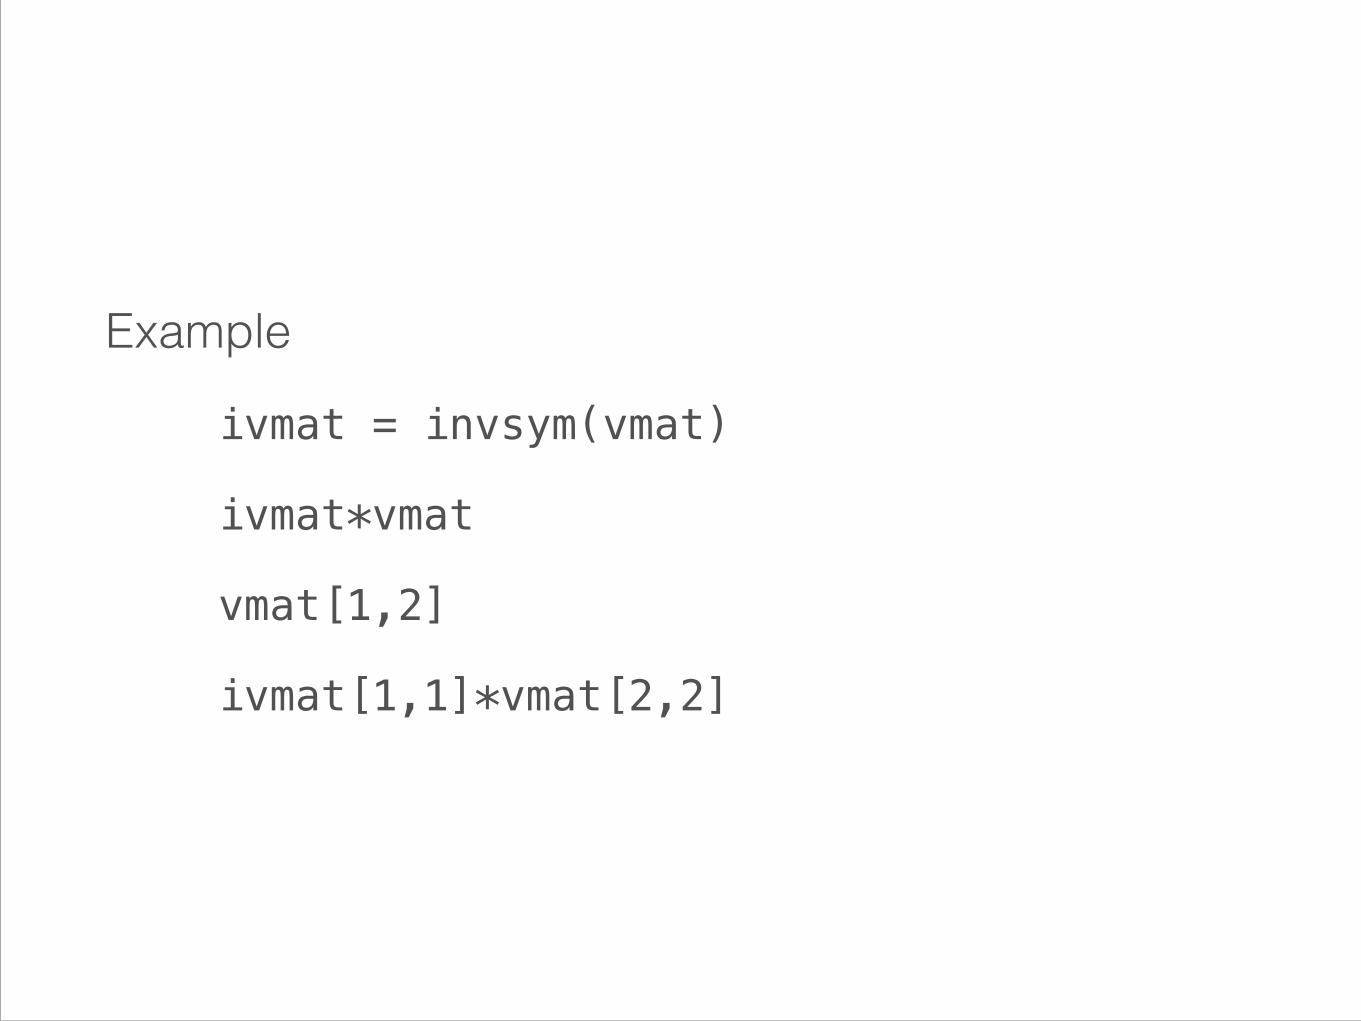
Example
ivmat = invsym(vmat)
ivmat*vmat
vmat[1,2]
ivmat[1,1]*vmat[2,2]

Example
function add(a,b) return(a+b)
add(vmat,ivmat)
add(“Iko”,”Hengel”)
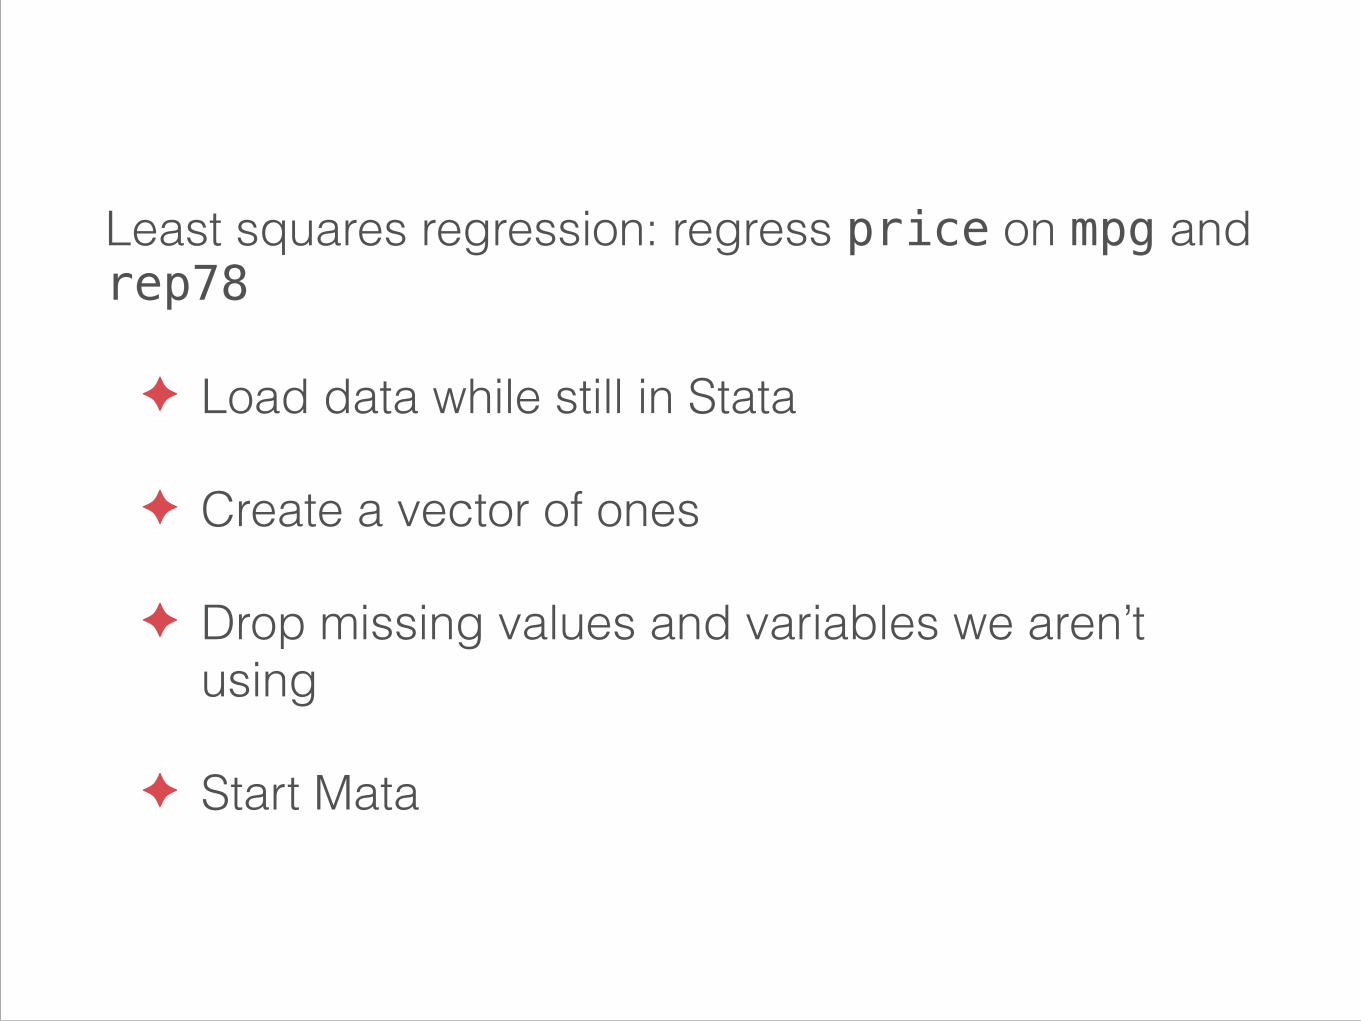
Least squares regression: regress price on mpg and rep78
✦ Load data while still in Stata
✦ Create a vector of ones
✦ Drop missing values and variables we aren’t using
✦ Start Mata
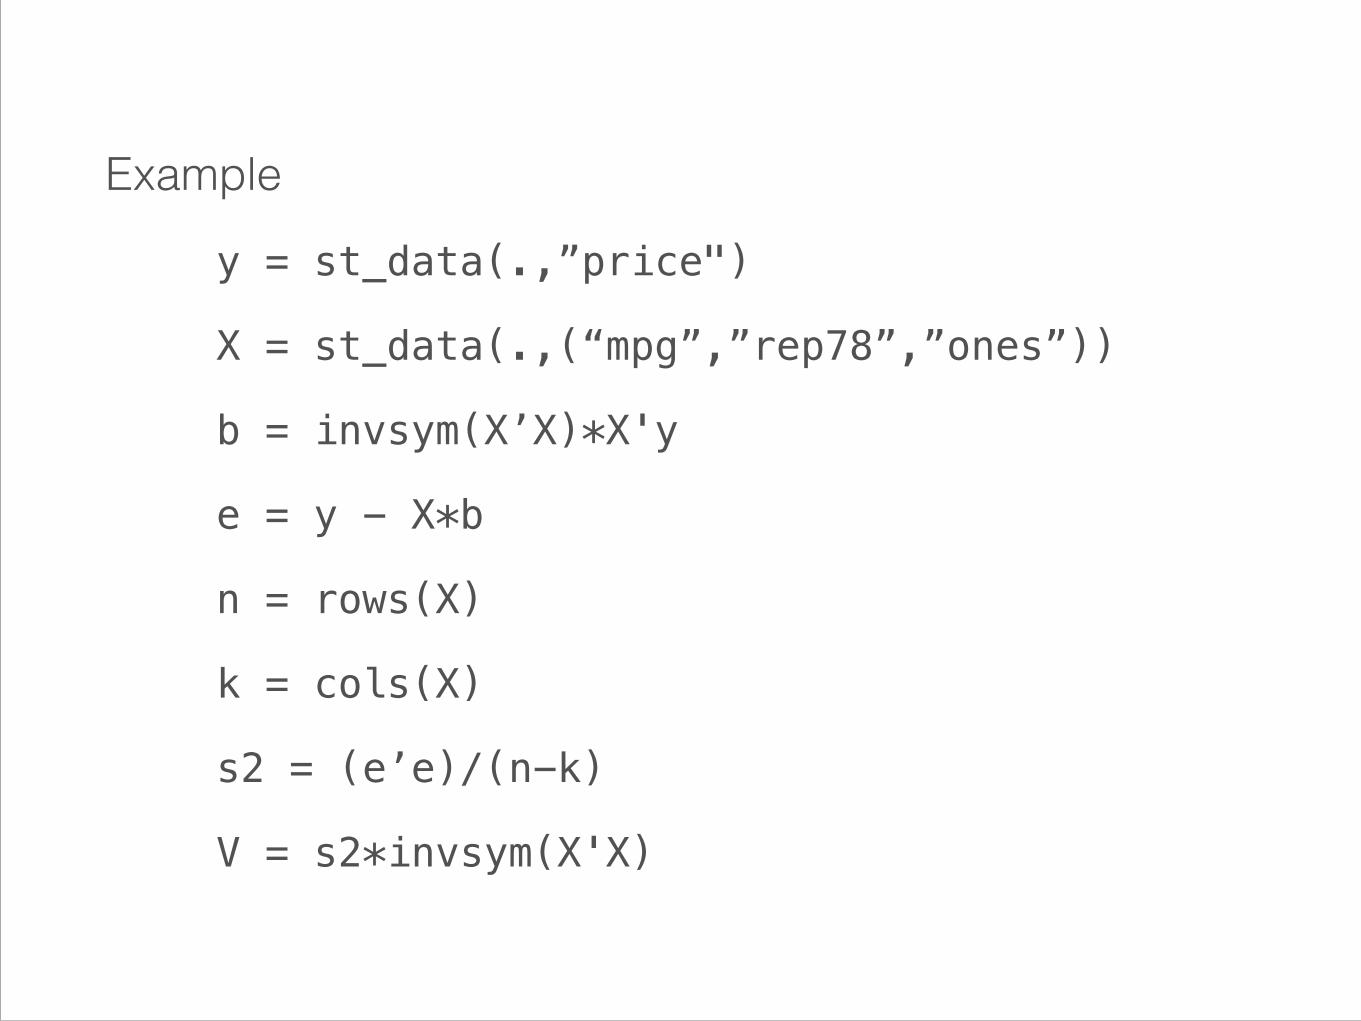
Example
y = st_data(.,”price")
X = st_data(.,(“mpg”,”rep78”,”ones”))
b = invsym(X’X)*X'y
e = y - X*b
n = rows(X)
k = cols(X)
s2 = (e’e)/(n-k)
V = s2*invsym(X'X)
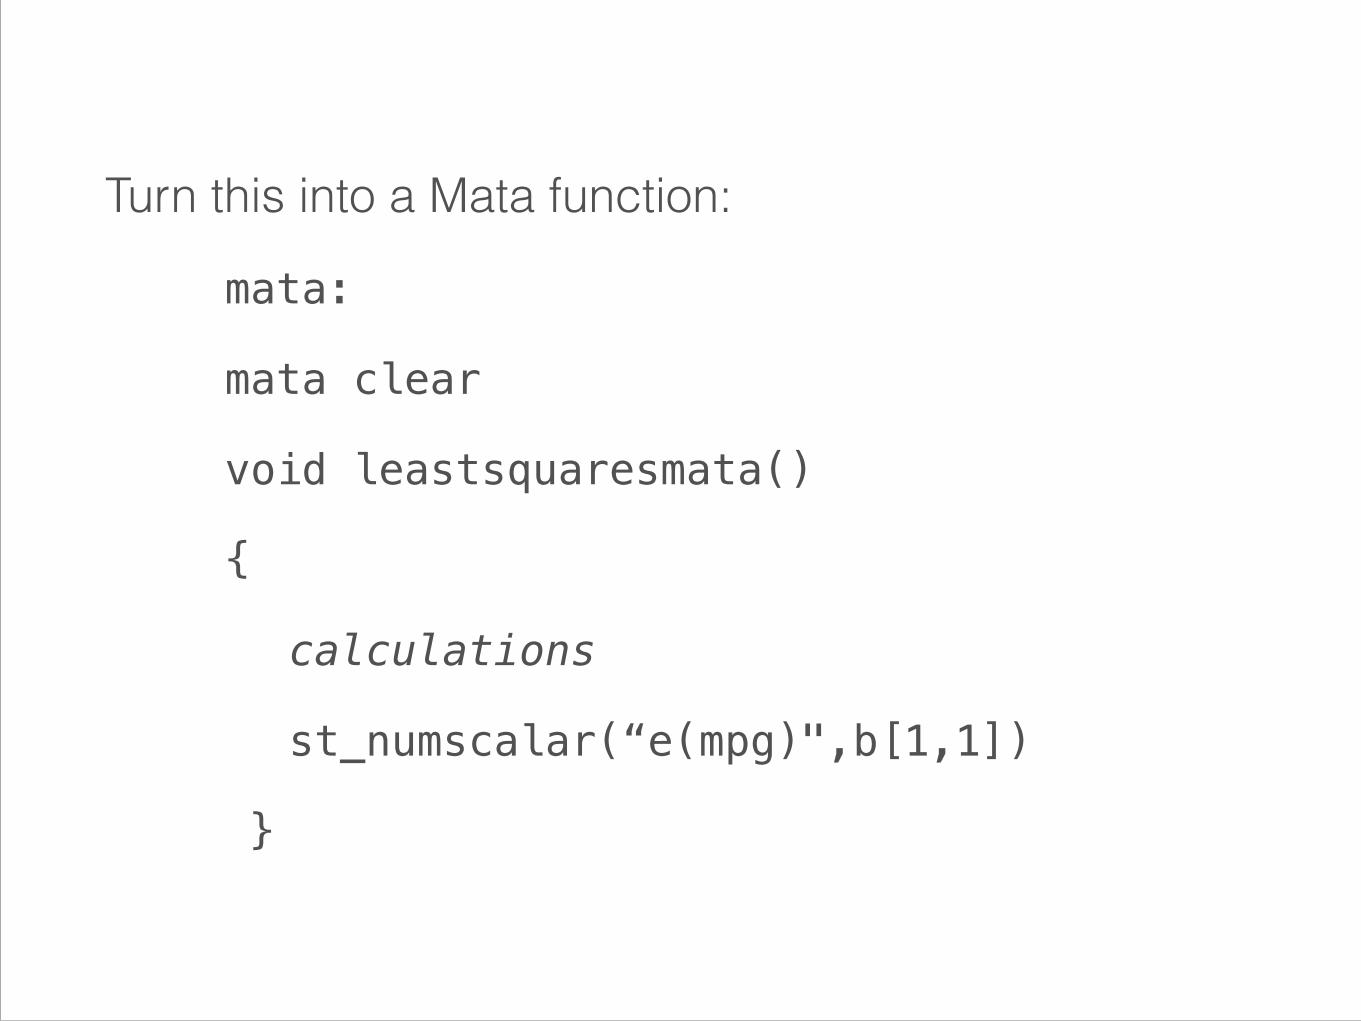
Turn this into a Mata function:
mata:
mata clear
void leastsquaresmata()
{
calculations
st_numscalar(“e(mpg)",b[1,1])
}
Exercises
✦ Modify the Mata function so that it accepts any independent variables

Reshaping data

Wide data
✦ Few observations.
✦Many variables.
✦ One variable uniquely identifies each observation.
✦Many variables contain data across one dimension.

Long data
✦Many observations.
✦ Few variables.
✦No variable uniquely identifies each observation.
✦Each variable contains data over multiple dimensions.
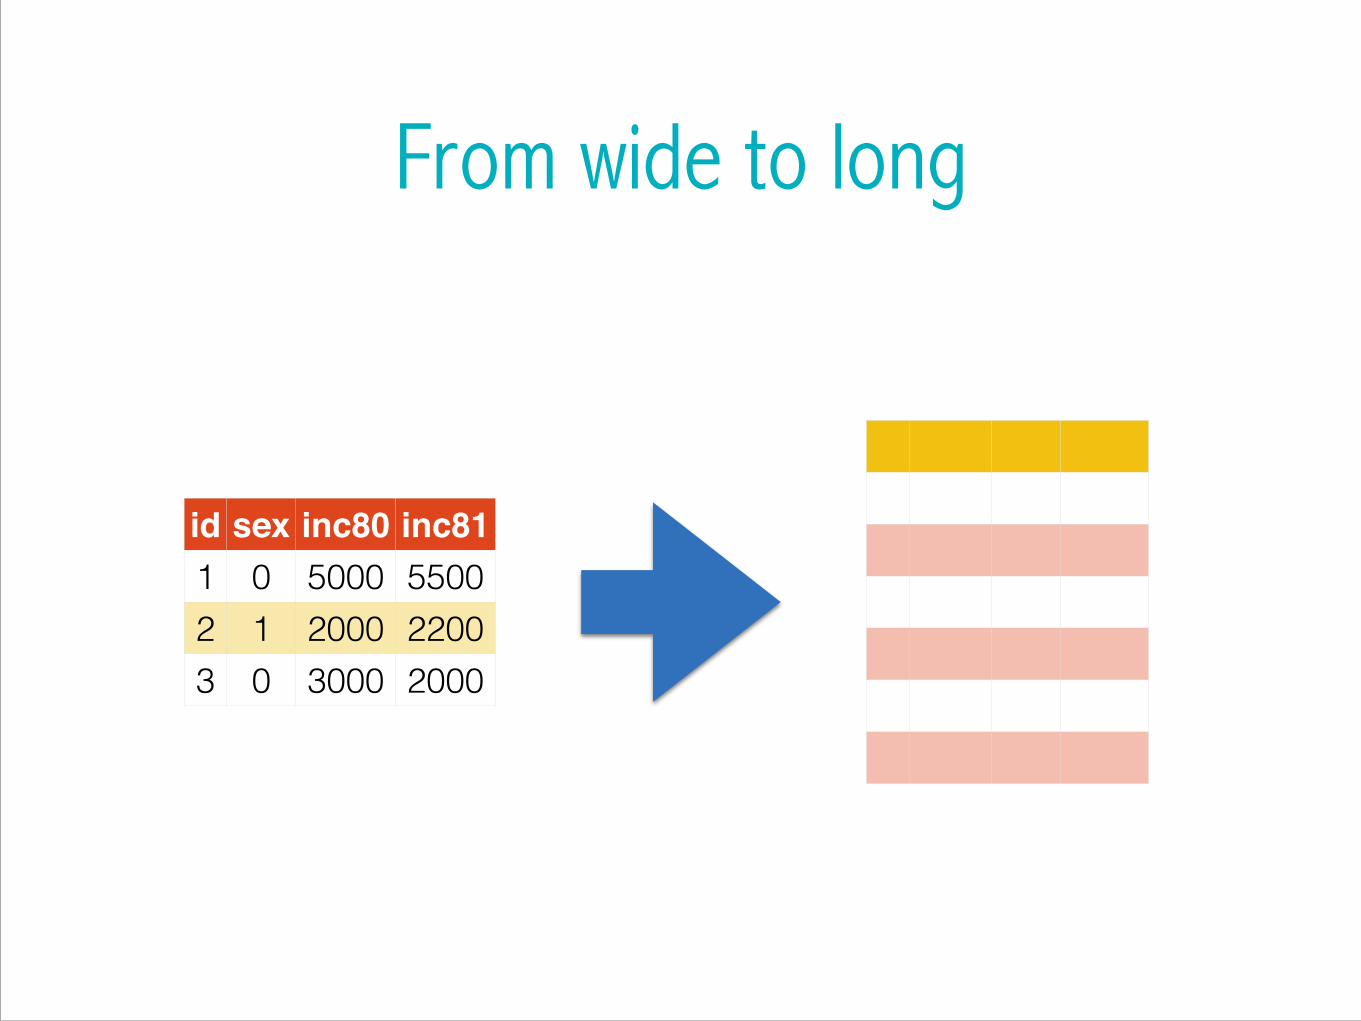
From wide to long
id sex inc80 inc811 0 5000 55002 1 2000 22003 0 3000 2000
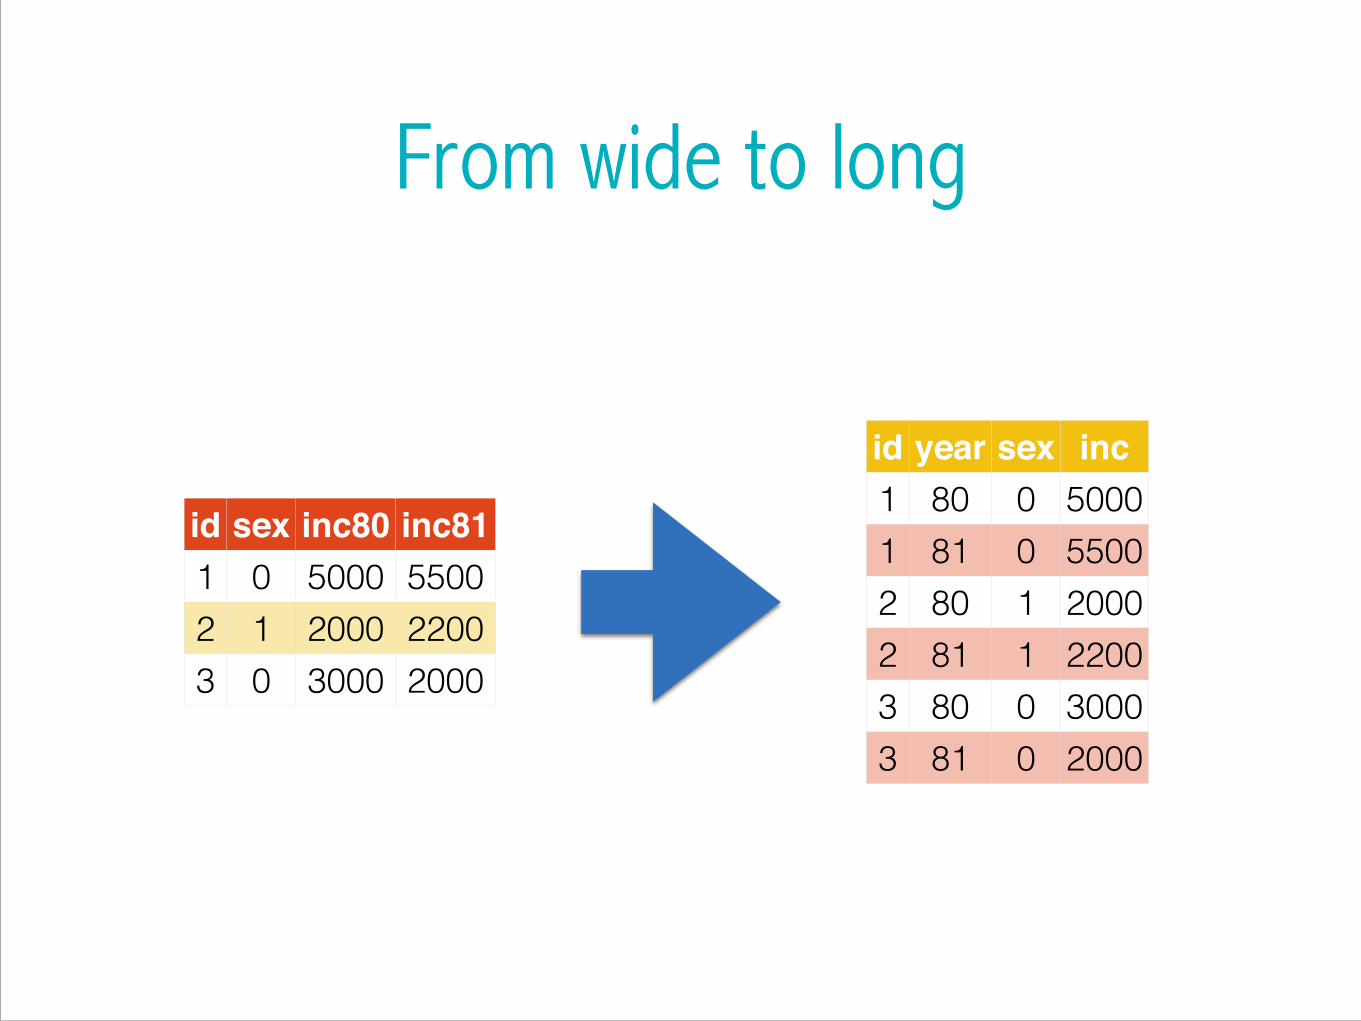
From wide to long
id sex inc80 inc811 0 5000 55002 1 2000 22003 0 3000 2000
id year sex inc1 80 0 50001 81 0 55002 80 1 20002 81 1 22003 80 0 30003 81 0 2000
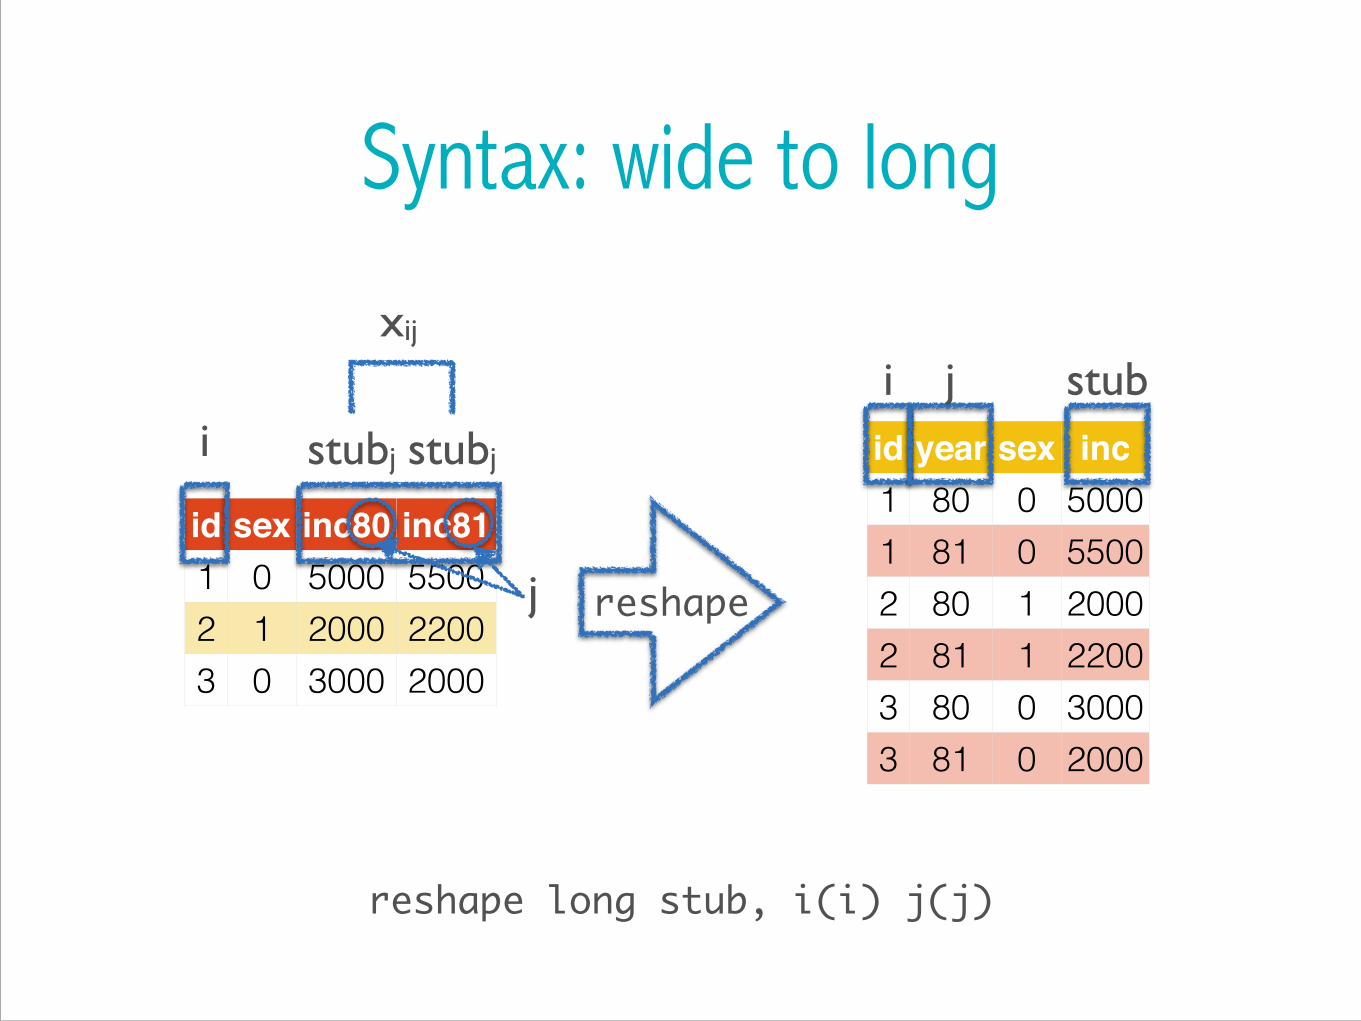
Syntax: wide to long
id sex inc80 inc811 0 5000 55002 1 2000 22003 0 3000 2000
id year sex inc1 80 0 50001 81 0 55002 80 1 20002 81 1 22003 80 0 30003 81 0 2000
i
xij
stubj stubj
j
i j stub
reshape
reshape long stub, i(i) j(j)

Exercise✦ Load reshape1 (using webuse) and drop ue80, ue81 and ue82.
webuse reshape1, cleardrop ue*
✦ Is the data long or wide? Convert to the other form.
reshape long inc, i(id) j(year)
✦Use a shortcut to convert the data back again.
reshape wide
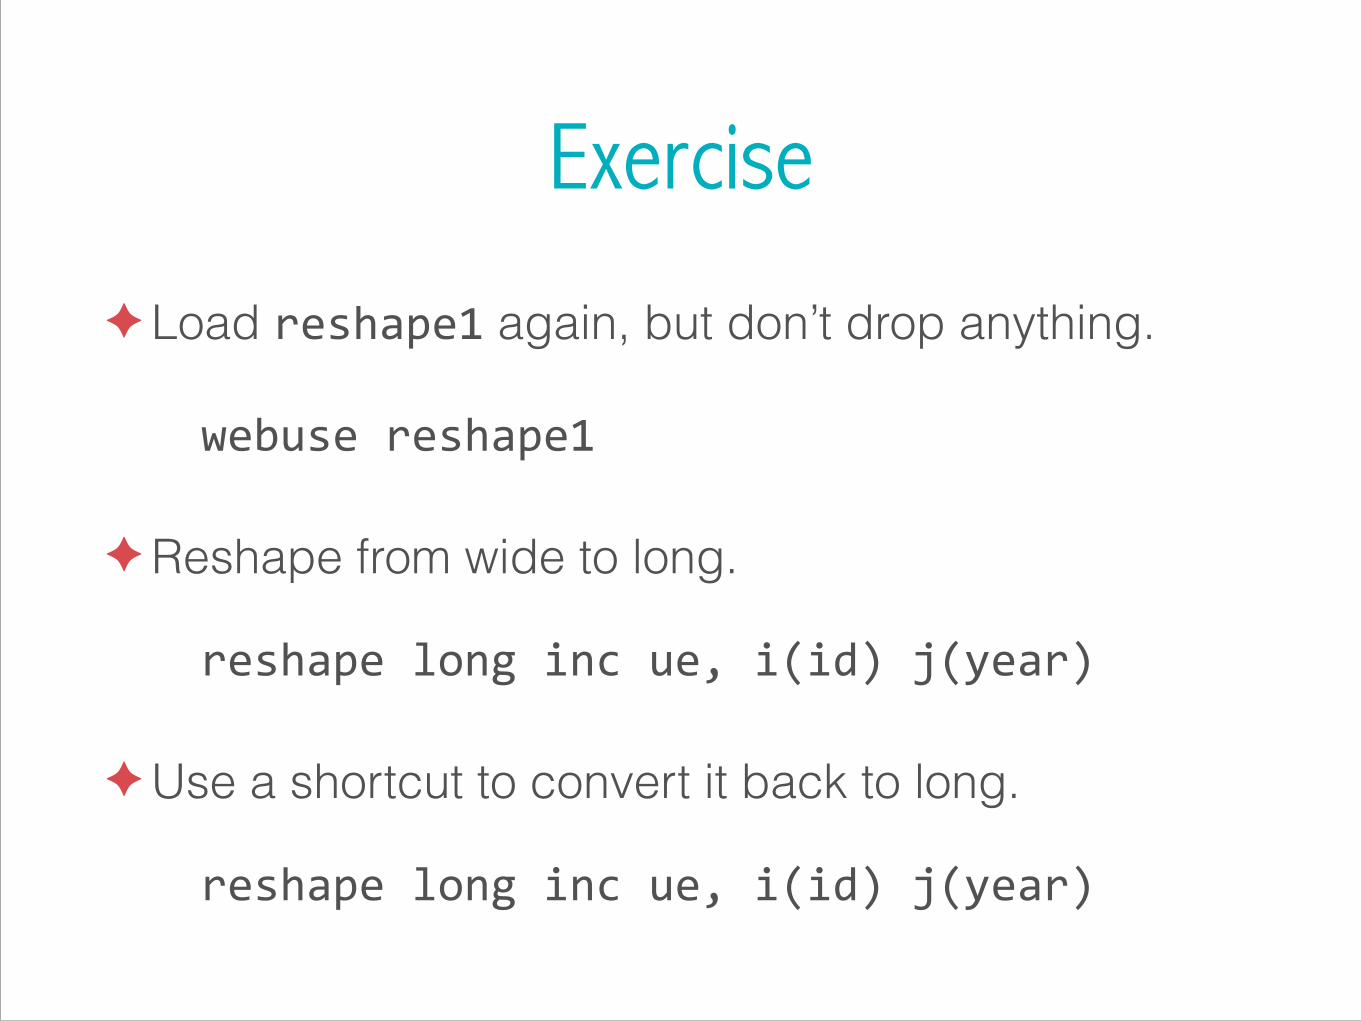
Exercise
✦ Load reshape1 again, but don’t drop anything.
webuse reshape1
✦Reshape from wide to long.
reshape long inc ue, i(id) j(year)
✦Use a shortcut to convert it back to long.
reshape long inc ue, i(id) j(year)

Exercise
✦ Load reshape2 from the web.
webuse reshape2
✦ Try to reshape from wide to long.
reshape long inc ue, i(id) j(year)
✦Why did you get an error?
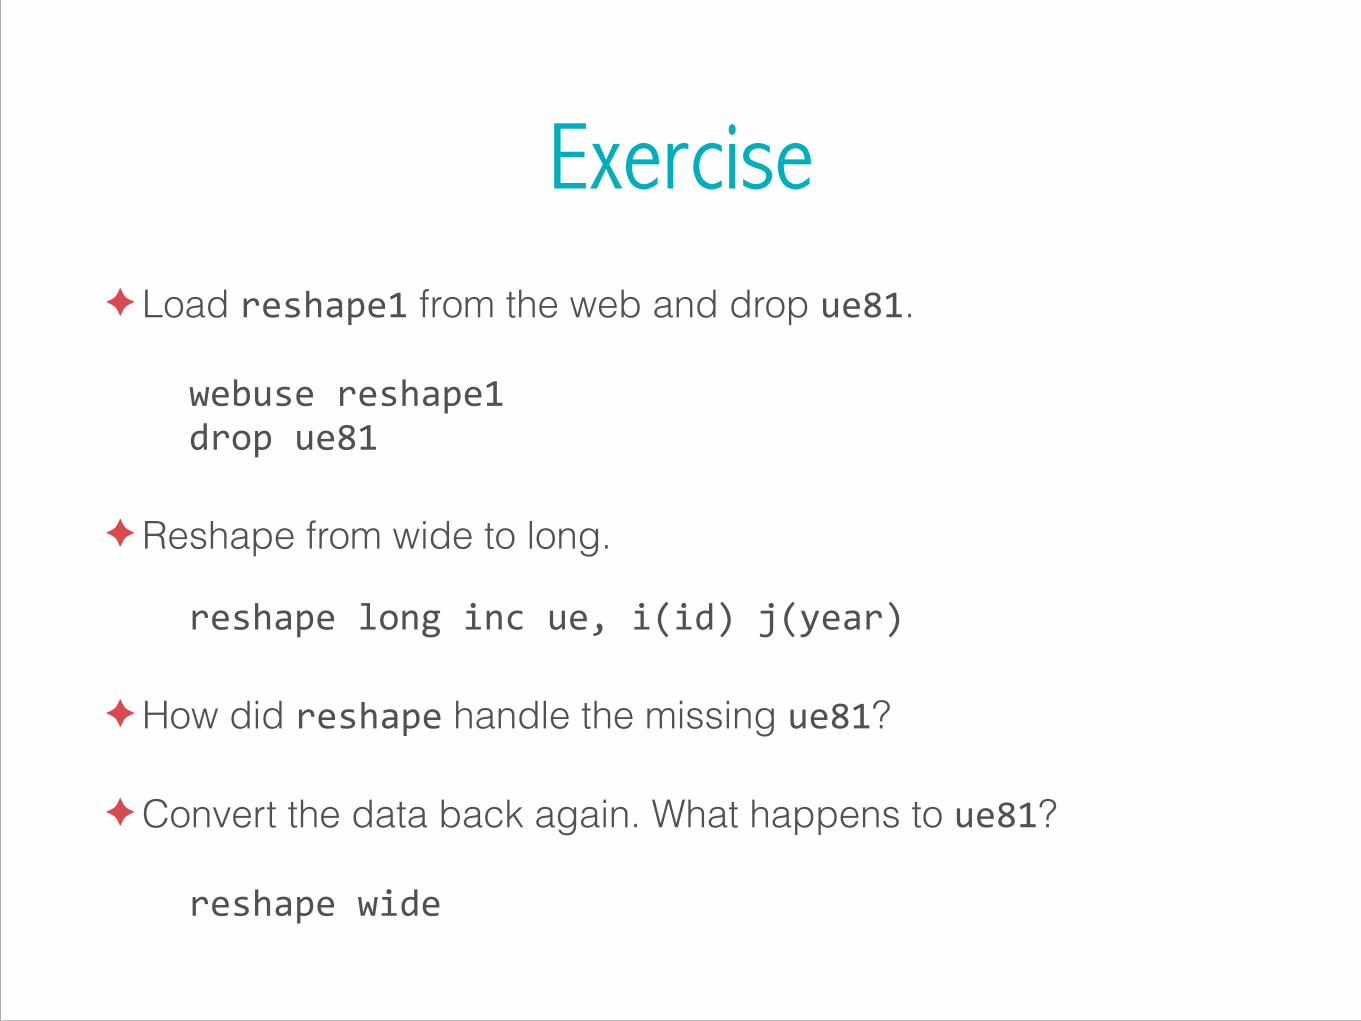
Exercise✦ Load reshape1 from the web and drop ue81.
webuse reshape1drop ue81
✦Reshape from wide to long.
reshape long inc ue, i(id) j(year)
✦How did reshape handle the missing ue81?
✦Convert the data back again. What happens to ue81?
reshape wide
Exercise
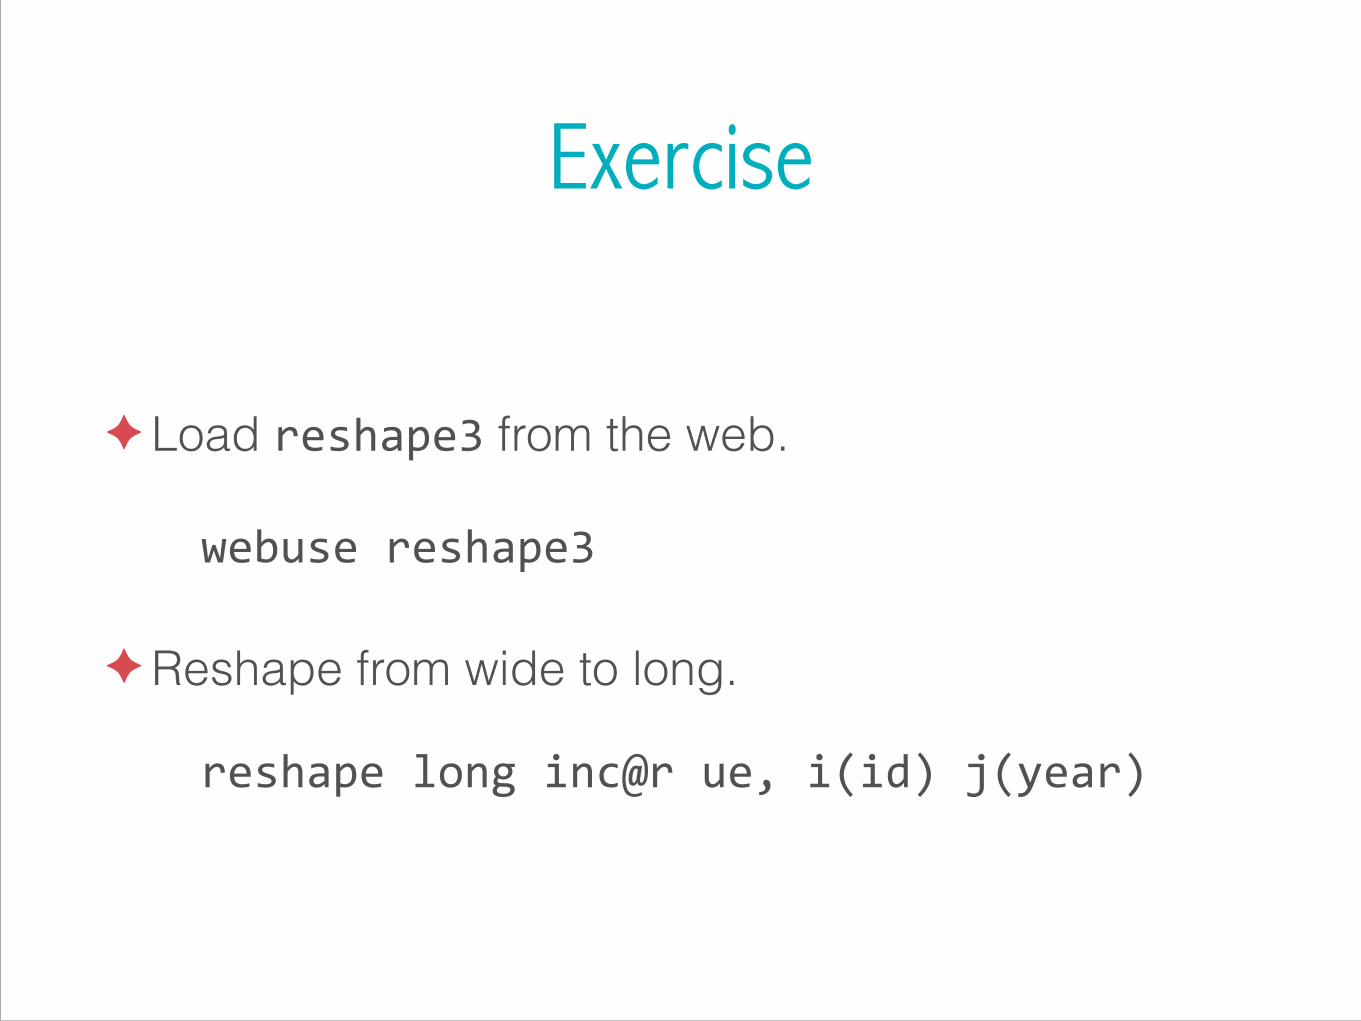
✦ Load reshape3 from the web.
webuse reshape3
✦Reshape from wide to long.
reshape long inc@r ue, i(id) j(year)
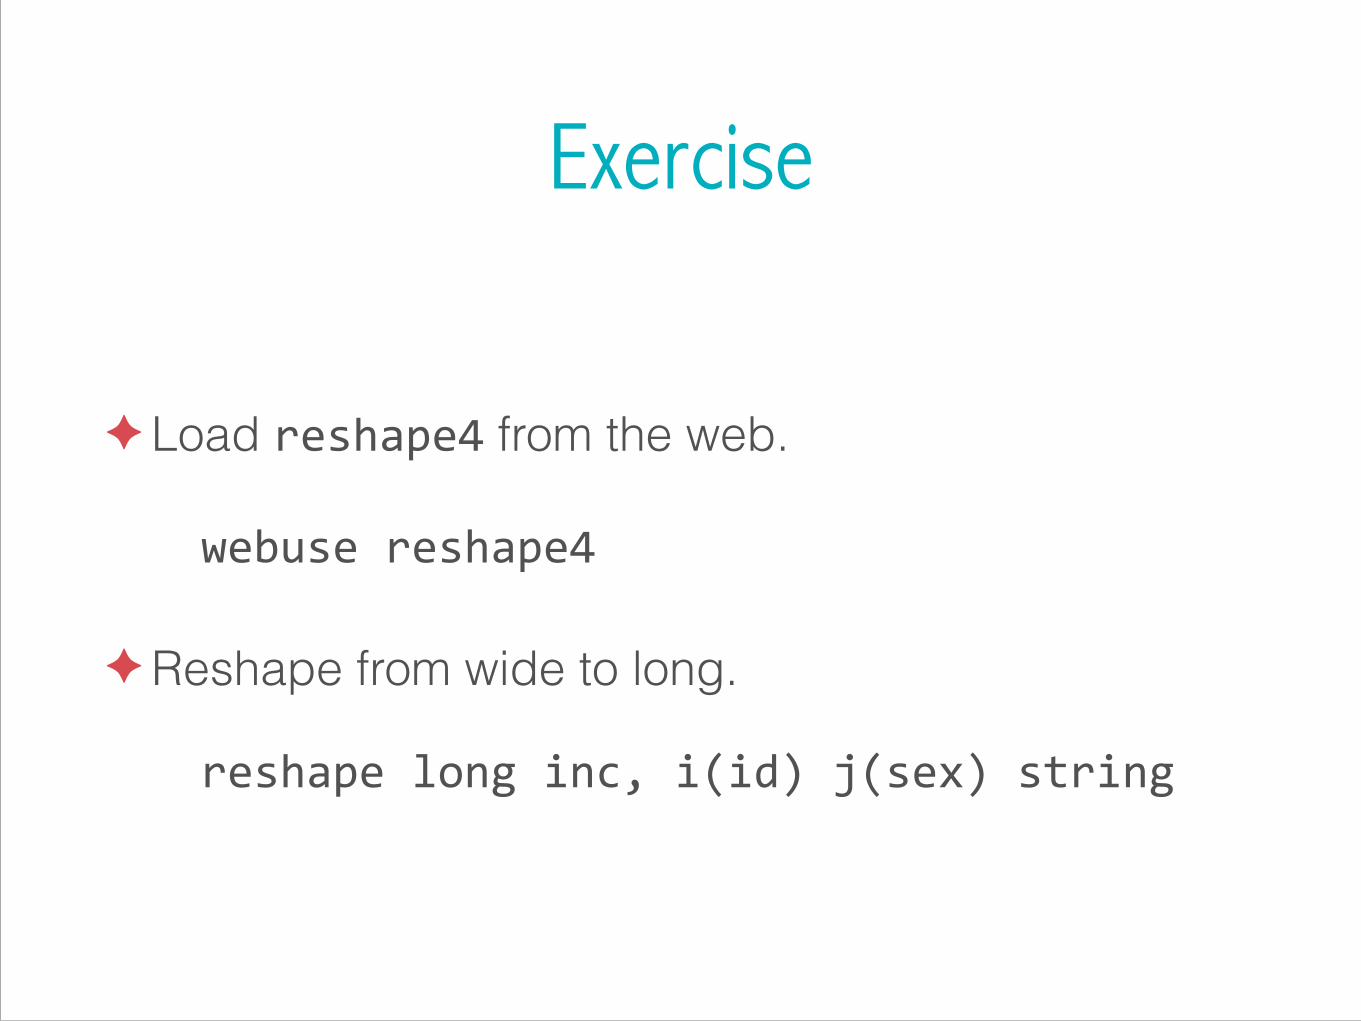
Exercise
✦ Load reshape4 from the web.
webuse reshape4
✦Reshape from wide to long.
reshape long inc, i(id) j(sex) string

From long to wide
id sex kids inc1 f 0 90001 m 0 20002 f 1 70002 m 1 10003 f 2 30003 m 2 8000

From long to wide
id kids incm incf1 0 2000 90002 1 1000 70003 2 8000 3000
id sex kids inc1 f 0 90001 m 0 20002 f 1 70002 m 1 10003 f 2 30003 m 2 8000
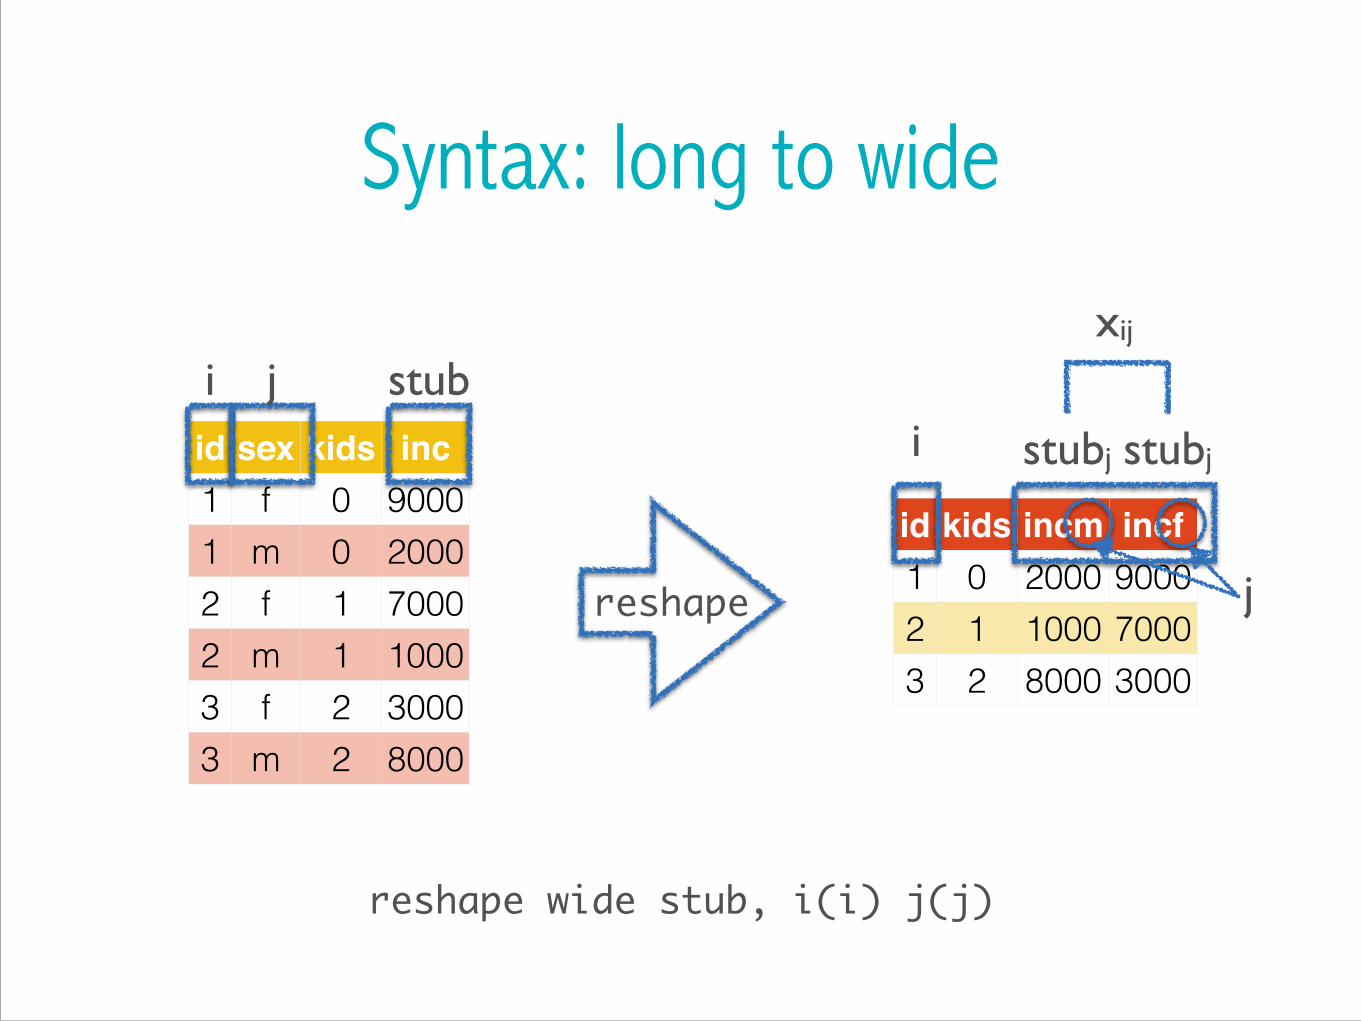
Syntax: long to wide
id kids incm incf1 0 2000 90002 1 1000 70003 2 8000 3000
id sex kids inc1 f 0 90001 m 0 20002 f 1 70002 m 1 10003 f 2 30003 m 2 8000
i j stubi
xij
stubj stubj
jreshape
reshape wide stub, i(i) j(j)

Exercise
✦ Load reshape6 from the web.
webuse reshape6
✦Reshape from long to wide.
reshape wide inc ue, i(id) j(year)
✦Why did you get an error?
Exercise
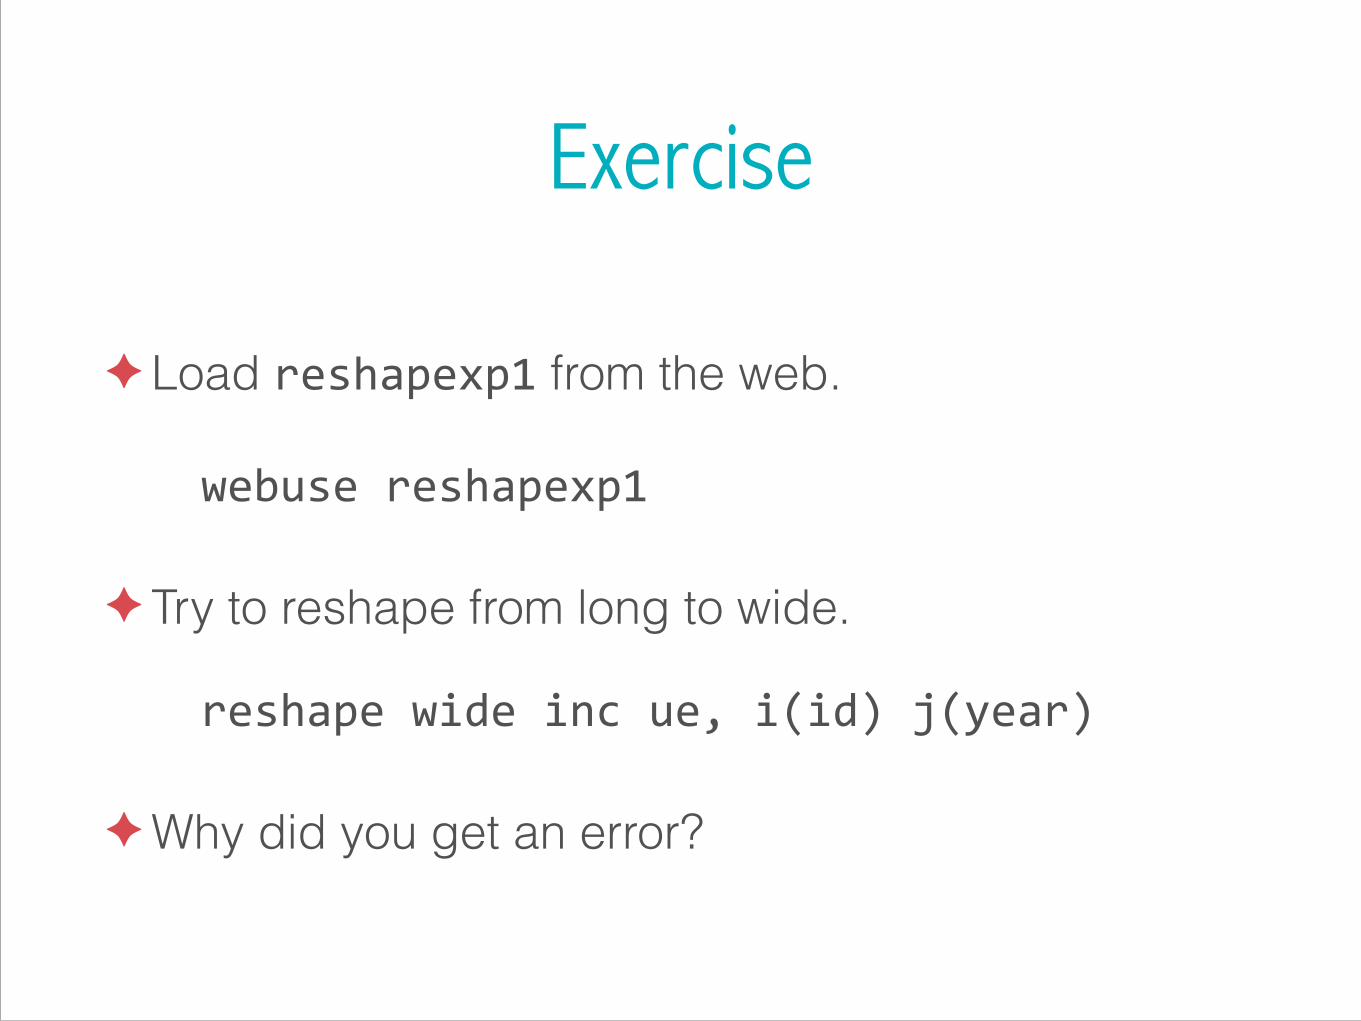
✦ Load reshapexp1 from the web.
webuse reshapexp1
✦ Try to reshape from long to wide.
reshape wide inc ue, i(id) j(year)
✦Why did you get an error?

reshape isn’t working…
✦ Wide to long: does i uniquely identify every observation?
tabulate ireturn list
reshape isn’t working…
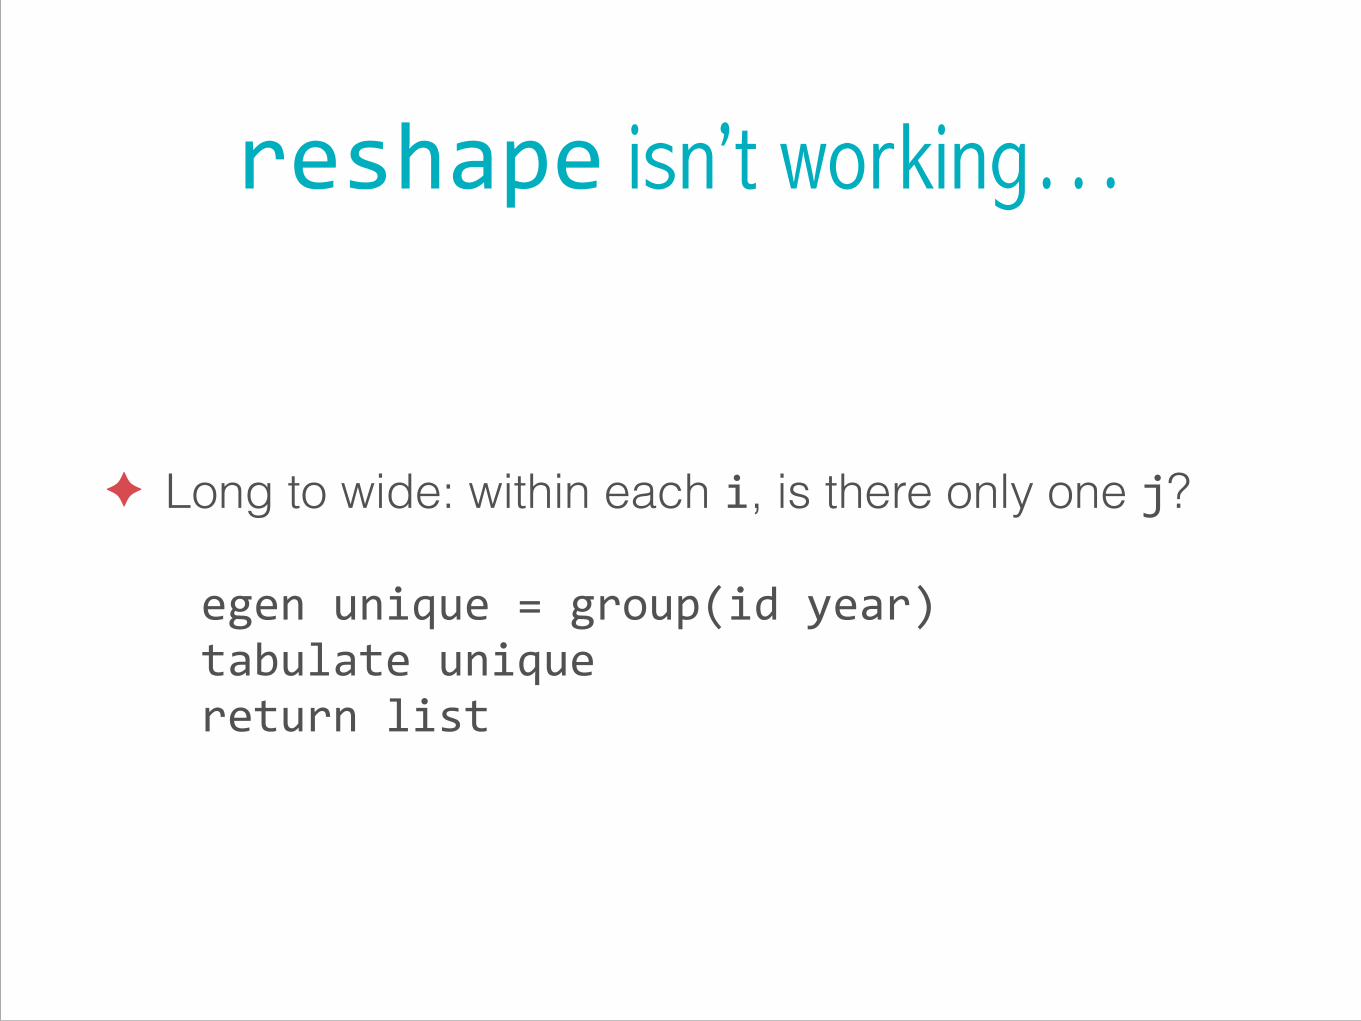
✦ Long to wide: within each i, is there only one j?
egen unique = group(id year)tabulate uniquereturn list
reshape isn’t working…
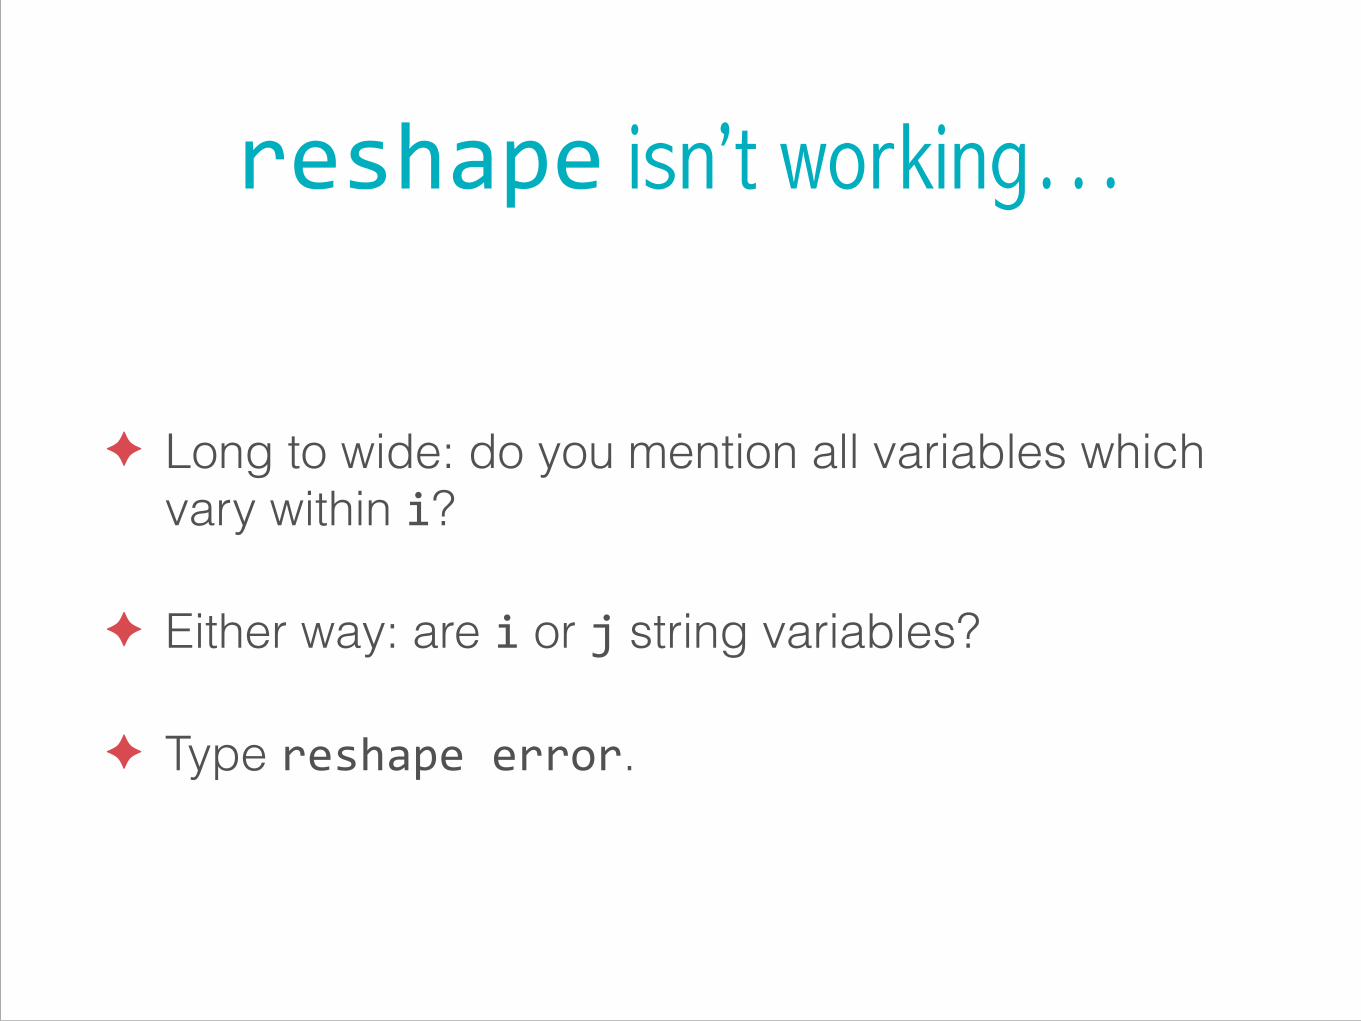
✦ Long to wide: do you mention all variables which vary within i?
✦ Either way: are i or j string variables?
✦ Type reshape error.

Collapsing data
Why do we want to do this?
✦Collapsing data is Stata’s version of pivot tables.
✦ It’s a quick and dirty way to make graphs and tables.
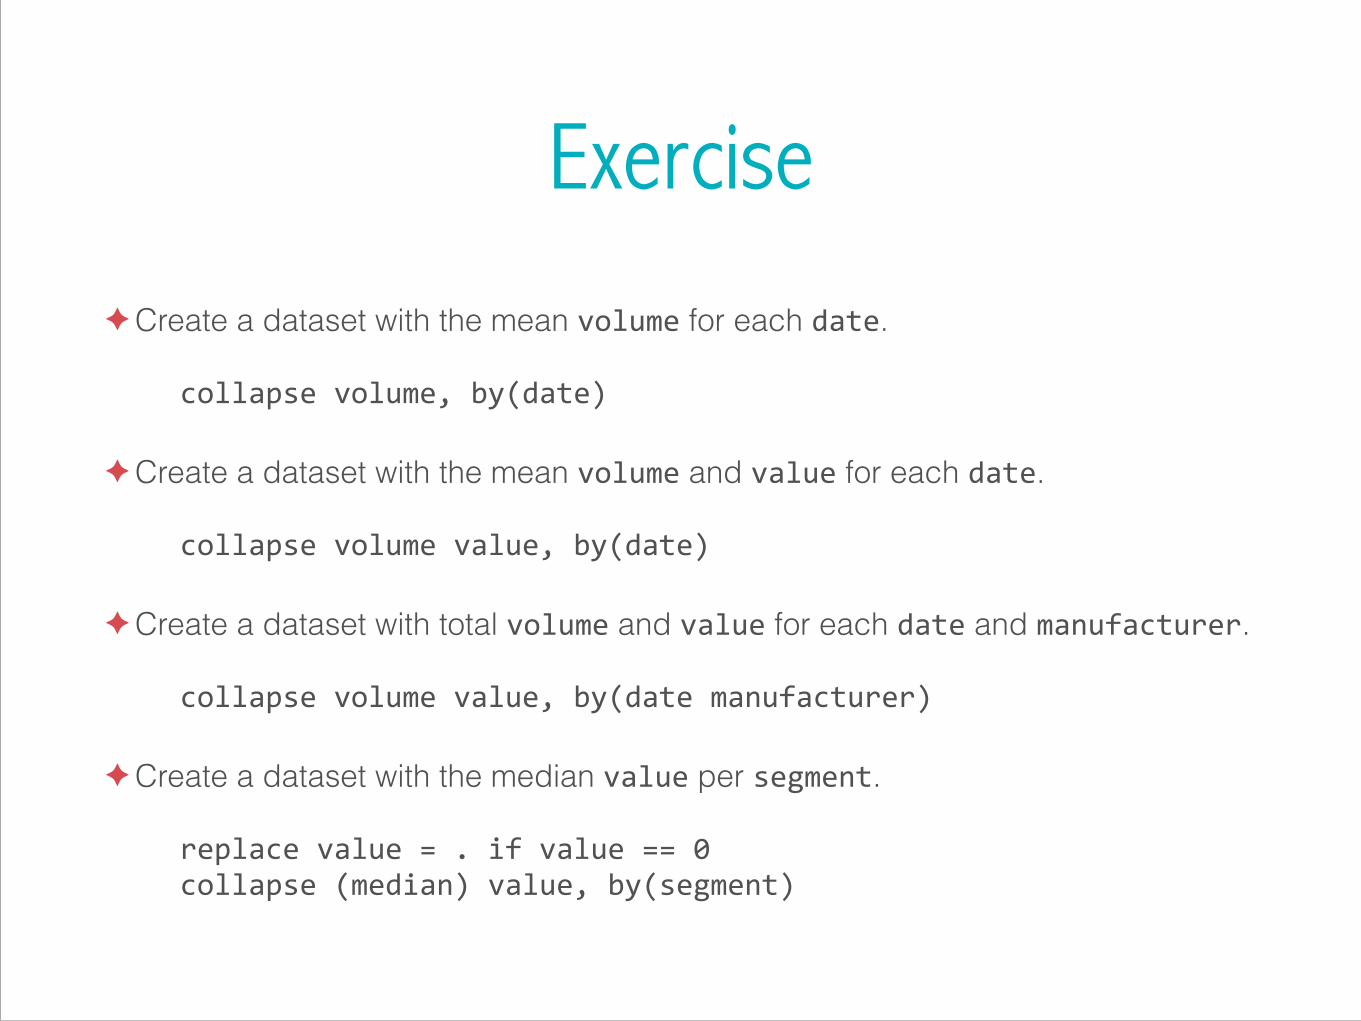
Exercise
✦Create a dataset with the mean volume for each date.
collapse volume, by(date)
✦Create a dataset with the mean volume and value for each date.
collapse volume value, by(date)
✦Create a dataset with total volume and value for each date and manufacturer.
collapse volume value, by(date manufacturer)
✦Create a dataset with the median value per segment.
replace value = . if value == 0collapse (median) value, by(segment)

Exercise✦Create a dataset with the count of value and volume by year and barsize.
recode date /// (564/575 = 2007) /// (576/587 = 2008) /// (588/599 = 2009) /// (600/611 = 2010) /// (612/623 = 2011) /// (624/635 = 2012) /// (nonmissing = 2013), /// generate(year) collapse (count) volume value, by(barsize year)
✦Create a dataset with the standard deviation of volume and minimum of value for each brand per year; retain the manufacturer variable.
collapse (first) manufacturer (sd) value, by(brand year)
!107

Schemes

What is a scheme?
✦Schemes define the overall look of a graph.
✦Within a scheme file, define graph colours, text sizes, backgrounds, etc.
✦Stata’s default schemes are ugly, but we can change that

How do I make a scheme?✦Create a new file called myscheme-‐scheme.scheme and
save it in your personal ado folder.
✦Each entry in a scheme file specifies how a particular attribute of a graph element looks.
✦ First line should always be #include s2color.
✦ help scheme describes how to create your own schemes.
✦ help scheme entries lists all possible definitions to include in myscheme-‐scheme.scheme.
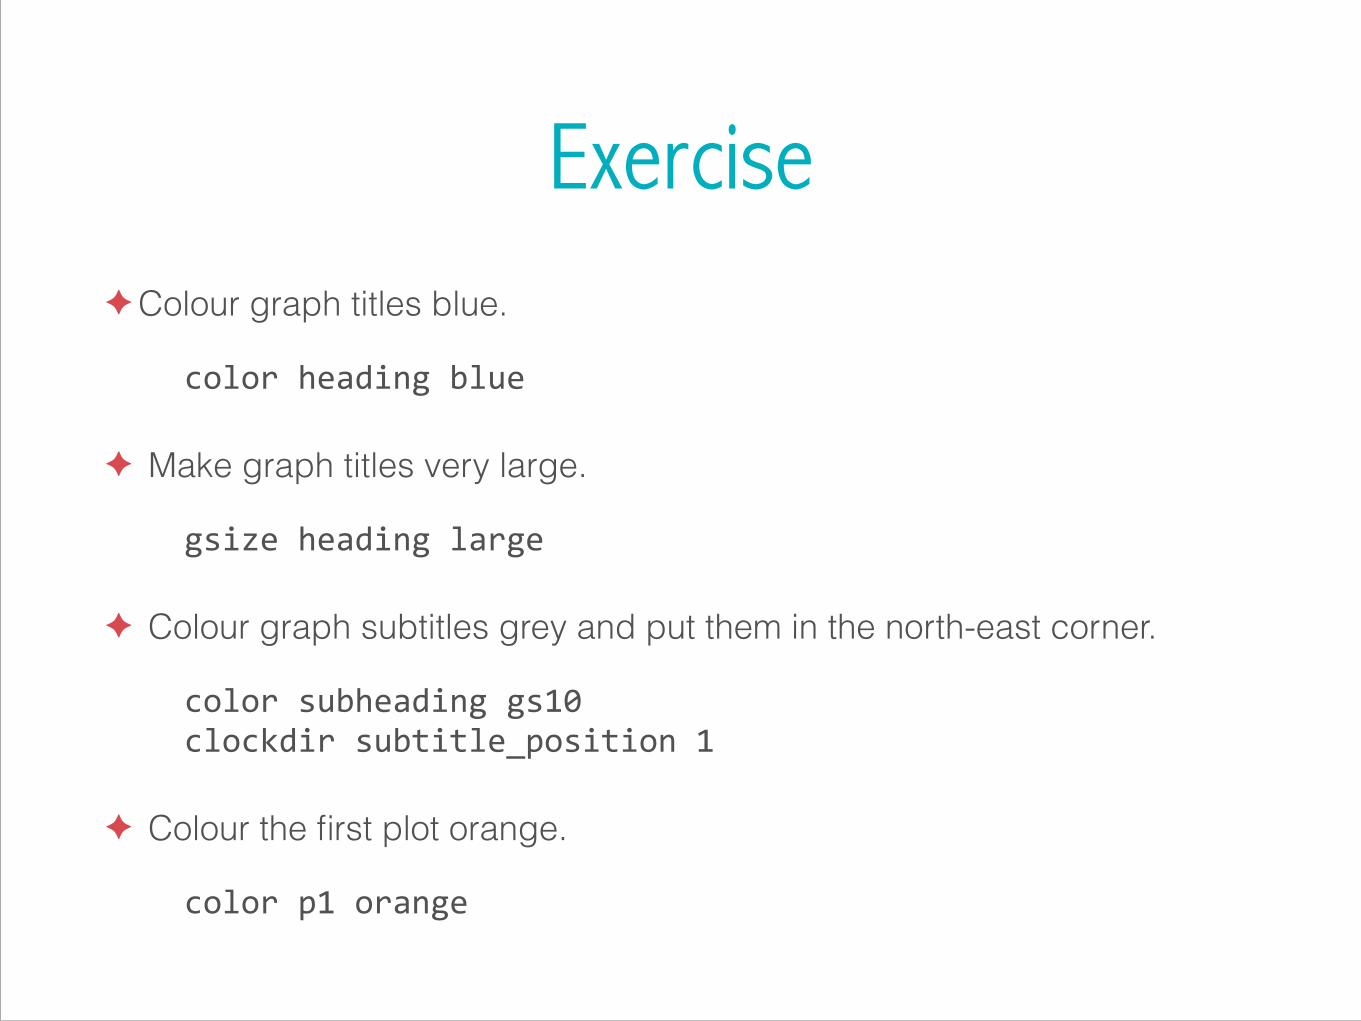
Exercise✦Colour graph titles blue.
color heading blue
✦ Make graph titles very large.
gsize heading large
✦ Colour graph subtitles grey and put them in the north-east corner.
color subheading gs10clockdir subtitle_position 1
✦ Colour the first plot orange.
color p1 orange

Exercise✦Colour the background black.
color background black
✦ Colour grid-lines as RGB 200 200 200.
color major_grid “200 200 200"
✦ Make x-axis labels horizontal.
anglestyle vertical_tick horizontal
✦ Place graph legends in the south-east corner.
clockdir legend_position 4