programming cost estimates for military …
TRANSCRIPT
TM 5-800-4
TECHNICAL MANUAL
PROGRAMMING COST ESTIMATES
FOR
MILITARY CONSTRUCTION
APPROVED FOR PUBLIC RELEASE; DISTRIBUTION IS UNLIMITED
HEADQUARTERS, DEPARTMENT OF THE ARMY
MAY 1994

REPRODUCTION AUTHORIZATION/RESTRICTIONS
This manual has been prepared by or for the Government and ispublic property and not subject to copyright.
Reprints or republications of this manual should include a creditsubstantially as follows: “Headquarters, Department of theArmy, TM 5-800-4, Programming Cost Estimates for MilitaryConstruction, 25 May 1994.”

i
APPROVED FOR PUBLIC RELEASE; DISTRIBUTION IS UNLIMITED
TM 5-800-4
TECHNICAL MANUAL HEADQUARTERSDEPARTMENT OF THE ARMY
No. 5-800-4 WASHINGTON, DC, 24 May 1994
PROGRAMMING COST ESTIMATESFOR MILITARY CONSTRUCTION
Paragraph Page
Purpose . . . . . . . . . . . . . . . . . . . . . . . . . . . . . . . . . . . . . . . . . . . . . . . . . . . . . . . . . . . . . . . . . . . . 1 1
Scope . . . . . . . . . . . . . . . . . . . . . . . . . . . . . . . . . . . . . . . . . . . . . . . . . . . . . . . . . . . . . . . . . . . . . . 2 1
Reference . . . . . . . . . . . . . . . . . . . . . . . . . . . . . . . . . . . . . . . . . . . . . . . . . . . . . . . . . . . . . . . . . . . 3 1
Overview . . . . . . . . . . . . . . . . . . . . . . . . . . . . . . . . . . . . . . . . . . . . . . . . . . . . . . . . . . . . . . . . . . . . 1
Use of Adjustment Factors . . . . . . . . . . . . . . . . . . . . . . . . . . . . . . . . . . . . . . . . . . . . . . . . . . . . . 5 1
Facility Unit Costs . . . . . . . . . . . . . . . . . . . . . . . . . . . . . . . . . . . . . . . . . . . . . . . . . . . . . . . . . . . . . 6 1
Supporting Facilities Costs . . . . . . . . . . . . . . . . . . . . . . . . . . . . . . . . . . . . . . . . . . . . . . . . . . . . . 7 3
Project Costs . . . . . . . . . . . . . . . . . . . . . . . . . . . . . . . . . . . . . . . . . . . . . . . . . . . . . . . . . . . . . . . . 8 3
Programming Cost Estimate Preparation . . . . . . . . . . . . . . . . . . . . . . . . . . . . . . . . . . . . . . . . . . 9 4
Basic Cost Model Example . . . . . . . . . . . . . . . . . . . . . . . . . . . . . . . . . . . . . . . . . . . . . . . . . . . . . 10 4
Determining and Using Special Cost Factors . . . . . . . . . . . . . . . . . . . . . . . . . . . . . . . . . . . . . . . 11 5
Estimating Alteration Projects . . . . . . . . . . . . . . . . . . . . . . . . . . . . . . . . . . . . . . . . . . . . . . . . . . . 12 6
APPENDIX A. FACILITY UNIT COST TABLE . . . . . . . . . . . . . . . . . . . . . . . . . . . . . . . . . . . . . . . . . . . . . A-1
APPENDIX B. LOCATION ADJUSTMENT FACTORS TABLE . . . . . . . . . . . . . . . . . . . . . . . . . . . . . . . . B-1
APPENDIX C. TRI-SERVICE MILITARY CONSTRUCTION PROGRAM (MCP) INDEX
FOR FY 94 THRU 99 PROGRAMS . . . . . . . . . . . . . . . . . . . . . . . . . . . . . . . . . . . . . . . C-I
APPENDIX D. TECHNOLOGICAL UPDATING FACTORS TABLE . . . . . . . . . . . . . . . . . . . . . . . . . . . . D-1
APPENDIX E. SAMPLE SITE SENSITIVITY COST CONSIDERATIONS . . . . . . . . . . . . . . . . . . . . . . . E-1
APPENDIX F. BUILDING SYSTEMS WORK BREAKDOWN STRUCTURE (WBS) . . . . . . . . . . . . . . F-I
APPENDIX G. FAMILY HOUSING . . . . . . . . . . . . . . . . . . . . . . . . . . . . . . . . . . . . . . . . . . . . . . . . . . . . . . G-1
List of FiguresFigure 1 Example of DA Form 7307-R, Cost Estimating Worksheet - Facility Alteration . . . . . . . . . . . . . 8
G-I Example Tri-Service Cost Model . . . . . . . . . . . . . . . . . . . . . . . . . . . . . . . . . . . . . . . . . . . . . . . . . . G-3
List of TablesTable
1. Size Adjustment Factors . . . . . . . . . . . . . . . . . . . . . . . . . . . . . . . . . . . . . . . . . . . . . . . . . . . . . . . . 2
2. Technical Complexity Levels and Factors . . . . . . . . . . . . . . . . . . . . . . . . . . . . . . . . . . . . . . . . . . 3
3. Cost of Removal versus Cost of Installation . . . . . . . . . . . . . . . . . . . . . . . . . . . . . . . . . . . . . . . . . 7

TM 5-800-4
1
PROGRAMMING COST ESTIMATESFOR MILITARY CONSTRUCTION
1. Purpose. prepared, and they include the cost of installed buildingThis manual establishes criteria and standards fordevelopment and preparation of programming costestimates for constructing military facilities.
2. Scope.This manual addresses programming cost estimates fornew construction and alteration projects, includes costdata (based on historic data and experience) and factorsfor adjusting facility costs to reflect project conditions.
3. Reference.The following document forms a part of this manual to theextent referenced:
AR 415-15 Army Military ConstructionProgram Development andExecution
4. Overview.Programming cost estimates must be prepared asaccurately as possible to reflect the budgetary cost ofproviding facilities. In order to do this, basic data must beaccurate and it must be consistently applied. A basic costmodel which reflects all applicable factors derived fromaccurate data forms the basis for determining the facilitybudgetary cost at a specific location and under specificconditions.
5. Use of Adjustment Factors.Except for facilities subject to congressional statutorylimitation, programming for repetitive type facilities willbe adjusted by all applicable factors. Programming es-timates will make proper allowances for all factors thatmay be reasonably expected to influence project costthrough the expected construction period. However,deviations which are significantly above or below thefactored unit cost must be explained in detail. Forfacilities subject to statutory limitations, (i.e. familyhousing), appropriate cost factors will be used. If theadjusted estimated construction cost is over the statutorylimit, a waiver including complete substantiating datamust be requested in accordance withAR 415-15.
6. Facility Unit Costs.Appendix A contains a listing of expected facility unitcosts for locations having a geographical locationadjustment factor of 1.00. Unit prices reflect costsforecast on the basis of an assumed midpoint ofconstruction date.
a. Building Cost. The prices for buildings are basedon published criteria existing at the time appendix A was
equipment, air conditioning, and fire protection systemsauthorized by existing regulations. The amounts for build-ings exclude all supporting facilities outside the 5-footline such as water, gas, electrical, and telephone service;sanitary and storm sewers; special foundations (piles,piers, rock excavation); fencing; site improvements (clear-ing, grading, seeding, and planting of trees and shrubs);and demolition.
(1) Building Size. The square-foot building areasindicated in appendix A are based on the average sizesfrom construction award data of facilities for individualcategory codes. The average sizes will be used asreference sizes to calculate appropriate size adjustmentfactors for proposed facilities.
(2) Installed Building Equipment. Normally, the costof all items of equipment which are permanently built inor attached to the structure are included in the unit costshown in appendix A. This includes items with fixedutility connections. A list of installed building equipmentwhich forms part of the building cost is contained in AR415-15.
b. Size Adjustment. Table 1 provides adjustmentfactors to be used when the gross square footage differsfrom a similar type building listed in appendix A.
c. Location Adjustment. Appendix B is a listing offactors for use in adjusting estimated costs to specificgeographical areas. The location adjustment factors reflectthe average statistical differences in normal labor,material, and equipment costs for similar facilities built mdifferent geographical locations. The factors also makeallowances for weather, seismic, climatic, normal laboravailability, labor productivity, life support/mobilization,and contractor*s overhead and profit conditions. Thefactors do not reflect abnormal differences due to uniquesite consideration, such as historical preservation.
d. Cost Escalation Adjustment. Appendix C providesdata to be used to project cost escalation due toinflationary factors that apply to construction costs forprojects scheduled differently than the assumed midpointof construction used as the basis for preparing appendixA. The unit prices shown in appendix A reflect costsforecast on the basis of an assumed midpoint ofconstruction date; therefore, projects having a midpoint ofconstruction date other than the assumed date should haveappropriate cost escalation added. The midpoint ofconstruction for each facility should be determined basedon a realistic judgment of the construction time schedule.The adjustment factor for adding appropriate escalation isobtained as follows: Divide the cost index for the assumedmidpoint of construction date of the facility beingprogrammed by the cost index of the assumed midpoint ofconstruction date on which the prices in appendix A arebased.

TM 5-800-4
2
Table 1. Size Adjustment Factors
PART I
BUILDING (OTHER THAN FAMILY HOUSING)
SIZE ADJUST SIZE ADJUST SIZE ADJUST SIZE ADJUSTRATIO FACTOR RATIO FACTOR RATIO FACTOR RATIO FACTOR
0.0000 0.0000 0.9000 1.0150 1.8000 0.9567 2.7000 0.93600.0500 1.2750 0.9500 1.0100 1.8500 0.9550 2.7500 0.93500.1000 1.2550 1.0000 1.0000 1.9000 0.9533 2.8000 0.93400.1500 1.2250 1.0500 0.9550 1.9500 0.9516 2.8500 0.93300.2000 1.1900 1.1000 0.9900 2.0000 0.9500 2.9000 0.93200.2500 1.1700 1.1500 0.9850 2.0500 0.9490 2.9500 0.93100.3000 1.1500 1.2000 0.9800 2.1000 0.9480 3.0000 0.93000.3500 1.1300 1.2500 0.9780 2. 1500 0.9470 3.0500 0.92900.4000 1.1100 1.3000 0.9760 2.2000 0.9460 3.1000 0.92800.4500 1.1000 1.3500 0.9740 2.2500 0.9450 3.1500 0.92700.5000 1.0800 1.4000 0.9720 2.3000 0.9440 3.2000 0.92600.5500 1.0700 1.4500 0.9700 2.3500 0.9430 3.2500 0.92500.6000 1.0600 1.5000 0.9680 2.4000 0.9420 3.3000 0.92400.6500 1.0500 1.5500 0.9660 2.4500 0.9410 3.3500 0.92300.7000 1.0400 1.6000 0.9640 2.5000 0.9400 3.4000 0.92200.7500 1.0300 1.6500 0.9620 2.5500 0.9390 3.4500 0.92100.8000 1.0250 1.7000 0.9600 0.6000 0.9380 3.5000 0.92000.8500 1.0200 1.7500 0.9583 2.6500 0.9370
NOTE:Size ratio is determined by dividing the proposed building size by the building size shown in appendix A.
PART II
FAMILY HOUSING
SIZE FACTOR SIZE FACTOR(IN UNITS) (IN SQ. FT.)
1 -9 1.15 600 - 749 1.05
10 - 19 1.10 750 - 849 1.03
20 - 49 1.05 850 - 949 1.01
50 - 99 1.02 950 - 1050 1.00
100-199 1.00 1051 - 1150 0.99
200 - 299 0.98 1151 - 1250 0.98
300 - 499 0.96 1251 - 1350 0.97
500 + 0.95 1351 + 0.96

TM 5-800-4
3
e. Technological Updating Adjustment. Techno- 8. Project Costs.logical advances in equipment and operational techniquesused in some specialized facilities are being developedrapidly; this often causes obsolescence to occur beforedesign and construction are completed. Also, revisions incriteria to provide life cycle cost benefits may increaseinitial funding requirements before feedback data canreflect the added cost. An additional allowance fortechnological updating is appropriate for these conditions.Appendix D is a listing of technological updating factorsby category codes of facilities.
f. Design Contingency. The facility cost estimate mayinclude a design contingency allowance based on designdata reliability. The design contingency allowance (DC)is to cover component items that cannot be analyzed orevaluated at the time the facility cost estimate is prepared;however, such items are susceptible to cost evaluation asengineering and design progresses. The DC depends onthe reliability and refinement of the data on which theestimate is based; it therefore diminishes as designprogresses from the predesign stage through the designcompletion stage. Although it lessens at each successivedesign stage, the initial magnitude of the DC at thepredesign stage depends on the technical complexity ofthe project for which the facility cost estimate is beingprepared. The level of technical complexity must first beestablished as a prerequisite for determining the mag-nitude of the DC. Technical complexity levels and designcontingency factors are listed in table 2.
7. Supporting Facilities Costs.Appendix A, Parts II and III, lists expected support authorized for projects where most of the work will not befacilities unit costs. Supporting facilities are described as visibly exposed before construction begins and the unseenitems of construction directly related to the facility such as conditions cannot be adequately defined (Examples:utilities, roads and parking, and site improvements. renovation/alteration projects, Army family housing
Project cost is defined as the sum total of constructioncosts including facility costs, supporting facilities costs,any other allowable costs, cost allowances for contingen-cies, and other allowances for supervision and administra-tion.
a. Construction Contingencies. Each project cost es-timate should include a separate item as a reserve forconstruction contingencies to cover construction require-ments which cannot be foreseen before the contract isawarded. The contingency reserve is for some adverse orunexpected condition not susceptible to predeterminationfrom the data at hand during engineering and design; itmust be included in the project cost estimate. This reserveis usually for latent difficulties, such as unforeseeablerelocations; unforeseeable foundation conditions; en-countering utility lines in unforeseeable locations; or otherunforeseen problems beyond interpretation at the time ofcontract award. The contingency reserve is not an al-lowance for omissions of work items which are known tobe required, but for which quality or quantity has not yetbeen determined by specific design. Reasonable allowan-ces for all foreseeable requirements should be made in theestimate or shown as an allowance for cost adjustment.Application for construction contingency reserves will bein accordance with AR 415-15 and/or Army latestguidance. The construction contingency reserve for Armymilitary construction programs and Army family housingnew or replacement construction will normally be 5 per-cent of the total estimated contract cost. However, 10percent construction contingency will normally be
Table 2. Technical Complexity Levels and Design Contingency Factors
Technical Description Design Contingency FactorComplexity Level Pre-Concept Concept
LOW Site adapted, repetitive standard 1.050 1.025design project involving routinetechnology
MEDIUM Unique design involving complex 1.100 1.050technology
HIGH Unique design involving highly 1.150 1.100complex technology
ULTRAHIGH Unique design involving extremely 1.250 1.150complex or innovative technology

TM 5-800-4
4
revitalization improvement projects, underground utilityprojects, other projects that are unique in design,involving complex or innovative technology, andwaterfront projects). Projects for which more than thenormally authorized contingencies are considerednecessary will be fully justified and supported by riskanalysis.
b. Supervision and Administration. Each project es-timate should include a separate item for supervision andadministration (S&A). Application of S&A rate will bein accordance with AR 415-15 and/or latest Armyguidance. The current approved uniform rate of 6 percentS&A will be used for all projects constructed within thecontiguous United States (CONUS) and 6.5 percent foroverseas (OCONUS) projects (including those in Alaskaand Hawaii). The rates for operation and maintenance(O&M) funded projects are 8% CONUS and 8.5%OCONUS.
9. Programming Cost Estimate Preparation.Estimates may be prepared using the DD Form 1391processor system or latest approved software which usesthis manual and other authorized cost and pricing sources.The DD Form 1391 processor provides assistance (suchas currency exchange rates, building cost growth indices,location adjustment factors, and adjusted unit costs) forthe specific location, timeframes, and types ofconstruction involved. For family housing newconstruction, the DOD Family Housing Cost Model (Tri-Service Cost Model) will be used in programming ordeveloping costs as described in appendix G.
a. Procedures. A unit cost for a facility which shouldreflect the cost under the basic model conditions for thefacility can be obtained by using the following equation:
$Ab = $ExSaxLaxCEaxTUaxDCa
Where: $Ab is adjusted empirical cost,Basic Cost Model
$E is empirical cost unadjusted(from Appendix A)
Sa is size adjustment factor(from table 1)
La is location adjustment factor(from Appendix B)
CEa is cost escalation adjustmentdue to inflation factors(from appendix C)
TUa is technological updatingadjustment factor(from Appendix D)
DCa is design contingencyadjustment factor
b. A step-by-step example of procedures for dev-eloping the basic cost model is provided in paragraph 10.
10. Basic Cost Model Example.The example calculations below show how to determinethe facility cost estimate for an administration buildinggeneral purpose, category code 61050, of 11,250 squarefeet to be built at Ft. Dix, NJ in the FY93 program. Aconstruction start July 1993 and a constructioncompletion date of 1 July 1994 are assumed. The equationfor the basic cost model determination is:
$Ab = $E x Sa x La x CEa x TUa x DCa
Step 1 - Unadjusted Cost. In appendix A, find theunit cost for the applicable building type and building sizeclosest to the size building being programmed. The25,000 square foot Administration Building, categorycode 61050, is the comparable building size closest to the11,250 square foot programmed size, and unit cost for thebuilding is $87.00/SF.
Step 2 - Size Adjustment. Calculate a size relationshipfactor by dividing the programmed building size by theclosest comparable building size obtained from table 1.The 11,250 square foot programmed building size dividedby the 25,000 square foot comparable building size listedin appendix A gives a size ratio factor of 0.45. Using thesize adjustment table (table 1), find the size ratio factor of0.45 and obtain an adjustment factor of 1.100.
Step 3 - Location Adjustment. Determine the locationadjustment factor from appendix B. For Ft. Dix, NJ, thefactor of 1.19 applies.
Step 4 - Cost Growth Adjustment. Make allowancefor cost growth due to economic factors expected to occurbetween the assumed midpoint of construction date onwhich the prices in appendix A are based and the expectedmidpoint of construction data for the project beingprogrammed. Divide the cost growth index for theexpected midpoint of construction date for the projectbeing programmed (1880 for 1 January 1994 fromappendix C) by the cost growth index for the assumedmidpoint of construction date on which the prices inappendix A are based (1869 for October 1993 fromappendix C) to obtain a cost growth factor of 1880/1869.
Step 5 - Technological Updating Adjustment. Makeallowance for cost adjustment due to technological updat-ing by using the technological updating factor fromappendix D. This factor is found to be 1.00 foradministrative facilities.
Step 6 - Design Contingency Adjustment. Determinethe design contingency (DC) factor in accordance withparagraph 6. Since the proposed administration buildingis not unique and requires no special design, the DC factoris 1.050 (low complexity).

TM 5-800-4
5
Step 7 - Adjusted Cost. Calculate adjusted cost using built at locations listed in the national register of historicalthe equation for the basic cost model conditions. Results landmarks. The factor for historical adjustment is 1.05.are as follows: Deviation above the allowed factor must be explained in
$Ab = $E x Sa x La x CEa x TUa x DCa b. Risk Adjustment. Highly complex facilities involv-
$Ab = $87/SF x 1.10 x 1.19 x 1880/1869 x 1.00 x 1.05 quire cost adjustment due to risk. The level of risk factor
$Ab = $120.28/SF available commercial software programs. Risk adjustment
Step 8 - Facility Cost Estimate. Determine the facility c. Semipermanent Construction Adjustment. If theestimated cost by multiplying the size of the facility being facility being considered is semipermanent instead of per-programmed by the adjusted unit cost ($Ab) derived in manent type construction, an additional factor of 0.90step 7 and then round off the product to the nearest should be applied.thousand dollars. The size of 11,250 square feet d. Site Sensitivity Adjustment. A site sensitivity adjust-multiplied by $120.28/SF gives a facility cost estimate of ment may be necessary for those special cases where the$1,353,150 which when rounded off to the nearest unique nature of both the site and the project, in relationthousand dollars is $1,353,000. to one another will cause a significant impact on the cost.
Step 9 - Project Cost Estimate. Determine the project An analysis for site sensitivity adjustment should considerestimate cost by adding contingency and supervision and only those unique site conditions which will influence costadministration factors to facility cost and supporting by virtue of the uniqueness of the conditions involved.facilities cost. (Assume supporting facilities cost of The factor used in adjusting the total construction cost for$250,000) Since this project is new construction and loca- such a set of unique conditions is referred to as the “Sitetion is CONUS, a contingency factor of 1.05 and super- Sensitivity Adjustment Factor.” The method outlinedvision and administration factor of 1.06 should be applied below may be used to determine the cost impact caused byas follows: the influence of a project upon itself, resulting from an
Project Cost from extreme site limitations, or from both. Appendix BEstimate = ($1,353,00 + $250,000) x 1.05 x 1.06 is a listing of example sensitivity considerations and com-
= $1,784,139 above normal to substantially below normal. This sample
In accordance with the rounding rule given below the indicate only and is not a complete and comprehensiveproject cost is $1,800,000. list.
Congressional Rounding Rule technical specialty competition adjustment may be
Amount Nearest
Less Than or Equal to 1,000,000 10,000 1,000,001 to 5,000,000 50,000 5,000,001 to 10,000,000 100,000 10,000,001 to 15,000,000 200,000 15,000,001 to 20,000,000 500,000 20,000,001 or Greater 1,000,000
11. Determining and Using Other Cost Ad-justment Factors.In some cases other adjustment factors may apply. Theseare in addition to those set up in the basic cost modelconditions. The special adjustment factors apply only inspecial individual cases. They are not to be confused withthe basic model adjustment factor for size, location, andcost growth. These special cost factors will not be usedunless justified on the basis that they reflect significantcost which would not be included in the adjustmentfactors used to establish basic cost model conditions.
a. Historical Requirements Adjustment. An allow-ance for unique architectural features to comply withhistorical requirements is permitted for facilities to be
detail.
ing complex technology or innovative technology will re-
varies on different facilities and can be determined using
factors will not be used unless properly supported.
extremely large concentration of construction effort, or
putations with a range of values, where applicable, from
listing of site sensitivity considerations is meant to
e. Technical Specialty Competition Adjustment. A
necessary m those special cases where competition forservices of certain specialty craftsmen is created due tothe increase in the type of work requiring their services; orbecause of the decrease in the number of craftsmenavailable in the workforce. An analysis for technicalspecialty adjustment should consider the total marketingarea that may have an effect on competition for theservices of the specialty craft under consideration. Thefactor used in adjusting the total construction cost forsuch a competitive market is referred to as the “TechnicalSpecialty Competition Adjustment” factor. A method thatmay be used to determine the additional project costscaused by the competition for the services of specialtycraftsmen is displayed for the labor availability item ofappendix E. Factors considered for the labor portion of a“Site Sensitivity” analysis would be very similar to thoseconsidered for “Technical Specialty Competition.”Therefore, this same methodology can be used. Bydetermining the degree of labor availability (i.e., slightlybelow normal, substantially below normal, and extremelybelow normal) and making assumptions as to requiredinducements, the cost of such inducements in terms of aTechnical Specialty Competition Adjustment factor canbe computed.

TM 5-800-4
6
f. Procedure. The equation for the basic cost model is a. Figure 1 is an example of a completed DA Formthen adjusted for other adjustment factors are as follows: 7307-R. Appendix F tabulates the ratio of WBS cost to
facility cost from the USACE and DOD military con-$AB = $E x Sa x La x CEa x TUa x DCa x Oca
Where: OCa is equal to any one of special adjustmentfactor or sum of all special factors
The following are step-by-step example calculationsshowing how to determine the program estimate for a newadministration building category, code 61050, of 50,000square feet to be built at Walter Reed Army MedicalCenter, Washington, DC in the FY93 program based ona midpoint of construction date of January 1994.
g. Example. Follow the procedures given in paragraph10 steps 1 through 7 to determine the basic cost adjust-ment factors.
Step 8. Determine the need for special cost factors forfurther cost adjustment based on site and project con-ditions as described in paragraphs a, b, c, d and e above.Based on analysis of the site and project conditions othercost adjustment factors are identified as follows:
Historical Adjustment 0.05Site Sensitivity Adjustment 0.089
The adjustment factors for each cost consideration areadded together giving a total site sensitivity adjustmentfactor of 1.139. Appropriate site sensitivity considerationsand example calculations are included in appendix E.Selection can then be made of the proper range of costimpacts.
Step 9. Using the adjusted basic cost model conditionthe cost is calculated as follows:
$Ab = $87 x 0.95 x 1.03x1880/1869x1.00x1.05x 1.139
= $102.41
Step 10. Determine the facility estimated cost bymultiplying the size of the facility being programmed bythe adjusted unit cost and round off to the nearestthousand dollar (the unit cost of $102.41 obtained in step9 is multiplied by 50,000 square feet giving a total cost of$5,120,500).
Step 11. Determine project cost estimate in accord-ance with paragraph 10 step 9.
12. Estimating Alteration Projects.Alteration is defined as a change to interior or exteriorfacility arrangements to improve or change its currentpurpose. This includes installed equipment made a part ofthe existing facility, but does not include additions,expansions, and extensions. The procedures described inthis paragraph provide a step-by-step method for prepar-ing programming or budgetary estimates for building al-teration when current design data is not available. Theprocedures use a building systems work breakdown struc-ture (WBS) and relates the alteration work to new facilityrequirements as a percentage of new work.
struction historical cost data. Table 3 shows the percent-age of installation cost required for removal and thepercentage cost required for installation. Other sources forthis data is available from private industries.
b. Consider a FY93 alteration project for an existing40,000 SF barracks, category code 72111, at Fort Rileywith midpoint of construction of July 1994. Step-by-stepprocedures using DA Form 7307-R are as follows:
Step 1. Identify the percentage of the building systemsto be removed and enter in blocks 16a and 21a. The datafor this block should be based on the scope of work (inmany cases based on best judgment). A walk-through ofthe facility to be altered is the best way to obtain accuratedata. Assume for this example that the substructure,superstructure, exterior closure are not affected; that 80%of the interior is to be replaced; and that 75% of theelectrical, mechanical, and plumbing are to be replaced.
Step 2. Using data obtained from table 3 enter inblock 16b the percentage of installation cost required forremoval and in block 16c the percentage of cost requiredfor installation.
Step 3. Obtain the ratio of WES systems cost tofacility cost for barracks from appendix F and enter inblocks 16d and 21b.
Step 4. Block 16e is calculated by multiplying entriesin blocks 16a, 16b, 16c, and 16d. Block 17,removal/demolition factor (RDF), is calculated by addingall entries in block 16e which is 10.2 percent of the costto build the building new. To calculate the totalremoval/demolition cost (RDC) for the project use thefollowing:
RDC = $ExSaxLaxCEaxTUaxDCaxRDF
Where: $E = Empirical cost (Cost/SF ofnew facility from appendix A)
Sa = Size adjustment factorLa = Location adjustment factorEa = Cost escalation adjustment factor
TUa = Technological updating adjust-ment factor
DCa = Design contingency adjustment factorRDF = Removal/demolition factor
RDC = $83 x 1.00 x 0.98 x 1899/1869 x 1.00 x 1.05
x 0.102 = $8.85
Step 5. Determine replacement/new portion factor.The same method is used in the removal portion exceptthe cost includes 100% labor material and equipment.Block 21c is calculated by multiplying entries in blocks21a and 21b. Block 22, replacement new factor

TM 5-800-4
7
Table 3. Cost of Removal Versus Cost of Installation
WBS# DESCRIPTION % OF INSTALLATION COST % OF COST REQUIRED REQUIRED FOR REMOVAL FOR INSTALLATION
01 Substructure 50 35
02 Superstructure 50 35
03 Roofing 50 35
04 Exterior Closure 50 35
05 Interior Construction 50 35
06 Interior Finishes 50 35
07 Specialties 50 35
08 Plumbing 50 35
09 HVAC 50 35
10 Special Mechanical 50 35
11 Electrical 80 35
12 Special Electrical 80 35
13 Equipment 50 35
14 Conveying Systems 50 35
(RNF) is calculated by adding all entries in block 21c. Adjusted Removal/Demolition Cost (RDC)Total RNF is 54.3% (block 22) of the cost to build thefacility new. The total new work cost (NWC) is calculated = RDCx(1+SAF%)as follows:
NWC = $E x Sa x La x CGa x TUa x DCa x RNFAdjusted New Work Cost (NWC)
NCW = $83 x 1.00 x 0.98 x 1899/1869 x 1.00 x 1.05
x 0.54 = $46.86
Step 6. Special adjustment factor (SAF) due to con-struction limitations must be considered and added.Demolition/removal and replacement constructionlimitations allowed are as follows:
Dust protection for adjacent work areas 2-7%
Limited use of equipment (noise/power)
limitations 1-6%
Limited storage of construction materials 1-6%
Protection of completed work 2-6%
Shift work 2-10%
Any other adjustment factors must be defined andjustified. Special adjustment factor (SAF) due toconstruction limitations can either be applied to the totalunit cost or to the total cost of the project. Using thespecial adjustment factor from (block 25 of the completedDA Form 7 307-R) the demolition and replacement costsare then adjusted as follows:
= 8.85 x 1.15 = $10.18/SF
= NWCx(1+SAF%)
= $46.86 x 1.15 = $53.90/SF
Total Alteration Cost
= Adjusted Removal/Demolition Cost (RDCa)
+ Adjusted New Work Cost (NWCa)
= $10.18/SF + $53.90/SF
= $64.08/SF
Step 7. Determine the facility estimated alteration costby multiplying the area of the facility being programmedfor alteration by the total alteration cost as follows:
= $64.08/SF x 40,000/SF
= $2,563,200
Step 8. Determine the project cost estimate costs inaccordance with step 9 of paragraph 10.

TM 5-800-4

TM 5-800-4

TM 5-800-4
A-1
AP
PE
ND
IX A
FA
CIL
ITY
UN
IT C
OS
T T
AB
LE
NO
TE
S:
!T
he ta
ble
is a
rran
ged
num
eric
ally
by
cate
gory
cod
es f
rom
AR
415
-28.
Whe
re p
rice
s sp
an a
gro
up o
f su
bcat
egor
ies,
the
cate
gory
code
dig
it w
hich
is f
rom
0-9
is d
esig
nate
d by
an
X: F
or e
xam
ple,
124
XX
incl
udes
cat
egor
y 12
400
thro
ugh
1249
9.
!U
nit c
osts
in th
is ta
ble
are
fore
cast
on
the
basi
s of
an
assu
med
bid
ope
ning
dat
e of
Apr
il 19
93 (
MC
P IN
DE
X 1
843)
and
an
assu
med
mid
poin
t of
cons
truc
tion
date
of
1 O
ctob
er 1
993
(MC
PIN
DE
X =
186
9). T
o ca
lcul
ate
unit
cost
s fo
r an
ticip
ated
mid
poin
t of
cons
truc
tion
othe
r th
an 1
Oct
ober
199
3 an
d to
mak
e ot
her
adju
stm
ents
bas
ed o
n lo
cal c
ondi
tions
, the
pro
cedu
res
prov
ided
in T
M 5
-800
-4 m
ust b
e ap
plie
d.
!Pa
rt I
of
this
app
endi
x in
clud
es b
uild
ings
and
maj
or f
acili
ties;
Par
t II
of th
is a
ppen
dix
incl
udes
sup
port
fac
ilitie
s an
d ite
ms;
Par
t
III
of th
is a
ppen
dix
pert
ains
to p
ipin
g; a
nd P
art I
V p
erta
ins
to s
olar
sys
tem
s.
!U
nit c
osts
ref
lect
ed h
erei
n do
not
incl
ude
allo
wan
ces
for
cont
inge
ncie
s an
d S&
A.
!B
uild
ing
size
iden
tifie
d in
Par
t I o
f th
is A
ppen
dix
is b
ased
on
the
aver
age
size
fro
m a
war
ded
cons
truc
tion
cost
dat
a, b
ut n
ot a
stan
dard
siz
e. T
his
quan
tity
shou
ld b
e us
ed in
con
junc
tion
with
tabl
e 1
to d
eter
min
e th
e si
ze a
djus
tmen
t fac
tor.
!T
his
appe
ndix
is u
pdat
ed a
nnua
lly a
nd a
vaila
ble
thro
ugh
the
PAX
Sys
tem
(N
ewsl
ette
r 3.
2.2)
and
EIR
S B
ulle
tin.

TM 5-800-4
A-2

TM 5-800-4
A-3

TM 5-800-4
A-4

TM 5-800-4
A-5

TM 5-800-4
A-6

TM 5-800-4
A-7

TM 5-800-4
A-8

TM 5-800-4
A-9

TM 5-800-4
A-10

TM 5-800-4
A-11

TM 5-800-4
A-12

TM 5-800-4
A-13

TM 5-800-4
A-14

TM 5-800-4
A-15

TM 5-800-4
A-16

TM 5-800-4
A-17

TM 5-800-4
A-18

TM 5-800-4
A-19

TM 5-800-4
A-20

TM 5-800-4
A-21

TM 5-800-4
A-22

TM 5-800-4
A-23

TM 5-800-4
B-1
APPENDIX BLOCATION ADJUSTMENT FACTORS TABLE
PART ICONUS LOCATIONS
STATE LOCATION INDEXACF
ALABAMA STATE AVERAGE 0.77MOBILE 0.80MONTGOMERY 0.74
(A) ANNISTON ARMY DEPOT 0.77(A) FORT MCCLELLAN 0.76(A) FORT RUCKER 0.78(AF) MAXWELL AIR FORCE BASE 0.74(N) MOBILE AREA 0.76(A) REDSTONE ARSENAL 0.78
ALASKA STATE AVERAGE 1.85ANCHORAGE 1.73FAIRBANKS 1.97
(N) ADAK NAVAL STATION 2.75(AF) ELELSON AIR FORCE BASE 1.97(AF) ELMENDORF AIR FORCE BASE 1.73(A) FORT GREELY 2.17(A) FORT RICHARDSON 1.73(A) FORT WAINWRIGHT 1.97(AF) SHEMYA AIR FORCE BASE 2.75(AF) CLEAR AIR FORCE BASE 2.18
ARIZONA STATE AVERAGE 0.95FLAGSTAFF 1.00TUCSON 0.90
(AF) DAVIS MONTHAN AIR FORCE BASE 0.96(AF) LUKE AIR FORCE BASE 1.00(A) FORT HUACHUCA 1.12(A) NAVAJO ARMY DEPOT 1.00(N) YUMA MARINE CORPS AIR STATION 1.11(A) YUMA PROVING GROUND 1.11
ARKANSAS STATE AVERAGE 0.85FORT SMITH 0.92
(A) FORT CHAFFEE 0.92(AF) LITTLE ROCK AIR FORCE BASE 0.80
PINE BLUFF 0.78(N) PINE BLUFF ARSENAL 0.78

TM 5-800-4
B-2
LOCATION ADJUSTMENT FACTORS - CONTINUEDPART I
CONUS LOCATIONS
STATE LOCATION INDEXACF
CALIFORNIA STATE AVERAGE 1.24SAN DIEGO 1.16SAN FRANCISCO 1.37
(AF) BEALE AIR FORCE BASE 1.24(N) CAMP PENDLETON MARINE CORPS 1.18(N) CENTER VILLE BEACH (SF) 1.37(N) CHINA LAKE NAVAL WEAPONS CENTER 1.40(AF) EDWARDS AIR FORCE BASE 1.38(N) EL CENTRO NAVAL AIR FACILITY 1.21(N) EL TORO MARINE CORPS AIR STATION 1.23(A) FORT HUNTER LIGGETT 1.44(A) FORT IRWIN 1.30(A) FORT ORD 1.21(N) LOS ANGELES AREA 1.24(AF) MARCH AIR FORCE BASE 1.26(AF) MATHER AIR FORCE BASE 1.14(AF) MCCLELLAN AIR FORCE BASE 1.14(N) MONTEREY AREA 1.20(A) OAKLAND ARMY BASE 1.37(N) PORT HUENEME AREA 1.18(A) RIVERBANK ARMY AMMO PLANT 1.19(A) SACRAMENTO ARMY DEPOT 1.12(A) SHARPE ARMY DEPOT 1.16(A) SIERRA ARMY DEPOT 1.43(N) STOCKTON 1.14(AF) VANDENBERG AIR FORCE BASE 1.36(N) 29 PALMS MARINE CORPS BASE 1.38
COLORADO STATE AVERAGE 1.03COLORADO SPRINGS 1.05DENVER 1.00
(AF) AIR FORCE ACADEMY 1.06(AF) CHEYENNE MOUNTAIN 1.11(AF) FALCON AIR FORCE STATION 1.11(A) FITZSIMONS ARMY MEDICAL CTR 1.08(A) FORT CARSON 1.12(AF) PETERSON AIR FORCE BASE 1.06(A) PUEBLO ARMY DEPOT 0.92(A) ROCKY MOUNTAIN ARSENAL 1.06

TM 5-800-4
B-3
LOCATION ADJUSTMENT FACTORS - CONTINUEDPART I
CONUS LOCATIONS
STATE LOCATION INDEXACF
CONNECTICUT STATE AVERAGE 1.27BRIDGEPORT 1.31NEW LONDON 1.22
(N) NEW LONDON AREA 1.22(A) STRATFORD ENGINEERING PLANT 1.24
DELAWARE STATE AVERAGE 1.06DOVER 1.03WILMINGTON 1.08
(AF) DOVER AIR FORCE BASE 1.03
FLORIDA STATE AVERAGE 0.82MIAMI 0.89PANAMA CITY 0.75
(N) CAPE CANAVERAL 0.98(AF) EGLIN AIR FORCE BASE 0.73(AF) HOMESTEAD AIR FORCE BASE 0.89(N) JACKSONVILLE AREA 0.91(N) KEY WEST NAVAL AIR STATION 1.05(AF) MCDILL AIR FORCE BASE 0.80(N) ORLANDO AREA 0.80(N) PANAMA CITY AREA 0.78(N) PENSACOLA AREA 0.80(AF) TYNDALL AIR FORCE BASE 0.75
GEORGIA STATE AVERAGE 0.85ALBANY 0.82ATLANTA 0.96
(N) ALBANY AREA 0.82(A) FORT BENNING 0.76(A) FORT GILLEM 0.97(A) FORT GORDON 0.83(A) FORT MCPHERSON 0.96(A) FORT STEWART 0.81(N) KINGS BAY 0.92(AF) WARNER ROBBINS AIR FORCE BASE 0.95

TM 5-800-4
B-4
LOCATION ADJUSTMENT FACTORS - CONTINUEDPART I
CONUS LOCATIONS
STATE LOCATION INDEXACF
HAWAII STATE AVERAGE 1.69HONOLULU 1.66KANEOHE BAY 1.72
(N) BARBERS POINT NAVAL AIR STN 1.73(N) BARKING SANDS 1.80(N) FORD ISLAND 1.70(A) FORT DERUSSY 1.66(A) FORT SHAFTER 1.66(AF) HICKMAN AIR FORCE BASE 1.64(N) KANEOHE MARINE CORPS AIR STN 1.72(N) PEARL HARBOR 1.68(A) POHAKULOA 1.69(A) SCHOFIELD BARRACKS 1.73(A) TRIPLER ARMY MEDICAL CENTER 1.66(AF) WHEELER AIR FORCE BASE 1.73
IDAHO STATE AVERAGE 1.17BOISE 1.19MOUNTAIN HOME 1.15
(AF) MOUNTAIN HOME AIR FORCE BASE 1.15
ILLINOIS STATE AVERAGE 1.14BELLE VILLE 1.08CHICAGO 1.19
(N) FOREST PARK 1.19(N) GLENVIEW 1.19(N) GREAT LAKES NAVAL TRNG CTR 1.19(A) ROCK ISLAND ARSENAL 1.11(A) SAVANNAH ARMY DEPOT 1.08(AF) SCOTT AIR FORCE BASE 1.14
INDIANA STATE AVERAGE 0.99INDIANAPOLIS 0.97LOGANSPORT 1.00MADISON 0.96
(N) CRANE NAVAL WEAPONS SPT CTR 1.01(A) FORT BENJAMIN HARRISON 1.02(AF) GRISSOM AIR FORCE BASE 1.07(A) JEFFERSON PROVING GROUND 0.93

TM 5-800-4
B-5
LOCATION ADJUSTMENT FACTORS-CONTINUEDPART I
CONUS LOCATIONS
STATE LOCATION INDEXACF
IOWA STATE AVERAGE 0.99BURLINGTON 0.93DES MOINES 1.04
(A) IOWA ARMY AMMUNITION PLANT 0.95
KANSAS STATE AVERAGE 0.96MANHATTAN 0.92WICHITA 0.99
(A) FORT LEAVENWORTH 1.06(A) FORT RILEY 0.98(A) KANSAS ARMY AMMUNITION PLANT 0.98(AF) MCCONNELL AIR FORCE BASE 0.99
KENTUCKY STATE AVERAGE 0.91LEXINGTON 0.89LOUISVILLE 0.92
(A) FORT CAMPBELL 0.99(A) FORT KNOX 0.98(A) LEXINGTON/BLUE GRASS AD 0.96(N) LOUISVILLE NAVAL AIR STATION 0.92
LOUISIANA STATE AVERAGE 0.93NEW ORLEANS 1.02SHREVEPORT 0.84
(AF) BARKSDALE AIR FORCE BASE 0.84(A) FORT POLK 0.96(A) LOUISIANA ARMY AMMO PLANT 0.84(A) NEW ORLEANS ARMY BASE 1.02
MAINE STATE AVERAGE 0.84BANGOR 0.79PORTLAND 0.89
(N) BRUNSWICK 0.89(N) WINTER HARBOR 0.89

TM 5-800-4
B-6
LOCATION ADJUSTMENT FACTORS-CONTINUEDPART I
CONUS LOCATIONS
STATE LOCATION INDEXACF
MARYLAND STATE AVERAGE 0.98BALTIMORE 0.92ANNAPOLIS 0.96LEXINGTON PARK 1.03
(A) ABERDEEN PROVING GROUND 0.92(AF) ANDREWS AIR FORCE BASE 1.03(A) FORT DETRICK 0.83(N) BETHESDA 1.03(A) FORT GEORGE G MEADE 1.03(A) FORT RITCHIE 0.92(A) HARRY DIAMOND LABORATORIES 1.03(N) INDIAN HEAD 1.03(N) CHELTENHAM 1.03(N) CHESAPEAKE BEACH 0.85(N) THURMONT 0.98(N) PATUXENT RIVER AREA 1.03
MASSACHUSETTS STATE AVERAGE 1.28BOSTON 1.29FITCHBURG 1.26
(A) ARMY MATERIAL & MECH LAB 1.27(A) FORT DEVENS 1.34(AF) HANSCOM AIR FORCE BASE 1.29
MICHIGAN STATE AVERAGE 1.14DETROIT 1.21MARQUETTE 1.07
(A) DETROIT ARSENAL 1.22(AF) K I SAWYER AIR FORCE BASE 1.07
MINNESOTA STATE AVERAGE 1.32DULUTH 1.27MINNEAPOLIS 1.37
MISSISSIPPI STATE AVERAGE 0.82BILOXI 0.84COLUMBUS 0.82
(AF) COLUMBUS AIR FORCE BASE 0.79(N) GULFPORT 0.84(AF) KEESLER AIR FORCE BASE 0.84(N) MERIDIAN NAVAL AIR STATION 0.86

TM 5-800-4
B-7
LOCATION ADJUSTMENT FACTORS-CONTINUEDPART I
CONUS LOCATIONS
STATE LOCATION INDEXACF
MISSOURI STATE AVERAGE 1.02KANSAS CITY 1.04SEDALIA 0.99
(A) FORT LEONARD WOOD 1.10(A) LAKE CITY ARMY AMMO PLANT 1.03(A) ST LOUIS ARMY AMMO PLANT 1.14(AF) WHITEMAN AIR FORCE BASE 1.05
MONTANA STATE AVERAGE 1.19BILLINGS 1.21GREAT FALLS 1.16
(AF) MALMSTROM AIR FORCE BASE 1.16
NEBRASKA STATE AVERAGE 0.88GRAND ISLAND 0.78OMAHA 0.98
(A) CORNHUSKER ARMY AMMO PLANT 0.78(AF) OFFUTT AIR FORCE BASE 0.98
NEVADA STATE AVERAGE 1.19HAWTHORNE 1.26LAS VEGAS 1.11
(N) FALLON 1.28(A) HAWTHORNE ARMY AMMO PLANT 1.26(AF) NELLIS AIR FORCE BASE 1.11
NEW HAMPSHIRE STATE AVERAGE 1.06CONCORD 1.05PORTSMOUTH 1.06
AF) NEW BOSTON AEB 1.06
NEW JERSEY STATE AVERAGE 1.20NEWARK 1.21TRENTON 1.18
(A) BAYONNE MOT 1.21(N) EARLE 1.19(A) FORT DIX 1.19(A) FORT MONMOUTH 1.19(AF) MCGUIRE AIR FORCE BASE 1.19(A) PICATINNY ARSENAL 1.29

TM 5-800-4
B-8
LOCATION ADJUSTMENT FACTORS-CONTINUEDPART I
CONUS LOCATIONS
STATE LOCATION INDEXACF
NEW MEXICO STATE AVERAGE 0.99ALAMOGORDO 0.96ALBUQUERQUE 1.02
(AF) CANNON AIR FORCE BASE 0.95(AF) HOLLOMAN AIR FORCE BASE 1.06(AF) KIRTLAND AIR FORCE BASE 1.02(A) WHITE SANDS MISSILE RANGE 1.06
NEW YORK STATE AVERAGE 1.23ALBANY 1.10NEW YORK CITY 1.36
(A) FORT DRUM 1.19(AF) GRIFFIS AFB 1.10(N) NIAGARA 1.15(A) SENECA ARMY DEPOT 1.19(N) STATEN ISLAND 1.36(A) U.S. MILITARY ACADEMY 1.23(A) WATERVLIET ARSENAL 1.10
NORTH CAROLINA STATE AVERAGE 0.75FAYETTEVILLE 0.79GREENSBORO 0.71
(N) CAMP LEJEUNE AREA 0.86(N) CHERRY POINT 0.86(A) FORT BRAGG 0.80(N) NEW RIVER 0.86(AF) POPE AIR FORCE BASE 0.80(AF) SEYMOUR JOHNSON AEB 0.74(A) SUNNY POINT 0.82
NORTH DAKOTA STATE AVERAGE 1.04GRAND FORKS 0.98MINOT 1.10
OHIO STATE AVERAGE 0.91DAYTON 0.89YOUNGSTOWN 0.92
(A) RAVENNA ARMY AMMO PLANT 0.92(AF) WRIGHT-PATTERSON AFB 0.89

TM 5-800-4
B-9
LOCATION ADJUSTMENT FACTORS-CONTINUEDPART I
CONUS LOCATIONS
STATE LOCATION INDEXACF
OKLAHOMA STATE AVERAGE 0.90LAWTON 0.88OKLAHOMA CITY 0.92
(AF) ALTUS AIR FORCE BASE 0.92(A) FORT SILL 0.88(A) MCALESTER ARMY AMMO PLANT 0.85(AF) TINKER AIR FORCE BASE 0.92(AF) VANCE AFB 0.92
OREGON STATE AVERAGE 1.14PENDLETON 1.18PORTLAND 1.09
(A) UMATILLA ARMY DEPOT 1.25
PENNSYLVANIA STATE AVERAGE 1.10PHILADELPHIA 1.18PITTSBURGH 1.02
(A) CARLISLE BARRACKS 0.98(A) INDIANTOWN GAP MISSILE RANGE 1.05(A) LETTERKENNY ARMY DEPOT 1.02(N) MECHANICSBURG AREA 0.98(A) NEW CUMBERLAND ARMY DEPOT 0.98(N) PHILADELPHIA AREA 1.18(A) TOBYHANNA ARMY DEPOT 1.20(N) WARMINSTER AREA 1.11
RHODE ISLAND STATE AVERAGE 1.19NEWPORT 1.20PROVIDENCE 1.18
SOUTH CAROLINA STATE AVERAGE 0.79CHARLESTON 0.85COLUMBIA 0.73MYRTLE BEACH 0.93
(N) BEAUFORT AREA 0.92AF) CHARLESTON AIR FORCE BASE 0.85(N) CHARLESTON AREA 0.91(A) FORT JACKSON 0.73(AF) SHAW AIR FORCE BASE 0.72

TM 5-800-4
B-10
LOCATION ADJUSTMENT FACTORS-CONTINUEDPART I
CONUS LOCATIONS
STATE LOCATION INDEXACF
SOUTH DAKOTA STATE AVERAGE 1.04RAPID CITY 1.09SIOUX FALLS 0.98
(AF) ELLSWORTH AIR FORCE BASE 1.10
TENNESSEE STATE AVERAGE 0.88CHATTANOOGA 0.84MEMPHIS 0.91
(AF) ARNOLD AFB 0.90(A) VOLUNTEER ORDNANCE WORKS 0.90
TEXAS STATE AVERAGE 0.84SAN ANGELO 0.80SAN ANTONIO 0.87
(AF) BROOKS AIR FORCE BASE 0.87(A) CAMP BULLIS 0.87(N) CORPUS CHRISTI AREA 0.90(N) DALLAS 0.93(AF) DYESS AIR FORCE BASE 0.92(A) FORT BLISS 0.96(A) FORT HOOD 0.90(A) FORT SAM HOUSTON 0.87(AF) GOODFELLOW AIR FORCE BASE 0.80(AF) KELLY AIR FORCE BASE 0.87(N) KINGS VILLE 0.95(AF) LACKLAND AIR FORCE BASE 0.87(AF) LAUGHLIN AIR FORCE BASE 1.15(A) LONE STAR ARMY AMMO PLANT 0.94(A) LONGHORN ARMY AMMO PLANT 0.81(AF) RANDOLPH AIR FORCE BASE 0.87(A) RED RIVER ARMY DEPOT 0.94(AF) REESE AFB 0.95(AF) SHEPPARD AIR FORCE BASE 0.90
UTAH STATE AVERAGE 0.91OGDEN 0.92SALT LAKE CITY 0.91
(A) DUGWAY PROVING GROUND 0.97(A) FORT DOUGLAS 0.91(AF) HILL AIR FORCE BASE 0.99(A) TOOELE ARMY DEPOT 1.00

TM 5-800-4
B-11
LOCATION ADJUSTMENT FACTORS - CONTINUEDPART I
CONUS LOCATIONS
STATE LOCATION INDEXACF
VERMONT STATE AVERAGE 0.89BURLINGON 0.91MONTPELIER 0.87
VIRGINIA STATE AVERAGE 0.83NORFOLK 0.86RICHMOND 0.80
(N) DAHLGREN 0.80(A) FORT BELVOIR 1.03(A) FORT EUSTIS 0.86(A) FORT A. P. HILL 0.80(A) FORT LEE 0.83(A) FORT MONROE 0.86(A) FORT MYER 1.03(A) FORT PICKETT 0.92(A) FORT STORY 0.86(N) LANGLEY 0.83(N) QUANTICO 0.83(A) RADFORD ARMY AMMO PLANT 0.95(A) VINT HILL FARMS 0.83
WASHINGTON STATE AVERAGE 1.11SPOKANE 1.13TACOMA 1.08
(N) BREMERTON 1.17(N) EVERETT 1.15(AF) FAIRCHILD AIR FORCE BASE 1.11(A) FORT LEWIS 1.08(N) INDIAN ISLAND 1.20(AF) MCCHORD AIR FORCE BASE 1.08(N) SILVERDALE 1.11(N) WHIDBEY ISLAND 1.10(A) YAKIMA FIRING RANGE 1.15
WEST VIRGINIA STATE AVERAGE 1.03BLUEFIELD 1.00CHARLESTON 1.06
WISCONSIN STATE AVERAGE 1.08MADISON 1.00MILWAUKEE 1.16
(A) BADGER ARMY AMMO PLANT 1.03(A) FORT MCCOY 1.33

TM 5-800-4
B-12
LOCATION ADJUSTMENT FACTORS-CONTINUEDPART I
CONUS LOCATIONS
STATE LOCATION INDEXACF
WYOMING STATE AVERAGE 1.01CASPER 0.99CHEYENNE 1.02
(AF) F.E. WARREN AIR FORCE BASE 1.02
WASHINGTON D. C. WASHINGTON D.C. AREA 1.03(AF) BOLLING AIR FORCE BASE 1.03(A) FORT MCNAIR 1.03(A) WALTER REED ARMY MEDICAL CTR 1.03

TM 5-800-4
B-13
LOCATION ADJUSTMENT FACTORS-CONTINUEDPART II
OCONUS LOCATION
ACF CURRENCYCOUNTRY LOCATION INDEX EXCHANGE REMARKS
ANTIGUA COUNTRY AVERAGE 1.73 2.78
AUSTRALIA COUNTRY AVERAGE 1.55 1.30 AUSTRALIANSYDNEY 1.34 DOLLAR/U.S. DOLLARDARWIN 1.90PERTH 1.42
AZORES COUNTRY AVERAGE 1.04 168.00 PORTUGUESELAJES 1.04 ESCUDO/U.S. DOLLAR
BAHAMAS COUNTRY AVERAGE 1.79 0.995ANDROS ISLAND 1.79
BAHRAIN COUNTRY AVERAGE 2.07 0.377
BELGIUM COUNTRY AVERAGE 1.60 33.16 BELGIUM FRANC/U.S.BRUSSELS 1.60 DOLLAR
BERMUDA COUNTRY AVERAGE 1.61 0.997
CANADA COUNTRY AVERAGE 1.59 1.13 CANADIAN DOLLARARGENTIA,NEWFOUNDLAND 1.59
CUBA COUNTRY AVERAGE 1.60 1.00 U.S. DOLLARSGUANTANAMO 1.60
DIEGO GARCIA COUNTRY AVERAGE 3.00 1.00 U.S. DOLLARS
EYGPT COUNTRY AVERAGE 1.32 2.65 EGYPTIANCARlO 1.32 POUND/U.S. DOLLAR
GERMANY COUNTRY AVERAGE 1.74 1.61 DEUTSCHE MARKFRANKFURT 1.94 /U.S. DOLLARKAISERSLAUTERN 1.77TRIER 1.51
GREECE COUNTRY AVERAGE 0.96 183.65 DRACHMAATHENS 0.96 /U.S. DOLLAR
GREENLAND COUNTRY AVERAGE 2.48 7.81 DANISH KRONERGODTI-IAAB /U.S. DOLLAR(NUUK) 2.48

TM 5-800-4
B-14
LOCATION ADJUSTMENT FACTORS-CONTINUEDPART II
OCONUS LOCATION
ACF CURRENCYCOUNTRY LOCATION INDEX EXCHANGE REMARKS
GUAM COUNTRY AVERAGE 2.24 1.00 U.S. DOLLAR
HONDURAS COUNTRY AVERAGE 0.64 4.50 LEMPIRA/U.S. DOLLARTEGUCIGALPA 0.64
ICELAND COUNTRY AVERAGE 3.38 62.50 KRONA/U.S. DOLLARREYKJAVIK 3.38
ISRAEL COUNTRY AVERAGE 1.18 2.034TEL AVIV 1.18
ITALY COUNTRY AVERAGE 1.74 1,201.20 LIRA/U.S. DOLLARISOLA DI CAPORIZZUTO 1.73LA MADDALENA 1.82NAPLES 1.74SIGONELLA 1.74VENICE 1.68
JAPAN COUNTRY AVERAGE 1.83 130.11 YEN/U.S. DOLLARTOKYO 1.90MISAWA 1.80OKINAWA 1.71ATSUGI 1.90
JOHNSTON ATOLL COUNTRY AVERAGE 2.32 1.00 U.S. DOLLAR
KOREA COUNTRY AVERAGE 1.12 753.98 WON/U.S. DOLLARSEOUL 1.08DMZ Area 1.18CHINHAE 1.11KUNSAN 1.12OSAN 1.10
KWAJALEIN COUNTRY AVERAGE 2.54 1.00 U.S. DOLLAR
MIDWAY ISLAND COUNTRY AVERAGE 2.07 1.00 U.S. DOLLAR
MOROCCO COUNTRY AVERAGE 1.55 8.67 DIRHAM/U.S. DOLLARCASABLANCA 1.55

TM 5-800-4
B-15
LOCATION ADJUSTMENT FACTORS-CONTINUEDPART II
OCONUS LOCATION
ACE CURRENCYCOUNTRY LOCATION INDEX EXCHANGE REMARKS
NETHERLANDS COUNTRY AVERAGE 1.55 1.82 GUILDEROSS 1.55 /U.S. DOLLAR
NEW ZEALAND COUNTRY AVERAGE 2.07 1.82 NEW ZEALANDWELLINGTON 2.07 DOLLAR
/U.S. DOLLAR
OMAN COUNTRY AVERAGE 1.58 0.385 RILOMANIRUWI 1.58 /U.S. DOLLAR
PANAMA COUNTRY AVERAGE 1.24 1.00 U.S. DOLLARPANAMA CITY 1.24
PHILIPPINES COUNTRY AVERAGE 1.10 22.25 PHILIPPINE PESOSMANILA 1.08 /U.S. DOLLARSUBIC BAY 1.11
PUERTO RICO COUNTRY AVERAGE 1.05 1.00 U.S. DOLLARSSAN JUAN 1.05
SEYCHELLESISLANDS COUNTRY AVERAGE 2.50 1.00 U.S. DOLLARS
SPAIN COUNTRY AVERAGE 1.42 101.60 PESETA/U.S. DOLLAR
ROTA 1.42
TURKEY COUNTRY AVERAGE 0.96 5,010.02 LIRA/U.S. DOLLARANKARA 0.96INCIRLICK 0.96
UNITED KINGDOMCOUNTRY AVERAGE 1.59 1.56 BRITISH POUND
/U.S. DOLLARLONDON 1.62MANCHESTER 1.62ST. MAWGAN 1.59EDZELL,SCOTLAND 1.62
NOTES:1. This appendix is updated annually and available through the PAX System Newsletters and EIRS Bulletins.2. Area cost factors and currency exchange rates based on DOD memorandum dated August 20, 1993.3. The factor of 1.00 is based on the national average index of 96 cities in CONUS.

TM 5-800-4
C-1
APPENDIX CTRI-SERVICE MILITARY CONSTRUCTION PROGRAM (MCP) INDEX
FOR FY 94 THRU 99 PROGRAMS
DATE INDEX FISCAL YEARESCALATION PERCENTAGE FOR
1 OCT 1990 . . . . . . . . . . . . . . . . . . 17271 JAN 1991 . . . . . . . . . . . . . . . . . 1740 FY 911 APR 1991 . . . . . . . . . . . . . . . . . 17481 JUL 1991 . . . . . . . . . . . . . . . . . 1764 3.1%1 OCT 1991 . . . . . . . . . . . . . . . . . . 17811 JAN 1992 . . . . . . . . . . . . . . . . . 1792 FY 921 APR 1992 . . . . . . . . . . . . . . . . . 17981 JUL 1992 . . . . . . . . . . . . . . . . . 1812 2.5%1 OCT 1992 . . . . . . . . . . . . . . . . . . 18251 JAN 1993 . . . . . . . . . . . . . . . . . 1836 FY 931 APR 1993 . . . . . . . . . . . . . . . . . 18431 JUL 1993 . . . . . . . . . . . . . . . . . 1856 2.4%1 OCT 1993 . . . . . . . . . . . . . . . . . . 18691 JAN 1994 . . . . . . . . . . . . . . . . . 1880 FY 941 APR 1994 . . . . . . . . . . . . . . . . . 18861 JUL 1994 . . . . . . . . . . . . . . . . . 1899 2.3%1 OCT 1994 . . . . . . . . . . . . . . . . . . 19121 JAN 1995 . . . . . . . . . . . . . . . . . 1923 FY 951 APR 1995 . . . . . . . . . . . . . . . . . 19291 JUL 1995 . . . . . . . . . . . . . . . . . 1943 2.3%1 OCT 1995 . . . . . . . . . . . . . . . . . . 19561 JAN 1996 . . . . . . . . . . . . . . . . . 1967 FY 961 APR 1996 . . . . . . . . . . . . . . . . . 19731 JUL 1996 . . . . . . . . . . . . . . . . . 1966 2.2%1 OCT 1996 . . . . . . . . . . . . . . . . . . 19991 JAN 1997 . . . . . . . . . . . . . . . . . 2010 FY 971 APR 1997 . . . . . . . . . . . . . . . . . 20161 JUL 1997 . . . . . . . . . . . . . . . . . 2030 2.2%1 OCT 1997 . . . . . . . . . . . . . . . . . . 20431 JAN 1998 . . . . . . . . . . . . . . . . . 2054 FY 961 APR 1968 . . . . . . . . . . . . . . . . . 20611 JUL 1988 . . . . . . . . . . . . . . . . . 2074 2.2%1 OCT 1988 . . . . . . . . . . . . . . . . . . 20881 JAN 1999 . . . . . . . . . . . . . . . . . 2099 FY 991 APR 1999 . . . . . . . . . . . . . . . . . 21061 JUL 1999 . . . . . . . . . . . . . . . . . 2120 2.2%1 OCT 1999 . . . . . . . . . . . . . . . . . . 2134
NOTES:1. Use 2.2% fiscal year for projection beyond 1999.2. Tri--Service MCP Index (1,000) = October, 1979 ENR Historical Building Cost Index (1,900).3. Used Price Escalation Indices (Annual Rates in Percentages) for Budget Authority in theMemorandum dated 3 March 1993, from the Comptroller of the Department of Defense,Subject Revised Inflation Guidance.4. This appendix is updated annually and available through the PAX System Newsletters and EIRS Bulletins.

TM 5-800-4
D-1
APPENDIX DTECHNOLOGICAL UPDATING FACTORS TABLE
CATEGORY ADJUSTMENT CODES CATEGORY SERIES DESCRIPTION (See AR 415-28) FACTOR
110 Airfield pavements 1.00
120 Liquid Fueling and Dispensing Facilities 1.00
130 Communications and Navigation Aids 1.00
140 Land Operational Facilities 1.00
150 Waterfront Operational Facilities 1.00
160 Harbor and Coastal Facilities 1.00
170 Training Facilities (other than Army Reserve) 1.00
171 Army Reserve 1.00
200 Maintenance and Production Facilities 1.00
300 R&D and Test Facilities 1.10
400 Supply facilities 1.00
500 Hospital and Medical Facilities 1.05
600 Administrative Facilities 1.00
700 Housing and Community Facilities 1.00
810 Electric Power 1.01
820 Heat and Refrigeration 1.02
830 Sewage and Waste 1.05
840 Water 1.00
850 Road and Street 1.00
860 Railroad Tracks 1.00
870 Ground Improvement Structures 1.00
880 Fire and Other Alarm Systems 1.05
890 Misc Central Plant (Heat, Refrigeration & Electrical) 1.03
930 Site Improvements 1.00

TM 5-800-4
E-1
AP
PE
ND
IX E
SA
MP
LE
SIT
E S
EN
SIT
IVIT
Y C
OS
T C
ON
SID
ER
AT
ION
S
NOTES:
!The method outlined in this Appendix may be used to determine the cost
impact resulting from extremely large concentration of construction
effort, or from extensive site limitations, or from both.
!Site sensitivity adjustment should be determined based on an analysis of
site conditions which will influence cost.

TM 5-800-4
E-2

TM 5-800-4
E-3

TM 5-800-4
E-4

TM 5-800-4
E-5

TM 5-800-4
E-6

TM 5-800-4
E-7

TM 5-800-4
E-8

TM 5-800-4
E-9

TM 5-800-4
E-10

TM 5-800-4
E-11

TM 5-800-4
E-12

TM 5-800-4
F-1

TM 5-800-4
F-2

TM 5-800-4
F-3

TM 5-800-4
F-4

TM 5-800-4
F-5

TM 5-800-4
F-6

TM 5-800-4
F-7

TM 5-800-4
F-8
TM 5-800-4
G-1
APPENDIX GFAMILY HOUSING
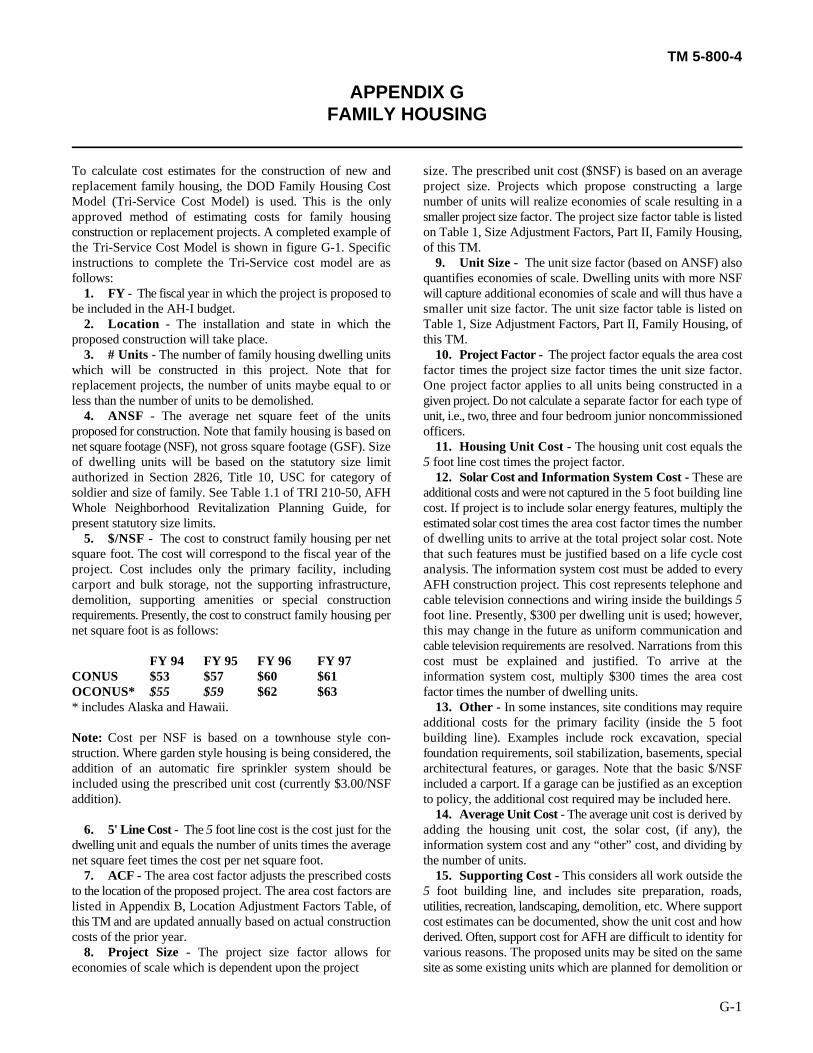
To calculate cost estimates for the construction of new and size. The prescribed unit cost ($NSF) is based on an averagereplacement family housing, the DOD Family Housing Cost project size. Projects which propose constructing a largeModel (Tri-Service Cost Model) is used. This is the only number of units will realize economies of scale resulting in aapproved method of estimating costs for family housing smaller project size factor. The project size factor table is listedconstruction or replacement projects. A completed example of on Table 1, Size Adjustment Factors, Part II, Family Housing,the Tri-Service Cost Model is shown in figure G-1. Specific of this TM.instructions to complete the Tri-Service cost model are as 9. Unit Size - The unit size factor (based on ANSF) alsofollows: quantifies economies of scale. Dwelling units with more NSF
1. FY - The fiscal year in which the project is proposed to will capture additional economies of scale and will thus have abe included in the AH-I budget. smaller unit size factor. The unit size factor table is listed on
2. Location - The installation and state in which the Table 1, Size Adjustment Factors, Part II, Family Housing, ofproposed construction will take place. this TM.
3. # Units - The number of family housing dwelling units 10. Project Factor - The project factor equals the area costwhich will be constructed in this project. Note that for factor times the project size factor times the unit size factor.replacement projects, the number of units maybe equal to or One project factor applies to all units being constructed in aless than the number of units to be demolished. given project. Do not calculate a separate factor for each type of
4. ANSF - The average net square feet of the units unit, i.e., two, three and four bedroom junior noncommissionedproposed for construction. Note that family housing is based on officers.net square footage (NSF), not gross square footage (GSF). Size 11. Housing Unit Cost - The housing unit cost equals theof dwelling units will be based on the statutory size limit 5 foot line cost times the project factor.authorized in Section 2826, Title 10, USC for category of 12. Solar Cost and Information System Cost - These aresoldier and size of family. See Table 1.1 of TRI 210-50, AFH additional costs and were not captured in the 5 foot building lineWhole Neighborhood Revitalization Planning Guide, for cost. If project is to include solar energy features, multiply thepresent statutory size limits. estimated solar cost times the area cost factor times the number
5. $/NSF - The cost to construct family housing per net of dwelling units to arrive at the total project solar cost. Notesquare foot. The cost will correspond to the fiscal year of the that such features must be justified based on a life cycle costproject. Cost includes only the primary facility, including analysis. The information system cost must be added to everycarport and bulk storage, not the supporting infrastructure, AFH construction project. This cost represents telephone anddemolition, supporting amenities or special construction cable television connections and wiring inside the buildings 5requirements. Presently, the cost to construct family housing per foot line. Presently, $300 per dwelling unit is used; however,net square foot is as follows: this may change in the future as uniform communication and
FY 94 FY 95 FY 96 FY 97 cost must be explained and justified. To arrive at theCONUS $53 $57 $60 $61 information system cost, multiply $300 times the area costOCONUS* $55 $59 $62 $63 factor times the number of dwelling units.* includes Alaska and Hawaii. 13. Other - In some instances, site conditions may require
Note: Cost per NSF is based on a townhouse style con- building line). Examples include rock excavation, specialstruction. Where garden style housing is being considered, the foundation requirements, soil stabilization, basements, specialaddition of an automatic fire sprinkler system should be architectural features, or garages. Note that the basic $/NSFincluded using the prescribed unit cost (currently $3.00/NSF included a carport. If a garage can be justified as an exceptionaddition). to policy, the additional cost required may be included here.
6. 5' Line Cost - The 5 foot line cost is the cost just for the adding the housing unit cost, the solar cost, (if any), thedwelling unit and equals the number of units times the average information system cost and any “other” cost, and dividing bynet square feet times the cost per net square foot. the number of units.
7. ACF - The area cost factor adjusts the prescribed costs 15. Supporting Cost - This considers all work outside theto the location of the proposed project. The area cost factors are 5 foot building line, and includes site preparation, roads,listed in Appendix B, Location Adjustment Factors Table, of utilities, recreation, landscaping, demolition, etc. Where supportthis TM and are updated annually based on actual construction cost estimates can be documented, show the unit cost and howcosts of the prior year. derived. Often, support cost for AFH are difficult to identity for
8. Project Size - The project size factor allows for various reasons. The proposed units may be sited on the sameeconomies of scale which is dependent upon the project site as some existing units which are planned for demolition or
cable television requirements are resolved. Narrations from this
additional costs for the primary facility (inside the 5 foot
14. Average Unit Cost - The average unit cost is derived by

TM 5-800-4
G-2
an undeveloped site. When difficult to document the support subtotal times the contingency times the supervision, inspectioncost, a percentage of the housing unit cost can be used until and overhead (SIOH). The contingency for new anddetailed analysis is completed. Demolition of existing units replacement construction is 5 percent. The SIOH for CONUSshould be a separate cost breakout. The environmental locations is 6 percent. For OCONUS locations, the SIOH is 6.5conditions and individual State regulations must be considered percent.when determining the demolition cost. When using a “generic” 18. Rounded Project Cost - The rounded project cost is thefor support cost and demolition, the area cost factor must be project total rounded in accordance with the Congressionalconsidered to arrive at the total support cost. rounding rule (located in Chapter 10 of this TM).
16. Subtotal - The summary subtotal consists of the - 19. Project Cost/SF - The project cost per square foothousing unit cost, solar cost, if any, information system cost, equals the project rounded cost divided by the product of theother cost, if any, and the support cost. number of units times the average net square footage times the
17. Project Total - The project total equals the summary cost factor.

TM 5-800-4
G-3

TM 5-800-4
G-4
Figure G-1. Example Tri-Service Cost Model. Sheet 2 of 2


The proponent agency of this publication is the Office of the Chief of Engineers, United StatesArmy. Users are invited to send comments and suggested improvements on DA Form 2028(Recommended Changes to Publications and Blank Forms) to HQUSACE, (CEMP-EC),WASH DC 20314-1000.
By Order of the Secretary of the Army:
GORDON R. SULLIVANGeneral, United States Army
Official: Chief of Staff
MILTON H. HAMILTONAdministrative Assistant to the
Secretary of the Army
Distribution:
To be distributed in accordance with DA Form 12-34-E, Block4519, requirements for TM 5-800—4.
* U.S. G.P.O.:1994-300-723:80140

PIN: 072529-000