programme designer community driven vulnerability evaluation
TRANSCRIPT

Community Driven Vulnerability Evaluation
P R O G R A M M ED E S I G N E R
A Handbook Incorporating Vulnerability to Climate Change into Project Design and Implementation


CoDriVE - Community Driven Vulnerability EvaluationAttaining balance through better-informed choices
This logo is inspired by the dualism that exists in nature and the need to keep all elements in balance to attain harmony.
The choice of colours – blue and green – is symbolic of elements of nature.
For further details contact:
Watershed Organisation Trust (WOTR)HEAD OFFICE – Pune , Maharashtra “The Forum” 2nd Floor, Padmavati Corner Pune-Satara Road, Pune – 411009 Tele: +91-20-24226211 E-mail: [email protected]/[email protected] in August 2013 by WOTR and licensed under Creative Commons
Recommended Citation: Watershed Organisation Trust (2013):
Community-Driven Vulnerability Evaluation Tool “CoDriVE-Programme Designer” A Handbook – Incorporating Vulnerability to Climate Change into Project Design and Implementation
ISBN No: 978-81-86748-32-9
Conceptualisation and design: New Concept Information Systems Pvt. Ltd. (www.newconceptinfo.com)
Your valuable comments and suggestions on the use of the tool will be beneficial. Write to: [email protected]

ii
Earth’s climate is changing in new ways as a result of growing greenhouse gas emissions concentrations in the atmosphere. Temperatures are rising, precipitation patterns are shifting, and extreme weather is becoming more common. These changes have serious implications for development and poverty reduction. Communities with climate-sensitive livelihoods – agriculture, herding, fishing, to name just a few – must contend with a host of new challenges, especially if they live in fragile ecosystems or face other ongoing stresses.
In this context, development planners and practitioners need tools like the Community Driven Vulnerability Evaluation - Programme Designer. Conducting an analysis with CoDriVE-Programme Designer can help planners and their partners understand how a community may be vulnerable to climate change and why. With this knowledge and information, interventions may be adjusted to safeguard against climate change impacts, and to avoid development patterns that may make communities more vulnerable at a later date.
Drylands communities face special challenges as the climate changes, so we are fortunate that WOTR brings to CoDriVE-Programme Designer two decades of experience supporting development in India’s drylands. This expertise will make CoDriVE-Programme Designer of particular interest for planners and practitioners working in these areas, and in drylands areas elsewhere in the world.
Congratulations to WOTR on the preparation of this very useful tool. Applying it in planning and practice, I look forward to a future where drylands communities develop and thrive, even in the face of a changing climate.
Heather McGray Co-Director, Vulnerability & Adaptation Initiative
World Resources Institute
Foreword

iii
CoDr
iVE-
PD –
A H
andb
ook
Why this Tool?Marcella D’SouzaExecutive Director
“CoDriVE – Programme Designer” is a tool meant for both development practitioners as well as planners. It stands for “Community Driven Vulnerability Evaluation – Programme Designer”.
Being development practitioners ourselves, we at WOTR needed a tool that enabled communities to articulate their experience of how they are being impacted by climatic and non-climatic forces, identify and assess their areas of vulnerability or “development deficits” and provoke them to plan for and undertake adaptive actions to build resilience and reduce vulnerability. As we are planners too, we needed to know which aspects of vulnerability and groups to prioritise, which development gaps to address and how to allocate resources. This tool – CoDriVE-Programme Designer – is the outcome of this effort.
CoDriVE-PD is community-engaging, easy-to-use, sensitive enough to capture the different types and degrees of vulnerabilities across communities and regions, and it is oriented towards adaptive action. It includes all the key resources that people and communities depend upon for their survival, takes into account the various drivers and pressures that impact them, and results in clear and specific qualitative and quantitative indications of areas of vulnerabilities that need to be acted upon.
CoDriVE-PD has been rigorously tested and validated in different social, economic and agro-ecological contexts in four different Indian states – Maharashtra, Andhra Pradesh, Rajasthan, and Madhya Pradesh. We are reasonably confident that it is flexible and broad enough to accommodate a great deal of the heterogeneity of the Indian sub-continent and also other developing country contexts allowing, of course, for situational specificities in the way it is used.
In order to support easy, quick, and large-scale application of this tool, WOTR has developed a web-based software program that enables processing and analysis of key data with a view to generating a vulnerability profile as well as situation-specific adaptive actions to be undertaken.
This is a work in progress and as we and others apply it across geographies and communities, we hope to co-evolve and refine the CoDriVE-Programme Designer so that it becomes more representative, more inclusive and better able to capture local particularities.
In this hope and expectation, we look forward and welcome feedback which we shall be most grateful for. It will help planners and practitioners prioritise and focus their efforts and resources on regions and communities most at risk in a changing climate.

iv
Message from SDC
With their economies closely linked to natural resource base and to climate-sensitive sectors such as agriculture, water and forestry, the developing countries face a major threat from projected changes in climate. Enormous uncertainties and risks relating to the likely impact of climate change across the world can jeopardise the timely achievement of the Millennium Development Goals. India is vulnerable to extreme weather events, with drought and floods affecting vast areas transcending state borders, every year. According to the recent World Bank report entitled ‘Turn Down the Heat – Climate Extremes, Regional Impacts and the case for Resilience (2013)’, with a 4°C global warming around 2090, the sea level is projected to rise by 100 cm and the monsoon rainfall in South Asia would become more variable with greater frequency of devastating floods and droughts. The glacier melting and snow cover loss could be severe with unusual heat extremes in summer months. The climate challenges have made traditional coping strategies ineffective and have put at serious risk the lives and livelihoods of several million people. This underlines the urgent need for promoting climate change adaptation and climate resilient development.
Further, it has become important to suitably integrate climate risk management into mainstream development activities as this alone will ensure that development is relatively insulated from impact of climate change and climate variability. This can also ensure that new project initiatives avoid activities that inadvertently increase vulnerability, thereby maladaptation. In the process of pursuing assessment of project initiatives at different stages, it is crucial to holistically analyse the context in which the project is being planned or implemented, in terms of livelihoods, resources and socio economic activities and determine if these will have direct or indirect links with climate change.
Janine KurigerCounsellor and Director of Cooperation - SDC
Embassy of Switzerland, New Delhi
Dated 17th July, 2013

v
CoDr
iVE-
PD –
A H
andb
ook
The handbook entitled ‘Community Driven Vulnerability Evaluation’ brought out by Watershed Organisation Trust (WOTR) is meant for development practitioners, to enable them to undertake a thorough assessment of vulnerability, including to climate change, in a development context. The tool comes with clear instructions and steps associated with collection, compilation, analysis and documentation of data/ information that will help to precisely identify the complexities of vulnerability, also through a Vulnerability Code. While the tool has been developed to primarily address the needs of watershed development, it is flexible enough to accommodate analysis of any livelihood-based project. The methodology itself was developed, tested, and validated with the active engagement of communities in the semi-arid areas of Maharashtra. This gives us immense hope about the utility of the tool in the design, planning and implementation of climate change adaptation initiatives.
The instrument was evolved over the last two years, in the framework of the Climate Change Adaptation Programme in semi arid areas, implemented by WOTR and jointly supported and funded by the Swiss Agency for Development and Cooperation (SDC) and NABARD (National Bank for Agriculture and Rural Development).
SDC, a directorate of the Swiss Federal Ministry of Foreign Affairs, is represented in India through the Climate Change and Development Division of the Embassy of Switzerland. The engagement of Swiss cooperation in India currently focusses on global public goods on climate change, with emphasis on maximising co-benefits of development, climate resilience and reduced emission.
We compliment the efforts of the WOTR team in bringing out this innovative tool. We are hopeful that the tool will find widest possible application by a diverse set of stakeholders in scientific and systematic assessment of vulnerability, which is the first and fundamental step towards designing and implementation of measures towards climate resilient development.

vi
AcknowledgementSynthesising complex climate change frameworks, making the vulnerability assessment tool more user-friendly, and developing the handbook has been a phenomenally exciting task for WOTR. As this tool has emerged from WOTR’s experiences, tried and tested within WOTR’s multi-state project locations, we wish to thank all team members for their patience, active participation, logic building, and supporting the core team to bring out the tool in this format.
Special thanks to SDC representatives Janine Kuriger, Yuka Greiler, and K.R. Vishwanathan for their inputs and constant support during the development of this tool and handbook.
We extend our special thanks to Heather McGray for reviewing the tool and providing us with very valuable inputs in making the product even better. We also thank Erin Gray, research associate from World Resources Institute (WRI) for using this tool in a collaboratory research study between WOTR and WRI.
We gratefully acknowledge the conceptual design inputs from Murali Apparaju that led to the development of the CoDriVE logo. We also thank New Concept Information Systems team for conceptualising and designing the handbook beautifully. We thank the SDC and NABARD for their constant support to WOTR in implementing the Climate Change Adaptation Study and Innovative tools towards climate resilient development.
WOTR team extends a heartfelt thanks to Dr.Marcella D’Souza, Executive Director of WOTR, for her constant motivation and hand-holding support in making this tool “practitioner” and “planner” oriented; ensuring it captures “grass-root realities”.
K. Bhavana Rao WOTR

vii
CoDr
iVE-
PD –
A H
andb
ook
Core Team: K. Bhavana Rao, Suchita Awasthi, Ganesh Rajapure, Marcella D’Souza, Sushil Bajpai
Technical Inputs, Field Testing and Regional Case Studies Development:
WOTR – Andhra Pradesh: M.Vijay Sunder
WOTR –Maharashtra: Thomas Palghadmal, Arjuna Srinidhi, Mihir Mathur, Bhupali Mhaskar, Shubhangi Mali, Vandana Patekar, Girish Jathar, Smita Mehetre, Dipak Zade
WOTR-Rajasthan: Hemant Pinjan, Gyanprakash Berwal
WOTR- Madhya Pradesh: Romit Banerjee
SIED, Aurangabad: Anjali Waghe
viii

ix
CoDr
iVE-
PD –
A H
andb
ook
ContentsForeword ii
Why this Tool? iii
Message from SDC iv
Acknowledgement vi
How this Book is Organised x
Acronyms xii
SECTION 1Evolution of CoDriVE-Programme Designer 1
SECTION 2Developing a Perspective:How Climate Change Affects the Vulnerable 7
SECTION 3Setting the Context:Need for Assessing Vulnerability to Climate Change for Project Design and Implementation 19
SECTION 4CoDriVE-PD – The Tool Planning by Evaluating and Incorporating Vulnerability to Climate Change 27
SECTION 5Ecosystems and Vulnerability:A Drylands Perspective 47
SECTION 6Illustrated Case Study 63
Annexure 91

This book tells the user (planner, researcher and development practitioner) about the tool CoDriVE-PD, the tool that helps craft projects that take into account vulnerability to climate change. This handbook is a guide on using CoDriVE-PD. Organised into different sections that deal with specificity of the tool, it helps the user understand the need for a tool in today’s dynamically changing world. It takes the user from how the tool evolved to actually taking the person through the details that help one to understand how this tool can be applied while designing projects.
How this Book is Organised

Section 5 Vulnerability and the Ecosystem Perspective takes the reader over the territory where the projects, in India, are most often focused: the drylands. The densely populated agricultural communities in these ecologically fragile regions are some of the most vulnerable. In this chapter the reader gets a quick overview of Indian drylands and the impacts of climate change on the ecology and agriculture of these regions. An understanding of this helps make better assessments of the vulnerabilities of the communities there.
Section 6 Illustrated Case Study – To help the reader understand how the tool can be used in real life situations.
Section 1 Evolution of CoDriVE-PD gives an introduction to CoDriVE-PD. It deals with the need for a tool of this nature. How this can be used and who, and under what situation, can use this tool. It gives a glimpse of what it does to help the development practitioner design a good project.
Section 2 Developing a Perspective: How Climate Change Affects the Vulnerable provides an explanation of climate change and its impact on livelihoods of vulnerable communities. It explains the different types of vulnerabilities and the factors affecting them. This perspective is crucial as a practitioner needs to understand the impact of climate change.
Section 3 Setting the Context explains the need for assessing vulnerability prior to commencement of a project. It deals with how climate and socio-economic probabilities, systems thinking, and resilience theory contribute to an analytical framework for community-driven evaluation of present and future vulnerability.
Section 4 CoDriVE-PD – The Tool describes the tool designed by WOTR. It talks about the thinking behind CoDriVE-PD. It describes the five step evaluation process of information collection, analysis, and arrival at the Vulnerability Code with detailed descriptions of what each step involves and expected outputs.

xii
CBO Citizens Body OrganisationCCFS Climate Change and Food Security FrameworkCCVI Climate Change Vulnerability Index CPR Common Property ResourcesCRISTAL Community-based Risk Screening – Adaptation and Livelihoods DFID Department for International DevelopmentDPR Detailed Project ReportDPSIR Drivers D, Pressures P, State S, Impacts I, and Responses R DRR Disaster Risk ReductionFAO Food and Agriculture Organisation FGD Focus Group DiscussionGHGs Greenhouse Gases GIZ Deutsche Gesellschaft für Internationale Zusammenarbeit HH Household IISD International Institute for Sustainable DevelopmentIMS Integrated Modelling System IPCC Intergovernmental Panel on Climate ChangeIUCN International Union for Conservation of NatureLEISA Low External Input and Sustainable AgricultureMA Millennium Ecosystem Assessment NGO Non-government OrganisationNREGA National Rural Employment Gaurantee ActPRA Participatory Rural Appraisal PRI Panchayati Raj Institution PURA Provision of Urban Amenities in
Rural AreasSELF Sampada Entrepreneurship and Livelihoods FoundationSES Social-Economic System SHG Self Help GroupSIED Sanjeevani Institute for Empowerment and Development SRL Sustainable Rural Livelihoods SLA Sustainable Livelihoods ApproachST The Sampada TrustUNFCCC United Nations Framework Convention on Climate ChangeVCA Vulnerability and Capacity Assessment VCI Vulnerability and Capacity Index VO Village OrganisationWOTR Watershed Organisation TrustWSHG Womens’ Self Help Group
Acronyms

1
CoDr
iVE-
PD –
A H
andb
ook
SECTION 1
Evolution of CoDriVE-Programme Designer

3
CoDr
iVE-
PD –
A H
andb
ook
SECTION 1Evolution of CoDriVE-Programme Designer
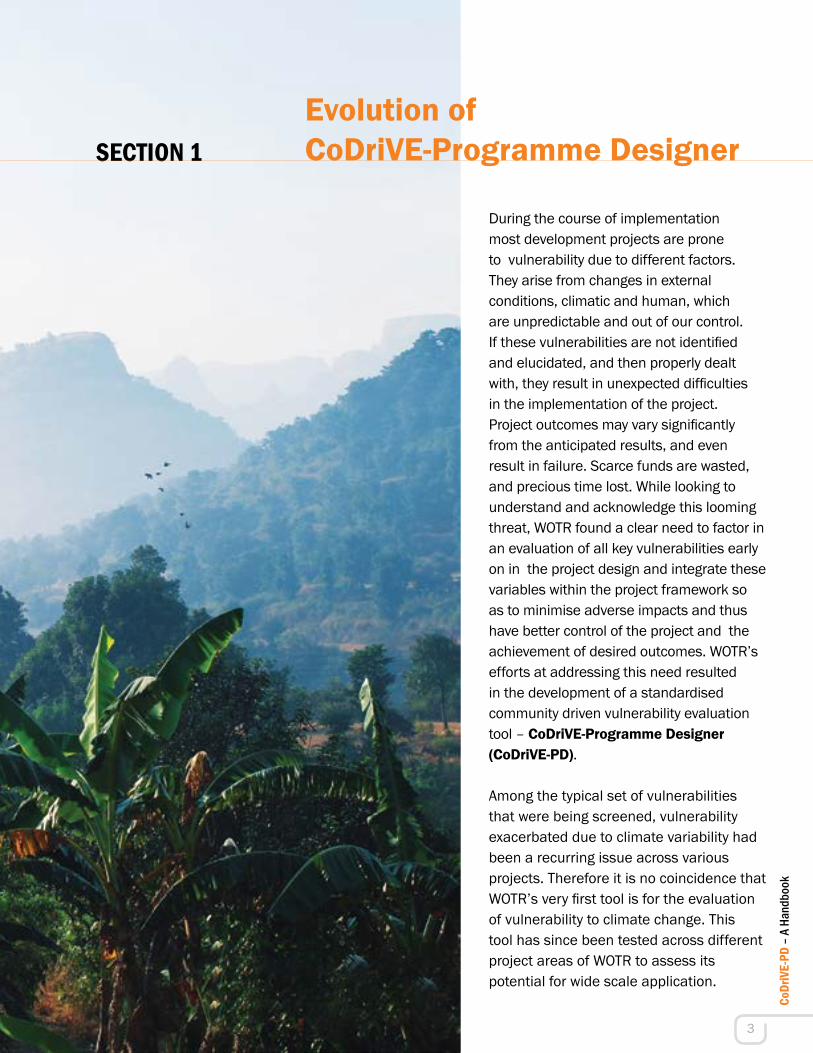
During the course of implementation most development projects are prone to vulnerability due to different factors. They arise from changes in external conditions, climatic and human, which are unpredictable and out of our control. If these vulnerabilities are not identified and elucidated, and then properly dealt with, they result in unexpected difficulties in the implementation of the project. Project outcomes may vary significantly from the anticipated results, and even result in failure. Scarce funds are wasted, and precious time lost. While looking to understand and acknowledge this looming threat, WOTR found a clear need to factor in an evaluation of all key vulnerabilities early on in the project design and integrate these variables within the project framework so as to minimise adverse impacts and thus have better control of the project and the achievement of desired outcomes. WOTR’s efforts at addressing this need resulted in the development of a standardised community driven vulnerability evaluation tool – CoDriVE-Programme Designer (CoDriVE-PD).
Among the typical set of vulnerabilities that were being screened, vulnerability exacerbated due to climate variability had been a recurring issue across various projects. Therefore it is no coincidence that WOTR’s very first tool is for the evaluation of vulnerability to climate change. This tool has since been tested across different project areas of WOTR to assess its potential for wide scale application.

4
This handbook is a culmination of these efforts to develop, standardise and qualify CoDriVE-PD for evaluating vulnerabilities brought on by climate change.
What is the purpose of this Handbook?The handbook provides a detailed road-map with clear instructions on applying the CoDriVE-PD framework for designing projects through a series of steps: a structured identification of elements of data that are required; collection of data at various levels through involvement of communities in a bottom-up approach; analysis of the collected information, documentation, and finally, identifying the vulnerabilities that need to be addressed. Wherever possible, the tool is explained through illustrated examples from projects being implemented by WOTR.
Who can use this tool?CoDriVE-PD can be used by anyone involved in the design and implementation of projects, such as NGOs, district-level authorities, facilitators working closely with government line departments, Panchayati Raj Institutions (PRIs), and finally the communities themselves. It can be useful to researchers too who need to gain first-hand information through communities.
While the tool is more specifically targeted at those involved with natural resource management projects and livelihood programmes, it is flexible enough to use in various contexts. It can be used at any point of a project: ideally at conceptual (project design and development) stages, but also during implementation phases (for sector-specific components and for contingency plans). In fact, CoDriVE-PD can be applied at any stage of any project where climatic and other uncertainties need to be considered.
Why should the tool be used?While most practitioners are wary of the impact of climate change on project outcomes, there have been few resources available that could help practitioners assess and quantify these concerns in a useful and constructive way so as to address them effectively – CoDriVE-PD attempts to fill this gap.
Helps articulate climate change concerns and identify measures to address them
Handbook designed for the development practitioner, researchers and planners. Practical and easy to use as designed by development practitioners

5
CoDr
iVE-
PD –
A H
andb
ook
Participative evaluation involving all stakeholders
Application potential at all stages of project
Practical and practicable
What makes this tool unique?
Conceptually,
CoDriVE-PD is a community driven tool necessitating assessment and grading of the livelihood capitals to be done by the community, at the same time making them aware of their vulnerability and potential resilience to climate change. It also documents their knowledge of local climate trends, coping responses, and history. This utilisation of community and stakeholder perceptions and knowledge helps the practitioner identify links and interdependencies of the human and environmental components of the system and from this evaluation emerge the measures to build adaptive capacity, resilience, and sustainability of the systems in question. This tool thus makes project design and execution more holistic and adaptive and importantly, creates a greater sense of ownership, so very critical for the success of any project, in the communities involved.
Operationally,
CoDriVE-PD helps anticipate and reduce the risks rising from climate change; it helps incorporate a sustainability angle, especially in ‘no or low regret’ interventions. It helps develop the ‘big picture’ and formulate near-to-accurate interventions for mid-course corrections; monitor and evaluate projects; draw lessons for future work; and essentially ensure that funds are used appropriately and efficiently.
Practically,
Project implementation and management, especially in the context of managing climate impacts and risks, needs a holistic ecosystem-based approach. As development of a watershed encompasses all parts of the relevant ecosystem, both natural and human, it results in holistic development. It also presents itself as a comprehensive ecological context for any evaluation of climate change vulnerabilities. CoDriVE-PD, which employs the watershed as the smallest unit of evaluation makes the whole vulnerability evaluation an exercise of practical value.

6
How does the tool work?Broadly, CoDriVE-PD does the following:
Reviews past history and the current scenario for all climate-sensitive livelihood sectors and non-farm livelihoods and aspects that are integral to them – gender, health, local governance, traditional knowledge, etc.;
Examines the drivers and pressures (externalities) that influence decisions, create change and vulnerabilities in communities;
Records the perceptions of climate risk by different stakeholders and actors, its impacts and their coping and adaptation responses;
Creates systems approach maps with all the interdependencies and interactions between the capitals and sectors and their issues and problems; and finally,
Generates a vulnerability code that grades all highly sensitive and essential resources on a scale of 1 to 5, based on the five capitals – Human, Social, Natural, Physical, and Financial.
CoDriVE-PD
Helps the practitioner
Record, analyse the climate constants and variables
Make visible the interplay of all constants and variables
&
Generate vulnerability indices

Developing a Perspective:How Climate Change Affects the Vulnerable
SECTION 2

8

9
CoDr
iVE-
PD –
A H
andb
ook
How Climate Change Affects the VulnerableClimate change and climate variability are the biggest threat we face today. They are the cause for environmental degradation and extreme weather events like floods, droughts, and cyclones. They hit the poorest and most vulnerable communities the hardest, those who are largely dependent on climate-sensitive occupations and on the natural resource base in the locality. They are too poor to cope or adapt to these changes and extreme events, and mostly live in developing countries with the least means to deal with climate change, disasters, and pressures of global economy. All this makes the poorest populations in these regions the most vulnerable: they have maximum risk and exposure, and minimum resilience and adaptability.
Developing a PerspectiveSECTION 2

10
Definition of Climate ChangeIPCC: A change in the state of the climate that can be identified (e.g., by using statistical tests) by changes in the mean and/or the variability of its properties and that persists for an extended period, typically decades or longer. Climate change may be due to natural internal processes or external forcings, or to persistent anthropogenic changes in the composition of the atmosphere or in land use.
UNFCCC: A change of climate which is attributed directly or indirectly to human activity that alters the composition of the global atmosphere and which is in addition to natural climate variability observed over comparable time periods.
Climate change
Natural and Resource baseGroundwaterSoilBiodiversity
Figure 1: Influences on livelihoods and resources
Socio-economic pressure
Climate sensitive sectorsForestAgricultureCoastal zones

11
CoDr
iVE-
PD –
A H
andb
ook
Impacts of Climate ChangeGlobally, climate change is causing rising temperatures and changed rainfall patterns. This will hit crop yields, particularly in developing countries. As small mountain glaciers disappear, water will get scarcer in regions fed by rivers dependent on them, such as the Indo-Gangetic Plain. Changing conditions impact current animal husbandry practices. Long dry spells, and frequent intense downpours will mean greater run-off and less soil absorption and more flooding. Rising sea levels and degrading coastal ecosystems threaten coastal populations and their livelihoods. Fish stocks are being depleted by rising temperatures, affecting fishing. Forest cover is affected and at greater risk of wildfires, reducing the resource base for communities dependent on forests. Biodiversity will decrease as species die out. A large number of current ecosystems will change irreversibly. Floods, droughts, cyclones, forest fires, and heat waves will increase in intensity and frequency. Vector-borne diseases like malaria will spread, and lack of water for sanitation increases risk for diseases like diarrhoea. These pressures will cause socio-economic impacts, with increased poverty, migration, social and political turmoil.

12
AGRICULTURE LIVESTOCK
FISHERIES
FORESTS
Reduced pasture lands
Less productive
Harder to maintain
More prone to disease
Agricultural crops adversely affected
Declining yields
Shift in cropping pattern
Desertification
Food and seed storage adversely affected
Shift in forest vegetation
Forest-based livelihoods affected
Increase in insect pest attacks and diseases.
Biodiversity adversely affected
Reduction in breeding grounds
Regional extinction and migration
Distribution of fish affected
Less productive, costlier
IMPACTS ofCLIMATE CHANGE on LIVELIHOODS

13
CoDr
iVE-
PD –
A H
andb
ook
WATER RESOURCES
GENDER HEALTH
Increase in gender inequality
Increase in burden for women in sourcing water
Increase in health risks
Women likely to get deprived of education
Increased health burden
increased morbidity and mortality
Increased epidemics
Increase in malnutrition
Greater run-off
Reduced recharge of ground water
Available fresh water decreases
Increase in water stress

14
Food and Agriculture Organization (FAO): “The presence of factors that place people at risk of becoming food insecure or malnourished, including those factors that affect their ability to cope.” This definition focusses on causes other than climate change, but underlines the fact that the concept of vulnerability includes hunger vulnerability, and refers to individuals or communities rather than broad economic regions or sectors.
Blaikie et al2 in At Risk: Natural Hazards, People’s Vulnerability, and Disasters: “The characteristics of a person or group in terms of their capacity to anticipate, cope with, resist and recover from the impact of a natural hazard… vulnerability is a measure of a person or group’s exposure to the effects of a natural hazard, including the degree to which they can recover from the impact of that event.”
Kelly and Adger in Social Vulnerability to Climate Change and the Architecture of Entitlements: “the ability or inability of individuals or social groupings to respond to, in the sense of cope with, recover from or adapt to, any external stress placed on their livelihoods and well-being.”
Understanding VulnerabilityIn general terms vulnerability can be defined as the “diminished capacity of an individual or group to anticipate, cope with, resist, and recover from the impact of natural and/or man-made disaster”.1 People, when they are isolated, insecure, and defenceless in the face of risk, shock or stress, become vulnerable. The vulnerability of a group or community is different according to the sector considered and where they live. For example, farmers in India face very different agriculture impacts from climate, compared to farmers in Europe or Australia. Right in India, small and marginal farmers in dryland ecosystems face very different problems from those faced by farmers in irrigated regions.
Definitions of Vulnerability Vulnerability has varied definitions drawing from differing concepts and standpoints, so to simplify matters we shall use the most commonly followed definitions of vulnerability.
Vulnerability is of two types: biophysical and socio-economic. The risk factors in nature that threaten a community constitute its biophysical vulnerability. Its socio-economic vulnerability arises from internal and external characteristics which constrain its responses and ability to adapt – poverty, inequality, marginalisation, food security, housing quality, access to insurance, alternative livelihoods, health and education, etc.
1 /en/what_we_do/disaster_management/about_disasters/what_is_a_disaster/what_is_vulnerability accessed on 3rd May 20122 www.ifrc.org/en/what_we_do/disaster_management/about_disasters/what_is_a_disaster/what_is_vulnerability accessed on 3rd May 2012

15
CoDr
iVE-
PD –
A H
andb
ook
Sphere Domain
Social Economical Biophysical Physical
Internal Social networks; access to information, education, security; access to human rights, good governance; levels of literacy; social equity; positive traditional values; customs and ideological beliefs; health; Panchayati Raj Institutions (PRIs); local governance in villages.
Household income; availability of loans; source of livelihood; alternative livelihoods.
Topography; environmental conditions; soil; water; land cover; AWC; LGP; forest cover.
Presence of basic public infrastructure, especially water supply and sanitation, as well as adequacy of health care facilities and supplies; remoteness of a settlement; transportation, communication networks.
External National policies; international aid; development organisations and institutions.
Economic globalisation; inflation; subsidies; insurance.
Severe storms; earthquakes; sea-level change; temperature and precipitation variability.
The minimal classification scheme of vulnerability factors divides them into two largely independent spheres: the internal and the external. Information on different aspects within each sphere is classified under knowledge domains: social, economic, biophysical, and physical. This classification is presented in the following table.
The IPCC defines vulnerability as “the extent to which climate change may damage or harm a system”. It “depends not only on a system’s sensitivity, but also on its ability to adapt to new climatic conditions”. It is a function of the magnitude of climate change, the sensitivity of the system to changes in climate, and the ability to adapt the system to changes in climate. So, a highly vulnerable system is one that is highly sensitive to small changes in climate and for which the ability to adapt is severely constrained (IPCC 2000a).1 Wealth provides means to adaptability, poverty constrains adaptive capacity. Vulnerability is highest where there is “the greatest sensitivity to climate change and the least adaptability”.3
So vulnerability of a community or system must be gauged by taking into consideration the broader external conditions, biophysical and socio-economic, within
3 Intergovernmental Panel on Climate Change (IPCC). 2000a. Presentation of Robert Watson, Chair, Intergovernmental Panel on Climate Change, at the Sixth Conference of the Parties to the United Nations Framework Convention on Climate Change, The Hague, 13 November 2000.

16
In a climate change context, vulnerability is a function of exposure, sensitivity, and adaptive capacity, where:
Adaptive capacity is the ability of the system to adjust to actual or expected climate stress or cope with the consequences, the degree to which adjustments in practices, processes, or structures can moderate or offset the potential for damage or take advantage of opportunities created by a given change in climate. It is considered as a function of wealth, education, information, skills, infrastructure, access to resources and stability and management capabilities.
Sensitivity refers to the degree to which a system will respond to a change in the climate, either positively or negatively.
Exposure is the degree of climate stress, long-term changes, exposure to the potential climate risk (for example, economic globalisation increasing the risk of climate change).
Source: IPCC
Exposure
Sensitivity Potential Impact
Vulnerability
Adaptive Capacity
Figure 2: Key components of Vulnerability
Source: http://trainingfws.gov/CSP/Resources/vulnerability/pdfs/VA_Basics.pdf
which it exists, and the internal characteristics that determine its ability to cope and adapt to stresses and risks caused by climate change.
Climate Change in India: Trends India is a vast emerging economy, but it is also home to a third of the world’s poor. The bulk of the population lives in villages and forests. Of them, 700 million are directly dependent on climate-sensitive sectors – agriculture, fishing, livestock

17
CoDr
iVE-
PD –
A H
andb
ook
management, and forests and the natural resource base of water, biodiversity, mangroves, coastal zones, and grasslands for subsistence and livelihoods. This resource base is under threat, and in turn, so are the people whose livelihoods depend on it. Among these people are some of the most vulnerable: the landless poor, forest dwellers, and primitive tribal groups. By 2045, when India is expected to be the most populous nation on earth, this vulnerable population will be proportionately larger, while the resource base will be further depleted. The economic, social, and ecological price of climate change will be huge.
Climate change is starkly evident in the trends seen in India’s climate over the last century. The country as a whole is hotter – mean temperatures are up by 0.56°C, with some local variations. Rainfall patterns during July–September have changed, with increasing trends in some regions (Gangetic West Bengal, western Uttar Pradesh, Madhya Pradesh, Jammu and Kashmir, Konkan and Goa, Maharashtra, Rayalaseema, and coastal Andhra Pradesh) and decreasing in others (Jharkhand, Chhattisgarh, and Kerala). Sea levels are changing, having risen by 0.4–2 mm a year along the Gulf of Kutch and the Bay of Bengal, but fallen along the coast of Karnataka.
Most of India is under risk of severe climate change impacts and the areas most endangered are the ones with the poorest populations most heavily dependant on their local ecosystem for survival. These ecosystems are under risk from climate factors which will never be in our control. They are under pressure from external socio-economic factors, also largely out of our control. We need to effectively evaluate their vulnerability in cooperation with them and other stakeholders, in terms of their own environment and its relationship with the greater outside factors, and generate solutions from such assessments.
Climate Change Vulnerability Index (CCVI), released by global risks advisory firm Maplecroft, United Kingdom, has ranked India the second most vulnerable country to climate change after Bangladesh. According to the report, almost the whole of India has a high or extreme degree of sensitivity to climate change, due to acute population pressure and a consequent strain on natural resources. This is compounded by a high degree of poverty, poor general health, and the agricultural dependency of much of the populace.


Setting the Context:Need for Assessing Vulnerability to Climate Change for Project Design and Implementation
SECTION 3

20
21
CoDr
iVE-
PD –
A H
andb
ook
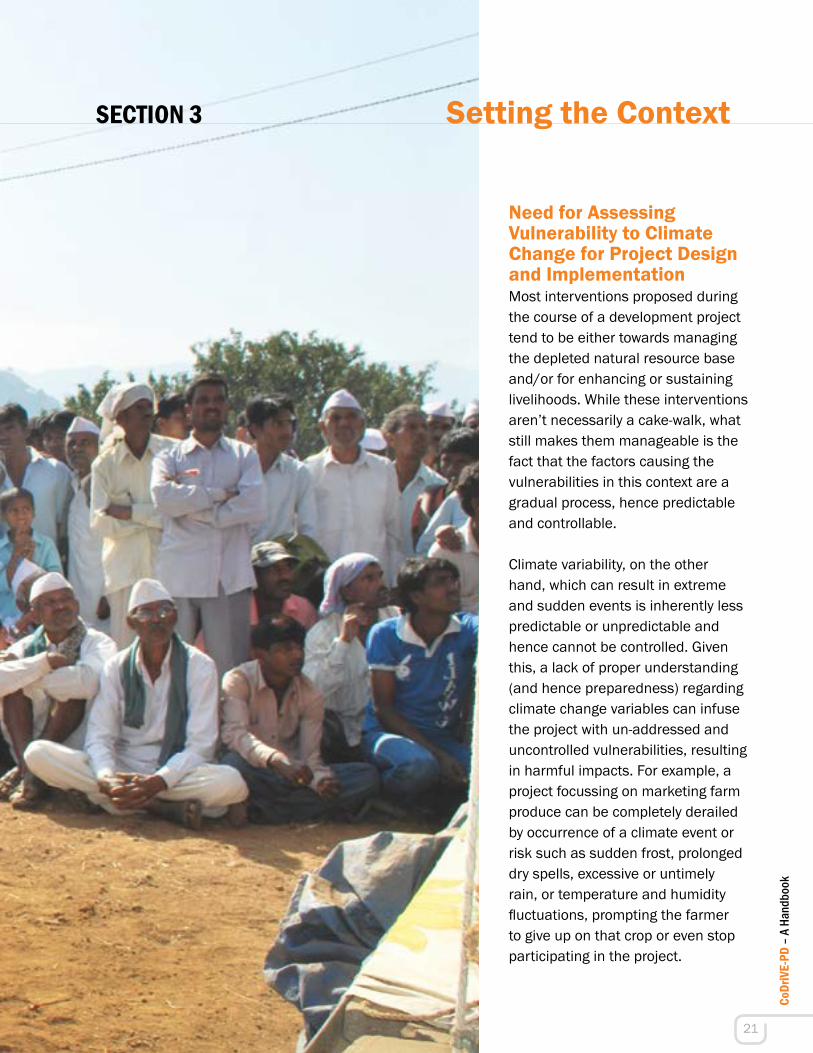
Need for Assessing Vulnerability to Climate Change for Project Design and ImplementationMost interventions proposed during the course of a development project tend to be either towards managing the depleted natural resource base and/or for enhancing or sustaining livelihoods. While these interventions aren’t necessarily a cake-walk, what still makes them manageable is the fact that the factors causing the vulnerabilities in this context are a gradual process, hence predictable and controllable.
Climate variability, on the other hand, which can result in extreme and sudden events is inherently less predictable or unpredictable and hence cannot be controlled. Given this, a lack of proper understanding (and hence preparedness) regarding climate change variables can infuse the project with un-addressed and uncontrolled vulnerabilities, resulting in harmful impacts. For example, a project focussing on marketing farm produce can be completely derailed by occurrence of a climate event or risk such as sudden frost, prolonged dry spells, excessive or untimely rain, or temperature and humidity fluctuations, prompting the farmer to give up on that crop or even stop participating in the project.
Setting the ContextSECTION 3

22
Scenario IDairy farming is highly water-intensive; the cattle, in particular the cross-breeds, are prone to heat stress and consequent higher disease incidence – an unexpected prolonged dry spell can quickly lead to a skewed ratio of input and output
Scenario IISimilarly, in an unexpected scenario of high intensity rainfall and consequent higher relative humidity, there will be a higher incidence of vector-borne diseases and/or zoonoses (diseases transmitted from animals to humans) – needless to say this is a disastrous proposition for communities involved in small-scale commercial poultry.
Vulnerability of Communities is further aggravated
CLIMATE CHANGEWill never be in our control
Vario
us ot
her E
xte
rnalities
MarketsDEPLETING NATURAL RESOURCES

23
CoDr
iVE-
PD –
A H
andb
ook
Furthermore, most often projects aimed at improving livelihood outcomes introduce dairy farming with cross-bred cows, or poultry farming, as seemingly lucrative alternate income augmenting options. If the community dependence on these alternatives increases and if in parallel the climate is trending towards conditions unsuitable for that specific livelihood option, very quickly these lucrative options start becoming a drain on the primary income of the community (ref: scenario I and II in the box), increasing their vulnerability to climate change.
It is therefore apparent that if an assessment of vulnerabilities aggravated by or resulting from climate variability or change is not made early-on, the chances of a project failing are much higher and control of a desirable outcome more difficult. On the other hand, this means that an assessment of these vulnerabilities beforehand would help identify appropriate interventions, design appropriate support systems, and in a no-go scenario take a timely call on diverting or utilising the project funds for a better cause.
Considering climate variability is hardly a new phenomenon and the communities have always been exposed to it, the question may arise: why should one specifically factor-in this variability into planning? While these changes have always been there, what has changed is the frequency and intensity of climate variability and occurrence of sudden events that are completely atypical for a specific region. These events aggravate vulnerabilities that already exist, and trigger coping or adaptation responses that may further compound the vulnerabilities or the climate variability factors, thus adversely impacting livelihoods.
In its studies, WOTR found that risks and uncertainties to project implementation has increased over time with the rapidly changing context, increasing variability in climate, and occurrence of extreme climate events new to that region (fig. 3). From this germinated the thought about the need for building in appropriate measures into the project that would indicate, at intervals, its vulnerability to climate change. This would help plan projects more efficiently, make mid-course project adjustments as appropriate, and identify timely interventions that help reduce the vulnerability of the ecosystem and the communities inhabiting it.
If ignored, the vulnerabilities associated with climate change can result in either failure due to wasted investments, or unintended consequences that impact the ecosystem and communities adversely. This is because the adaptation responses of communities change with changing risks and environmental conditions (the availability of the five livelihood capitals – human, natural, social, physical, financial). In case the livelihood capitals are already low, the chances are that the communities’ coping responses to climate risks would result in more vulnerability.

24
This section reviews various vulnerability assessment conceptual frameworks, their interpretation, and incorporation of these concepts in the development context. Some of the important decision-making tools developed by various development agencies to mainstream vulnerability assessment in their respective programmes have also been summarised for quick reference. Details of the same can be found in Annexure 2.
Introducing: A Community Driven Approach to Evaluating Vulnerability A typical vulnerability assessment looks from a macro perspective and identifies, quantifies, and prioritises (rates) the vulnerabilities of a system. It usually follows these steps:
Categorises assets and capabilities (resources) in a system. Assigns quantifiable value (or at least rank order) and importance to those
resources.
project goals/innovations were achievable – 5–7 year period, brilliant results
Climate Change moving at a faster pace
1960–70s
project objectives/goals were achievable – 5 year period: some good results, but had unintended negative consequences
1980–2000
results difficult to achieve as the context is changing rapidly
2000 onwards
UnpredictabilityNeed for frequent project adjustment, mid-course changes/adjustment increases
And identifying various suitable options
Figure 3: Changed climate scenario demands changes in project planning
Conceptual Frameworks for Vulnerability AssessmentIPCC Concepts, Risk-hazard framework, Nested hierarchy model of vulnerability, DPSIR, Participatory vulnerability approach, Integrated modelling system (IMS), Climate change vulnerability assessment, Climate change and food security framework (CCFS), Concept of double exposure, Vulnerability framework for the assessment of coupled human-environment systems, Sustainable rural livelihoods (SRL) framework, Vulnerability and capacity assessment (VCA), Integrating adaptation within the project cycle, Millenium ecosystem assessment (MA), Disaster risk reduction (DRR).

25
CoDr
iVE-
PD –
A H
andb
ook
Identifies the vulnerabilities or potential threats to each resource. Tries to identify how to mitigate the most serious vulnerabilities for the most
valuable resources.
This analytical framework should take into consideration climate and socio-economic probabilities, besides the current and future exposures as also adaptation possibilities. These exposures and adaptations will indicate the current and future vulnerability of the system under study.
However, WOTR’s community driven framework for evaluating vulnerability (fig. 4) uses systems thinking and resilience theory to reduce the risks associated with climate change. Repeated vulnerability assessments are key to successful climate change adaptation and building resilience as they reveal what systems, species, populations, entities, etc. are most vulnerable to expected or projected or possible climatic changes, depending on factors such as exposure, sensitivity, and adaptive capacity.
Vulnerability due to Climate Variability, and Building Resilience to it WOTR’s approach to reducing vulnerability builds on the resilience theory, and considers the watershed (the main unit of analysis) as a complex social-economic system (SES) which has threshold limits and is dynamic. A resilient SES can
Figure 4: WOTR’s Analytical Framework for Community Driven Vulnerability Evaluation
Climate probabilities
Systems Thinking
Socio-economic probabilities
Resilience Theory Li
velih
ood
Cap
itals
Vulnerability
Future vulnerability
Current exposure
Current adaptations
Future exposure
Adaptive Capacity

26
withstand shocks and rebuild itself rather than collapsing past the threshold limit where it passes into a state where it is controlled by different processes. A resilient SES is able to withstand shocks and absorb change and still retain the same control of function and structure, has capacity to self-organise, and to build and increase the capacity for learning and adaptation.
The process can be described in a resilience cycle: growth and exploitation (r) and conservation (K) where there is a slow stabilising process of exploitation or growth and accumulation, and in times of need, quick release of resources (omega), and then reorganisation and renewal (alpha). However this can only be done if all the five livelihood capitals pertaining to that climate sensitive sector be adequately available. Therefore project interventions should aim at keeping the five livelihood capitals balanced and increasing so that the system, which depends on these for its support and sustenance, can maintain its resilience cycle and the adaptive process is sustained and strengthened (fig. 5).
Growth
Renewal Locked up Resources
Conservation
Natural CapitalFinancial Capital
Human Capital Physical Capital
Social Capital
Project interventions need to keep these capitals in a balance and growing
Figure 5: Resilience Cycle and the Adaptive Process

CoDriVE-PD – The Tool Planning by Evaluating and Incorporating Vulnerability to Climate Change
SECTION 4

28

29
CoDr
iVE-
PD –
A H
andb
ook
Planning by Evaluating and Incorporating Vulnerability to Climate Change As a tool, CoDriVE-PD helps generate a set of pointers/indicators that forecast/represent the overall increased vulnerability of the communities in a particular geographic region owing to an incremental vulnerability brought on by unpredictable climate variability. Furthermore, since the these pointers/indicators are derived from across different key livelihood capitals in that area, the development practitioners can identify and choose appropriate, timely interventions and capacity-building measures against any or each of these capitals towards bringing down the overall vulnerability.
The evaluations using this tool are dynamic, open-ended, and allow for constant revisions and improvisation as it is an acknowledged fact that vulnerabilities of a community can change over time in different and subtle ways, with change and variability in climate.
CoDriVE-PD – The ToolSECTION 4

30
CoDriVE-PD is a combination of
Community Participation
Resilience Theory
DPSIR, CRiSTAL & SLA frameworks
5 livelihood capitals
Climate Lens
Syst
ems
Thin
king
Systems Thinking
Ensuring accuracy in assessing who and what is vulnerable, and why?Thereby helps
planning for development under uncertainity more manageable
Figure 6: CoDriVE-PD Framework
The present section describes how CoDriVE-PD can be used to assess/evaluate vulnerability to climate change by setting the framework; providing a step-by-step guideline for applying the tool to generate a vulnerability code and finally explains how the code can be used while developing interventions.
Framework and Approach It may be noted that the term ‘Vulnerability’ is being used here in the context of ‘Vulnerability of the Community’ and NOT vulnerability of the project – Community is thus central to the vulnerability evaluation using CoDriVE-PD
CoDriVE-PD conducts the evaluation through a climate lens scanning the community’s perception of its situation vis-à-vis the five livelihood capitals, encompassed by the resilience theory and systems thinking approach to synthesise and interpret the findings.
With CoDriVE-PD vulnerability indicators are derived from across different key livelihood capitals, leading to measures that bring down overall vulnerability.
The evaluations are dynamic, open-ended, and allow for constant revision and improvisation.

31
CoDr
iVE-
PD –
A H
andb
ook
It is a recombinant tool developed by converging key aspects of three known international research methodologies namely, Participatory Tool on Climate and Disaster Risks, DFID’s Sustainable Livelihoods Framework and the Driver-Pressure-State-Impact-Response (DPSIR). Thus synthesised, this tool helps not only make an accurate assessment of the who, what and why of the climate risk (vulnerability), but also simultaneously helps in designing a response and incorporating it either proactively during the design or employed as a mid-course intervention.
Frameworks used to formulate CoDriVE-PD
Participatory Tool on Climate and Disaster Risks: is the fifth edition of the Climate and Disaster Risks Tool. The structure and methodology of the tool are strongly based on CRiSTAL and the CARE CVCA Handbook. CRiSTAL stands for Community-based Risk Screening Tool – Adaptation and Livelihoods. The tool has been elaborated by the International Institute for Sustainable Development (IISD), Intercooperation, the International Union for Conservation of Nature (IUCN), and the Stockholm Environment Institute (SEI). Climate Vulnerability and Capacity Analysis (CVCA) tool aims at helping community-level project developers, managers and coordinators to analyse existing or planned development projects with respect to climate change and disaster risks. It is the explicit purpose of this tool to integrate considerations of climate change and disaster risks into all kinds of community-level development activities. It can also help to devise advocacy strategies. For more information on the tool visit: www.cristaltool.org
DPSIR: The Driver-Pressure-State-Impact-Response framework is used in GEO reports, including the fourth Global Environment Outlook: Environment for Development (GEO-4) for Integrated Environmental Assessment (IEA). Integrated analysis of environmental trends and policies is one of the core elements of IEA. It analyses environment and human well-being trends and dynamics answering 1. What is happening to the environment and why? 2. What are the consequences for the environment and humanity? and 3. What is being done, and how effective is it? Use of this framework identifies the drivers of human development and associated pressures that, along with natural processes, affect the state and trends of the environment. Changes in the state of the environment have impacts on ecosystem services and aspects of human well-being. It also analyses policies directed at the mitigation and conservation of the environment, as well as adaptation by people to the environmental impacts. Integrated assessment of the state of the environment identifies priority environmental and sustainability issues, specific indicators, and policy targets for a given issue. Such a process could also be used to identify linkages to human well-being. http://www.unep.org/geo/pdfs/geo_resource/module-5.pdf
DFID’s Sustainable Livelihoods Framework http://www.eldis.org/vfile/upload/1/document/0901/section2.pdf

32
Community is central to CoDriVE-PD evaluations and scans a community’s perceptions of its situation through a climate lens.
The watershed, the basic unit of analysis in CoDriVE-PD, is a complete socio-ecological system in itself
Step 1
Step 2
Step 3
Step 4
Step 5 Arrive at the code for the area based on the five capitals
Sensitivity Analysis of main resources in the area that are essential for coping with climate risk, using the five capitals
Generate system maps to understand key linkages, critical problem areas and high leverage points
Sensitivity Analysis of the responses from the community
What is happening to the environment and why?
Five-step Process to Articulating Vulnerability In line with the centrality of community to vulnerability evaluation, the watershed, which is a social-ecological system in itself, i.e. a living space and ecosystem in which communities live and draw their sustenance from, forms the basic unit of analysis in CoDriVE-PD. Within this unit, vulnerability to climate change can be evaluated at three levels:
Watershed (village) - for overall ecosystem vulnerability. Production/Sub- System – for evaluating vulnerabilities of
varied livelihood sectors and sub-sectors within the ecosystem, e.g. agriculture, livestock, fisheries, forest-based livelihoods, human health, non-farm based sectors.
Individual (household) – for evaluating vulnerabilities of special groups within the ecosystem.
Once the practitioner determines the level at which the evaluation needs to be made, the following 5-step process needs to be followed for recording and analysing the climate constants and variables, making evident the interplay among them, and generating vulnerability indices (ref: illustration below).

33
CoDr
iVE-
PD –
A H
andb
ook

34
ACTIVITY, EFFORTS INVOLVED and the EXPECTED OUTPUT
STEP 1
STEP 3
STEP 4
STEP 5
INFORMATION COLLECTION
Building a vulnerability context – “What is happening to the environment and why?”
VULNERABILITY CODE
Arriving at the Vulnerability Code
Generate system maps to understand key linkages, critical problem areas, and high leverage points
ANALYSIS OF INFORMATION
SENSITIVITY ANALYSIS
Sensitivity analysis of the main resources, in relation to the identified climate risks, that are essential for coping with climate risk in the area
ANALYSIS OF INFORMATION
Sensitivity analysis of the responses
STEP 2

35
CoDr
iVE-
PD –
A H
andb
ook
A multi-dimensional vulnerability code for village or its group or livelihood system is developed. This provides an indication of the status of each capital. This code then implies or indicates multi-dimensional vulnerability for that particular village/group/livelihood system under study, indicating the cause or reason behind its vulnerability at that point in time.
PURPOSE OUTPUTS
Past history of the village 1960–2000. Present village status from year 2000 onwards. Drivers and Pressures identified in each
sectors that have been triggering change.
List of climate risks in the area. Frequency and timeline of the climate risk in
the region. List of impacts of the climate risks in the region
on different livelihood sectors. Consequences on the environment and the
community. Adaptation responses of the communities to
the impacts of climate risks.
Efficiency, sustainability and effectiveness of the response and its impact on the community and ecosystem and its vulnerability is assessed.
Resources essential to cope with these climate risks are identified.
The effective responses that can be amplified through projects are identified.
Identification of high leverage points which, if addressed, reduce vulnerability.
Clear understanding of the existing regional vulnerabilities – ecological and social point of view.
Indication of where the community is heading. Complete systems map of the current situation.
This step involves processing the collected information to find out
Consequences of climatic change risks on the community’s environment (watershed village/other natural resources), and why?
Key resources that are highly sensitive to climate hazards and essential to cope with risk arising out of climate hazards at different levels are identified.
The reasons and contextual information, that help understand why these are viewed as key resources and considered essential to cope with climate risks, are noted. This helps develop a better understanding for assessing vulnerability, as well as for identifying and planning project interventions.
This step involves processing the collected information to find out
Impact of the climate change risks on livelihood resources and possible interventions by way of:1. Conducting sensitivity analysis of all livelihood resources identified in
Step 2 using the five capitals at three levels: Watershed (village) – for overall ecosystem vulnerability. Production system – for evaluating vulnerabilities of varied
sub-groups, clusters within the ecosystem, e.g., agriculture, livestock, fisheries, forest-based livelihoods.
Individual (household) – for evaluating individual vulnerabilities within the ecosystem.
2. Grading these resources; first by the communities on a scale of 1–5, to identify which of these are highly sensitive to climatic hazards and are essential to cope with the risks.
3. The grading is finalised based on quantitative data available from the study site and based on the opinion of experts.
This step involves finding out
1. Community’s response and perception of adequacy of response to the above climate risks
What is the typical response of the community to the climate risks identified?
How efficient, effective, and sustainable are these responses? What is the impact of these changes on the overall ecosystem and
community? (i.e. does it increase or decrease their vulnerability) What resources does the community feel it needs in order to cope with these?
After this, a list for the type of resources essential to cope or respond to the related climate risk are identified.
This step involves processing the collected information towards
1. Further fine-tuning the data generated at step 4 by way of: Filtering data from Step 4 at different levels by doing another
sensitivity analysis and grading the capitals again, on a scale of 1–5. This step is however done at the project team level using all the other sources of information collected so far.
This step involves
1. Identifying the Drivers and Pressures of change What was the past like? What were the main livelihoods sources then? What are the main livelihoods sources now? What changes have taken place? What triggered these changes? What is the current state of rural communities?
2. State and Trends of climate in the region What are the community perceptions of their main climate risks/
hazards? What is the frequency and time (year/month, etc.) of these climate
events? What was/is the impact of the above on the community? How do communities respond to such events?
CoDr
iVE-
PD W
orks
heet
* –T
able
A
CoDr
iVE-
PD W
orks
heet
* –T
able
B
CoDr
iVE-
PD W
orks
heet
* –T
able
CCo
DriV
E-PD
Wor
kshe
et*
– Ta
ble
DCo
DriV
E-PD
Wor
kshe
et*
- Ta
ble
ECo
DriV
E-PD
Wor
kshe
et*
- Ta
ble
F
* Co
DriV
E-PD
Wor
kshe
et- P
leas
e re
fer A
ppen
dix
xxiv

36
While having a team of experts (social, technical, and research specialists of all disciplines) visiting communities in a group to collect all information would be an ideal-case scenario, WOTR’s experience reveals that being a tool designed to be driven by the communities, CoDriVE-PD implementation does not require any specific technical expertise, though extensive work experience within the area of evaluation would help immensely. A minimum of two persons is required.
CoDriVE-PD – The Flexi-duration ToolSince the application of CoDriVE-PD spans action research, project feasibility studies, as well as for project planning and adjustment or for raising community awareness, it can be conducted either in a rapid (quick, suggestive) or relaxed (longer, robust, actionable) fashion. It is recommended that at least three days be allotted for this assessment, whereas it may take ten days when done in a relaxed manner.
The flow diagram (Fig. 7), provides a time-line of activities to be conducted during an assessment made over three days (the same can be extended to ten days for a relaxed evaluation as given in the brackets)
Field work
Field work & first level of analysis
Further analysis, mapping of linkages, and code generation
DAY 1 (Step 1)
RELAXED WAY
RAPID WAY
The first day is devoted to outdoor field work, meeting the various community members and local stakeholders, and collecting data. This includes a transact walk through the village for the entire team, to make independent assessments of conditions. The second day will be employed filling in worksheets, analysing data, and again meeting people to fill in gaps found in the information. Systems maps are generated. On the third and final day, analysis is completed, vulnerability codes generated, and required interventions identified.
If time is not a constraint, the 10-day relaxed approach can be taken up by spacing out the activities as follows;
DAY 2 (Step 2 & 3)
DAY 3 (Step 4 & 5)
Field work
Field work & first level of analysis
Further analysis, mapping of linkages, and code generation
DAY 1-3 (Step 1)
DAY 4-6 (Step 2 & 3)
DAY 7-10 (Step 4 & 5)

37
CoDr
iVE-
PD –
A H
andb
ook
DAY ONE Build vulnerability context
and identify states & trends of region’s climate.
Collate responses
FGD with groups from main livelihood source identified.
Interview secondary stakeholders from various village-level functions, e.g., line department officials.
Elders, Women’s groups, Special Committees, Village-level Officials
Organise village level, multi-stakeholder meeting.
Identify vulnerable groups.
Focus Group Discussions (FGDs) with village elders, women’s groups, special committees involved in local governance.
Transact walk.
DAY TWOData sensitivity analysis. Additional discussions,
if required. Generate systems maps
DAY THREEData updates and analysis.
Generation of Vulnerability Code.
Identify interventions
Assessment team, External stakeholders, if
required
Assessment team, Experts from various
disciplines
Fill and analyse data in tool worksheet.
Secondary literature survey.
Conduct additional FGDs in case gaps are discovered after analysis.
Generate systems maps.
Add missing data and complete the analysis.
Generate Vulnerability Code.
Identify required intervention.
Figure 7: Three Day Time-line for a CoDriVE-PD Assessment

38
Guidelines for Conducting Effective Vulnerability AssessmentsSince CoDriVE-PD is a community driven tool, WOTR emphasises the involvement of the entire community so that the findings are rooted in current realities and reflect the direct needs of communities. Building on the practical experience that WOTR has amassed over time, CoDriVE-PD has developed in a very flexible way, suggesting no set participatory tools when acquiring information from communities. This gives practitioners, researchers and decision makers the freedom to innovate and get information in the manner best suited to their circumstance. For eliciting information and grading the livelihood capitals, it is recommended to use any participatory tool which is best understood by the communities.
Prerequisites for Conducting Vulnerability Assessment using CoDriVE-PDBefore the start of the assessment, the surveyors must
Get a good understanding of the baseline data of the village. Have a list of the stakeholders who must be interviewed for the
exercise. Be well-prepared by reading project reports such as Participatory
Rural Appraisals (PRA), Detailed Project Report (DPR), process documentation, social audit, gramsabha (village council) proceedings, and so on.
Have a shared understanding in common, of the tool and its application, so that in the field its application does not get affected by individual interpretations that differ from the group.
Project Level ChecklistBefore beginning the project in the area being assessed for vulnerability to climate change, the team must ensure they are ready in all respects for conducting the study. At a minimum, they must ensure they have:
Intimated all the stakeholders, either directly or through their representatives, about the purpose, dates and duration of the study and requested their presence and cooperation. In particular, the team must ensure that local events, livelihood-related occurrences (say harvest-related work or short-term migration by a majority of the residents to urban centres), and so on, do not conflict with the visit;
Frozen the time to be allocated for village-level meetings; Prepared the schedule factoring in all the constraints;
CoDriVE-PD is very flexible, suggesting no set participatory tools, giving practitioners freedom to innovate and get information

39
CoDr
iVE-
PD –
A H
andb
ook
Training materials ready and available; and Documentation aids like recorders, pen, paper, etc., handy.
The following, furthermore, are non-negotiable in the process of data collection: 1. While generating the codes : a. Eighty percent of the data must be obtained through the
community’s participation. b. It must be substantiated with experts’ analytical capacity and
other skills. c. It must include observations from the transact walk in the
village/region.
2. A team of experts (minimum two) from different disciplines should participate in data collection.
3. It is essential that the assessment of the capitals at all levels (village, household (HH), production system) is done first by the communities.
4. If the team is inexperienced, it is important to bring in an experienced facilitator who is trained in PRA tools and multi-stakeholder processes.
5. It is essential that climate risks as perceived by the communities are noted, as their perception is linked to the response they make.
6. Facilitators’ understanding of climate patterns and risks is essential as responses will vary, and important points may get missed, making it difficult to generate the codes.
7. Details of responses need to be specific to the climate risks they feel.
8. Detailed documentation of drivers and pressures felt by communities (different groups within the sectors, gender- and age-wise) must be identified clearly. It is the most critical step.
9. The use of multiple sources of information, both primary and secondary. Using a combination of community participatory tools at different levels helps in making the right inferences after the analysis is complete. This process would strengthen the process of grading the five capitals and is hence encouraged. This data can then be substantiated or cross-checked using secondary data and by conducting a transact walk through the village.
Please check Annexure 1 for the CoDriVE-PD Guidelines
Using a combination of participatory tools at different levels helps in making the right inferences.

40
Generating Vulnerability Codes using CoDriVE-PDThe generation of the Vulnerability Code is a critical step in assessing vulnerability using CoDriVE-PD. Based on micro-level studies done by WOTR and its practical experience, it became increasingly evident that identifying “indications for vulnerability” is a better approach than using only “indicators”. Calculating an indicator (particularly in the vulnerability context) is very technical, time consuming, and complex. Besides, achieving a desired change as represented by an indicator, is not practicable within the short time frame of project implementation.
An indication is a tangible “sensing” of the status of various conditions that affect a particular measurable result (indicator). It is defined as “a sign or piece of information that forebodes something”; it does not necessarily need to be a measured quantity. Although an indication may or may not be quantifiable, it has the power to guide/steer the actions taken towards the desired direction/outcome.
For example: A project sets an indicator of good watershed development as 50 percent of agriculture being seasonally irrigated. An evaluation reveals that 75 percent of land is now irrigated. However, it is found that the main sources of irrigation are the numerous wells and tube wells and that the ground water levels have gone down from 120 ft to below 500 ft over the years. Hence although the target (75 percent irrigated agriculture) is more than achieved, the lowering of the ground table is an indication of a looming problem and is unsustainable.
Indication (qualitative trends)
Item under study
Indicator (quantitative)
Water scarcity
Increasing tube wells, lowering ground water levels indicated by depth of bore-well, failure of bore well
A numerical value for ground water level, number of bore wells etc.
An indicator is a quantitative and time consuming process; an indication is qualitative, quick and emerges from tangible sensing of various conditions that favour or not, the desired state

41
CoDr
iVE-
PD –
A H
andb
ook
In view of the above, a Vulnerability Code specific to the village, group or livelihood system that is based either on the availability or quantity or functionality of the “Five Livelihood Capitals”, offers a quicker approach to assessing vulnerability appropriately. The Vulnerability Code is generated by grading each capital (on a scale of 1–5), based on a list of factors that are location- or region- specific. This is offered as a better option than use of a general vulnerability index because often the indicators identified are village or group specific and there are, invariably, some differences between groups. Observations reveal that a cluster of villages may show similar indications of vulnerability when taking the various externalities into consideration, while it may differ from the neighbouring cluster. Hence, a broad vulnerability index for a district or a region may not be useful or practical.
The five-digit code generated using CoDriVE-PD gives an indication of the status of each capital (in terms of either its quantity or availability or functionality, as appropriate), which implies the type of vulnerability to climate change existing for the village, group, or production system being studied. The vulnerability code mirrors the multi-dimensional nature of vulnerability, which is dynamic in nature.
It is for this reason that one-time vulnerability assessments may not be enough and need to be repeated at regular intervals. As the method of assessment is quick and gives “near-to-accurate” indications as to what is causing vulnerability and where its impacts are felt, it helps design relevant and timely mid-course corrections, when implementing a project.
Based on the data collected, each livelihood capital is graded for adequacy/functionality on a capital-based resilience scale of 1–5, where 1 = nil (0-10%), 2 = minimum (11-25%), 3 = low (26-45%), 4 = adequate (46-70%), 5 = high (71% and above). Taking it further, for better understanding a vulnerability colour coding index for indicating vulnerability based on Capitals can/may also be used
Vulnerability codes give multidimensional information on various aspects of specific locations or systems. A broad vulnerability index misses the sectoral dimensions, hence would be less practical or useful
The five-digit code generated using CoDriVE-PD gives an indication of the status of each capital, which reflects the type of vulnerability to climate change existing for the village
The Vulnerability Codes are specific to the village, group, or livelihood system that is based either on the availability or quantity or functionality of the “Five Livelihood Capitals”, offering a quicker approach to assessing vulnerability appropriately.

42
Financial Capital
Human Capital Natural Capital Physical Capital Social Capital
Recent project with village fund for watershed development is available.
VOs are strong and have funds.
Human capital with respect to climate-sensitive livelihoods is low: most of the knowledge is increasing maladaptation, with climate change increasing the risk.
CBOs like the VOs and watershed committee, have funds, but have no knowledge of climate-adaptive strategies to use the funds effectively; currently the funds are being used/allocated for more maladaptive livelihoods which will further increase vulnerability to climate variability.
No forest lands.
Minimal availability of common property resources.
Low in local biodiversity.
Ground water scarcity very high.
Natural water bodies decreasing/drying up.
Degrading cultivable lands (problems of soil fertility, salinity, etc.)
Physical capital with respect to education, transportation, and institutions is adequate.
However physical capital with respect to climate-sensitive livelihoods is very low.
Seed banks and agricultural warehouses are located very far away.
There are large numbers of bore wells but no recharge structures.
No farmers clubs/cooperatives.
No labour associations.
Watershed committees formed but weak; high political problems.
VOs are formed but are dominated by the richer class.
4 1 2 2 3
Stable Danger Risk Risk Alert
where: Red – Danger (1), Orange – Risk (2), Yellow – Alert (3), Blue – Stable (4), Green – Safe (5), making the results more clearer.
It is to be noted that no range of numerical values or list of indicators for grading is being provided as this index may differ from one ecosystem, region, or country to another. This approach addresses the problems created by blanket-approach strategies, as variability is addressed adequately. Hence the experts, researchers, or practitioners using CoDriVE-PD are given flexibility to arrive at their own list of indicators and methods to grade the capitals in their study areas. This approach then facilitates the emergence of locale-specific interventions that are suitable to that particular region or area.
After analysis, CoDriVE-PD leads to a five-digit code that indicates/implies the degree of vulnerability of a village, group, or livelihood system due to the absence or inadequacy of each capital, the presence of which is essential to cope with emerging climate risks or hazards in that region.
In the example given below, the vulnerability code of a village (at watershed level) is 41223, based on an assessment of the state of the five capitals, as shown.
Experts, practitioners, and researchers using CoDriVE-PD are given flexibility to arrive at their own set of indicators and methods to grade capitals in their area

43
CoDr
iVE-
PD –
A H
andb
ook
For easy reference it is suggested that a colour coding is done. The colour reference for different capitals will alert and provide a visual reckoner to identify the capital under threat and help devise measures to work on.
It can be observed that the Human capital is red = in danger, the Natural and Physical capitals are orange = at risk, hence need immediate attention, whereas the Financial capital is blue = stable, and Social capital is yellow = alert status, and can be dealt with later.
The code helps users to come to a quick conclusion as to which livelihood capital requires more attention, thereby providing an indication about the kinds of interventions required. It also helps when taking decisions for fund allocation. The codes can also help manage projects that are being implemented at a larger scale as the code gives both the status of the livelihood capitals as well as the indications of vulnerability. Hence villages with the same codes for the same capitals can be grouped and both interventions and fund allocation can be made more quickly.
Since the code is village or group or production/sub-system specific, variability is addressed adequately and the dangers stemming from blanket policy decisions are minimised. For example, from the codes developed for some villages of districts one and two (Table 3), it can be concluded that villages in District 1 have no financial capital (graded 1) and poor human and social capitals, hence project investments and interventions need to be directed towards improving the financial, social and human resources of the villages. The physical capital is quite high (graded 3 and 4), so needs no immediate intervention. However, villages in District 2 give indications of high financial and human capital (graded 3 and 4) but natural capital is low (graded 1 and 2), as are physical and social capitals. Interventions will need to target problems caused by the lack in all three, to improve their status. Natural capital is minimum to low in both districts.
When repeated at regular intervals the codes reveal a pattern that either indicates reduction or increase in vulnerability based on the status of the capitals. It helps in project adjustment, planning, fund disbursement, and also for evaluation.
The code helps find out quickly which livelihood capitals need attention.Grouping together villages with the same codes for the same capitals, helps for quick, efficient intervention and fund allocation
Since the code is village or group or production/sub-system specific, variability is addressed adequately and the dangers stemming from blanket policy decisions are minimized.
Table 3: Understanding the Vulnerability CodeDistricts Village
codes District 1 12241
123321323112231
District 2 442133421344321
The Vulnerability Code addresses each local capital, and is specific to village, household, or production system. It mirrors the multi-dimensional and dynamic nature of vulnerability and helps design relevant and timely interventions

44
CoDriVE-PD Work Sheet Step 1: Building a vulnerability context – “What is happening to the environment and why?”
This step involves collecting information sector wise from communities through Focus Group Discussions, interviews further supported by secondary literature later. It consists of two tables; Table A is about identifying the Drivers and Pressures to build a vulnerability context and Table B is about identifying the state and trends in the region.
Step 1, Table A: Identifying the Drivers and Pressures of change
While collecting data for this section always find out reasons as to why/what has triggered the change. This will help identify the drivers and pressures to be filled in column 4 of the worksheet. Maximum detailing of table A and B of step 1 is essential for analysing and grading the capitals in the subsequent steps. Climate Sensitive Livelihood sectors. Add other sectors as applicable in your area
Past - History (30–40 yrs)
Present -Status Drivers and Pressures identified in each sector
C.No: 1 C.No: 2 C.No: 3 C.No: 4
1: Agriculture Drivers: Pressures :
2: Livestock Drivers: Pressures:
3: Forests Drivers: Pressures :
4: Fisheries Drivers: Pressures :
5: Non-farm livelihoods that support above sectors 1.2.34.
Drivers: Pressures :
6: Other climate sensitive sectors and crosscutting themes1. Health 2. Gender 3.Local governance
Drivers: Pressures :

45
CoDr
iVE-
PD –
A H
andb
ook
Step 1, Table B: State and Trends of climate in the region
What was the climate earlier?(up to year 2000 – general description, narrative)
What do you observe happening now?What are the main climate risks, the trends since year 2000, the current impacts and the responses taken by communities and external agencies in context to the climate risks identified?
Climate Risk / hazard2000 – till date(Add rows as per need)
Frequency & time line
Current Impacts of the climate risks ; the consequences for the environment and humanity
Responses to the current situation
Responses by community
Responses by government /external agencies
C.No: 5 C.No: 6 C.No:7 C.No: 8 C.No: 9 C.No 9.1
C.No: 9.1
1.
2.
3.
Step 2, Table C: Responses - what is being done and how effective is it?
Climate Risk Use data generated in C.no: 6
Responses Use responses identified in C.No: 9 only
Efficiency & sustainability/effectiveness
Impact on ecosystem
Impact on communities
List what kind of resources are essential to cope/respond to the climate risk identified (based on c. Nos 12,13,14)
C.No: 10 C.No: 11 C.No: 12 C.No: 13 C.No: 14 C.No: 15
1.
2.
3.
Step 3, Table D: What are the consequences for the environment and humanity (living in watershed village) and why?
This step involves generating system maps to understand the key linkages, critical problem areas and high leverage points and their links, to climate risks in the region. The user may use the cause and loop diagram tool to generate the system maps. The information from table A column 4, the climate risks identified in Table B, and the responses communities take in

46
Step 2, leading to a vulnerable situation, is expected to be illustrated in this section to get the big picture. One starting point would be to use climate risks identified in C.No:10 to develop the cause and loop diagram in relation to that.
Illustrated example:
Climate risk 1: Droughts Climate risk 2 : Irregular rainfall Climate risk 3: Prolonged dry spells
Fodder scarcity due to less/no crop residues → reduction in indigenous cattle → reduction in manure → increased use of chemical fertilisers → decreasing soil quality → decreasing crop yields
Increased pest attack on crops → increased pesticide sprays → increasing input costs → decreasing soil quality over time → reduction in yields → changing seeds and crops as per markets → loans increasing → effects food security and human well-being
Severe crop damage (100% loss) → if crop is in young or middle stage → complete loss in both income & fodder → effects food security and human well-being
Result:
Soil quality
Manure availibility
Grazing-based livestock production
Fodder availibility
Droughts and man-made water
scarcity
Pest attacks
Pesticides usage
Migration
Labour costs
Chemical fertiliser usage
Agriculture livestock production costs
Heat stress in animals Temperature fluctuation
Bore well irrigation
Ground water depletionHorticulture
Crop yield
Irregular rainfall
Prolonged dry spells
Household income
Loans
Human and animal health
problems
Market-driven crop and dairy
production
Cost for crossbred dairy
production
Step 4: A sensitivity analysis of the main resources
This step involves running a sensitivity analysis of the livelihood recourses that are essential to cope with climate risks identified in the area using a scale 1–5. The sensitivity analysis is done at two levels:
1) At watershed level or sub-system/production system level (sector specific)
2) At household level for vulnerable groups identified

47
CoDr
iVE-
PD –
A H
andb
ook
For ranking the livelihood resources that are classified under respective capitals in C.No. 17 the Capital-based Resilience Scale is used to grade capitals based on their adequacy where 1 = nil (0-10%), 2 = minimum (11-25%), 3 = low (26-45%), 4 = adequate (46-70%), 5 = high (71% and above). For example, in any village if water resources in the form of open wells under physical capital are non-operational, then the grade will be either 1 or 2, depending on the degree of functionality/adequacy.
Table E: Level of analysis: At watershed level or sub-system/production system level (sector specific)
Note: Add rows as per list of livelihood resources identified under each capital. The same table is to be used for both levels of analysis. Please also note that this analysis needs to be repeated for all vulnerable groups separately.
Level of Analysis
Classify resources identified in C.No:15 of step 2 into 5 livelihood capitals
1 2 3 4 5 Which of the resources in C.No 17 are highly sensitive to climate hazards but essential to cope?
Quote reasons why? for each
C.No:16 C.No:17 C.No :18 C.No:19
Financial Capital : 1. 2.Human Capital:1.2.Natural Capital :1.2.Physical Capital :1.2.Social Capital : 1.2.
Step 5: Arriving at the vulnerability code
In step 4 the livelihood resources that are highly sensitive to climate hazards but essential to cope with climate risks in the area have been identified and graded. To arrive at a conclusion, in step 5 these resources again need to be graded on a scale of 1–5 using the Capital-based Resilience Scale where: 1 = nil (0-10%), 2 = minimum (11-25%), 3 = low (26-45%), 4 = adequate (46-70%), 5 = high (71% and above) which will indicate the vulnerability ; ie if these resources are adequate or high say at 4 and 5 the system under study has more resilience and hence is less vulnerable. For further clarity, vulnerability colour coding index for indicating vulnerability based on capitals can also be used simultaneously where:
Red – Danger (1), Orange – Risk (2), Yellow – Alert (3), Blue – Stable (4), Green – Safe (5).

48
Note: This grading on a scale of 1 to 5 needs to be determined by investigation based on situation/availability/functionality/adequacy of list of main resources identified. This can be further strengthened by using secondary qualitative and quantitative data. For coding at village level and sub-system or household level, use data of C.No: 18 and 19 of the table.
Table F: Generating the code
Level of Analysis Financial 1–5
Human1–5
Natural1–5
Physical 1–5
Social 1–5
Required interventions to reduce vulnerability (optional)
C.No: 20 C.No: 21 C.No: 22 C.No: 23 C.No: 24Watershed/Village(list indications under each capital)Code Colour index Sub- system/production system CodeColor Index Vulnerable group Financial
1–5Human1–5
Natural 1–5
Physical 1–5
Social 1–5
Required interventions to reduce vulnerability (optional)
C.No: 20 C.No: 21 C.No: 22 C.No: 23 C.No: 241. Small farmer CodeColour index 2. Landless CodeColour index
Illustrated Example: Capital based vulnerability code at village level is:
Financial Capital Human Capital Natural Capital Physical Capital Social Capital
Recent project with village fund for watershed development is available.
Village Organisations are strong and have funds.
Human capital with respect to climate-sensitive livelihoods is low: most of the knowledge is increasing maladaptation, with climate change increasing the risk, CBOs like the VOs and watershed committee have funds, but have no knowledge of climate adaptive strategies to use the fund effectively; currently the fund is being used/allocated for more maladaptive livelihoods which will further increase vulnerability to climate variability.
No forest lands.
Minimal availability of common property resources.
Low in local biodiversity.
Ground water scarcity very high.
Natural water bodies decreasing/drying up.
Degrading cultivable lands (problems of soil fertility, salinity, etc.).
Physical capital with respect to education, transportation, and institutions is adequate
However, physical capital with respect to climate sensitive livelihoods is very low.
Seed banks and agricultural warehouses are located very far away.
There are large numbers of bore wells but no recharge structures.
No farmers clubs/cooperatives.
No labour associations.
Watershed committees formed but weak; high political problems.
VOs are formed but are dominated by the richer class.
4 1 2 2 3
Stable Danger Risk Risk Alert

Ecosystems and Vulnerability:A Drylands Perspective
SECTION 5

50

51
CoDr
iVE-
PD –
A H
andb
ook
A Drylands PerspectiveUnderstanding biophysical vulnerability is crucial for project planning, selection of suitable interventions, and implementation; especially in the context of climate change, as ecosystems have certain characteristics and threshold limits. If these limits and characteristics are not understood or considered while developing project plans and interventions, it will result in unintended consequences over time. It may also result in shifting the state of the system into a phase which is irreversible.
Characteristics of DrylandsDrylands are generally defined in climatic terms as lands with limited annual rainfall, between 100–600 mm, which is highly erratic, and its spread and levels inconsistent. The length of the growing period, when both water and temperature permit crop growth, is 1–179 days (FAO, 2007a). Drylands range from hyper-arid, arid, and semi-arid to dry sub-humid areas, with vegetation ranging from desert to grassland to woodland. In arid regions the extreme scarcity of water hinders growth and development of plant and animal life. Semi-arid tropics have mean annual temperatures of over 18°C and a mixed climate in which a fairly moist or rainy season alternates with a completely dry spell. The amount and number of days of rainfall are erratic, and most of the precious rainwater is lost as runoff. The water scarcity is compounded
Ecosystems and VulnerabilitySECTION 5

52
by evaporation due to high temperatures. The regions are also beset by frequent long periods of drought. The key livelihoods are rain-fed agriculture, livestock rearing, and non-farm activities related to these livelihoods.
Drylands in IndiaIndia is 69 percent drylands – arid, semi-arid, and dry sub-humid. These are heavily populated areas, making the inhabitants particularly vulnerable to environmental stress and impacts to livelihoods. Most of the drought-prone districts are concentrated in Andhra Pradesh, Maharashtra, Tamil Nadu, Karnataka, and Rajasthan, affecting 265 million people in the rural areas. Low and erratic rainfall,
Drylands of India

53
CoDr
iVE-
PD –
A H
andb
ook
extremes of temperature, and intense solar radiation make these the most vulnerable regions in India. Suitability and potential yields of crops are determined by rainfall patterns, length of growing period, constraints due to physical condition of soil, and its plant-available water capacity.
Climate variability has been, and continues to be, the principal source of fluctuations in conventional food production, particularly in the semi-arid tropics. And the failure of one mono-cropped, high-yielding hybrid crop can destroy a farmer and push him into debt. This has been evident in the many farmer suicides in central India where recovery from crop failures has been impossible.
The constraints for livelihoods in drylands are broadly grouped into: Climatic constraints: highly erratic rainfall, aberrations in monsoon behaviour,
prolonged dry spells, high atmospheric temperature, low relative humidity, hot dry winds, and increased potential evapotranspiration (PET) due to high atmospheric water demand.
Soil related constraints: inadequate soil moisture content, poor organic matter content, poor soil fertility, soil deterioration due to erosion, soil crust problems.
Lack of suitable crop varieties for dryland farming and injudicious use of water for irrigation.
Socio-economic constraints: poor access to inputs, non-availability of credit, low adaptive capacity.
Climate Change Projections for Drylands in IndiaDrylands in India must inevitably feel the impacts of climate change. Projections show erratic rainfall, rise in surface temperatures by 3.5–5°C by the end of the century, decrease in precipitation by 5–25 percent, especially in drought-prone central India. Droughts will be more severe, and episodes of extreme precipitation will increase in frequency and intensity, concentrated over fewer days. The result will be increased frequency of floods during the monsoon.
To address these many aspects of exposure to climate change, and design measures that will give communities and systems the capacity and resilience to cope and adapt, and where possible take advantage of new opportunities, it is essential to get a clear picture of their vulnerabilities. The following chapter describes the concepts that underpin CoDriVE-PD’s framework, and Section 4 describes and explains the conceptual and strategic framework of CoDriVE-PD, its methods and the components and steps involved, and its use and applications with examples.
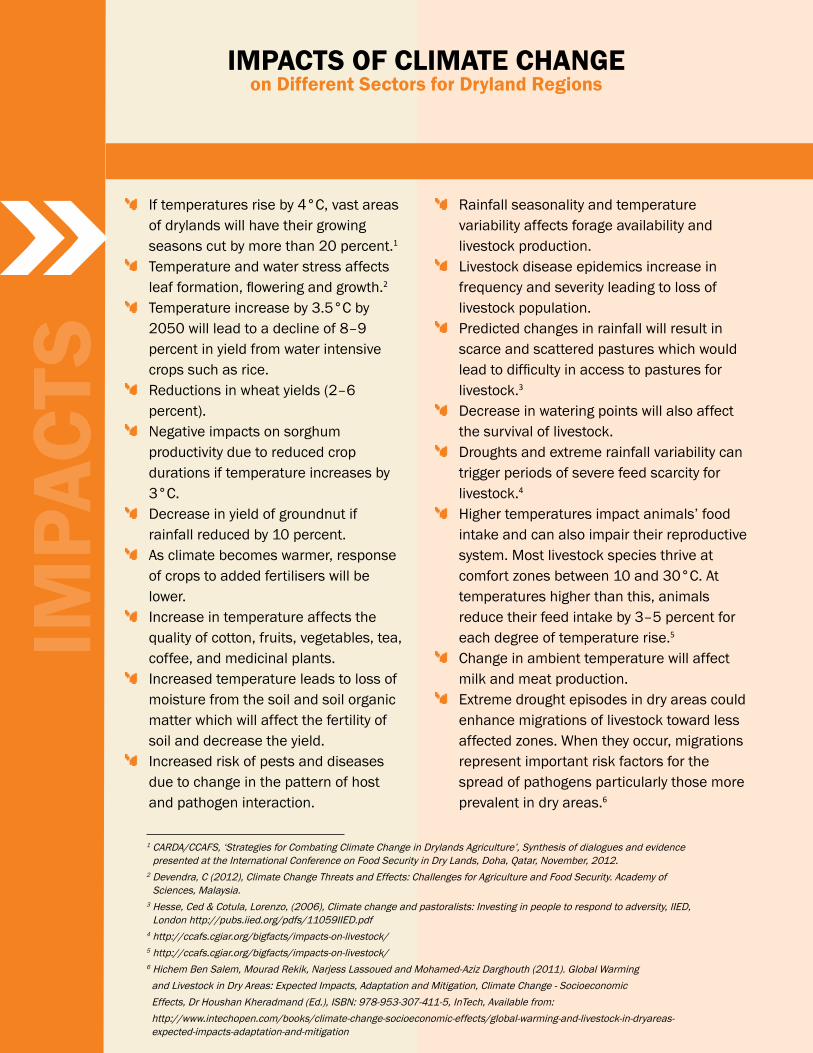
54
IMPACTS OF CLIMATE CHANGE on Different Sectors for Dryland Regions
AGRICULTURE
If temperatures rise by 4°C, vast areas of drylands will have their growing seasons cut by more than 20 percent.1
Temperature and water stress affects leaf formation, flowering and growth.2
Temperature increase by 3.5°C by 2050 will lead to a decline of 8–9 percent in yield from water intensive crops such as rice.
Reductions in wheat yields (2–6 percent).
Negative impacts on sorghum productivity due to reduced crop durations if temperature increases by 3°C.
Decrease in yield of groundnut if rainfall reduced by 10 percent.
As climate becomes warmer, response of crops to added fertilisers will be lower.
Increase in temperature affects the quality of cotton, fruits, vegetables, tea, coffee, and medicinal plants.
Increased temperature leads to loss of moisture from the soil and soil organic matter which will affect the fertility of soil and decrease the yield.
Increased risk of pests and diseases due to change in the pattern of host and pathogen interaction.
Rainfall seasonality and temperature variability affects forage availability and livestock production.
Livestock disease epidemics increase in frequency and severity leading to loss of livestock population.
Predicted changes in rainfall will result in scarce and scattered pastures which would lead to difficulty in access to pastures for livestock.3
Decrease in watering points will also affect the survival of livestock.
Droughts and extreme rainfall variability can trigger periods of severe feed scarcity for livestock.4
Higher temperatures impact animals’ food intake and can also impair their reproductive system. Most livestock species thrive at comfort zones between 10 and 30°C. At temperatures higher than this, animals reduce their feed intake by 3–5 percent for each degree of temperature rise.5
Change in ambient temperature will affect milk and meat production.
Extreme drought episodes in dry areas could enhance migrations of livestock toward less affected zones. When they occur, migrations represent important risk factors for the spread of pathogens particularly those more prevalent in dry areas.6
IMPA
CTS
LIVESTOCK
1 CARDA/CCAFS, ‘Strategies for Combating Climate Change in Drylands Agriculture’, Synthesis of dialogues and evidence presented at the International Conference on Food Security in Dry Lands, Doha, Qatar, November, 2012.
2 Devendra, C (2012), Climate Change Threats and Effects: Challenges for Agriculture and Food Security. Academy of Sciences, Malaysia.
3 Hesse, Ced & Cotula, Lorenzo, (2006), Climate change and pastoralists: Investing in people to respond to adversity, IIED, London http://pubs.iied.org/pdfs/11059IIED.pdf
4 http://ccafs.cgiar.org/bigfacts/impacts-on-livestock/5 http://ccafs.cgiar.org/bigfacts/impacts-on-livestock/6 Hichem Ben Salem, Mourad Rekik, Narjess Lassoued and Mohamed-Aziz Darghouth (2011). Global Warming and Livestock in Dry Areas: Expected Impacts, Adaptation and Mitigation, Climate Change - Socioeconomic Effects, Dr Houshan Kheradmand (Ed.), ISBN: 978-953-307-411-5, InTech, Available from: http://www.intechopen.com/books/climate-change-socioeconomic-effects/global-warming-and-livestock-in-dryareas-
expected-impacts-adaptation-and-mitigation

55
CoDr
iVE-
PD –
A H
andb
ook
Decline in surface water availability due to increased variability of precipitation.
Salinisation: increasing salinity of salt lakes due to diversion of water from their inflows for irrigation and other uses. Excessive clearance of natural and deep-rooted vegetation from catchments and discharge of saline agricultural wastewater causes salinity of water resources. Also, increasing salinity of groundwater.7
Runoffs and groundwater recharge would decrease with increase in temperature and decrease in rainfall.
Increased incidence and duration of droughts.
Decrease in per capita water availability as a result of decreased water availability combined with increased population.
Increased temporal variability of rainfall will lead to greater soil crusting and soil degradation, so that overland flow increases and groundwater recharge decreases.8
Decrease in water availability will affect livelihoods and also navigation, power generation, etc.
Increased temperature and decreased precipitation in these regions will cause a manifold increase in potential evapotranspiration (PET), leading to severe water stress conditions.
Reduction in forest area due to loss of vegetation
Drylands carry a sizeable representation of trees and shrubs in vegetative cover; changes in climatic conditions would affect their productivity and ability to supply goods and services.9
Enhanced global warming would increase the frequency of forest fires.
Temperature increase would have negative impacts on vegetation, plants with surface root systems which utilise mostly precipitation moisture will be vulnerable.
Changes in climatic conditions may lead to loss of species and thus affect the biodiversity of the region.
Considerable shifts in vegetative cover are likely to occur and this shift would affect the livelihoods of the people.
Increase in respiratory and cardiovascular diseases in drylands expected as a result of global warming.
Temperature and rainfall changes will expand vector-borne disease ranges.10
Rise in summer temperatures leads to longer duration of heat waves leading to increase in the incidence of heat strokes and cardiovascular, cerebrovascular, and respiratory disorders.
Decreases in water availability and food production (especially if there is a shortage of water for irrigation) would lead to indirect impacts on human health associated with nutritional and hygiene issues.11
WATER RESOURCES FORESTS HEALTH
7 Williams, W. D. (1999), Salinisation: A major threat to water resources in the arid and semi-arid regions of the world. Lakes & Reservoirs: Research & Management, 4: 85–91
8 Calow, R, Bonsor, H, Jones, L, O’Meally, S, MacDonald, A, & Kaur, N. (2011), Climate change, water resources and WASH A scoping study, Oversear Development Institute, London. http://www.odi.org.uk/sites/odi.org.uk/files/odi-assets/publications-opinion-files/7322.pdf
9 Sivakumar, M.V.K., Das, H.P. & Brunini O., (2005), IMPACTS OF PRESENT AND FUTURE CLIMATE VARIABILITY AND CHANGE ON AGRICULTURE AND FORESTRY IN THE ARID AND SEMI-ARID TROPICS,Climatic Change,70:31-72 http://dev.thegncs.org/sitefiles/file/Tropical_Agriculture_Sivakumar_2005.pdf
10 Huq, S, RAhman, A, Konate, M, Sokona, Y, & Reid, H. (2003), MAINSTREAMING ADAPTATION TO CLIMATE CHANGE IN LEAST DEVELOPED COUNTRIES(LDCS),IIED,Nottingham. http://www.pacificdisaster.net/pdnadmin/data/original/IIED_2003_Mainstreaming_adaption.pdf
11 http://www.ipcc.ch/ipccreports/sres/regional/index.php?idp=154

56
Drylands of Indian States: Climate, Ecology, and Agriculture
Andhra Pradesh
Karnataka
Maharashtra
Rajasthan
Gujarat
Bihar
Jharkhand
Arunachal Pradesh
Assam
Meghalaya
garh
WestBengal
Delhi
Jammu & Kashmir
Uttaranchal
Uttar Pradesh
Madhya Pradesh
Tamil Nadu
State/Union TerritoryGujarat
Ecosystem TypeArid/Semi-arid/Coastal
Percentage Arid/Semi-arid Area20/13
Agro-climatic Regionsa) Gujarat Plains and Hills
Region
Agro-ecological Regionsa) Western Plain, Kutch and
part of Kathiawar Peninsulab) Northern Plain and Central
Highlands including Aravallis
c) Central (Malwa) Highlands, Gujarat Plains and Kathiawar Peninsula
d) Western Ghats and Coastal Plain
State/Union TerritoryAndhra Pradesh
Ecosystem TypeArid/Semi arid/Coastal
Percentage Arid/Semi-arid Area7/15
Agro-climatic Regionsa) Southern Plateau and Hills Regionb) East Coast Plains and Hills region
Agro-ecological Regionsa) Deccan Plateau (arid)b) Deccan Plateau (semi-arid)c) Deccan Plateau and Eastern Ghatsd) East Coast Plain
State/Union TerritoryMadhya Pradesh
Ecosystem TypeSemi-arid/Sub-humid
Percentage Arid/Semi-arid Area-/6
Agro-climatic Regionsa) Eastern Plateau and Hills
Region
b) Central Plateau and Hills Regionc) Western Plateau and Hills Region
Agro-ecological Regionsa) Northern Plain and Central Highlands
including Aravallisb) Central (Malwa) Highlands, Gujarat Plains
and Kathiawar Peninsulac) Deccan Plateau (semi-arid)d) Central Highlands (Malwa, Bundelkhand
and Eastern Satpura)e) Eastern Plateau (Chattisgarh)f) Eastern (Chhota Nagpur) Plateau and
Eastern Ghats
State/Union TerritoryMaharashtra
Ecosystem TypeSemi-arid/Sub-humid/Coastal
Percentage Arid/Semi-arid Area0.4/19
Agro-climatic Regionsa) Eastern Plateau and Hills
Regionb) Western Plateau and Hills
Regionc) West Coast Plains and
Ghat Region
Agro-ecological Regionsa) Deccan Plateau (semi-arid)b) Central Highlands (Malwa,
Bundelkhand and Eastern Satpura)
c) Eastern (Chota Nagpur) Plateau and Eastern Ghats
d) Western Ghats and Coastal Plain
State/Union TerritoryKarnataka
Ecosystem TypeArid/Semi-arid
Percentage Arid/Semi-arid Area3/15
Agro-climatic Regionsa) Southern Plateau and Hills Regionb) West Coast Plains and Ghats Region
Agro-ecological Regionsa) Deccan Plateau (arid )b) Deccan Plateau (semi-arid )c) Eastern Ghats, Tamil Nadu Uplands and
Deccan (Karnataka) Plateau
State/Union TerritoryTamil Nadu
Ecosystem TypeSemi-arid/Coastal
Percentage Arid/Semi-arid Area-/10
Agro-climatic Regionsa) Southern Plateau and Hills Regionb) East Coast Plains and Hills Regionc) West Coast Plains and Ghats Region
Agro-ecological Regionsa) Eastern Ghats,Tamil Nadu Uplands and
Deccan (Karnataka) Plateaub) Eastern Coastal Plain
Agro-climatic Regionsa) Trans-Gangetic Plainb) Central Plateau and Hills Regionc) Western Dry Region
Agro-ecological Regionsa) Western Plain, Kutch and part of Kathiawar
Peninsulab) Northern Plain and Central Highlands including
Aravallis
State/Union TerritoryRajasthan
Ecosystem TypeArid/Semi-arid
Percentage Arid/Semi-arid Area61/13

57
CoDr
iVE-
PD –
A H
andb
ook
Hot arid eco-region with red and black soils
3. Deccan Plateau: hot arid ecosystem with mixed red and black soils
Ananthapur 400–500
(1800–1900)
< 90 Red (loamy) soils, slightly acidic and non-calcareous; and deep, clayey black soils that are slightly alkaline and calcareous in nature
Groundnut, sorghum, seteria, rice, cotton, coriander, pearl millet, red gram, horse gram, finger millet
High runoff and erosion Prolonged dry spells Low soil moisture content Subsoil sodicity affects soil
structure, drainage, and oxygen availability
High subsoil density in red loamy soil limits root depth
Hot semi-arid eco-region with red and black soils
7.1 Deccan (Telangana) Eastern Ghat Plateau: hot semi-arid ecosystem with mixed red and black soils
Cuddapah, Kurnool 700–750
(1800–1900)
90–120
Moderately to gently sloping.
Black soils are clayey, calcareous, and strongly alkaline. Red soils are non-calcareous and neutral in reaction.
Groundnut, sorghum, seteria, rice, cotton, coriander, pearl millet, rice, red gram, finger millet, horse gram
High runoff leading to soil and nutrient loss
Injudicious use of irrigation water and imperfect drainage conditions result in high ground water table
Deficiency of N, P and Zn in soils
Frequent droughts7.2 Deccan (Telangana) Plateau: hot semi-arid ecosystem with mixed red and black soils
Karimnagar,Rangareddi Hyderabad,Warangal, Khammam,Mahboobnagar,Nalgonda,Sangareddi, Medak
700–1000
(1600–1800)
120–150
7.3 Eastern Ghats: hot, moist semi-arid–dry sub-humid ecosystem with mixed red and black soils
Western parts (highlands) of Eluru(western Godavari and Krishna),Machillipatnam, Guntur and Ongole (Prakasam), and Nellore (northeastern parts)
800–1000
(1500–1800)
150–180
Hot semi-arid eco-region with red loamy soils
8.3 Eastern Ghats (Tamil Nadu Uplands): hot semi-arid ecosystem with red loamy soils
Chittoor 550–1000
(1400–1600)
120–150 Generally deep and loamy; neutral in reaction, have moderate clay, and low organic carbon content.
Rice, red gram, groundnut, pearl millet, finger millet, horse gram, sorghum
Injudicious use of irrigation water leads to water-logging and salinity hazards.
Andhra Pradesh
SOIL CROP CONSTRAINTS
AGRO-ECOLOGICAL ZONES
AGRO-ECOLOGICAL SUBZONES DISTRICTS LGP
RAINFALL (MM)
PET (MM)
Source: Gajbhiye, K.S. & Mandal, C. (2008), Agro-ecological Zone, their Soil Resources and Cropping Systems, National Bureau of Soil Survey and Land Use Planning Nagpur. Accessed at: http://agricoop.nic.in/farm%20mech.%20pdf/05024-01.pdf

58
Hot arid eco-region with desert and saline soils
2.2 Kutch Peninsula, hot arid ecosystem with saline and alkali soil
Lakhpat, Banni, Great Rann of Kutch
<300
(1800–1900)
<60 Sandy soils; moderately calcareous, and alkaline in reaction
Rice, wheat, gram, pearl millet, sorghum, maize, pigeonpea, groundnut, sesamum, castor, cotton, rapeseed, mustard, barley
Erratic and scanty rainfall leading to water deficit
Soil salinity
Acute drought conditions at the time of grain formation
Nutrient imbalance, especially lack of N, P, Zn and Fe
2.3 Western Plain (Rajasthan Bagar, Punjab and Haryana Plains), hot arid ecosystem with desert soils
Banaskantha <300–450
(1800–1900)
60–90
Kutch and Kathiawar Peninsula, hot arid ecosystem with saline-alkali soils
Bhuj, including Rapar, Adesar, Anjar, and Kandla talukas, northern Jamnagar
400–500
(1800–1900)
60–90
Hot semi-arid eco-region with alluvium-derived soils
Gujarat Plain (Aravalli range, East Rajasthan Upland and West Gujarat Plain): hot semi-arid ecosystem with grey-brown and alluvium-derived soils
Sabarkantha
(Himatnagar),
Mehsana, Ahmedabad,
Surendra nagar, part of Bhuj (Radhanpur)
500–850
(1400–1700)
90–120 Moderately to gently sloping;
coarse to fine loamy
Rice, wheat, gram, pearl millet, sorghum, maize, kodra, ragi, pigeonpea, groundnut, sesamum, castor, cotton, sugarcane, chillies, chickpea, tobacco, potato, rapeseed, mustard,
Coarser soil texture and low plant-available water capacity
Over-exploitation of ground water table
Imperfect drainage leading to surface and subsurface soil salinity and/or sodicity
Hot semi-arid eco-region with medium and deep black soils
5.1 Kathiawar Peninsula: hot semi-arid ecosystem with deep black soils
Northern part of Junagadh, Amreli, Rajkot, and western Bhavnagar
600–700
(1700–2000)
90–120 Gently to very gently sloping; deep, loamy to clayey
Pearl millet, sorghum, groundnut, sesamum, castor, cotton, pulses
Intermittent dry spell periods
Imperfect drainage limits optimum root ramification and oxygen availability in low lying areas
Salinity and alkalinity hazards from irrigated agriculture
Severe salinity and seasonal inundation by sea water
5.2 Central Highlands (Madhya Bharat Plateau, West Malwa Plateau, East Gujarat Plain, Vindhyan Range, Narmada Valley (Satpura Range): hot semi-arid ecosystem with deep black soils
Panch Mahal (Godhra), Kheda, Vadodara, Bharuch, northern Surat
500–800
(1800–1900)
120–150
SOIL CROP CONSTRAINTS
AGRO-ECOLOGICAL ZONES
AGRO-ECOLOGICAL SUBZONES DISTRICTS LGP
RAINFALL (MM)
PET (MM)
Gujarat

59
CoDr
iVE-
PD –
A H
andb
ook
Hot arid eco-region with red and black soils
3. Deccan (Karnataka) Plateau: hot arid ecosystem with mixed red and black soils
Bellary and southern Raichur, Bijapur, northern Chitradurga, and Tumkur
400–500
(1800–1900)
60–90 Gently sloping,
shallow and medium red loamy; and
level to very gently sloping, deep, clayey black soils.
Red soils are slightly acidic and non-calcareous.
Jowar, gram, tur, other pulses, small millets, bajra, groundnut and other oilseeds, cotton, paddy, wheat, ragi, sugarcane, maize, plantain
High runoff and erosion
Prolonged dry spells
Low soil moisture content
Subsoil sodicity affects soil structure, and, drainage, and oxygen availability
High subsoil density in red loamy soil limits root depth
Hot semi-arid eco-region with shallow and medium black soils
6.1 Deccan (western Maharashtra) Plateau: hot semi-arid ecosystem with medium black soils, and inclusions of deep black soils
Bijapur (northern part), Raichur and Dharwad (eastern part)
600–750
(1500–1800)
90–120 Moderately to gently sloping; shallow, loamy, skeletal and highly calcareous; or clayey, calcareous and moderately alkaline
Jowar, pulses, groundnut, cotton, paddy, ragi, sugarcane, fodder, small millets, wheat, horticultural crops
Prolonged dry spells
High runoff during stormy cloudbursts in rainy season leads to heavy soil loss
Deficiency of N, P and Zn
6.4 Deccan (western Maharashtra and Karnataka) Plateau, hot dry sub-humid ecosystem with shallow black soils
Belgam, Dharwar, Eastern part of Uttar Kannad (Karwar), Gadag
1100–1200 (1600–1700)
150–180
Hot semi-arid eco-region with red loamy soils
Deccan (Karnataka) Plateau, hot semi-arid ecosystem with red loamy soils
Eastern Shimoga and Chikmangalur, Hassan, Mysore, Mandya, Bangalore, southern Chitradurga, Kolar, Tumkur
600–900
(1600–1800)
120–150 Moderate to gently sloping, grading to gently to very gently sloping;
low in cation exchange capacity
Pulses, small millets, bajra, groundnut, paddy, ragi, maize, soybean, potato, fodder crops, mulberry, and horticultural crops
High runoff leading to soil erosion
Coarse soil texture and low to medium plant available water capacity (PAWC)
Nutrient imbalance from deficiency of N, P and Zn
SOIL CROP CONSTRAINTS
AGRO-ECOLOGICAL ZONES
AGRO-ECOLOGICAL SUBZONES DISTRICTS LGP
RAINFALL (MM)
PET (MM)
Karnataka

60
Hot semi-arid eco-region with red loamy soil
8.1 Eastern Ghats (Tamil Nadu Uplands and southeastern Sahyadris): hot semi-arid ecosystem with mixed red and black soils
Coimbatore, Anna (Dindigul), Madurai, Kamrajar (Virudunagar), Tirunelveli, non-coastal Kanyakumari
800–1100
(1500–1800)
120–150 Moderate to gently sloping, grading to gently to very gently sloping;
low in cation exchange capacity
Sorghum, groundnut, rice, pulses, millets, cumbu (pearl millet), sugarcane, cotton, ragi, black gram, green gram, sesamum,sunflower, red gram, turmeric, maize, banana, castor, onion, tobacco, vegetables, spices and plantation crops, tuber crops, flowers, and others
High runoff leading to soil erosion
Coarse soil texture and low to medium plant available water capacity (PAWC)
Nutrient imbalance from deficiency of N, P and Zn
8.3 Eastern Ghats (Tamil Nadu Uplands): hot semi-arid ecosystem with red loamy soils
North Arcot (Vellore), Dharmapuri, Salem, Arcot (Cuddalore), Chengalpattu (Kanchipuram), Periyar (Erode), Tiruchhirapalii,
Pudukottai, Titicorin (non-coastal plains and uplands)
550–1000
(1400–1600)
120–150
SOIL CROP CONSTRAINTS
AGRO-ECOLOGICAL ZONES
AGRO-ECOLOGICAL SUBZONES DISTRICTS LGP
RAINFALL (MM)
PET (MM)
Tamil Nadu

61
CoDr
iVE-
PD –
A H
andb
ook
Hot arid eco-region with desert and saline soils
2.1 Western Plain: hot arid ecosystem with desert soils
Bikaner, Jaisalmer, Barmer, half of Jodhpur, Ganganagar
100–300
(1700–2000)
<60 Sandy soils, moderately calcareous, alkaline in reaction
Wheat, cotton, gram, bajra, rice
Erratic and scanty rainfall leading to water deficit
Soil salinity
Acute drought conditions at the time of grain formation
Nutrient imbalance, especially lack of N, P, Zn and Fe
2.3 Western Plain (Rajasthan Bagar, Punjab and Haryana Plains): hot arid ecosystem with desert soils
Churu, Jhunjhunu, Sirohi, Jalore, eastern half of Jodhpur and Ganganagar
<300–450
(1800–1900)
60–90
Hot semi-arid eco-region with alluvium-derived soils
4.1 Northern (Punjab) Plain, (Ganga-Yamuna Doab and East Rajasthan Upland): hot semi-arid ecosystem with alluvium-derived soils
Alwar, Bharatpur, Jaipur, Sawai-Madhopur, Dhaulpur
600–800
(1400–1800)
90–120 Moderately to gently sloping;
coarse to fine loamy
Tomato, onion, brinjal, peas, cabbage and cauliflower, okra, cumin, chilli, fenugreek, coriander, fennel, melons, pomegranate, citrus, papaya, mango, ber
Coarser soil texture and low plant available water capacity
Over-exploitation of ground water table
Imperfect drainage leading to surface and subsurface soil salinity and/or sodicity
4.2 Gujarat Plain (Aravalli Range, East Rajasthan Uplands and West Gujarat Plain: hot semi-arid ecosystem with grey-brown and alluvium-derived soils
Ajmer, Tonk, Bhilwara, Udaipur, Dungarpur
500–850
(1400–1700)
90–120
Hot semi-arid eco-region with medium and deep black soil
5.2 Central Highlands (Madhya Bharat Plateau, West Malwa Plateau, East Gujarat Plain, Vindhyan Range, Narmada Valley, (Satpura Range): hot semi-arid ecosystem with deep black soils
Bundi, Chittorgarh, Banswara, Kota, Jhalawar
800–1000
(1500–1800)
120–150 Gently to very gently sloping;
deep, loamy to clayey
Wheat, rice, barley, maize, gram, black gram, pigeonpea, sugarcane, groundnut, sesame, linseed, cotton, chilli, garlic, onion
Intermittent dry spell periods
Imperfect drainage limits optimum root ramification and oxygen availability in low-lying areas
Salinity and alkalinity hazards from irrigated agriculture
Severe salinity and seasonal inundation by sea water
SOIL CROP CONSTRAINTS
AGRO-ECOLOGICAL ZONES
AGRO-ECOLOGICAL SUBZONES DISTRICTS LGP
RAINFALL (MM)
PET (MM)
Rajasthan

62
Hot semi-arid eco-region with shallow and medium black soils
6.1 Deccan (western Maharashtra), Plateau, hot semi-arid ecosystem with black soils medium with inclusions of deep black soils
Eastern half of Pune, Satara and Sangli, Solapur, Osmanabad, Bid, Ahmadnagar
600–750
(1500–1800)
90–120 Moderately to gently sloping; shallow, loamy skeletal and highly calcareous, or clayey, calcareous and moderately alkaline.
Ground nut, sugarcane, gram, spices, urad, safflower, tur, cotton, safflower, vegetables, and fruits
Prolonged dry spells
High runoff during stormy cloudbursts in rainy season leads to heavy soil loss
Deficiency of N, P and Zn
6.2 Deccan (western Maharashtra), Northern Karnataka Plateau): hot semi-arid ecosystem with shallow black soils with inclusions of deep and medium black soils
Dhule, Nashik, western Jalgaon, Aurangabad, northern hilly part of Ahmadnagar, Jalna, Parbhani, Nanded, Latur
700–1000
(1700–1900)
120–150
6.3 Deccan (northwest Maharashtra) Plateau: hot semi-arid ecosystem with deep black soils
Eastern Jabalpur, Buldhana, Akola, Amravati, Yavatmal
800–1100
(1600–1800)
120–150
6.4 Deccan (western Maharashtra and Karnataka) Plateau: hot dry sub-humid ecosystem with shallow black soils
Western parts of Pune, Satara, Sangli, eastern Kolhapur
(1600–1700)
1100–1200
150–180
Hot semi-arid eco-region with red and black soils
7.1 Deccan (Telangana and Eastern Ghats) Plateau: hot semi-arid ecosystem with mixed red and black soils
Satara and Sangli, Solapur, Osmanabad, Bid, Ahmadnagar
700–750
(1800–1900)
90–120 Moderately to gently sloping;
black soils are clayey, calcareous and strongly alkaline;
red soils are non-calcareous and neutral in reaction
Rice, ragi, jowar, kodra, other cereals, gram, groundnut, sugarcane, niger
High runoff leading to soil and nutrient loss
Injudicious use of irrigation water and imperfect drainage conditions result in high ground water table
Deficiency of N, P and Zn in soils
Frequent droughts
Hot sub-humid eco-region with red and black soils
10.2 Deccan (Satpura) Plateau: hot dry sub-humid ecosystem with deep black soils with inclusions of shallow and medium deep black soils
Wardha, Nagpur, parts of Jabalpur, Narsimpur
1000–1200
(1300–1500)
150–180 Largely medium, deep black soils are interspersed with patches of red soils: red soils generally occur on ridges and on pediment surfaces, and are shallow to moderately deep, clayey, neutral to slightly acidic in nature
Sorghum, tur, wheat, other pulses, oilseeds, cotton, paddy, ragi
Cracking clayey soils having low soil moisture content
Dry tillage and inter-tillage practices are difficult to perform
Risk of inundation and risk of drought due to prolonged dry spells
Soil loss due to runoff
SOIL CROP CONSTRAINTS
AGRO-ECOLOGICAL ZONES
AGRO-ECOLOGICAL SUBZONES DISTRICTS LGP
RAINFALL (MM)
PET (MM)
Maharashtra

Illustrated Case StudySECTION 6

64

65
CoDr
iVE-
PD –
A H
andb
ook
SECTION 6
The case study illustrates an example of Vulnerability Assessment of a village, obtained on applying the CoDriVE-PD. It includes a brief description of the study area and detailed analysis of changing scenarios with respect to the livelihood capitals.
The codes generated give a snapshot of the present situation. They are highly dynamic in nature, therefore subject to change when the tool is run to assess vulnerability at appropriate time intervals.
It presents some insights on the priority areas at two levels (village and HH) demarcated as risk or alert, which require immediate attention and need to be prioritised while designing the project or making decisions.
The study area, Chandradana (a micro-watershed with an area of 1700 ha ) is a representative case.
The results obtained can be extrapolated for development planning in the neighbouring 20–25 villages, covering an area of approximately 25,000 ha.
Illustrated Case Study

66
Vulnerability Assessment of Chandradana Village Thalakondapally Block, Mahboobnagar District, Andhra Pradesh
STEP 1: “What is happening to the environment and why?” Building a vulnerability context
Agriculture A) Past History (25–30 years ago): For the villagers1 of Chandradana the main source of living was rain-fed agriculture, with a system of mixed farming. Agriculture was limited to just the Kharif season (June–September), with a Rabi season (October–
1 Land holding categories: Landless Farmers – Zero land holding Small Marginal Farmers – Up to 2.5 acres rain-fed land holding Middle Farmers – 2.6 to 5 acres land with small portions of irrigated land Large Farmers – above 5 acres land holding and mostly irrigated land

67
CoDr
iVE-
PD –
A H
andb
ook
March) if rains had been good. According to the communities, less than 30 percent of the lands in the village were cultivated. The main agricultural crops were sorghum (jowar), castor, finger millet (ragi), other minor millets, and pulses. Local varieties of seeds were sown and yields were small when compared to yields from hybrid seeds used now. The farmers stated that they never used pesticides or excessive fertilisers as they did not need them; the soil was fertile and healthy. For agricultural inputs, the farmers depended on the government run agri-cooperative society in the block headquarters, which supplied chemical fertilisers to the farmers. Farmers shared that for maintaining soil productivity, livestock manure was used along with the leaves of Pongamia and Azadirachta indica (neem) trees, which acted as insecticides. To drive away pests people would burn goat manure in the fields before sowing, which it seems is a good insect repellent. The communities stated that they never depended on external markets for basic food needs such as millets, food grains and pulses, nor did they produce large quantities for sale.
B) Present Status: Over this 25-year period, 80 percent of the lands have been turned into cultivable agricultural lands, making agriculture the primary occupation. Of the total population, 72.8 percent of HHs have land, with agriculture as the primary source of livelihood, and 27 percent are landless. The landless communities along with small and marginal farmers have a higher percentage of skilled personnel and are involved in occupations other than agriculture, e.g. tailoring, welding, etc. Agriculture is not largely rain-fed anymore, with approximately 49 percent of the cultivable land currently irrigated by bore wells; 49 percent of land belongs to large farmers, 37 percent to middle category farmers and 14 percent belongs to small farmers. With respect to ownership of bore wells and electric pump sets, 40 percent are owned by large farmers, 45 percent are owned by middle group farmers and 14 percent are owned by small farmers.
The priority of crops has undergone tremendous change, with commercial crops taking the lead over food crops. Minor millets, local seed varieties of rice, jowar, and ragi are rarely cultivated except by a small percentage of HHs (mostly belonging to large and middle group farmers) for their own consumption. The main crops now are maize, sugarcane, cotton, rice, groundnut, sunflower; vegetables such as chillies and tomato; and green fodder (due to increasing demand from dairy farming). Cultivation of water-intensive fruits like watermelon, papaya and sweet lime, which are not native to the area, has also been adopted by farmers. The recent decade has seen a rapid increase in mango cultivation which significantly benefits the farmers. Baseline data reveals that 80 percent of the cultivable land is being used to produce these cash crops, with cotton at the top spot (43 percent), followed by maize (27 percent) and then groundnut (six percent). Among food crops paddy (rice) cultivation is at the top (20 percent), while a minimal five percent is given to vegetables, fruits, and millets and pulses. Excessive cultivation of paddy has led to increasing soil salinity in the

68
village. Farmers report that no other crop can grow on these soils, forcing them to repeatedly cultivate paddy. The seeds for all crops are hybrid. Local seed varieties are rarely available. Change in cropping pattern has increased the dependency on sub-surface water, resulting in ground water depletion. Rabi season crop failures are reported to have increased significantly due to unavailability of water.
In addition to the issues of water scarcity, the communities of Chandradana shared that agricultural input costs have been increasing consistently over the past 15 years. They are completely dependent on external markets for farm input supplies such as seed, fertiliser, and pesticides. Farmers say that increasing quantities of chemical fertilisers and pesticides have to be applied to get good yields from hybrid seeds. A major contributing factor is the significantly reduced availability of livestock manure due to falling numbers of indigenous cattle and goats. This in turn and over time has affected the soil health and quality, resulting in excessive weed growth. To control the weeds, considerable amounts of weedicides are being used, further adding to farm input costs while aggravating the deterioration of soil health and crop yields. Local indigenous systems of maintaining soil productivity and reducing crop-pest attacks is not practised anymore, as the local tree species have completely disappeared. Interactions with farmers in the field revealed that a key practice of soil preparation done during the month of May is not being adequately done due to recurring droughts, soil hardness, and high summer temperatures, leading to excessive weed and soil pest problems.
Lack of labour and the increasing daily wage rate have made both large and middle farmers opt for mechanisation, which increases production costs and destroys “farm bunding”, a critical measure that helps retain soil moisture, to allow tractors and harvesters to move around. This in turn has resulted in increased need for irrigation for the crops, further increasing the pressure on the ecosystem.
The awareness on availing crop insurance is also reported to be low. A mere 1.2 percent of farmers, all from the large farmer category, had insurance for their crops. All these factors have significantly increased the debts of farmers. The means to get out of the debt cycle are few or nil. For agricultural seed requirements the government seed bank owned by the state agriculture department that supplies seeds at subsidised rates to farmers is located at the block (Thalakondapally) which is five km away. The agriculture warehouse furthermore is located around 20 km from the village at another block (Amangal).
Livestock A) Past History (25–30 years ago): As the farming system was predominantly mixed farming, a prime component was the rearing of cattle for farm-animal production, coupled with small ruminants, and native poultry. This was found in every household. The preferred breed of cattle was the local chelka, a dual-purpose (non-descript)

69
CoDr
iVE-
PD –
A H
andb
ook
species. Livestock production was entirely a grazing-based system. The village had large tracts of land left uncultivated and there were more agriculture fallows, both of which were used as common grazing grounds.
Livestock products occupied a significant place in the daily diet of the communities. Bullocks played a critical role and were used for farming, transport, pumping water, manure, and fuel. Besides cattle, indigenous buffaloes and goats were kept by all households. Sheep were kept only by traditional sheep-rearing communities. Milk yields, as reported by communities, were around 3–5 litres/day for indigenous buffaloes and 1-3 litres/day for indigenous cows. As there was no market for milk it was consumed at home; however milk products were sold at local market.
B) Present Status: Presently only 47 percent HHs own livestock in the village. Surprisingly the landless category holds the least livestock (17 percent) followed by small farmers (38 percent). Livestock rearing is now predominantly a milk-based economy with crossbred cattle and Murrah buffaloes. There are three dairy cooperatives (one state-owned, two private dairies) functioning well in the village. The private dairies were established in 2007. There are five milk collection centres located within the village supplying milk to these three dairies.
During focus group discussions with the livestock farmers, it was found that presently less than 10 percent farmers still maintain the local chelka cattle. There are around 250 crossbred cattle in the village, predominantly Jersey and some Holstein-Friesian (HF), brought from the neighbouring Indian states of Karnataka and Maharashtra since 2000 through subsidy schemes. Over 100 cows were born in the village as crossbreds (through artificial insemination) during this period. On the performance of the crossbreds, farmers reported that the cost for maintaining crossbred cows, particularly the HF, is very high. The cows are very susceptible to diseases resulting in a huge drop in milk yields when the animals are sick. Besides this loss is the expense incurred for treatment and the cost of maintaining a sick (and unproductive) animal till it recovers. Additionally, in a warm climate, these cows are less productive. This may be the reason why HF cows are reared mainly by large farmers, while the rest prefer buffaloes and low-grade Jersey crossbred cows that are more suitable for the local area. Farmers reported that they are crossbreeding the local cattle, chelka, with Jersey cattle through artificial insemination, resulting in increased milk yield of the chelka by up to 5–6 litres/day.
Farmers with high-yielding milch cows shared that the availability of feed and green fodder is a huge problem. Discussions revealed that cultivation of green fodder has now become common, rather mandatory, which further adds to the water-intensive operations. Discussions revealed that paddy straw and groundnut crop residue are the main crop residues that farmers store for livestock. During the last drought year, the large farmers (20 HHs in particular) made considerable profits on the sale of

70
paddy straw; selling nearly 40 tractor-loads (approximately one tonne of straw per tractor) for an approximate total of Rs.2,80,000 (Rs.7000 per tractor-load of straw).
It was observed that despite the significant maize production, there is a huge fodder deficit. Most of the maize crop residue is left in the fields uncut as the cost of labour to harvest the stalks is too high. Farmers only pick the cobs. At times harvester machines are used.
Health-care for livestock is generally provided by the vets at the government veterinary clinic or by gopal mitras (para-vets) in the villages. Access/presence of private veterinarians is nil.
Significant reduction in native poultry and goats is also seen at HH level, reducing not only a key source of income but also food and nutrition at HH level.
Forest Resources/Biodiversity A) Past History (25–30 years ago: The village had no adjoining forest lands but there were large tracts of common lands which had several tree species such as Azadirachta indica (neem), Pongamia pinnata, Diospyros melanoxylon (tendu/thuniki leaf used for local cigars/beedi), Butea monosperma (moduga – used for making leaf plates), Madhuca indica (mahua), Tamarindus indica (tamarind), Acacia nilotica (thumma, for edible gum) and a few fodder tree species. With regard to food supplements, women shared that availability of fruit trees and tamarind contributed significantly to the food of the communities.
B) Present Status: With the expansion of agricultural activity, most of the trees species that once existed in the fallows and village common lands have been cut down. Currently only 26 percent of HHs have trees in their fields. This has resulted in the disappearance of a critical source of livelihood for many poor households, especially during the summer season, when no agriculture is possible and other sources of employment are unavailable. Migration for wage labour has become the next source of major income for the communities uniformly across three landholding categories: landless, poor/small marginal, and medium farmers in Chandradana.
Currently, cultivable waste land is down to approximately 50 acres, and grazing lands to practically nil. The records indicating the common property resources of the village could not be accessed in time from the local revenue department and need to be explored.
LivelihoodsA) Past History (25–30 years ago): In summer when agriculture was not possible, a predominant source of livelihood was the sale of neem seed, beedi leaf, tamarind, leaf plates, and other non-timber forest products.

71
CoDr
iVE-
PD –
A H
andb
ook
B) Present Status: Despite the differing land holdings, the sources of income are the same, i.e. agriculture, dairy farming, agriculture labour, and non-farm labour. Decrease in tree cover has resulted in the disappearance of a critical source of livelihood for many poor households, especially during the summer season when no agriculture is possible or other sources of employment available. At present, the villagers even need to buy tamarind as all the trees have been cut down. Reduction/loss of trees used as natural pesticides and for other farming needs have resulted in higher dependence on external sources for agriculture inputs, thus increasing investment costs.
In the village 98 percent of people have NREGA cards. Those who depend entirely on non-farm based livelihoods are involved for 100 days a year, while others who have agriculture as the primary occupation avail of 40-50 days’ work during the non-agricultural season. Migration for wage labour has become the next major source of income. In Chandradana, 38–50 percent of landless and small and marginal farmer categories migrate for about three to six months a year.
WaterA) Past History (25–30 years ago): There were many common water bodies such as small ponds, lakes, and irrigation tanks. Open wells were abundant – approximately 50. There were five common wells existent in the last ten years of the period. “Bunding” in the farms helped retain soil moisture, as did the trees.
B) Present Status: Chandradana is located in Veljal cluster, a mega watershed of 5000 ha, along with four other villages. The whole area has over 15 small irrigation tanks (both private and government), all in a dried-up condition. The village has three main water irrigation tanks that are privately owned and used for irrigation purposes. The farmers reported that these tanks have not filled up to their full capacity since the past 10 years and in the last five years have been completely dry.
Changes in cropping patterns have increased the dependency on ground water in both in Kharif and Rabi seasons, particularly in the past 15 years. This has resulted in severe ground water depletion, drying up of existing bore wells and huge water scarcity for both agriculture and drinking water since the past 10 years. Farmers shared that they have made enormous investments in digging new bore wells, with a very high failure rate reported particularly in the last five years. The ground water table has also depleted significantly, having lowered from 150 ft to 450 ft. All 55 open wells in the village which were fully functional have now dried up. Currently, village Chandradana is under the status of “over-exploited” (OE) according to the Andhra Pradesh Water, Land and Trees Act (APWALTA), where there is a ban on digging/deepening bore wells.
Fishery A) Past History (25–30 years ago): There were many common water bodies such a small ponds, lakes, and irrigation tanks. When seasonal rains were good, inland fishery was a good source of income for many.

72
B) Present Status: The fishery activities have completely stopped due to reduction in the common water resources in the village.
Non-farm Livelihoods A) Past History (25–30 years ago): Practically all craftsmen and services connected to agriculture and livestock, such as blacksmiths, potters, breeding services providers, wool shearers, blanket makers, traditional healers and many other such human resources were available within the village or nearby.
B) Present Status: Today, many of the above-mentioned services have almost disappeared in the village, and for most services the nearby town needs to be visited. With the decline of mixed farming, decimation of local flora and loss of natural water bodies, changed crops, coming in of mechanisation, many allied livelihoods have greatly reduced or are almost nil. Agriculture, dairy, wage labour – both farm and non-farm based – are the main sources of livelihood for a majority of the villagers now. In the context of livestock-based livelihoods, the significant reduction in native poultry, goats at HH level, and inland fishery has not only reduced a key source of income but also food and nutrition at HH level.
Food Security, Water (Drinking and Domestic) Availability, Health and Basic Infrastructure A) Past History (25–30 years ago): The diet was rich in animal protein from eggs, milk, curds, ghee, etc., eaten with millets grown locally. As stated by farmers, there was little disease, and generally people enjoyed good health. Drinking water was easily available, as there were many open wells. Human and livestock health was mainly taken care of by traditional healers in the village. Women’s health and childbirth were in the care of traditional midwives. The communities stated that they never depended on external markets for basic food products such as millets, food grains and pulses, nor did they produce large quantities for sale.
B) Present Status: With the priority given to water-intensive crops like cotton, paddy, fruits, and green fodder for milk production, the people are highly dependent on the external markets for food items like jowar, millets, and pulses. Rice now occupies the first place in the diet of the communities as a major staple food. Of the total consumption, 45 percent of rice is from their own land and the rest is accessed either from the Public Distribution System (PDS) outlets or from private shops. Following rice, 45 percent of the HHs consume jowar of which only six percent is from their fields, while 90 percent is purchased from the market. All HHs depend totally upon private outlets for pulses, except for red gram which is produced in small quantities in the village by many HHs. Most HHs do not have kitchen gardens. Trees commonly grown around the houses are coconut and neem, and that too in very minimal numbers. Heat strokes, deaths due to heat strokes, viral diseases, and incidents of dengue are reported to have increased significantly in the recent past.

73
CoDr
iVE-
PD –
A H
andb
ook
Water supply: Today the village is in a huge drinking water crisis. Of the six hand pumps that provide water to the village only three are currently functional. The villagers depend on public bore wells for their domestic water needs. Since the village ground water levels are lowering at a very rapid rate, in emergency situations or during the summer the Panchayat buys water from nearby towns and supplies it by tankers to the villagers. There is an increasing trend among HHs to purchase drinking water from private vendors and RO plant owners since the past four years.
Sanitation: Only 25 percent of HHs have a drainage line system while the rest of the village has open drains. Sixty percent HHs do not have proper toilet facilities. There are no public toilets in the village.
Current Social ScenarioGender-related work burdens: Burdens on women to run the household have increased tremendously in recent years. Apart from problems in the general tasks of water and fuel-wood collection due to the lack of water and trees in the village, other issues have emerged. Women shared that the maintenance of crossbred cows is a huge workload for them as it is a stall-feeding system. Recurring droughts and crop failures have led to taking up big loans, provoking men to turn to alcohol and other such vices. Records report that around four people, all men, in the village have committed suicide during the past one year due to debts. This in turn adds further burdens and more responsibility on women. Migration among male members of the HHs causes mental stress and risk of communicable diseases for both. Loans are often repaid by selling women’s jewellery, resulting in loss of assets. Only the large land-owning farmer category HHs have cooking gas connections.
Institutional memberships: Almost all women in the village belong to self-help groups (SHGs) under the government-run programme. There are about 40 WSHGs with varying degrees of functionality and capacity to access benefits from the various government schemes linked to them. The SHGs in the village hamlets comprised of scheduled castes (SC) and scheduled tribes (ST) populations were weaker and accessed fewer benefits as compared to the main village groups. The SHGs are also federated into bodies called Village Organisations (VOs) through which various government schemes and programmes operate. Chandradana currently has three VOs which are strong and fully functional.
With respect to membership in various village-level institutions (such as panchayats, cooperatives, youth clubs, etc.), 87 percent of HHs in the village have at least one family member with an institutional membership in village-level organisations. Institutional affiliation is highest among both middle and large landowning farmers (90 percent), followed by landless (84 percent) and small and marginal landowning farmers (78 percent).
74
Infrastructure and educational facilities: The village has an Anganwadi Centre, primary and high schools, and a post office. Banking, PHC and veterinary services, and Krishi Seva Kendra (Farmer Service Centre) are accessible within a radius of five km.
Key Drivers and Pressures (Sectoral Only): Why is this happening?
DriversThe real estate boom, political interference, and a few components of poverty alleviation development programmes and government schemes have been identified as key drivers of change, apart from the common drivers such as market demand, improved education, and agriculture subsidies, etc. These drivers and pressures are causing changes that induce maladaptive pathways or are acting as barriers for beneficial adaptation, increasing the vulnerability to climate change.
Real estate boom: The land value of many areas/villages within 100–200 km radius of Hyderabad’s International Airport has suddenly skyrocketed, so farmers with huge loans/debts are selling off their land to private parties. If the farm land has a good reliable water source the prices are even higher. This has resulted in many selling off their lands. They either become landless, migrating to nearby cities for jobs or are left with small land holdings that do not meet their subsistence needs. Farmers who earlier were landless are moving in to take lands on lease from the private parties for agriculture or as caretakers.
Government programmes: Some interventions of the government poverty alleviation programmes are identified as key drivers of change as they provide significant economic returns. However, despite the good intent of benefiting the poor, there are unintended consequences over time, going unnoticed. As most of these programmes are not suitable to the agro-ecological region, pressure on the already fragile ecosystem is being exacerbated manifold.
PressuresArising from this, some of the key pressures identified were:
Soil salinity and fodder deficit pressurises farmers to continuously grow rice, which is the only crop that can grow in saline soils as stated by them. The lack of fodder availability adds to choosing rice over other crops.
Labour shortage: Another pressure identified is the increased cost of employing farm labour. This leads to mechanisation which requires removal of farm “bunding”, which is essential for retaining soil moisture. The use of mechanised harvesters causes wastage of crop residue, a valuable source of fodder.

75
CoDr
iVE-
PD –
A H
andb
ook
What do you observe happening now? What are the main climate risks and trends? The average annual rainfall of Mahaboobnagar is 604 mm. After the 1960s, a significant deviation from average annual rainfall has been observed. Every 10–15 years, the district has experienced a deviation of approximately 40 percent (+/–). During this same period, 20 years can be identified as rainfall deficit years while 22 years experienced above average rainfall. While 1972 (410 mm) , 1984 (517 mm), 1985 (448 mm) and 2004 (422mm) were moderate drought years,2 1964, 1974, 1975, 1978, 1983, 1995, 1996, 1997, 2000, 2005, and 2007 experienced excess rainfall.3 The years 1978, 1995 and 2005 show more than 40 percent departure from normal with the downpour of 995 mm, 996 mm and 1052 mm respectively.
Mean maximum (33.4° Celsius) and mean minimum (21.6° Celsius) temperature in the district has shown an increasing trend during the last 50 years. A significant increase of about 0.5° Celsius is observed in both the mean minimum and maximum temperatures in the last three decades. A maximum increase of about 1.2° Celsius in the mean minimum temperature and 1.1° Celsius in the mean maximum temperature was observed in the year 1998.
State and Trends of Climate: People’s Perceptions, Impacts and Adaptation Responses (Step 1, Table B) Keeping in mind the climate trends at district level, this section details the type of climate risk and its impacts felt by communities at the block level, as described by the local inhabitants. It also captures the perceptions of communities on the climate risks in the region, impacts experienced, and the coping/adaptation responses they have taken to survive the situation.
The climate earlierCommunities said that 20–30 years earlier the impact of climate was fairly manageable in the sense the three different seasons were clearly distinguishable and so was the arrival of the monsoon. The temperature too was somewhat normal according to the season.
Climate risks/hazards identified from 2000 till dateThe major climate risks identified by the communities are given below. They observe that since 2000 there is an increasing trend of (i) irregular rainfall, with prolonged dry spells and (ii) unseasonal rainfall. More recently they noted (a) drought in 2011 and 2012 and (b) temperature fluctuations with very hot summers in some years (2009, 2010) and cool summers in others (2011, 2012).
2 Meterological Droughts classification by Indian Meteorological Department: Moderate Drought – 26 to 50 percent rainfall deficiency, Severe Drought – more than 50 percent rainfall deficiency
3 Percentage departure of realised rainfall from normal rainfall is + 20% or more (IMD)

76
Current Impacts - what are the consequences for the environment and humanity?
Drought Irregular rainfall Temperature fluctuations
Prolonged dry spells
Unseasonal rainfall
AgricultureWater shortage, ground water depletion.Reduction in crop yield.Increase in capital costs for farming (M).Soil temperature increases (W).Soil erosion (W).Increasing pest and weed problems.
LivestockReduction in livestock, especially of bullocks
ForestNo germination of tree species.Afforestation programmes failure.
HomeFinancial stresses at home (W).
AgricultureSeeds do not germinate. Reduced production of crops.Increased farming costs due to multiple sowing.Spoilage of stored grain due to improper storage structures.Fluctuation in mango yields.Crop pest problems.
LivestockDecrease in production of livestock products.Increased incidence of livestock disease.Fodder shortage. Spoilage of stored fodder as proper storage structures are not available.
HomeIncreasing loans.
AgricultureDecreased mango yields.Crop pest problems.
LivestockIncreased incidence of livestock diseases.Heat stress problems resulting in loss of milk production in crossbred cattle.
HomeIn humans, illness and deaths due to sun stroke.
AgricultureCrop loss – standing crops die. Water sources all drying up.
HomeIncreasing loans.
AgricultureDecreased yields in mango, particularly due to rains in December. Decreased yields in paddy, particularly if it rains before the harvest stage. Increased pest problems.
W: Women, M: Men
Step 2: Responses - what is being done and how effective is it?

77
CoDr
iVE-
PD –
A H
andb
ook
Adaptation responses to climate risks identified and impact felt
Efficiency and sustainability/effectiveness
Vulnerability of ecosystem
Vulnerability of communities
List of livelihood resources /strategies essential to coping
Multiple sowing with new seed varieties.
Not sustainable; not effective (sometimes seeds sown are not suitable to the existing biophysical conditions of the region).
Increases Increases Indigenous seed varieties, seed banks, better knowledge and application of crop contingency planning; locale specific agri-met advisories; local agri-knowledge service centres.
Use of tractors and other farm machinery.
Not sustainable; effective because of lack of labour force, but destroys farm bunds required to maintain soil moisture.
Increases Increases Labour, livestock, labour association, funds with VDC /CBOs; better understanding of medium- and long-term effectiveness, sustainability, and economic gains.
Increasing bore/tube wells.
Not effective; unsustainable.
Increases Increases Bore well recharge structures, soil and water conservation structures, revival natural water tanks, etc.
Distress migration for wage labour work.
Effective (temporarily); not sustainable.
Decreases temporarily
Decreases temporarily
Local non-farm livelihood options as second livelihood, local biodiversity (trees), CPR development, small stock rearing, improving agriculture skills that attract better wages.
Taking loans for agriculture inputs.
Effective (temporarily); not sustainable.
Increases Increases Farm-yard compost, local seed and grain (traditional) banks, crop storage houses, crop diversification, tree based farming, etc.

78
Adaptation responses to climate risks identified and impact felt
Efficiency and sustainability/effectiveness
Vulnerability of ecosystem
Vulnerability of communities
List of livelihood resources /strategies essential to coping
Government help/claimed loss from Government.
Effective (temporarily); not sustainable.
No impact Reduces temporarily
Local farmer knowledge and service centres
Growing crops based on market demand, e.g. rice cultivation.
Not effective; not sustainable.
Increases Reduces temporarily
Farmers cooperatives, addressing salinity, local farmer knowledge and service centres, crop diversification.
NREGA job cards, watershed projects.
Effective temporarily; not sustainable as people are engaged for a few days in a year.
Decreases Decreases (temporarily; unless interventions improve land productivity, e.g. WSD activities)
Alternative livelihoods and skill development; asset creation.
Selling of cattle. Effective (temporarily); not sustainable.
Both increases and decreases
Increases Fodder plots, livestock management systems, community chaff cutters, fodder storage units.
Selling of lands to private parties.
Not effective – assets reduced; not sustainable.
Increases increases Knowledge on good agriculture management and practices, crop diversification, tree-based farming.
Shifting to crossbred dairy farming.
Effective in short term; not sustainable.
Increases in the long run
Decreases temporarily
Indigenous breed development & management practices, regular health services (para-vets), heath camps.
Increased use of chemical fertilisers and pesticides to increase crop production.
Effective initially; unsustainable.
Temporarily decreases
Temporarily decreases
Knowledge of good agriculture practices, compost pits, indigenous livestock, mixed farming system.

79
CoDr
iVE-
PD –
A H
andb
ook
Adaptation responses to climate risks identified and impact felt
Efficiency and sustainability/effectiveness
Vulnerability of ecosystem
Vulnerability of communities
List of livelihood resources /strategies essential to coping
Leasing lands from private parties.
Effective temporarily. Sustainability uncertain and unpredictable.
Temporarily decreases
Temporarily decreases
Non-farm alternatives and skill-based livelihoods; while in use – crop diversification, small livestock.
Selling dairy cattle in summer and buying them back in the monsoon season.
Seems effective from ecosystem point of view but sustainability needs to be explored.
Decreases Immediately decreases at time of sale, increases at time of purchase.
Pasture land protection and management on an annual basis; a temporary method of giving them to other farmers/villages to tend, on a payment for services basis.
Step 3: What are the consequences for the environment and humanity? Generating a Systems Map for the big picture (current status)
Soil quality
Manure availibility
Grazing based livestock production
Fodder availibility
Droughts and man-made water
scarcity
Pest attacks
Pesticides usage
Migration
Labour costs
Chemical fertiliser usage
Agriculture livestock production costs
Heat stress in animals Temperature fluctuation
Bore well irrigation
Ground water depletionHorticulture
Crop yield
Irregular rainfall
Prolonged dry spell
Household income
Loans
Human and animal health
problems
Market driven crop and dairy
production
Cost for crossbred dairy
production

80
Step 4: Sensitivity Analysis of the Main Livelihood Resources
Level of Analysis: Watershed Level Based on the data elicited for both communities and secondary literature for the village of Chandradana, the main livelihood resources are classified under the capitals and graded based on functionality/availability in the following categories.
Capital-based Resilience Scale: 1 = nil (0-10%), 2 = minimum (11-25%), 3 = low (26-45%), 4 = adequate (46-70%), 5 = high (71% and above)
List resources under each capital 1 2 3 4 5 Notes on how sensitive/essential for coping are the resources
Natural Capitals
1. Local biodiversity (trees) 2 Local biodiversity (trees), water bodies, common property resources, and grazing lands are directly affected by climate risks. They are sensitive and are essential for coping.
2. Water tanks/bodies 2
3. Common property resources 1
4. Pasture/grazing lands 2
Physical Capitals
1. Watershed (soil & water conservation) structures 2 All are very essential for coping but are not directly affected by the climate risks that occur in the region.
2. Crop storage houses 1
3. Animal health service centre 2
4. Community chaff cutters 1
5. Farmer knowledge & service centres 1
6. Animal health camps/service delivery system 2
Social Capitals
1. Farmers federations/cooperatives 1 All get affected by climate risks indirectly.
2. Village Organisations (federations of SHGs) 4
3. Labour associations 1
Human Capitals
1. Para-vets 2 All get affected by climate risks indirectly.
2. Knowledge on crop diversification, tree-based farming, water efficient technology management, pasture land management skills, application of crop contingency planning; locale specific agri-met advisories
2
Financial Capitals
1. Funds at Watershed Committee level (always available) 4 All get affected by climate risks indirectly. However are affected by availability of government/donor projects.
2. Funds with Village Organisation level (always available) 4

81
CoDr
iVE-
PD –
A H
andb
ook
Level of Analysis: HH Level Based on information, the vulnerable groups were identified as the small and marginal farmers in general and the scheduled caste and scheduled tribe farmers in particular, living in the hamlets adjoining the main village. In their context, the livelihood resources are graded on the basis of functionality/availability of resources and are as follows:
Capital-based Resilience Scale: 1 = nil (0-10%), 2 = minimum (11-25%), 3 = low (26-45%), 4 = adequate (46-70%), 5 = high (71% and above)
Vulnerable group
Large Farmers Small & Marginal Farmers Landless
List of resources under each capital
1 2 3 4 5 Notes on how sensitive/essential for coping are the resources
1 2 3 4 5 Notes on how sensitive/essential for coping are the resources
1 2 3 4 5 Notes on how sensitive/essential for coping are the resources
Natural Capitals
Indigenous Cattle
2 Local biodiversity, agricultural lands, fodder plots.
Note: This group has mainly crossbred cattle in large numbers, which are highly sensitive to climate hazards.
2 Local biodiversity, agricultural lands, fodder plots are small, hence poor resilience. This group has large numbers of indigenous cattle and higher dependence on small livestock, hence more resilient.
1 This group has nil land holdings and no cattle but more goats and backyard poultry.
Small livestock (goat, sheep, backyard poultry)
1 3 2
Local biodiversity (trees)
1 1 1
Agricultural lands
4 2 1
Fodder plots 4 1 1
Indigenous seed varieties
1 1 1
Physical Capitals
Seed & grain banks for storage
1 Bore well recharge structures.
Bore well recharge structures.
Bore well recharge structures
1

82
Social Capitals
Farmers’ groups 1 All of these are indirectly affected by climate risks.
Note: WSHGs are well-organised structures at village level and have equal participation from the farmers belonging to different land holding categories but are dominated by the better-off farmers.
1 All of these are indirectly affected by climate risks.
1
WSHGs 4 3
Human Capitals
Knowledge on crop–livestock systems, watershed structures, non-farm options, agri-inputs that are climate compatible
2 All get affected by climate risks indirectly.
Note : Knowledge/information is high in general but not useful and increasing maladaptive action.
2 All get affected by climate risks indirectly.
Note: Rely on progressive farmers and hence adopt similar maladaptive actions, becoming increasingly vulnerable to climate change.
3 All get affected by climate risks indirectly.
Note: This group possesses skills that enable them to engage in farm-based and non-farm-based livelihoods, making them a bit more resilient than others.
Financial Capital:
Funds with WSHGs
4 All of these are indirectly affected by climate risks but are important to strengthen the adaptive capacities of the communities.
Note : Diversification in agriculture and being highly active in WSHGs makes them more resilient, however the diversification strategies are not all climate-compatible, rather they are more maladaptive.
All of these are indirectly affected by climate risks but are important to strengthen the adaptive capacities of the communities.
Note: Nil to few non-farm options and lower ability in accessing funds from WSHG organisations makes them less resilient.
2 All of these are indirectly affected by climate risks but are important to strengthen the adaptive capacities of the communities.
Note: Lack of dependence on climate sensitive sector livelihood options, and no climate-sensitive assets, and their current accessibility to externally supported programmes, e.g. NREGA, temporarily increases their resilience when compared to other two groups.
Non-farm livelihoods options
2 1 4
Diversification of agriculture
4 1 1

83
CoDr
iVE-
PD –
A H
andb
ook
Step 5: Arriving at the Vulnerability Code The vulnerability codes based on the livelihood resources at village level and vulnerable group level are:
Financial Capital Human Capital Natural Capital Physical Capital Social Capital
Recent project with village fund for watershed development is available.
VOs are strong and have funds.
Human capital with respect to climate-sensitive livelihoods is low: most of the knowledge is increasing maladaptation, with climate change increasing the risk.
CBOs like the VOs and watershed committee have funds, but have no knowledge of climate-adaptive strategies to use the funds effectively; currently the funds are being used/allocated for more maladaptive livelihoods which will further increase vulnerability to climate variability.
No forest lands.
Minimal availability of common property resources.
Low in local biodiversity.
Ground water scarcity very high.
Natural water bodies decreasing/drying up.
Degrading cultivable lands (problems of soil fertility, salinity, etc.)
Physical capital with respect to education, transportation and institutions is adequate.
However physical capital with respect to climate sensitive livelihoods is very low.
Seed banks and agricultural warehouses are located very far away.
There are large numbers of bore wells but no recharge structures.
No farmers clubs/cooperatives.
No labour associations.
Watershed committees formed but weak; high political problems.
VOs are formed but are dominated by the richer class.
4 1 2 2 3
Stable Danger Risk Risk Alert
Note: Vulnerability colour coding Index for indicating Vulnerability based on Capitals: Red – Danger (1), Orange – Risk (2), Yellow – Alert (3) , Blue – Stable (4), Green – Safe (5)

84
Vulnerability code of vulnerable groups (HH level analysis) based on the Livelihood Capitals: As agriculture was found to be the major climate-sensitive livelihood option for the communities of Chandradana, codes were generated for three categories and have been described below:
Vulnerable Group Category
Financial Capital Human Capital Natural Capital Physical Capital
Social Capital
Large land-owning farmers
Good access to VOs and watershed committees.
Non-farm livelihoods options better.
Have better access to financial resources like credit and bank loans that would be beneficial at the time of crises.
Knowledge of crop-livestock management better, but not of climate-compatible and sustainable strategies.
Know where and how to access information regarding government projects and schemes.
Inputs facilities high but not for the right options
Have knowledge on watershed structures.
Agricultural land good.
Depend more on fruit orchards and crossbred dairy farming.
Less trees, indigenous livestock, and small ruminants.
Diversification of agriculture to horticulture, however choice of crops are water-intensive.
Use water-efficient micro-irrigation systems.
Own large numbers of bore wells; however the ground water is decreasing.
Own storage facilities.
Have capacity to put up own water recharge structures.
Hold key positions in watershed.
Good linkages with political parties.
Lead the VOs and WSHG groups.
Vulnerability code and colour index
4 3 3 4 4Stable Alert Alert Stable Stable

85
CoDr
iVE-
PD –
A H
andb
ook
Vulnerable Group Category
Financial Capital Human Capital Natural Capital Physical Capital
Social Capital
Small & marginal farmers
Funds with WSHGs high but capacity to access funds low.
Agricultural operations purely on credit basis.
Little or nil non-farm options.
Low access to other financial resources.
Lack assets.
Less income from non-agricultural related wage works.
Lack of knowledge, awareness on climate-compatible farming practices.
Poor knowledge & ability on how to access information and inputs facilities.
Low knowledge of construction/use of watershed structures.
Soil quality deteriorating.
Water scarcity high.
No diversified farming.
Limited access to local trees.
Few rear small ruminants.
Do not use water-efficient systems.
Only own large pipes, etc. as they depend on large farmers for water supply.
Do not own bore well.
Do not have storage facilities.
They share equal participation in WSHGs and other village level organisations like panchayats, cooperatives, etc.
However, they are not able to assert themselves as the large farmers do.
Vulnerability code and colour index
2 1 2 1 2
Risk Danger Risk Danger Risk

86
Vulnerable Group Category
Financial Capital Human Capital Natural Capital Physical Capital
Social Capital
Landless Funds with WSHGs high but capacity to access funds is low.
Agri-labour charges high but unavailability of agri-wage work due to increasing crop loss due to climate factors is high.
Support/dependence from NREGA (government scheme) high currently.
Non-farm livelihoods options high.
High percentage of wage labourers externally dependent.
Possession of non-farm assets is more as compared to other categories of famers.
Knowledge, awareness on sustainable farming practices – better than farmers belonging to other three land-holding categories due to higher dependence on agri-wage labour and migration.
This group has stronger secondary skills, e.g. welding, tailoring, etc.
They also possess knowledge on soil & water conservation structures and therefore can get engaged in activities related to WSD (non-farm wage work).
Limited access to local trees.
More small ruminants rearing.
No agricultural lands.
Water for domestic use.
Lack of assets seems to give them mobility and diversified livelihood options (not climate-sensitive), giving them more exposure to skills.
They share equal participation in WSHGs and other village level organisations like panchayats, cooperatives, etc. However these organisations are not strong enough to access resources.
Vulnerability code and colour index
3 4 1 4 2Alert Stable Danger Stable Risk
(This is an illustrative example to showcase how ideas can be leveraged from a well-done vulnerability assessment to draw conclusions and devise possible interventions)

87
CoDr
iVE-
PD –
A H
andb
ook
Conclusion and Way Forward
Project Design LeadsAs agriculture is the sector most sensitive to climate change, the landless are less vulnerable, as they do not own land, making them less directly vulnerable to climatic factors, as compared to land-owning households; although those who depend on agri-wage labour are also affected. Their mobility and labour/skills options factor is an added advantage. The large land owners are resilient, as they have sufficient resources to buffer them. However, the small and marginal farmers are the most vulnerable group due to the lack of other resources or capitals. For the large farmers the presence or absence of other capitals or resources is irrelevant as they have the means to access needed facilities and knowledge. (In fact the recent agricultural experiments were all introduced into the village by them.) For the landless, the natural resources or capital are the most critical, as they completely lack these.
Natural Capital EnhancementConclusion: The village has no forests nearby. However, earlier there were several tree species on common lands and field bunds that are now absent. The common property resources have been converted into cultivated land and distributed over time. The lack of local biodiversity has greatly affected the soil moisture, as well as people’s livelihoods and food security. The landless are particularly vulnerable as they have no land assets to supply their needs and are currently dependent on external sources, e.g. NREGA, agricultural wage labour (which is climate-sensitive), and a few non-farm options, as sources of livelihood. There is extreme water scarcity for both domestic purposes as well as agriculture, due to the increased digging of bore wells to support the high-input, water-intensive crops and livestock production systems. Huge investments are being made by farmers in digging new bore wells, but there is a high failure rate because of the falling ground water table. Area under water-intensive agriculture that had increased during the past 10 years is now reducing. Many farmers do not take summer crops anymore as the bore wells run dry and Rabi crops often fail. With increased use of chemical fertilisers and pesticides, soil quality has deteriorated and weeds have increased, forcing the use of weedicides. Soil salinity has increased.
These are some possible areas of interventions, to protect the resource base and adapt to climate change:
Implement watershed development (soil and water conservation) measures wherever possible, particularly in high-potential recharge zones, with first priority to bore well and well recharge measures.
Identify and revive small irrigation sources such as farm ponds and tanks (both private and government-owned).
Promote local biodiversity tree species as avenue plantations on farm bunds or in CPRs in the village to enhance the tree cover, biomass, and soil moisture. This will

88
also provide alternative livelihoods, inputs for agriculture, and food security for communities. Tree species identified are: Azadirachta indica (neem), Pongamia pinnata, Butea monosperma (moduga, used for making leaf plates), Madhuca longifolia (mahua), tamarind, Indian Gum Arabica (thumma), and a few fodder tree species.
Diversify agricultural production with focus on a balance between food crops and water-intensive cash crops.
Provide agro-advisories based on locale-specific weather data and improved agricultural practices.
Promote suitable water-efficient technologies with core focus on small and marginal farmers; explore and address the reasons preventing them from being adopted so far.
Diversification of livestock production required, as communities are now solely depended on cross-bred cow milk production.
Physical Capital Enhancement Conclusion: This is a recently selected watershed development village, hence it has very few soil and water conservation structures, which when implemented will increase benefits. Other essential physical capitals that need to be developed are the Farmer Service Centre that attends to agricultural and allied needs, storage houses for agri-produce, community grain banks, establishment of fodder banks by enterprise management of crop residue, and improved drinking water facilities in the villages. Also required are assets for non-farm livelihood activities that enhance the standard of living (services for which villagers currently go to nearby towns and cities). All this will prevent distress migration of ecological refugees and make for a healthy and attractive cluster of villages.
Social Capital EnhancementConclusion: Most of the institutions are managed and dominated by the forward and better-off communities which are quite knowledgeable about new agricultural and other farming practices. The village has well-organised SHGs formed by government agencies. There is a watershed committee for resource management. User groups (villagers, including the landless), belonging to all categories participate in meetings and get involved in the decision-making process in the SHGs, farmers groups, watershed committee, etc. NREGA job cards are available to communities. However, there is a need to strengthen SHG groups located in the hamlets and to increase their capacity to access schemes from existing VOs as they do not seem to derive adequate benefits from these.
Human Capital EnhancementConclusion: There is a lack of knowledge and awareness of sustainable farming practices including traditional cropping patterns and storage practices. The farmers
89
CoDr
iVE-
PD –
A H
andb
ook
seem to grow only a few varieties of crops resulting in soil degradation, salinity issues, and water scarcity. They purchase seeds based entirely on market information or exposure to government schemes; and the large farmers set the example for the medium, small and marginal farmers. The family and land holding sizes have also reduced over time, resulting in fewer working hands per household and huge labour shortages for agriculture and livestock operations. Villagers seem to lack the skills and knowledge needed to cope with the negative consequences of any extreme events that affect their livelihoods or market forces (such as varying weather conditions that affect their primary livelihoods – agriculture and livestock). They seem unable to diversify into non-farm livelihoods or locally required services or even to attempt improving farming practices. They therefore depend on external agencies for loans or land lease, putting them into the debt cycle. Because of increasing water scarcity and losses, many are selling off their landholdings and migrating to cities for jobs (often unskilled and low-paying).
As input costs are increasing for agriculture and animal husbandry, which are needed to meet food and nutrition security, capacity building is required to improve productivity of indigenous cattle and buffaloes, LEISA techniques in agriculture, collective enterprise development, and crop-water budget based agricultural production.
Financial Capital EnhancementConclusion: Recurrent droughts, irregular rainfall, and prolonged dry spells are causing huge losses – up to 50 to 100 percent per acre. Capital costs have been increasing. Due to the disappearance of all the local biodiversity many forest-based livelihoods that were a safety net for the poor communities are now absent. The communities are totally dependent on a milk based economy with crossbred cows which does not look viable in the long run due to increasing investment in animal health care and depleting resource base – promotion of small livestock and other support systems is needed.
Despite all this, the villagers are surviving as they have better access to funds because of functioning village organisations. People also have direct access to government benefits and compensations which at least temporarily reduces their vulnerability in times of need. However, this indicates a dependence on government schemes. Other than farm-based livelihoods, villagers have NREGA job cards and also get employment in watershed development work that is being carried out in the villages.
The village requires viable alternative livelihoods. These should be so selected that they meet the various needs of a cluster of villages, which villagers otherwise

90
seek outside. Finances (loans and/or grants) are required to create the human, natural, and physical resources that will create sustainable livelihoods from skills and services provided, that meet village needs and also ensure that the primary livelihoods – sustainable agriculture and livestock systems – are viable. Women, small and marginal farmers, and the landless are the important groups to focus on.
Research areasThe current vulnerability assessment report acts as a baseline report and will help monitor project progress. When applied during project implementation, it suggests mid-course corrections and provides leads for action research based on interventions identified.
Policy advocacy pointers The chief policy advocacy indicated is for identification of CPRs and their revival, and lobbying for
Appropriate indigenous varieties of food crops and local livestock breeds with potential, together with a variety/breed improvement programme, as they have greater resilience to climate factors.
For feed supply, animal and human health care infrastructure, and services. A “cluster of villages” development approach, i.e. the PURA modified for rural
setting and the approximate population.

91
CoDr
iVE-
PD –
A H
andb
ook
CoDriVE-PD ANNEXURE

92
CoDriVE-PDIndicative list of questions for data collection
Compulsory instructions for data collection All questions to be asked for past and present status. It would be best to ask questions keeping in mind the 5 livelihood capitals
within each sector/cross cutting theme. Universal units to be used and specified for all parameters to be quantified. To help quantify the livelihood capitals the capital-based resilience scale
must be used to arrive at a near-to-accurate value; any participatory tool or pie diagrams, etc. could be used while interacting with communities to help arrive at a proper value.
Data should be descriptive (for traditional methods, farming systems, etc.) and quantitative when it comes to costs, losses etc.
Identifying loss due to climate problems and deriving the loss in all the sectors is very essential.
Cross-cutting topics like water, gender, health, governance, etc. to be asked in every livelihood sector.
Step 1: Building a vulnerability context – “What is happening to the environment and why? “Note 1: Given below are indicative questions for collecting data for table 1 of step 1. Please note the same question can be used for eliciting data for both past and present situations. While collecting data for this section always find out reasons as to why/what has triggered the change from the past, which will help identify the drivers and pressures to be filled in column 4 of the worksheet, while also giving you indications if they are climate induced. Maximum detailing of table A and B of step 1 is essential for analysing and grading the capitals in the subsequent steps.
Note 2: There are other sectors that are climate sensitive, hence users are suggested to add sectors as appropriate to their project area or domain of operation.
Table A: Identifying the Drivers–D & Pressures–P
I. Agriculture a) What is the area under agricultural land resources mentioned below? lCulturable waste land lFallow lands other than current fallows lCurrent fallows lNet area sown
Annexure 1

93
CoDr
iVE-
PD –
A H
andb
ook
lTotal cropped area lNet irrigated area lGross irrigated areab) What are the different sources of irrigation in the village (e.g. Farm wells, common
wells, bore wells, farm ponds, irrigation tanks)?c) Describe the farming system: diversified/specialized/mixed/rain-fed/etc .d) What are the different crops sown during kharif, rabi and summer season.e) Describe the inputs like variety of seeds, fertiliaers used for each crop.f) What is the yield per crop?g) What are the common crop diseases prevalent in the village?h) What are the total input costs and income per hectare?i) What are the different agriculture support systems in the village (e.g. subsidies,
crop insurance, other government schemes)?j) Information about agriculture infrastructure and other facilities like storage
structures, cold storages, collection points, markets, seed and grain banks, etc.k) Collect information about the social capital related to agriculture, like farmer
groups, producer companies, Self Help Groups, etc. l) List the reasons for losses in agriculture production due to climate variability and
other stressors, collect maximum possible description and try quantify all types of losses using the resilience scale to the extent possible
II. Livestock a) What are the different animal species present in the village? (cattle-indigenous,
crossbred, exotic, buffaloes, sheep, goats, poultry-native, improved, commercial, others pigs, camels, horses, mules, yak, rabbit.)
b) Describe the various grazing resources (cultivable waste land, fallow lands, current fallows, post-harvest land, forest, common property resources, etc.) and non-grazing resources (crop residues) in the village.
c) What are the various sources of water for livestock?d) What are the major livestock products for sale?e) Describe the common livestock diseases.f) What are the total input costs and income per livestock category?g) Describe the livestock support systems like subsidies, schemes for dairy
development, feed and fodder development, livestock insurance, etc.h) Information about livestock-based infrastructure like milk chilling centers, good
collection centres, markets, veterinary clinics, diagnostic labs, etc.i) Collect information about the social capital like milk federations, sheep and goat
breeders association, self help groups, pastoralists and grazers association.j) List the reasons for losses in livestock production species-wise and breed-
wise due to climate variability and other stressors; collect maximum possible descriptions and try to quantify all types of losses using the resilience scale to the extent possible.

94
III. Forestsa) What are the various water sources in the forest (seasonal rivers, perennial rivers,
natural water bodies, etc.)?b) List the major forest resources like tree and shrub species, fauna, etc.c) What are the different forest products per tree species and give details of the
quantity and costs related to each product.
IV. Fisheries a) What are the sources of fisheries (inland, marine, aquaculture, estuaries etc.)?b) Describe the fish habitat (mangroves, inland, coral reefs, rivers, wetlands, fresh
water, etc. as appropriate in your area).c) Name the fish species found in the village and give details of the fish catch per
species.d) What are the total input costs and income per fish species?e) What are the various support systems for fisheries like formal/informal credit
systems, insurance, and subsidies?f) Give details about the infrastructure like boat-building and propulsion, markets,
onshore and on-board processing units, and preserving systems.g) Information about the village-level social capital like fishermen groups, trader
groups, self help groups, etc.
V. Non-farm livelihoods that support the above sectors a) Collect information about the various non-farm livelihoods that are related to
the above sectors more specifically, like carpenters who make farm implements, electricians, welders, mechanics, traditional healers, masons, etc. present in the village.
VI. Other climate-sensitive sectors and crosscutting themes 1. Health sector a) What are the major diseases among men, women and children prevalent in
the village? b) Collect detailed information about natural deaths and weather-related
occurrence of diseases in men, women and children. c) Describe the various natural resources like medicinal plants, availability of
clean drinking water, food and nutrition sources in the village required for healthy environment.
d) What are the expenses on diseases and the daily wage loss due to illness? e) Information about various government and private health improvement
schemes and programmes. f) What are the health care facilities present in and around the village and
infrastructure to access the facilities? g) Describe the condition of housing infrastructure.

95
CoDr
iVE-
PD –
A H
andb
ook
h) What are the different government, private and community-based organisations and groups working for the improvement of health of the villagers?
i) Describe the equity issues in the village with respect to castes and religions, etc.
j) Collect information about practices for village sanitation and hygiene. k) What is the level of awareness among the villagers with respect to
health-related issues like cleanliness, hygiene, family planning, etc? l) What is the migration pattern in the village, as a migrating population can be
the carriers of diseases? m) What are the various addictions like smoking, alcohol consumption, etc.
among the villagers? n) Describe the traditional healing systems.
2. Cross-cutting themes 2.1 Gender a) What is the participation of women in the local farmer organisations? b) What is the existing division of labour in the household farming system? c) What are the male and female roles in seed selection, land preparation,
planting, weeding, harvest, storage, processing, and marketing? d) What are the male and female roles in collection and fodder preparation,
feeding, watering, cleaning, herding, shearing, other harvest activities, and care of sick animals?
e) Are agricultural decisions made by men and women jointly? f) Who decides on planting, harvesting, post-harvesting, marketing, and
consumption of crops and water usage for agricultural and domestic consumption?
g) What are the roles of women and men for saving local seed varieties? h) Do men as well as women participate in farmer field schools, extension
groups, or other dissemination activities to the same extent they carry out the activity themselves?
i) Do women have access to credit? j) What is the relative availability of training and expertise for the crops women
farm, animals women raise, and agricultural tasks women perform compared to those of men?
k) Do men and women receive different wages and benefits? l) Do women hold leadership positions in village level organisations? m) Do women-only organisations exist? How effective are these organisations? n) What is the control over resources or income by men and women? o) What is the attendance of girls at primary and secondary schools?

96
2.2 Local traditions and systems a) What are the different common areas in the village used for ceremonies or
other festivals? b) What is the status of common resource-sharing in the village? c) Describe the effect of migration on family integration and traditions? d) Does the availability of resources affect the local traditions in the village?
2.4 Governance and informal governance a) What is the role of local institutions in the resolution of conflict on
resource-sharing? b) What are the modifications required in the functioning of the local
institutions? c) What is the participation of villagers in various committees and local level
institutions? d) Are there any key players or influential leaders in the village? e) What is the status of participation of different sections of the society in the
local institutions and what are the different levels they participate in?
Table B: State & Trends of Climate in the Region
a) What was the climate before year 2000? How were the seasons? What were the rainfall and temperature patterns; describe the seasons and climate risks faced in the past in detail.
b) What are the main climate risks you feel now? Describe each climate risk.c) Note the trends of all climate risks being felt since year 2000 till date. d) What are the current impacts being faced for each climate risk. e) What are the responses taken by communities and external agencies in the
context of the climate risks identified?
Note 1: Dry spells, irregular rainfall, frost, high levels of temperature/humidity, sudden high intensity rainfall, unseasonal rains etc can all be considered as climate risks in the region. It is important to understand the frequency of these risks as each risk will have a different impact and hence a different response by the communities. Each response taken will determine the vulnerability depending on the impact it has on the ecosystem the communities live in and themselves.
Step 2: Responses – what is being done and how effective is it?
This section analyses the responses being taken by the communities or by external agencies due to the climate risks that emerge from discussions/data collection in the study area. The questions below will help the user analyse the responses, gaining a better understanding on what is causing vulnerability in a climatic change context.

97
CoDr
iVE-
PD –
A H
andb
ook
1. How effective and sustainable are the responses taken by the community and/or external agency identified in Table B in context to the climate risks being faced?
2. What are the impacts (both positive and negative) of the responses on the ecosystem? Do you notice a series of responses that are causing a negative impact (maladaptation)?
3. What is the effect of responses taken on the vulnerability of the communities? Does a particular response increase or reduce the vulnerability of the community?
4. What are the resources essential for the community to cope or respond to the climate risks identified?
5. Are external agency responses helping build response capacity of communities or resilience of the ecosystem?
Note: In case innovative adaptation responses are spotted either by communities or any external agencies, it would be important to identify of ways and means to support and amplify these responses.
Steps 3, 4 and 5 do not have indicative questions as they involve an analysis of the data.

98
Access to care This implies the ability of individuals/communities to avail of services at existing health centres and the barriers that prevent some sections from availing these services.
AdaptationAdjustment in natural or human systems to a new or changing environment. Adaptation to climate change refers to adjustment in natural or human systems in response to actual or expected climatic stimuli or their effects, which moderates harm or exploits beneficial opportunities. Various types of adaptation can be distinguished, including anticipatory and reactive adaptation, private and public adaptation, and autonomous and planned adaptation.
Adaptive capacityThe ability of a system to adjust to climate change (including climate variability and extremes) to moderate potential damages, to take advantage of opportunities, or to cope with the consequences.
AfforestationPlanting of new forests on lands that historically have not contained forests.
Agent In epidemiological terms, any entity with an inherent ability to damage health.
AquiferA stratum of permeable rock that bears water. An unconfined aquifer is recharged directly by local rainfall, rivers, and lakes, and the rate of recharge will be influenced by the permeability of the overlying rocks and soils. A confined aquifer is characterised by an overlying bed that is impermeable and the local rainfall does not influence the aquifer.
Arid regionsEcosystems with less than 250 mm precipitation per year.
Availability of health care The existence of infrastructure, human resources and facilities to provide prescribed care for various diseases/health conditions.
BiodiversityThe numbers and relative abundances of different genes (genetic diversity), species, and ecosystems (communities) in a particular area.
BiomeA grouping of similar plant and animal communities into broad landscape units that occur under similar environmental conditions.
Biosphere (terrestrial and marine)The part of the Earth system comprising all ecosystems and living organisms in the atmosphere, on land (terrestrial biosphere), or in the oceans (marine biosphere), including derived dead organic matter such as litter, soil organic matter, and oceanic detritus.
BiotaAll living organisms of an area; the flora and fauna considered as a unit.
Capacity buildingIn the context of climate change, capacity building is a process of developing the technical skills and institutional capability in developing countries and economies in transition to enable them to participate in all aspects of adaptation to, mitigation of, and research on climate change, and the implementation of the Kyoto Mechanisms, etc.
CatchmentAn area that collects and drains rainwater.
ClimateClimate in a narrow sense is usually defined as the “average weather” or more rigorously as the statistical description in terms of the mean and variability of relevant quantities over a period of time ranging from months to thousands or millions of years. The classical period is 30 years, as defined by the World Meteorological Organisation (WMO). These relevant quantities are most often surface variables such as temperature, precipitation, and wind. Climate in a wider sense is the state, including a statistical description, of the climate system.
Climate changeClimate change refers to a statistically significant variation in either the mean state of the climate or in its variability, persisting for an extended period (typically decades or longer). Climate change may be due to natural internal processes or external forcings, or to persistent anthropogenic changes in
Glossary
99
CoDr
iVE-
PD –
A H
andb
ook
the composition of the atmosphere or in land use. Note that the United Nations Framework Convention on Climate Change (UNFCCC), in its Article 1, defines “climate change” as: “a change of climate which is attributed directly or indirectly to human activity that alters the composition of the global atmosphere and which is in addition to natural climate variability observed over comparable time periods.” The UNFCCC thus makes a distinction between “climate change” attributable to human activities altering the atmospheric composition, and “climate variability” attributable to natural causes.
Climate extreme (extreme weather or climate event)The occurrence of a value of a weather or climate variable above (or below) a threshold value near the upper (or lower) ends of the range of observed values of the variable. For simplicity, both extreme weather events and extreme climate events are referred to collectively as climate extremes.
Climate-sensitive diseases Diseases whose epidemiological distribution (time, place, or person) would be affected by change in climate. Examples are vector-borne diseases (malaria), influenza, and disaster-linked health problems.
Climate sensitivityIn IPCC assessments, “equilibrium climate sensitivity” refers to the equilibrium change in global mean surface temperature following a doubling of the atmospheric (equivalent) CO2 concentration. More generally, equilibrium climate sensitivity refers to the equilibrium change in surface air temperature following a unit change in radiative forcing (°C/Wm-2). In practice, the evaluation of the equilibrium climate sensitivity requires very long simulations with coupled general circulation models. The “effective climate sensitivity” is a related measure that circumvents this requirement. It is evaluated from model output for evolving non-equilibrium conditions. It is a measure of the strengths of the feedbacks at a particular time and may vary with forcing history and climate state.
Climate systemThe climate system is the highly complex system consisting of five major components: the atmosphere, the hydrosphere, the cryosphere, the land surface, and the biosphere, and the interactions between them. The climate system evolves in time under the influence of its own internal dynamics and because of external forcings such as volcanic eruptions, solar variations,
and human-induced forcings such as the changing composition of the atmosphere and land-use change.
Climate variabilityClimate variability refers to variations in the mean state and other statistics (such as standard deviations, the occurrence of extremes, etc.) of the climate on all temporal and spatial scales beyond that of individual weather events. Variability may be due to natural internal processes within the climate system (internal variability), or to variations in natural or anthropogenic external forcing (external variability).
Cost-effectiveA criterion that specifies that a technology or measure delivers goods or a service at equal or lower cost than current practice, or the least-cost alternative for the achievement of a given target.
Dengue A vector-borne disease characterised by fever and bone pains which is transmitted by Aedes mosquitoes. This is more prevalent in urban areas where Aedes breed in small artificial containers.
DesertAn ecosystem with less than 100 mm precipitation per year.
DesertificationLand degradation in arid, semi-arid, and dry sub-humid areas resulting from various factors, including climatic variations and human activities. Further, the United Nations Convention to Combat Desertification defines land degradation as a reduction or loss in arid, semi-arid, and dry sub-humid areas of the biological or economic productivity and complexity of rain-fed cropland, irrigated cropland, or range, pasture, forest, and woodlands resulting from land uses or from a process or combination of processes, including processes arising from human activities and habitation patterns, such as: (i) soil erosion caused by wind and/or water; (ii) deterioration of the physical, chemical, and biological or economic properties of soil; and (iii) long-term loss of natural vegetation.
Determinants of healthFactors which contribute in enhancing, maintaining, or damaging the health of an individual or community. They are the causes (and the causes of causes) of diseases. They can be classified as biological (e.g., genetic), social (e.g., educational status), economic (e.g., income), political (e.g., health programmes), environmental (e.g., climate change), behavioural (e.g., hand washing) and cultural determinants.

100
Disease profile Prevalent diseases and their respective burdens in an area.
DroughtThe phenomenon that exists when precipitation has been significantly below normal recorded levels, causing serious hydrological imbalances that adversely affect land resource production systems.
EcosystemA system of interacting living organisms together with their physical environment. The boundaries of what could be called an ecosystem are somewhat arbitrary, depending on the focus of interest or study. Thus, the extent of an ecosystem may range from very small spatial scales to, ultimately, the entire Earth.
Ecosystem servicesThe benefits that people derive from the ecosystem. These might include the production of goods, e.g., food, fiber, water, fuel, genetic resources, pharmaceuticals, etc.; regeneration processes, e.g., purification of air and water, seed dispersal and pollination; stabilising processes, e.g., erosion control, moderation of weather extremes; life-fulfilling functions, e.g., aesthetic beauty, cultural value; and conservation of options, e.g., maintenance of ecological systems for the future.
Achieved when the productivity of life-supporting natural resources is conserved or enhanced for use by future generations. By productivity we mean its ability to produce a wide range of environmental services, such as the supply of food and water, flood protection, waste management, etc. Environmental sustainability is one of a number of dimensions of sustainability that also include institutional sustainability, economic sustainability and social sustainability.
Epidemiology The study of distribution and determinants of diseases and health outcomes in a population, and the application of this information in improving health.
EvapotranspirationThe combined process of evaporation from the Earth’s surface and transpiration from vegetation.
ExposureThe nature and degree to which a system/person is exposed to significant climatic variations.
In terms of health, it means the time, degree and mode of contact between a hazard/intervention and an individual/community.
Extreme weather event An extreme weather event is an event that is rare within its statistical reference distribution at a particular place. Definitions of “rare” vary, but an extreme weather event would normally be as rare as or rarer than the 10th or 90th percentile. By definition, the characteristics of what is called extreme weather may vary from place to place. An extreme climate event is an average of a number of weather events over a certain period of time, an average which is itself extreme (e.g., rainfall over a season).
Financial CapitalFinancial Capital is a category of livelihood assets. Within the Sustainable Livelihood framework, it is defined as the financial resources that people use to achieve their livelihood objectives. These resources include:
Available stocks: Savings are the preferred type of financial capital because they do not have liabilities attached and usually do not entail reliance on others. They can be held in several forms: cash, bank deposits or liquid assets such as livestock and jewellery. Financial resources can also be obtained through credit-providing institutions in which case liabilities are attached.
Regular inflows of money: Excluding earned income, the most common types of inflows are pensions, or other transfers from the state, and remittances. In order to make a positive contribution to financial capital these inflows must be reliable – while complete reliability can never be guaranteed there is a difference between a one-off payment and a regular transfer on the basis of which people can plan investments. It should be noted that this definition is different from a strict economic definition of financial capital as it includes flows as well as stocks. (Economists would look only at stocks).
Food insecurityA situation that exists when people lack secure access to sufficient amounts of safe and nutritious food for normal growth and development and an active and healthy life. It may be caused by the unavailability of food, insufficient purchasing power, inappropriate distribution, or inadequate use of food

101
CoDr
iVE-
PD –
A H
andb
ook
at the household level. Food insecurity may be chronic, seasonal, or transitory.
ForestA vegetation type dominated by trees. Many definitions of the term forest are in use throughout the world, reflecting wide differences in bio-geophysical conditions, social structure, and economics.
Global Warming Potential (GWP)An index, describing the radiative characteristics of well-mixed greenhouse gases, that represents the combined effect of the differing times these gases remain in the atmosphere and their relative effectiveness in absorbing outgoing infrared radiation. This index approximates the time-integrated warming effect of a unit mass of a given greenhouse gas in today’s atmosphere, relative to that of carbon dioxide.
Greenhouse effectGreenhouse gases effectively absorb infrared radiation, emitted by the Earth’s surface, by the atmosphere itself due to the same gases, and by clouds. Atmospheric radiation is emitted to all sides, including downward to the Earth’s surface. Thus greenhouse gases trap heat within the surface-troposphere system. This is called the “natural greenhouse effect.” Atmospheric radiation is strongly coupled to the temperature of the level at which it is emitted. In the troposphere, the temperature generally decreases with height. Effectively, infrared radiation emitted to space originates from an altitude with a temperature of, on average, -19°C, in balance with the net incoming solar radiation, whereas the Earth’s surface is kept at a much higher temperature of, on average, +14°C. An increase in the concentration of greenhouse gases leads to an increased infrared opacity of the atmosphere, and therefore to an effective radiation into space from a higher altitude at a lower temperature. This causes a radiative forcing, an imbalance that can only be compensated for by an increase of the temperature of the surface-troposphere system. This is the “enhanced greenhouse effect.”
Greenhouse gasGreenhouse gases are those gaseous constituents of the atmosphere, both natural and anthropogenic, that absorb and emit radiation at specific wavelengths within the spectrum of infrared radiation emitted by the Earth’s surface, the atmosphere, and clouds. This property causes the greenhouse effect. Water vapor (H2O), carbon
dioxide (CO2), nitrous oxide (N2O), methane (CH4), and ozone (O3) are the primary greenhouse gases in the Earth’s atmosphere. Moreover there are a number of entirely human-made greenhouse gases in the atmosphere, such as the halocarbons and other chlorine- and bromine-containing substances, dealt with under the Montreal Protocol. Besides CO2, N2O, and CH4, the Kyoto Protocol deals with the greenhouse gases sulfur hexafluoride (SF6), hydrofluorocarbons (HFCs), and perfluorocarbons (PFCs).
Groundwater rechargeThe process by which external water is added to the zone of saturation of an aquifer, either directly into a formation or indirectly by way of another formation.
HabitatThe particular environment or place where an organism or species tend to live; a more locally circumscribed portion of the total environment.
Health outcome The change in the health or physiological parameter of individuals due to exposure to a hazard or an intervention.
Health system Health services and infrastructure that the government has put in place for the community, which would include the health centres, doctors, allied professionals, health workers and health programmes/services operating through these centres. Traditional health systems also exist, with local healers of various kinds providing care for some forms of ailments.
Heat stress in Humans Exposure to increasing heat that can lead to rise in body temperature beyond its ability to cope, causing loss of consciousness in serious cases. Older persons are more at risk.
Heat Stress in farm animals Heat stress is defined as any combination of temperature, humidity, radiation, and wind, producing conditions higher than the animals’ thermal neutral zone. This stress causes general discomfort, decline in animal performance in context to production, and even death
Human CapitalHuman Capital is a category of livelihood assets. It represents the skills, knowledge, capacity to work,

102
and good health that together enable people to pursue different livelihood strategies and achieve their livelihood outcomes. At a household level human capital is a factor of the amount and quality of labour available. This varies according to household size, skill levels, education, leadership potential, health status, etc. Human capital is necessary to be able to make use of the other four types of livelihood assets.
Human systemAny system in which human organisations play a major role. Often, but not always, the term is synonymous with “society” or “social system” (e.g., agricultural system, political system, technological system, economic system).
(Climate) impact assessmentThe practice of identifying and evaluating the detrimental and beneficial consequences of climate change on natural and human systems.
(Climate) impactsConsequences of climate change on natural and human systems. Depending on the consideration of adaptation, one can distinguish between potential impacts and residual impacts. Potential impacts: all impacts that may occur given a projected change in climate, without considering adaptation. Residual impacts: the impacts of climate change that would occur after adaptation.
ImplementationImplementation refers to the actions (legislation or regulations, judicial decrees, or other actions) that governments take to translate international accords into domestic law and policy. It includes those events and activities that occur after the issuing of authoritative public policy directives, which include the effort to administer and the substantive impacts on people and events. It is important to distinguish between the legal implementation of international commitments (in national law) and the effective implementation (measures that induce changes in the behaviour of target groups). Compliance is a matter of whether and to what extent countries do adhere to the provisions of the accord. Compliance focusses on not only whether implementing measures are in effect, but also on whether there is compliance with the implementing actions. Compliance measures the degree to which the actors whose behaviour is targeted by the agreement, whether they are local government units, corporations, organisations, or individuals, conform to the implementing measures and obligations.
Indigenous peoplesPeople whose ancestors inhabited a place or a country when persons from another culture or ethnic background arrived on the scene and dominated them through conquest, settlement, or other means and who today live more in conformity with their own social, economic, and cultural customs and traditions than those of the country of which they now form a part.
Integrated assessmentA method of analysis that combines results and models from the physical, biological, economic, and social sciences, and the interactions between these components, in a consistent framework, to evaluate the status and the consequences of environmental change and the policy responses to it.
Introduced speciesA species occurring in an area outside its historically known natural range as a result of accidental dispersal by humans (also referred to as “exotic species” or “alien species”).
Invasive speciesAn introduced species that invades natural habitats.
Land useThe total of arrangements, activities, and inputs undertaken in a certain land cover type (a set of human actions). The social and economic purposes for which land is managed (e.g., grazing, timber extraction, and conservation).
Land-use changeA change in the use or management of land by humans, which may lead to a change in land cover. Land cover and land-use change may have an impact on the albedo, evapotranspiration, sources, and sinks of greenhouse gases, or other properties of the climate system, and may thus have an impact on climate, locally or globally.
LivelihoodsA combination of the resources used and the activities undertaken in order to live. The resources might consist of individual skills and abilities (human capital), land, savings and equipment (natural, financial, and physical capital, respectively) and formal support groups or informal networks that assist in the activities being undertaken (social capital).
Livelihood AssetsA key component in the SL framework, they are the assets on which livelihoods are built, and can be divided

103
CoDr
iVE-
PD –
A H
andb
ook
into five core categories (or types of capital). These are: human capital, natural capital, financial capital, social capital, and physical capital. People’s choice of livelihood strategies, as well as the degree of influence they have over policy, institutions and processes, depends partly upon the nature and mix of the assets they have available to them (see Livelihoods Asset Pentagon). Some combination of them is required by people to achieve positive livelihood outcomes – that is, to improve their quality of life significantly on a sustainable basis. No single category of assets on its own is sufficient to achieve this, but not all assets may be required in equal measure. It is important to note that a single asset can generate multiple benefits. For example, if someone has secure access to land (natural capital) they may also be able to get better access to financial capital, as they can use the land both for productive uses and as security for a loan.
Malaria A vector-borne disease transmitted by Anopheles mosquitoes and characterised by fever and chills. Peak time for transmission is monsoon and post monsoon seasons. Malaria is distributed all over India, especially in the forested areas of north-east and central India, but also in several urban and rural areas. It is typically not seen in higher altitude areas. The distribution of mosquitoes is dependent on climate.
MitigationAn anthropogenic intervention to reduce the sources or enhance the sinks of greenhouse gases.
Mitigative capacityThe social, political, and economic structures and conditions that are required for effective mitigation.
MonsoonWind in the general atmospheric circulation typified by a seasonal persistent wind direction and by a pronounced change in direction from one season to the next.
Mortality Deaths occurring in the community, which can be expressed as rates to indicate the health of the community
Natural CapitalNatural Capital is a category of livelihood assets. It is the term used for the natural resource stocks (e.g., trees, land, clean air, coastal resources) upon which people rely. The benefits of these stocks are both direct
and indirect. For example, land and trees provide direct benefits by contributing to income and people’s sense of well-being. The indirect benefits that they provide include nutrient cycling and protection from erosion and storms.
Physical CapitalPhysical Capital is a category of livelihood assets. It comprises the basic infrastructure and physical goods that support livelihoods. Infrastructure consists of changes to the physical environment that help people to meet their basic needs and to be more productive. Key components of infrastructure include: affordable transport systems, water supply and sanitation (of adequate quantity and quality), energy (that is both clean and affordable), good communications, and access to information. Shelter (of adequate quality and durability) is considered by some to be infrastructure, while others would consider it to be a private physical asset and somewhat different from infrastructure.
Other components of physical capital include productive capital that enhances income (e.g., bicycles, rickshaws, sewing machines, agricultural equipment), household goods and utensils, and personal consumption items such as radios and refrigerators. Most of these are owned by individuals or groups. Some, such as larger agricultural equipment or processing units, can be accessed through rental or by paying a fee for the services used.
Policies and measuresIn United Nations Framework Convention on Climate Change parlance, “policies” are actions that can be taken and/or mandated by a government – often in conjunction with business and industry within its own country, as well as with other countries – to accelerate the application and use of measures to curb greenhouse gas emissions. “Measures” are technologies, processes, and practices used to implement policies, which, if employed, would reduce greenhouse gas emissions below anticipated future levels. Examples might include carbon or other energy taxes, standardised fuel-efficiency standards for automobiles, etc. “Common and coordinated” or “harmonised” policies refer to those adopted jointly by parties.
Prevalence Measure of disease burden in a community.
Primary health care Essential health care based on practical, scientifically sound and socially acceptable methods and technology

104
made universally accessible to individuals and families in the community through their full participation and at a cost that the community and the country can afford to maintain at every stage of their development in the spirit of self-reliance and self-determination.
Quality of health care Health care as per the guidelines prescribed in the Indian Public Health Standards (IPHS) and subjectively by the experience of the patients.
ReforestationPlanting of forests on lands that have previously contained forests but that have been converted to some other use.
ResilienceAbility of a system to recover after a damaging impact.
ResourcesOccurrences with less certain geological and/or economic characteristics, but which are considered potentially recoverable with foreseeable technological and economic developments.
Response timeThe response time or adjustment time is the time needed for the climate system or its components to re-equilibrate to a new state, following a forcing resulting from external and internal processes or feedbacks. It is very different for various components of the climate system. The response time of the troposphere is relatively short, from days to weeks, whereas the stratosphere comes into equilibrium on a time scale of typically a few months. Due to their large heat capacity, the oceans have a much longer response time, typically decades, but up to centuries or millennia. The response time of the strongly coupled surface-troposphere system is, therefore, slow compared to that of the stratosphere, and mainly determined by the oceans. The biosphere may respond fast (e.g., to droughts), but also very slowly to imposed changes.
Risk factor Any attribute, characteristic or exposure of an individual that increases the likelihood of developing a disease or injury.
RunoffA part of precipitation that does not evaporate. In some countries, runoff implies surface runoff only.
SalinisationAccumulation of salts in soils.
Saltwater intrusion/encroachmentDisplacement of fresh surfacewater or groundwater by the advance of saltwater due to its greater density, usually in coastal and estuarine areas.
SeasonalitySeasonality is a key element in the vulnerability context. It refers to seasonal changes, such as those affecting: assets, activities, prices, production, health, employment opportunities, etc. Vulnerability arising from seasonality is often due to seasonal changes in the value and productivity of natural capital and human capital (through sickness, hunger, etc). The poor are often more vulnerable to these changes than wealthier groups.
Semi-arid regionsEcosystems that have more than 250 mm precipitation per year but are not highly productive; usually classified as rangelands.
SensitivitySensitivity is the degree to which a system is affected, either adversely or beneficially, by climate-related stimuli. The effect may be direct (e.g., a change in crop yield in response to a change in the mean, range, or variability of temperature) or indirect (e.g., damages caused by an increase in the frequency of coastal flooding due to sea-level rise).
Social CapitalA category of livelihood assets. It relates to the formal and informal social relationships (or social resources) from which various opportunities and benefits can be drawn by people in their pursuit of livelihoods. These social resources are developed through investment in:
interactions (through work or shared interests) that increase people’s ability to work together;
membership of more formal groups in which relationships are governed by accepted rules and norms;
relationships of trust that facilitate co-operation, reduce transactions costs and sometimes help in the development of informal safety nets amongst the poor.
Critical benefits of social capital are access to information, to influence or power, and claims or obligation for support from others.
105
CoDr
iVE-
PD –
A H
andb
ook
Social-ecological System (SES)Complex, integrated systems in which humans are part of nature. Evidence suggests that social-ecological systems act as strongly coupled, complex and evolving integrated systems. Berkes and Folke (1998) started to use the term to stress that the delineation between social and ecological systems is artificial and arbitrary.
Soil moistureWater stored in or at the land surface and available for evaporation.
Surface runoffThe water that travels over the soil surface to the nearest surface stream; runoff of a drainage basin that has not passed beneath the surface since precipitation.
Sustainable LivelihoodsA livelihood is sustainable when it is capable of continuously maintaining or enhancing the current standard of living without undermining the natural resource base. For this to happen it should be able to overcome and recover from stresses and shocks (e.g., natural disasters, or economic upsets).
Sustainable Livelihoods ApproachAn approach to development in which people’s livelihoods are the focus of attention and which adopts the core principles of the sustainable livelihoods approach.
Sustainable Livelihoods frameworkDFID’s sustainable livelihoods (SL) framework is its version of a visualisation tool that has been developed to help understand livelihoods. It is intended to help users think through the different aspects of livelihoods, and particularly those factors that cause problems or create opportunities. The SL framework can be divided into five key components: the Vulnerability Context; Livelihood Assets; Policy, Institutions and Processes; Livelihood Strategies and Livelihood Outcomes. The SL framework gives an impression of how these factors relate to each other. Indeed the links between them are also critical, reflecting how people convert assets to activities, or how policies, institutions and process affect the key components.
The framework aims to stimulate debate and reflection, which should result in more effective poverty reduction. The framework does not attempt
to provide an exact representation of reality. It is a simplification and it should be adapted for use in any given circumstance. Real livelihoods are complex and varied, and can only be properly understood through direct experience.
UncertaintyAn expression of the degree to which a value (e.g., the future state of the climate system) is unknown. Uncertainty can result from lack of information or from disagreement about what is known or even knowable. It may have many types of sources, from quantifiable errors in the data to ambiguously defined concepts or terminology, or uncertain projections of human behavior. Uncertainty can therefore be represented by quantitative measures (e.g., a range of values calculated by various models) or by qualitative statements (e.g., reflecting the judgment of a team of experts)
UrbanisationThe conversion of land from a natural state or managed natural state (such as agriculture) to cities; a process driven by net rural-to-urban migration through which an increasing percentage of the population in any nation or region come to live in settlements that are defined as “urban centres.”
Vector-borne disease Diseases that are transmitted by insect vector such as mosquitoes or flies. As vector populations are dependent on climate, their distribution would be affected by climate change.
VulnerabilityThe degree to which a system is susceptible to, or unable to cope with, adverse effects of climate change, including climate variability and extremes. Vulnerability is a function of the character, magnitude, and rate of climate variation to which a system is exposed, its sensitivity, and its adaptive capacity.
Vulnerable group That section of the community which may be disproportionately impacted due to an exposure (such as a extreme weather event). Usually, such groups are described by their demographic features (e.g., old persons), or by socio-economic status (e.g., poorer sections), or occupation (e.g., manual labourers).
Water stressA country is water-stressed if the available freshwater supply relative to water withdrawals
106
acts as an important constraint on development. Withdrawals exceeding 20 percent of renewable water supply has been used as an indicator of water stress.
Water-use efficiencyCarbon gain in photosynthesis per unit water lost in evapotranspiration. It can be expressed on
a short-term basis as the ratio of photosynthetic carbon gain per unit transpirational water loss, or on a seasonal basis as the ratio of net primary production or agricultural yield to the amount of available water.
Water withdrawalAmount of water extracted from water bodies.

Swiss Agency for Development and Cooperation (SDC), a directorate of the Swiss Federal Ministry of Foreign Affairs, is represented in India through the Climate Change and Development Division of the Embassy of Switzerland. The engagement of Swiss cooperation in India currently focusses on global public goods on climate change, with emphasis on maximising co-benefits of development, climate resilience, and reduced emission.
The strategic programme supports multi-stakeholder, inter-disciplinary, and multi-level partnerships. One of the key aspects of engagement relates to linking grassroots voices-experiences and lessons to policy debate and science, together with knowledge-sharing and south-south cooperation and exchanges. One of the main programmatic focuses of the Global Programme on Climate Change in India envisages support to enhancement of climate resilience of people and adaptive capacities of institutions, especially in the semi-arid and mountain areas.
Key elements of the strategies towards climate resilient development include facilitating policy dialogue to integrate climate risks into development plans at the state and national levels, capacity building on climate scenarios and adaptation planning together with promoting of vulnerability and capacity assessment towards enhancing resilience at the local level.
The Swiss Cooperation has joined hands with NABARD (National Bank for Agriculture and Rural Development) to support Watershed Organisation Trust to implement the Climate Change Adaptation programme in semi-arid areas of Maharashtra, Madhya Pradesh and Andhra Pradesh. The development, testing, and validation of the tool/methodology was supported by the Swiss Agency for Development and Cooperation, Embassy of Switzerland.
About SDC

Aware of the fragility of ecosystems and our symbiotic link with it, WOTR has historically applied a systems-based approach to watershed development, focussing on people-centric participatory interventions. With more-than-normal weather variations now being experienced, WOTR has moved into Ecosystem-Based Adaptation (EBA) – an emerging approach that helps vulnerable communities build resilience of their degraded ecosystems and livelihoods threatened by climate change impacts. This approach also generates significant multiple benefits – social, economic, and cultural.
Since 2008, WOTR has been reorienting, re-organising, and equipping itself with respect to focus, strategy, and interventions in order to specifically address the challenges (and opportunities) posed by climate change to vulnerable rural communities. In the process, WOTR has introduced a bottom-up, holistic and integrated approach with appropriate interventions, towards Adaptation and Resilience Building.
Constantly learning from experience, we have been rethinking conventional development. We have introduced Systems Thinking and Complexity Analysis in programme design and are developing strategies to incorporate these into action plans, leading to new tools and frameworks while adapting the existing ones. This helps us move to Framework-Based Management, in contrast to activity-based project design and management.
Applied Research is a constant companion. The WOTR team, guided by experts, helps local communities become researchers – observing, measuring, and assessing for themselves not only problems but also the improvements that a project brings about. And having tested methodologies, WOTR disseminates the learning through Capacity Building Events to reach implementers and donors far and wide, so as to benefit rural communities across India and countries in the south.
Since its inception in 1993, WOTR with partners has organised over 1,100 watershed development and climate adaptation projects covering nearly 700,000 hectares and impacting over a million people in six states. Over 100,000 women have benefited from its involvement in women’s Self Help Groups (SHGs), micro-finance, training, and other initiatives. Over 320,000 people from 27 states and 35 countries have participated in WOTR’s Training and Capacity Building programmes. At present, WOTR’s Climate Change Adaptation project is underway in 65 villages in three states, covering 41,000 hectares and benefitting 63,000 people from about 12,000 households.
The WOTR Group consists of four not-for-profit institutions – the Watershed Organisation Trust (WOTR); the Sampada Trust for women’s empowerment; the Sanjeevani Institute for Empowerment and Development (SIED), the implementation wing of WOTR; and the recently established Sampada Entrepreneurship and Livelihoods Foundation (SELF).
About WOTR


Developed by Supported by
About CoDriVE –Programme Designer Climate change is already creating a host of problems for rural communities especially those dependent on climate sensitive livelihoods such as agriculture, herding, fishing, forest produce gathering, to name a few. For planners, development practitioners and researchers the challenge is to understand how a community may be vulnerable to climate change and why. With this knowledge and information, communities can be mobilised to undertake measures that help them adapt to climate change, reduce its impacts and avoid development patterns/ mal-adaptation that may make communities more vulnerable at a later date.
Toward this end, WOTR has developed a new tool called “CoDriVE – PD” which stands for Community Driven Vulnerability Evaluation - Programme Designer, based on over two decades of developmental experience in India.
CoDriVE-PD is a recombinant tool developed by converging key aspects of three well known international research methodologies and is built on the “5 Livelihood Capitals Framework”. It adopts a systems thinking approach which uncovers interrelationships and interdependencies between them, and generates a quantitative vulnerability code that grades their vulnerability to climate impacts; enabling both communities, planners and practitioners to prioritise and plan for adaptive measures and interventions.
CoDriVE-PD can be used in a wide range of social, economic and agro-ecological contexts in developing countries.
In order to support easy and large-scale application of CoDriVE-PD, a web-based software program is being developed to process and analyse key data of a community with a view to generating a vulnerability profile and suggest situation-specific adaptive actions that may be undertaken. This is a work in progress and as WOTR (and others) apply CoDriVE-PD across geographies and communities, these case studies (and refinements to the tool) will be shared and widely disseminated.