program name or ancillary texteere.energy.gov u.s. assessment approaches and resources michaela...
TRANSCRIPT
Program Name or Ancillary Text eere.energy.gov
U.S. Assessment Approachesand ResourcesU.S. Assessment Approachesand Resources
Michaela Martin, PEProgram ManagerSave Energy Now InitiativeOak Ridge National Laboratory
U.S.-Brazil Industrial Energy Efficiency WorkshopRio de Janeiro, Brazil August 8-11, 2011
2 | Industrial Energy Efficiency eere.energy.gov
Discussion Overview
• Targeting Energy End-Uses and Savings Potential• U.S. DOE Assessments
– Crosscutting – System-specific
• Assessment Resources– Experts– QuickPEP, or ePEP– Assessment Standards
• Large Plant Assessment Results• Compressed Air Assessments (Dr. Kissock)• Process Heating Assessments (Dr. Muller)
3 | Industrial Energy Efficiency eere.energy.gov
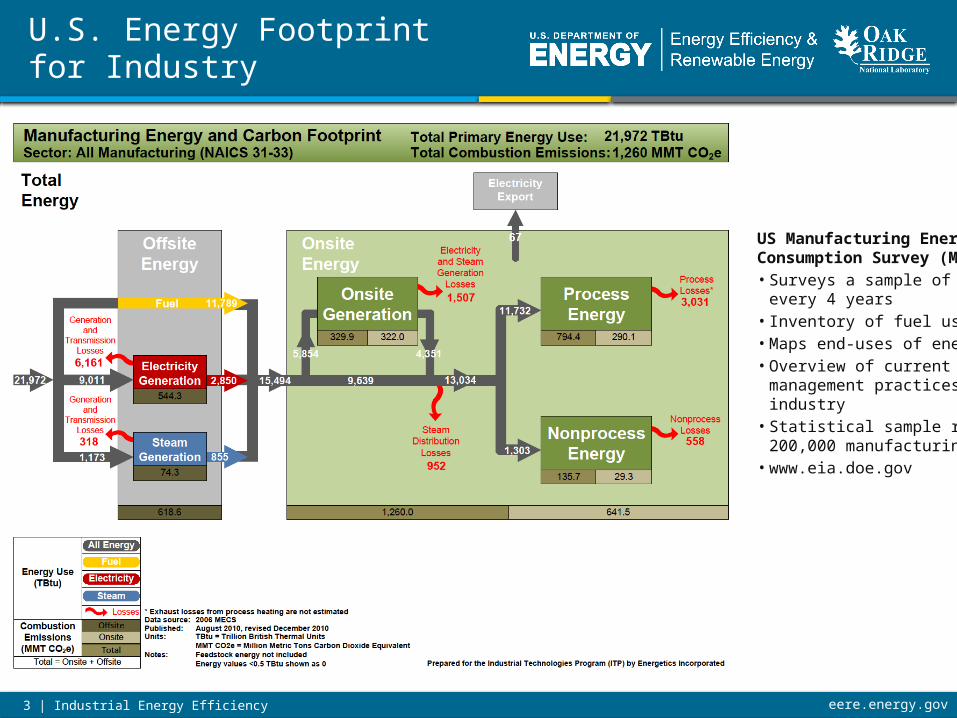
U.S. Energy Footprint for Industry
US Manufacturing Energy Consumption Survey (MECS)• Surveys a sample of US plants
every 4 years• Inventory of fuel usage• Maps end-uses of energy• Overview of current energy
management practices by US industry
• Statistical sample representing 200,000 manufacturing plants
• www.eia.doe.gov
4 | Industrial Energy Efficiency eere.energy.gov
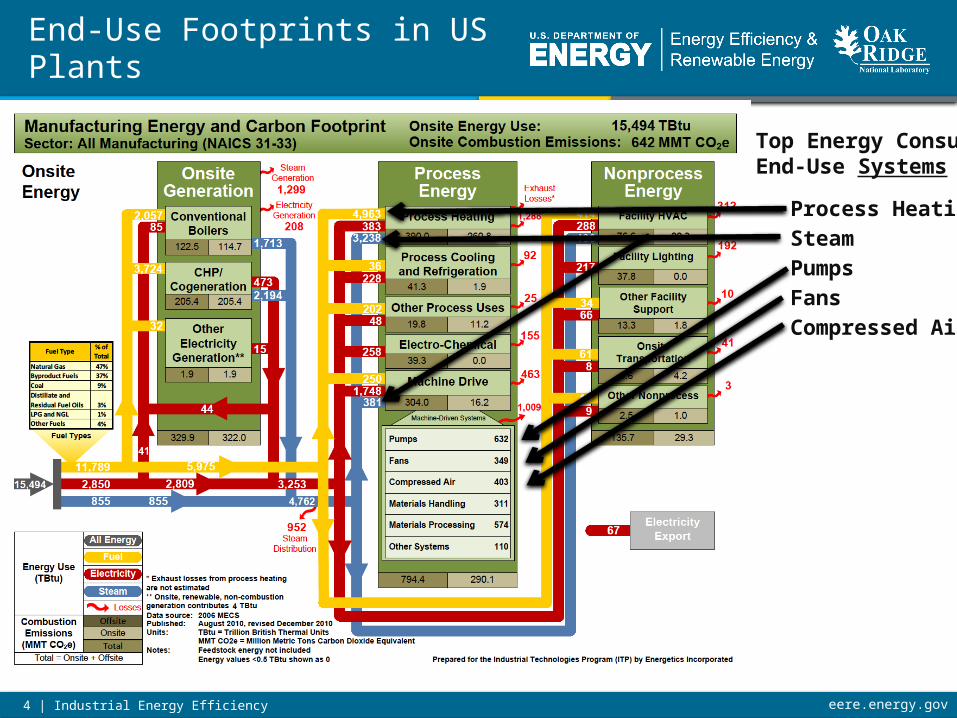
End-Use Footprints in US Plants
Process HeatingSteamPumpsFansCompressed Air
Top Energy Consuming End-Use Systems
5 | Industrial Energy Efficiency eere.energy.gov
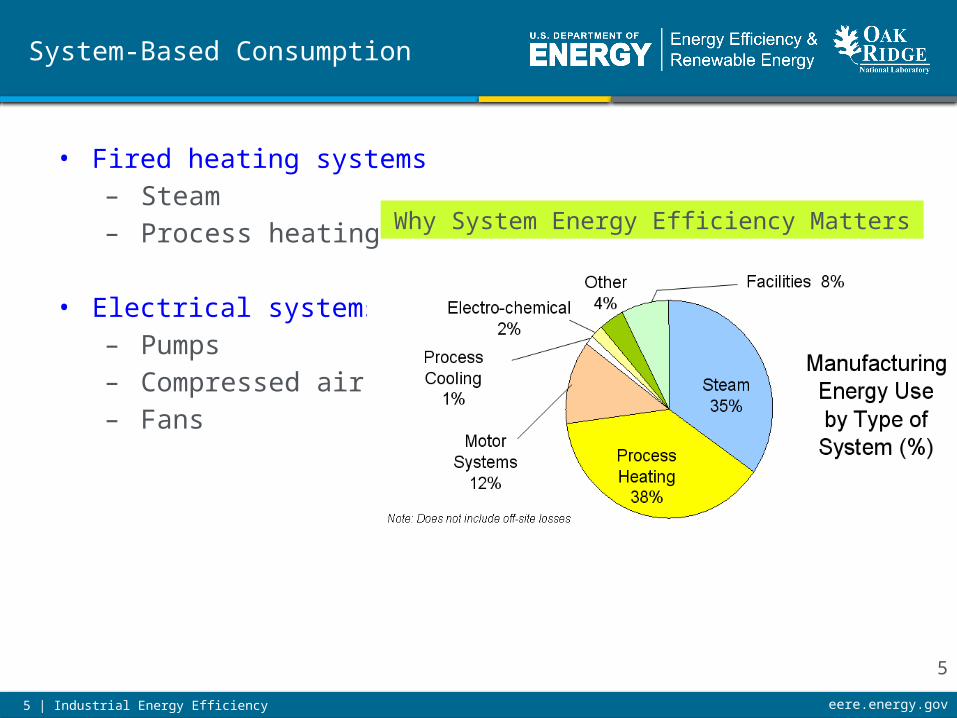
System-Based Consumption
• Fired heating systems– Steam– Process heating
• Electrical systems– Pumps– Compressed air– Fans
Why System Energy Efficiency Matters
5
6 | Industrial Energy Efficiency eere.energy.gov
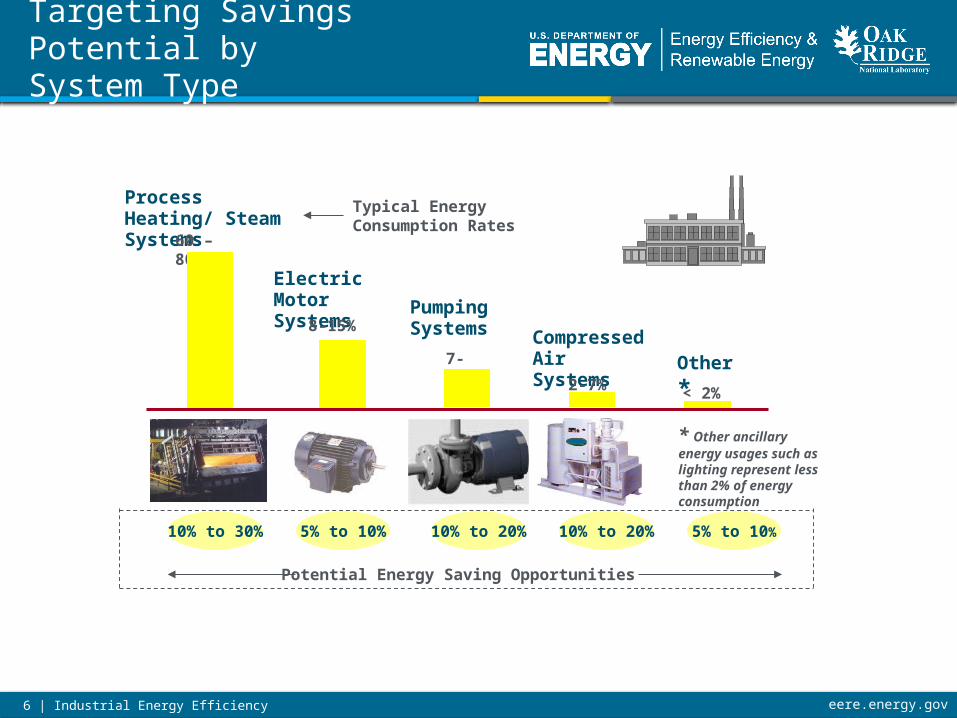
Targeting Savings Potential by System Type
Potential Energy Saving Opportunities
Typical Energy Consumption Rates
* Other ancillary energy usages such as lighting represent less than 2% of energy consumption
Process Heating/ Steam Systems
60 – 80%
Electric MotorSystems
8-15%Pumping Systems
7-15%CompressedAir Systems
2-7%Other*< 2%
10% to 30% 5% to 10% 10% to 20% 10% to 20% 5% to 10%

7 | Industrial Energy Efficiency eere.energy.gov
Percent of Total U.S. Manufacturing Energy
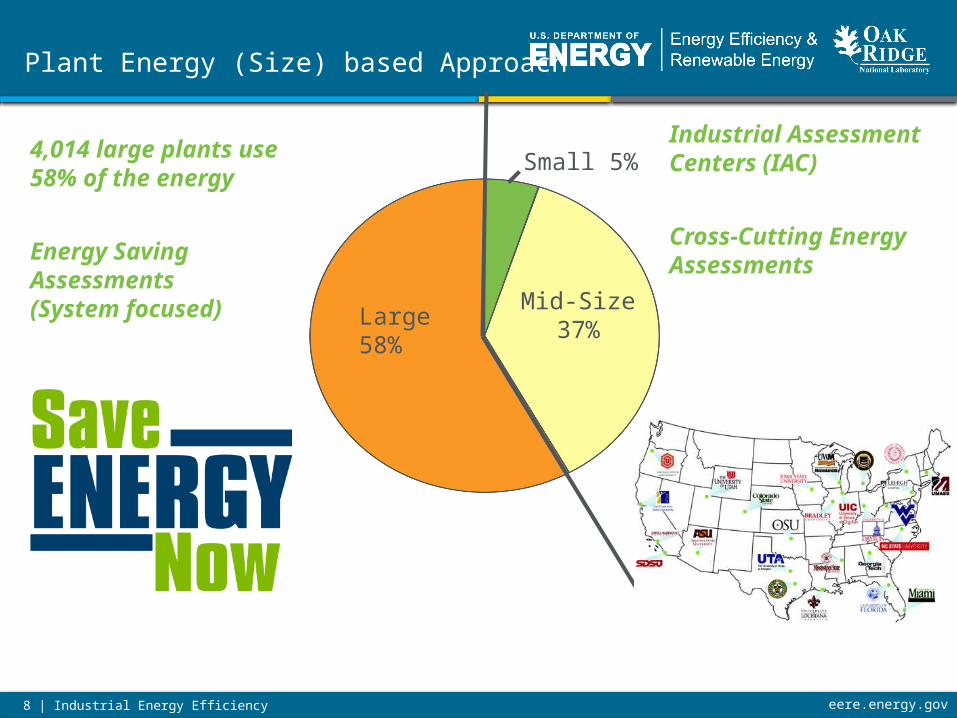
Small 5%
Mid-Size37%
Large58%
0
50000
100000
150000
200000
250000
U.S. Manufacturing Plants: By Size
Small Plants
Mid-Size Plants
Large Plants
Num
ber
of U
.S.
Pla
nts
All Plants
84,298112,398
4,014
200,710
ITP uses two types of general assessment
approaches, to meet the needs of plants of all sizes.
System-Specific Assessments >>0.5 TBtu/yr
Crosscutting Assessments
0.026 – 0.49 Tbtu/yr
Industrial Energy Assessments
8 | Industrial Energy Efficiency eere.energy.gov
Mid-Size37%
Large58%
Small 5%Industrial Assessment Centers (IAC)
Cross-Cutting Energy Assessments
Plant Energy (Size) based Approach
4,014 large plants use 58% of the energy
Energy Saving Assessments (System focused)
9 | Industrial Energy Efficiency eere.energy.gov
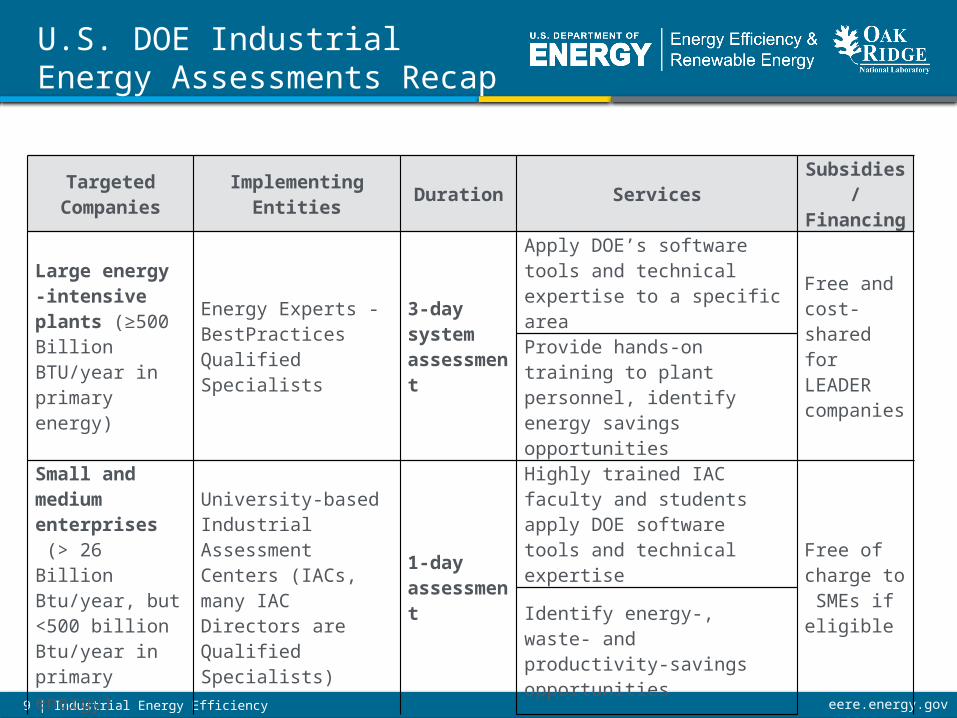
Targeted Companies Implementing Entities Duration Services Subsidies/
Financing
Large energy -intensive plants (≥500 Billion BTU/year in primary energy)
Energy Experts - BestPractices Qualified Specialists
3-day system assessment
Apply DOE’s software tools and technical expertise to a specific area
Free and cost-shared for LEADER companies
Provide hands-on training to plant personnel, identify energy savings opportunities
Small and medium enterprises (> 26 Billion Btu/year, but <500 billion Btu/year in primary energy)
University-based Industrial Assessment Centers (IACs, many IAC Directors are Qualified Specialists)
1-day assessment
Highly trained IAC faculty and students apply DOE software tools and technical expertise
Free of charge to SMEs if eligible Identify energy-, waste- and
productivity-savings opportunities
U.S. DOE Industrial Energy Assessments Recap
10 | Industrial Energy Efficiency eere.energy.gov
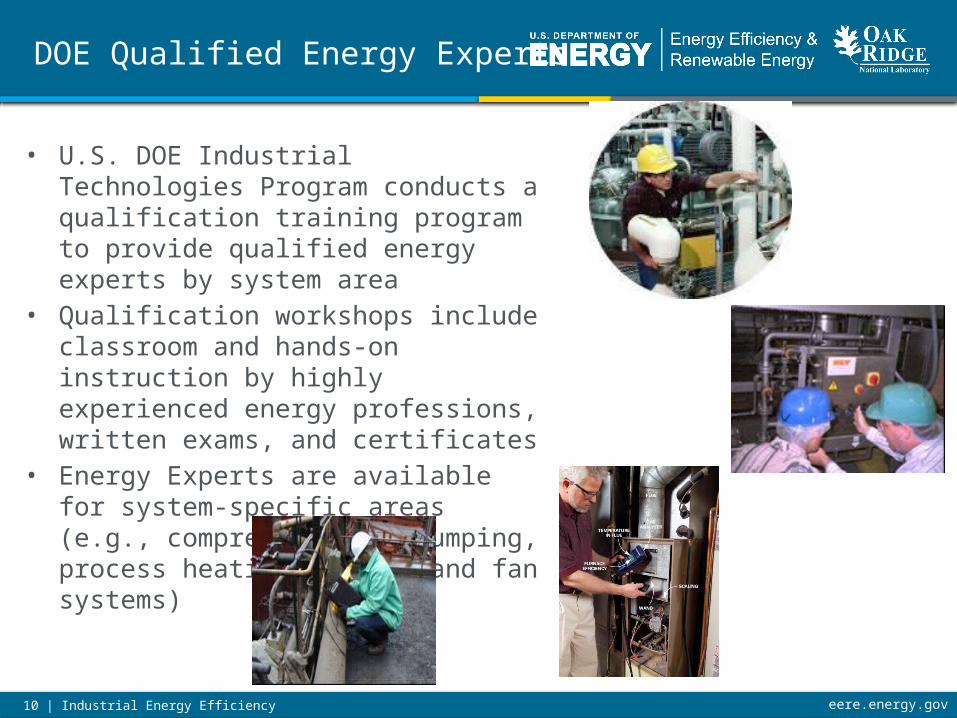
• U.S. DOE Industrial Technologies Program conducts a qualification training program to provide qualified energy experts by system area
• Qualification workshops include classroom and hands-on instruction by highly experienced energy professions, written exams, and certificates
• Energy Experts are available for system-specific areas (e.g., compressed air, pumping, process heating, steam, and fan systems)
DOE Qualified Energy Experts
11 | Industrial Energy Efficiency eere.energy.gov
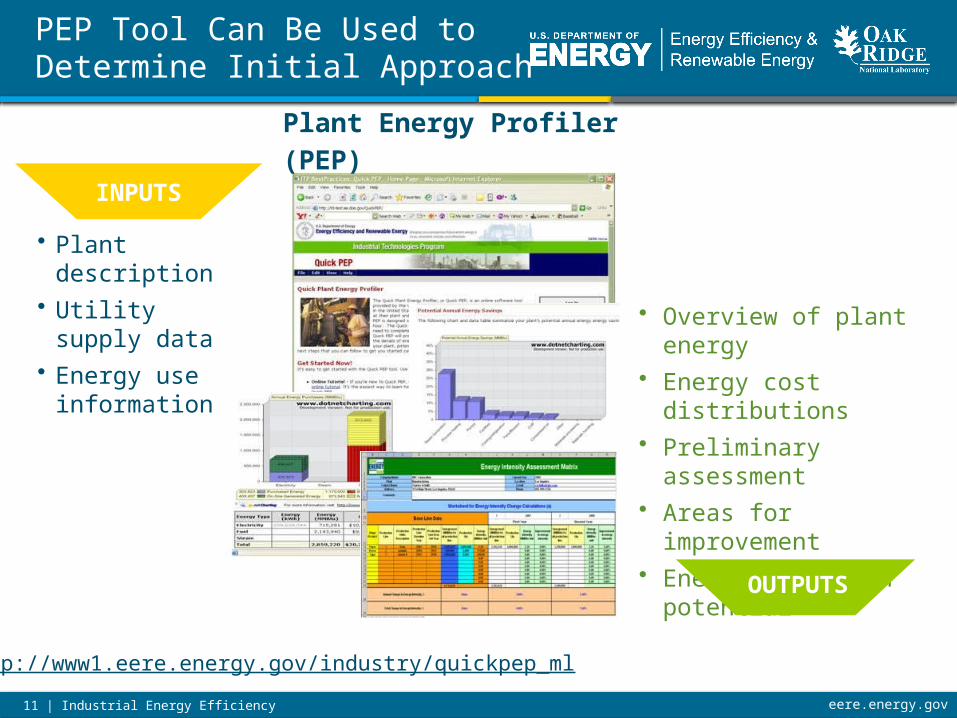
• Plant description• Utility supply data• Energy use
information
• Overview of plant energy• Energy cost distributions• Preliminary assessment• Areas for improvement• Energy reduction potential
INPUTS
http://www1.eere.energy.gov/industry/quickpep_ml
OUTPUTS
Plant Energy Profiler (PEP)
PEP Tool Can Be Used to Determine Initial Approach

12 | Industrial Energy Efficiency eere.energy.gov
ASMESystem Assessment Standards
• Developed by US energy experts from utilities, industry, DOE, university IACs, national labs, consulting organizations
• Based on DOE’s system-based approach• Provides comprehensive approach for holistic assessments of
energy-intensive systems:– Pumping– Compressed Air– Steam– Process Heating
• Sets requirements for • organizing and conducting assessments• collecting and analyzing data• reporting results
• Standards and Guidance Documents available at:http://www.asme.org/kb/standards#des=EA
13 | Industrial Energy Efficiency eere.energy.gov
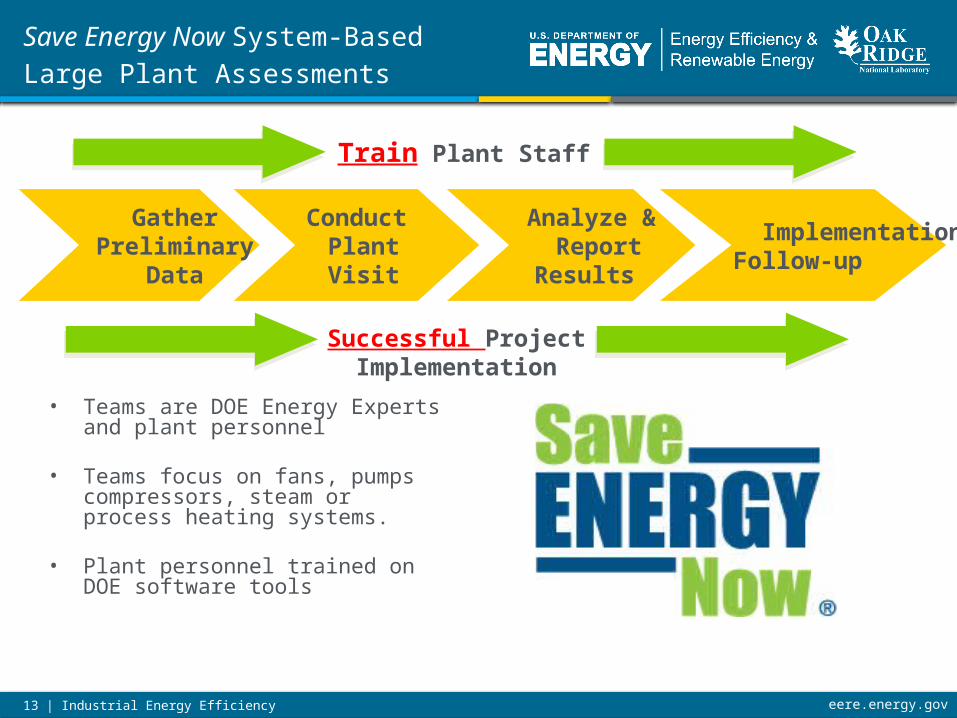
Save Energy Now System-BasedLarge Plant Assessments
Conduct Plant Visit
Analyze & Report Results
GatherPreliminary
Data
Implementation Follow-up
Train Plant Staff
• Teams are DOE Energy Experts and plant personnel
• Teams focus on fans, pumps compressors, steam or process heating systems.
• Plant personnel trained on DOE software tools
Successful Project Implementation
14 | Industrial Energy Efficiency eere.energy.gov
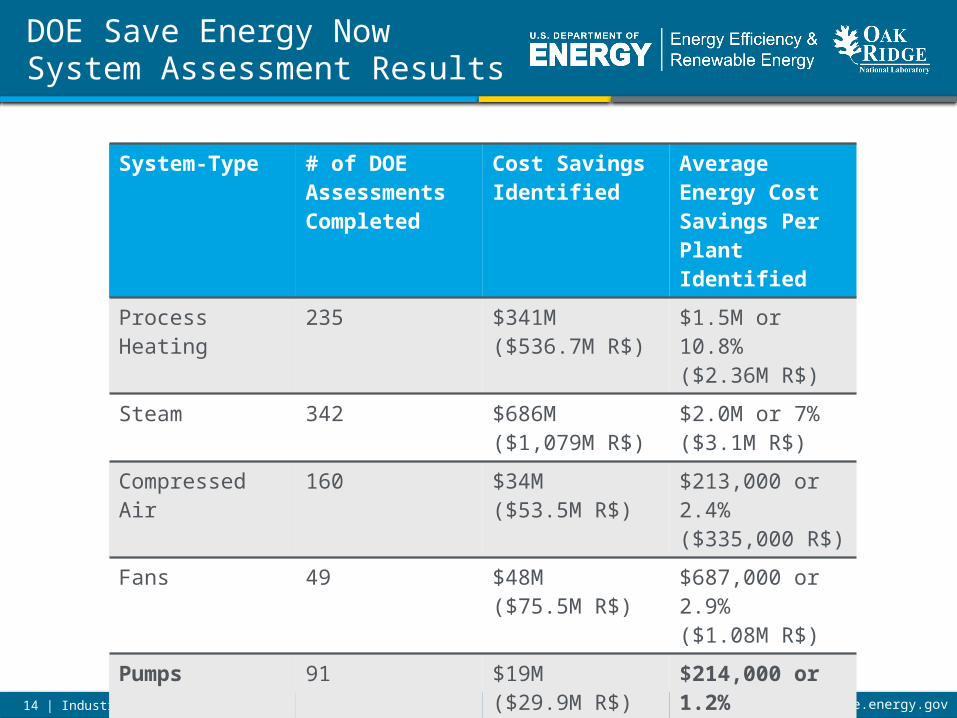
System-Type # of DOE Assessments Completed
Cost Savings Identified
Average Energy Cost Savings Per Plant Identified
Process Heating 235 $341M($536.7M R$)
$1.5M or 10.8%($2.36M R$)
Steam 342 $686M($1,079M R$)
$2.0M or 7%($3.1M R$)
Compressed Air 160 $34M($53.5M R$)
$213,000 or 2.4%($335,000 R$)
Fans 49 $48M($75.5M R$)
$687,000 or 2.9%($1.08M R$)
Pumps 91 $19M($29.9M R$)
$214,000 or 1.2%($336,800 R$)
DOE Save Energy Now System Assessment Results
15 | Industrial Energy Efficiency eere.energy.gov
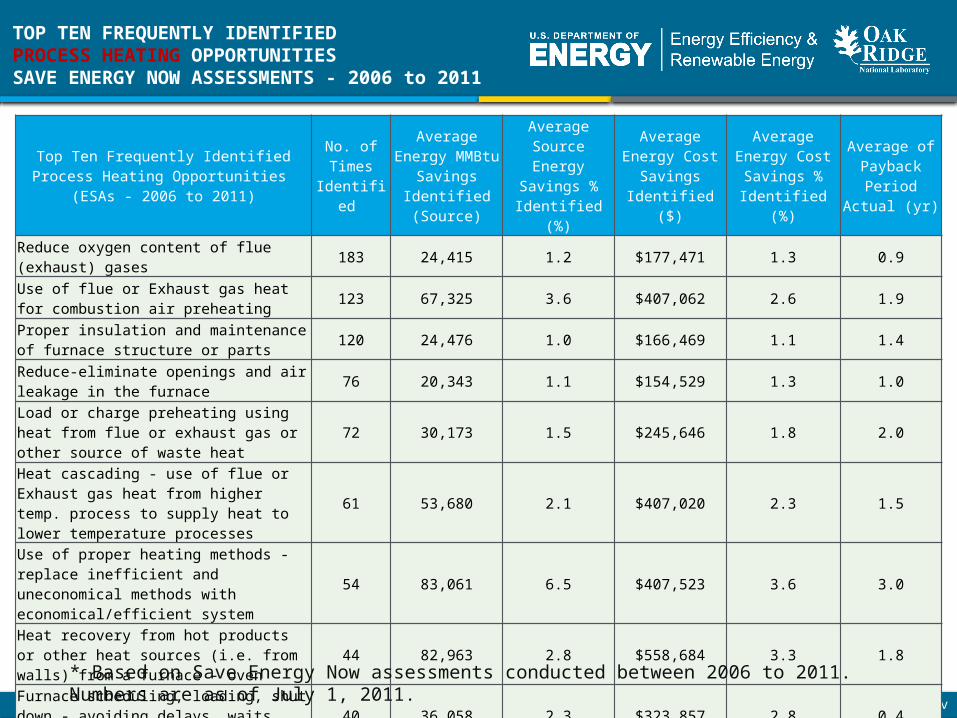
TOP TEN FREQUENTLY IDENTIFIED PROCESS HEATING OPPORTUNITIESSAVE ENERGY NOW ASSESSMENTS - 2006 to 2011
Top Ten Frequently Identified Process Heating Opportunities
(ESAs - 2006 to 2011)No. of Times
Identified Average Energy MMBtu Savings
Identified (Source)
Average Source Energy Savings %
Identified (%)
Average Energy Cost Savings Identified ($)
Average Energy Cost Savings % Identified (%)
Average of Payback Period
Actual (yr)
Reduce oxygen content of flue (exhaust) gases 183 24,415 1.2 $177,471 1.3 0.9
Use of flue or Exhaust gas heat for combustion air preheating 123 67,325 3.6 $407,062 2.6 1.9
Proper insulation and maintenance of furnace structure or parts 120 24,476 1.0 $166,469 1.1 1.4
Reduce-eliminate openings and air leakage in the furnace 76 20,343 1.1 $154,529 1.3 1.0
Load or charge preheating using heat from flue or exhaust gas or other source of waste heat 72 30,173 1.5 $245,646 1.8 2.0
Heat cascading - use of flue or Exhaust gas heat from higher temp. process to supply heat to lower temperature processes
61 53,680 2.1 $407,020 2.3 1.5
Use of proper heating methods - replace inefficient and uneconomical methods with economical/efficient system
54 83,061 6.5 $407,523 3.6 3.0
Heat recovery from hot products or other heat sources (i.e. from walls) from a furnace - oven 44 82,963 2.8 $558,684 3.3 1.8
Furnace scheduling, loading, shut down - avoiding delays, waits, cooling between operations etc.
40 36,058 2.3 $323,857 2.8 0.4
Use of oxygen for combustion 37 85,949 2.6 $598,268 3.2 1.9
* Based on Save Energy Now assessments conducted between 2006 to 2011. Numbers are as of July 1, 2011.
16 | Industrial Energy Efficiency eere.energy.gov
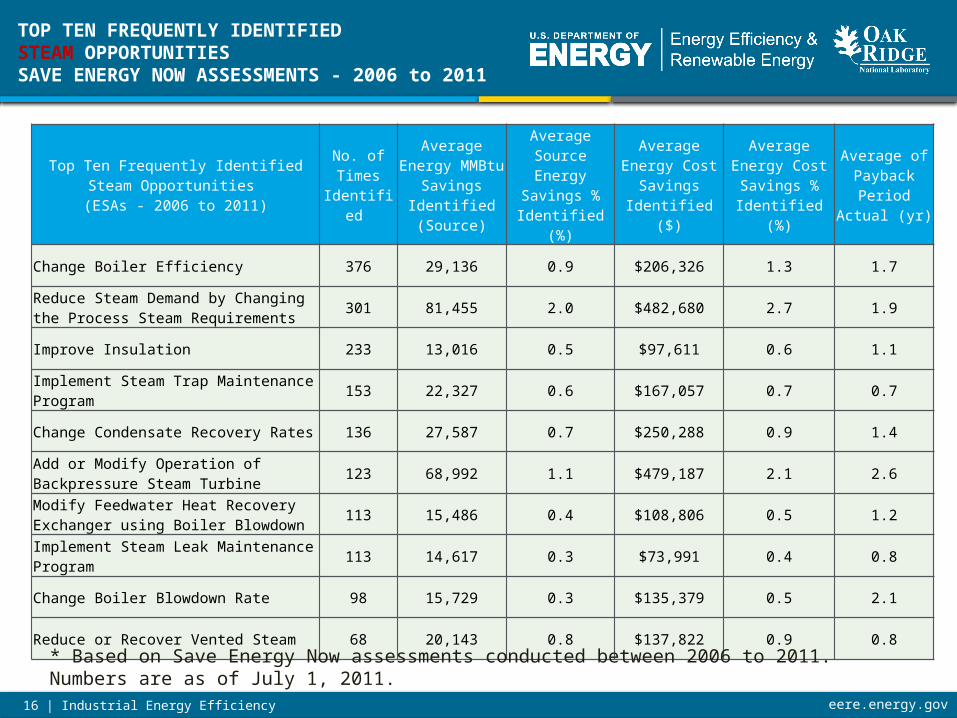
Top Ten Frequently Identified Steam Opportunities
(ESAs - 2006 to 2011)No. of Times
Identified
Average Energy MMBtu Savings
Identified (Source)
Average Source Energy Savings %
Identified (%)
Average Energy Cost Savings Identified ($)
Average Energy Cost Savings % Identified (%)
Average of Payback Period
Actual (yr)
Change Boiler Efficiency 376 29,136 0.9 $206,326 1.3 1.7
Reduce Steam Demand by Changing the Process Steam Requirements 301 81,455 2.0 $482,680 2.7 1.9
Improve Insulation 233 13,016 0.5 $97,611 0.6 1.1
Implement Steam Trap Maintenance Program 153 22,327 0.6 $167,057 0.7 0.7
Change Condensate Recovery Rates 136 27,587 0.7 $250,288 0.9 1.4
Add or Modify Operation of Backpressure Steam Turbine 123 68,992 1.1 $479,187 2.1 2.6
Modify Feedwater Heat Recovery Exchanger using Boiler Blowdown 113 15,486 0.4 $108,806 0.5 1.2
Implement Steam Leak Maintenance Program 113 14,617 0.3 $73,991 0.4 0.8
Change Boiler Blowdown Rate 98 15,729 0.3 $135,379 0.5 2.1
Reduce or Recover Vented Steam 68 20,143 0.8 $137,822 0.9 0.8
* Based on Save Energy Now assessments conducted between 2006 to 2011. Numbers are as of July 1, 2011.
TOP TEN FREQUENTLY IDENTIFIED STEAM OPPORTUNITIESSAVE ENERGY NOW ASSESSMENTS - 2006 to 2011
17 | Industrial Energy Efficiency eere.energy.gov
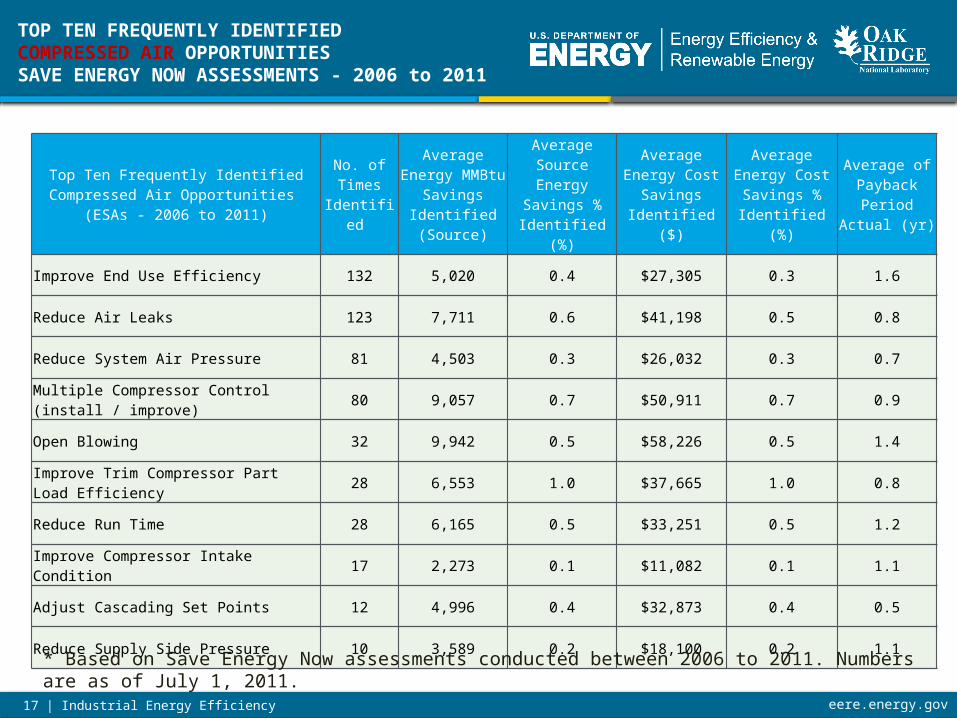
Top Ten Frequently Identified Compressed Air Opportunities
(ESAs - 2006 to 2011)No. of Times
Identified
Average Energy MMBtu Savings
Identified (Source)
Average Source Energy Savings %
Identified (%)
Average Energy Cost Savings Identified ($)
Average Energy Cost Savings % Identified (%)
Average of Payback Period
Actual (yr)
Improve End Use Efficiency 132 5,020 0.4 $27,305 0.3 1.6
Reduce Air Leaks 123 7,711 0.6 $41,198 0.5 0.8
Reduce System Air Pressure 81 4,503 0.3 $26,032 0.3 0.7
Multiple Compressor Control (install / improve) 80 9,057 0.7 $50,911 0.7 0.9
Open Blowing 32 9,942 0.5 $58,226 0.5 1.4
Improve Trim Compressor Part Load Efficiency 28 6,553 1.0 $37,665 1.0 0.8
Reduce Run Time 28 6,165 0.5 $33,251 0.5 1.2
Improve Compressor Intake Condition 17 2,273 0.1 $11,082 0.1 1.1
Adjust Cascading Set Points 12 4,996 0.4 $32,873 0.4 0.5
Reduce Supply Side Pressure 10 3,589 0.2 $18,100 0.2 1.1
* Based on Save Energy Now assessments conducted between 2006 to 2011. Numbers are as of July 1, 2011.
TOP TEN FREQUENTLY IDENTIFIED COMPRESSED AIR OPPORTUNITIESSAVE ENERGY NOW ASSESSMENTS - 2006 to 2011

18 | Industrial Energy Efficiency eere.energy.gov
Top Ten Frequently Identified Pump Opportunities
(ESAs - 2006 to 2011)No. of Times
Identified
Average Energy MMBtu Savings
Identified (Source)
Average Source Energy Savings %
Identified (%)
Average Energy Cost Savings Identified ($)
Average Energy Cost Savings % Identified (%)
Average of Payback Period
Actual (yr)
Excessive valve friction loss all of the time 83 11,629 0.2 $55,878 0.3 1.6
Less than optimal equipment for the application 58 7,611 0.2 $42,107 0.2 3.3
More flow than required to meet system requirements 50 6,161 0.3 $35,012 0.2 1.4
Excessive valve friction loss part of the time 31 10,114 0.3 $56,864 0.3 3.3
Excessive recirculation 26 7,012 0.3 $40,893 0.3 1.5
Degraded equipment performance 15 6,242 0.6 $44,321 0.6 3.3
Unneeded flow path 9 3,088 0.1 $20,373 0.1 2.0
Change time of use 7 7,314 0.2 $52,650 0.2 0.8
Excessive friction loss due to system design 4 8,589 0.3 $51,794 0.2 1.0
System specs exceed system requirements 4 7,843 0.2 $51,723 0.1 0.3
* Based on Save Energy Now assessments conducted between 2006 to 2011. Numbers are as of July 1, 2011.
TOP TEN FREQUENTLY IDENTIFIED PUMPING SYSTEM OPPORTUNITIESSAVE ENERGY NOW ASSESSMENTS - 2006 to 2011
19 | Industrial Energy Efficiency eere.energy.gov
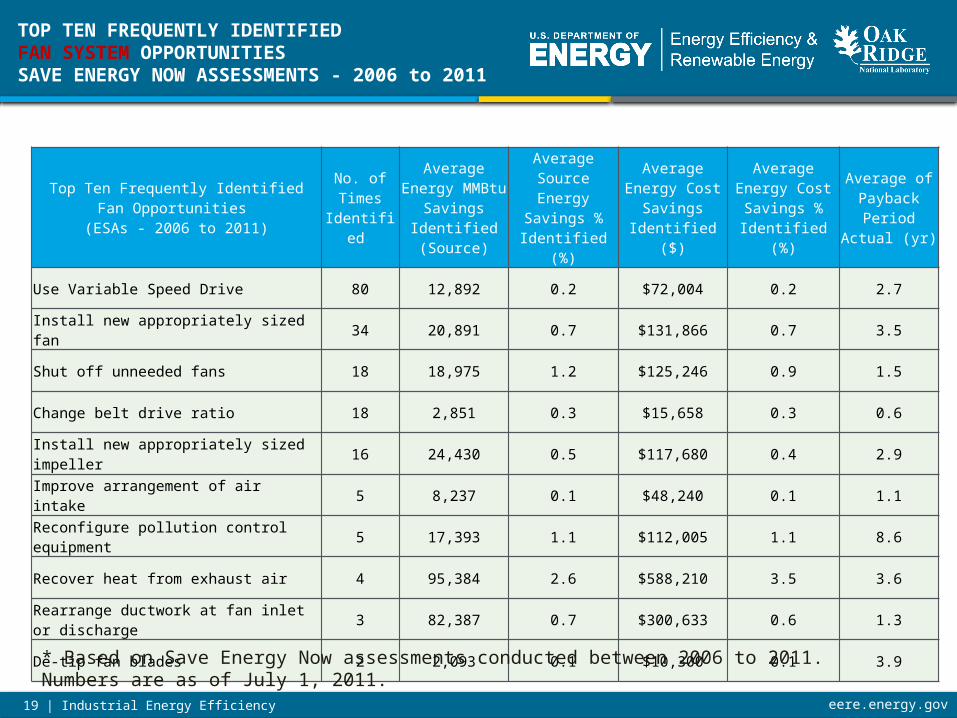
Top Ten Frequently Identified Fan Opportunities (ESAs - 2006 to 2011)
No. of Times Identified
Average Energy MMBtu Savings
Identified (Source)
Average Source Energy Savings %
Identified (%)
Average Energy Cost Savings Identified ($)
Average Energy Cost Savings % Identified (%)
Average of Payback Period
Actual (yr)
Use Variable Speed Drive 80 12,892 0.2 $72,004 0.2 2.7
Install new appropriately sized fan 34 20,891 0.7 $131,866 0.7 3.5
Shut off unneeded fans 18 18,975 1.2 $125,246 0.9 1.5
Change belt drive ratio 18 2,851 0.3 $15,658 0.3 0.6
Install new appropriately sized impeller 16 24,430 0.5 $117,680 0.4 2.9
Improve arrangement of air intake 5 8,237 0.1 $48,240 0.1 1.1
Reconfigure pollution control equipment 5 17,393 1.1 $112,005 1.1 8.6
Recover heat from exhaust air 4 95,384 2.6 $588,210 3.5 3.6
Rearrange ductwork at fan inlet or discharge 3 82,387 0.7 $300,633 0.6 1.3
De-tip fan blades 2 2,093 0.1 $10,300 0.1 3.9
* Based on Save Energy Now assessments conducted between 2006 to 2011. Numbers are as of July 1, 2011.
TOP TEN FREQUENTLY IDENTIFIED FAN SYSTEM OPPORTUNITIESSAVE ENERGY NOW ASSESSMENTS - 2006 to 2011
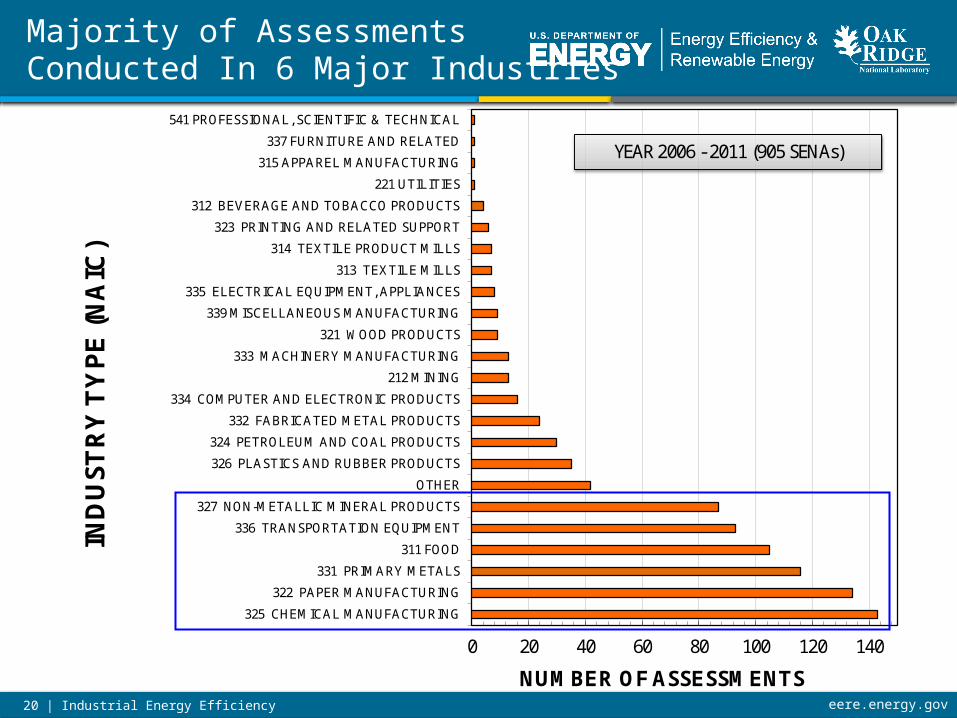
20 | Industrial Energy Efficiency eere.energy.gov
0 20 40 60 80 100 120 140
325 CHEMICAL MANUFACTURING
322 PAPER MANUFACTURING
331 PRIMARY METALS
311 FOOD
336 TRANSPORTATION EQUIPMENT
327 NON-METALLIC MINERAL PRODUCTS
OTHER
326 PLASTICS AND RUBBER PRODUCTS
324 PETROLEUM AND COAL PRODUCTS
332 FABRICATED METAL PRODUCTS
334 COMPUTER AND ELECTRONIC PRODUCTS
212 MINING
333 MACHINERY MANUFACTURING
321 WOOD PRODUCTS
339 MISCELLANEOUS MANUFACTURING
335 ELECTRICAL EQUIPMENT, APPLIANCES
313 TEXTILE MILLS
314 TEXTILE PRODUCT MILLS
323 PRINTING AND RELATED SUPPORT
312 BEVERAGE AND TOBACCO PRODUCTS
221 UTILITIES
315 APPAREL MANUFACTURING
337 FURNITURE AND RELATED
541 PROFESSIONAL, SCIENTIFIC & TECHNICAL
NUMBER OF ASSESSMENTS
IND
US
TR
Y T
YP
E (
NA
IC)
YEAR 2006 - 2011 (905 SENAs)
Majority of Assessments Conducted In 6 Major Industries

21 | Industrial Energy Efficiency eere.energy.gov
TOP TEN FREQUENTLY IDENTIFIED OPPORTUNITIES FOR IRON & STEEL INDUSTRY 2006 to 2011
Top Ten Frequently Identified Opportunities for Iron & Steel Industry(ESAs - 2006 to 2011)
No. of Times Identified
Average Energy MMBtu Savings
Identified (Source)
Average Source Energy Savings %
Identified (%)
Average Energy Cost Savings Identified ($)
Average Energy Cost Savings % Identified (%)
Average of Payback Period
Actual (yr)
Reduce oxygen content of flue (exhaust) gases 54 33,744 1.5 $274,078 1.6 1.4
Use of flue or Exhaust gas heat for combustion air preheating 43 134,780 6.5 $798,774 3.4 1.4
Proper insulation and maintenance of furnace structure or parts 35 41,153 0.6 $317,627 0.8 1.3
Reduce-eliminate openings and air leakage in the furnace 28 22,488 1.2 $174,128 1.4 0.9
Load or charge preheating using heat from flue or exhaust gas or other source of waste heat 23 38,522 1.8 $316,448 2.0 1.6
Furnace scheduling, loading, shut down - avoiding delays, waits, cooling between operations etc.
23 54,782 2.5 $489,121 3.2 0.5
Improve End Use Efficiency 20 3,169 0.2 $14,457 0.2 2.0
Use of proper heating methods - replace inefficient and uneconomical methods with economical/efficient system
19 165,900 12.5 $549,849 3.7 3.3
Improve Insulation 16 25,138 0.2 $209,888 0.4 1.0
Reduce Steam Demand by Changing the Process Steam Requirements 14 101,807 0.7 $479,250 0.8 1.2
* Based on Save Energy Now assessments conducted between 2006 to 2011. Numbers are as of July 1, 2011.
22 | Industrial Energy Efficiency eere.energy.gov
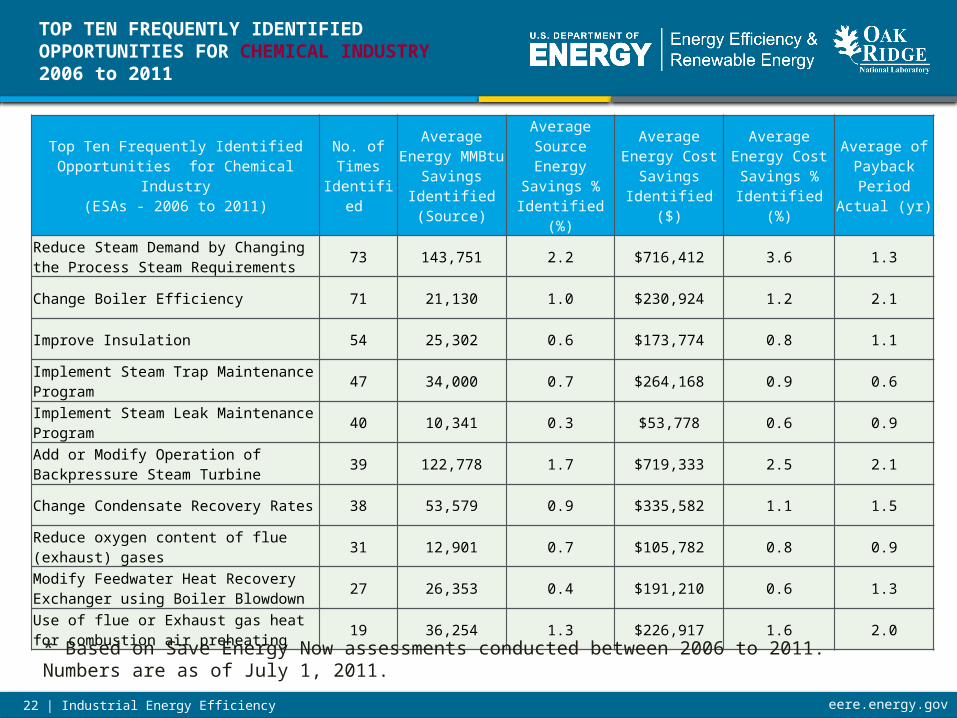
Top Ten Frequently Identified Opportunities for Chemical Industry
(ESAs - 2006 to 2011)No. of Times
Identified
Average Energy MMBtu Savings
Identified (Source)
Average Source Energy Savings %
Identified (%)
Average Energy Cost Savings Identified ($)
Average Energy Cost Savings % Identified (%)
Average of Payback Period
Actual (yr)
Reduce Steam Demand by Changing the Process Steam Requirements 73 143,751 2.2 $716,412 3.6 1.3
Change Boiler Efficiency 71 21,130 1.0 $230,924 1.2 2.1
Improve Insulation 54 25,302 0.6 $173,774 0.8 1.1
Implement Steam Trap Maintenance Program 47 34,000 0.7 $264,168 0.9 0.6
Implement Steam Leak Maintenance Program 40 10,341 0.3 $53,778 0.6 0.9
Add or Modify Operation of Backpressure Steam Turbine 39 122,778 1.7 $719,333 2.5 2.1
Change Condensate Recovery Rates 38 53,579 0.9 $335,582 1.1 1.5
Reduce oxygen content of flue (exhaust) gases 31 12,901 0.7 $105,782 0.8 0.9
Modify Feedwater Heat Recovery Exchanger using Boiler Blowdown 27 26,353 0.4 $191,210 0.6 1.3
Use of flue or Exhaust gas heat for combustion air preheating 19 36,254 1.3 $226,917 1.6 2.0
* Based on Save Energy Now assessments conducted between 2006 to 2011. Numbers are as of July 1, 2011.
TOP TEN FREQUENTLY IDENTIFIED OPPORTUNITIES FOR CHEMICAL INDUSTRY 2006 to 2011
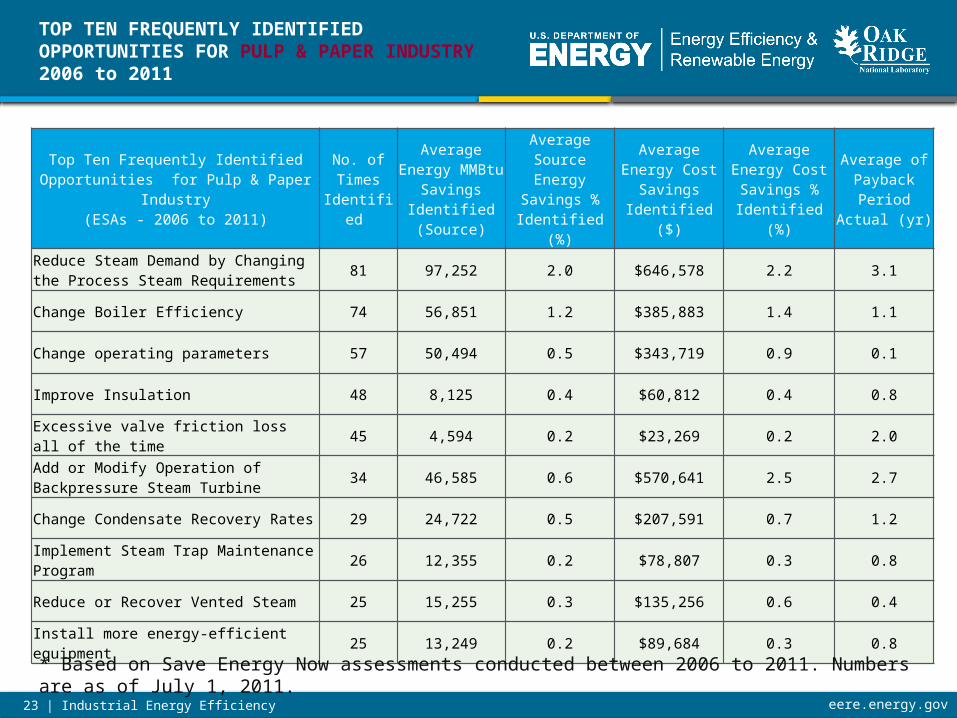
23 | Industrial Energy Efficiency eere.energy.gov
Top Ten Frequently Identified Opportunities for Pulp & Paper Industry(ESAs - 2006 to 2011)
No. of Times Identified
Average Energy MMBtu Savings
Identified (Source)
Average Source Energy Savings %
Identified (%)
Average Energy Cost Savings Identified ($)
Average Energy Cost Savings % Identified (%)
Average of Payback Period
Actual (yr)
Reduce Steam Demand by Changing the Process Steam Requirements 81 97,252 2.0 $646,578 2.2 3.1
Change Boiler Efficiency 74 56,851 1.2 $385,883 1.4 1.1
Change operating parameters 57 50,494 0.5 $343,719 0.9 0.1
Improve Insulation 48 8,125 0.4 $60,812 0.4 0.8
Excessive valve friction loss all of the time 45 4,594 0.2 $23,269 0.2 2.0
Add or Modify Operation of Backpressure Steam Turbine 34 46,585 0.6 $570,641 2.5 2.7
Change Condensate Recovery Rates 29 24,722 0.5 $207,591 0.7 1.2
Implement Steam Trap Maintenance Program 26 12,355 0.2 $78,807 0.3 0.8
Reduce or Recover Vented Steam 25 15,255 0.3 $135,256 0.6 0.4
Install more energy-efficient equipment 25 13,249 0.2 $89,684 0.3 0.8
* Based on Save Energy Now assessments conducted between 2006 to 2011. Numbers are as of July 1, 2011.
TOP TEN FREQUENTLY IDENTIFIED OPPORTUNITIES FOR PULP & PAPER INDUSTRY 2006 to 2011

24 | Industrial Energy Efficiency eere.energy.gov
• Compressed Air (Dr. Kissock)• Process Heating (Dr. Muller)
System-Assessment Examples