program behavior characterization and clustering: an empirical study for failure clustering danqing...
TRANSCRIPT

Program Behavior Characterization and Clustering: An Empirical Study
for Failure Clustering
Danqing ZhangSchool of Software Engineering, Tongji University
November 4th, 2013

2
Outline
1. Motivation
2. Runtime Behavior Representation
3. Behavior Clustering
4. Results and Analysis
5. Summary

3
Outline
1. Motivation
2. Runtime Behavior Representation
3. Behavior Clustering
4. Results and Analysis
5. Summary

4
Failure clustering
• The major work of failure clustering is to categorize different failed executions according to those induced by the same faults.
Motivation Runtime Behavior Representation Behavior Clustering Results and Analysis Summary

5
Programs and their executions
L1:
L494:L495: f1 (a, b) {L496: int temp;L497: temp = a;L498: a = b;L499: b = temp;L500: }L501: printf (“a = %d\n”, a);L502:
L561:}
Motivation Runtime Behavior Representation Behavior Clustering Results and Analysis Summary
L1:
L228:L229: func (x, y) {L230: int t;L231: t = x;L232: x = y;L233: y = t;L234: }L235: printf (“y = %d\n”, y);L236:
L321:
Source code of P1 Source code of P2
.……
.……
.……
.……

6
Programs and their executions
L1:
L494:L495: f1 (a, b) {L496: int temp;L497: temp = a;L498: a = b;L499: b = temp;L500: }L501: printf (“a = %d\n”, a);L502:
L561:}
Motivation Runtime Behavior Representation Behavior Clustering Results and Analysis Summary
L1:
L228:L229: func (x, y) {L230: int t;L231: t = x;L232: x = y;L233: y = t;L234: }L235: printf (“y = %d\n”, y);L236:
L321:
Source code of P1 Source code of P2
.……
.……
.……
.……

7
Failure clustering
• The major work of failure clustering is to categorize different failed executions according to those induced by the same faults.
Motivation Runtime Behavior Representation Behavior Clustering Results and Analysis Summary
• Programs having similar attributes (e.g. structural features, execution profiles) are assumed to have similar fault behaviors and failure behaviors.

8
Programs and their executions
• The similarities of runtime behaviors of programs approximate similarities of the effects of “fault-error-failure” chain on programs.
• If programs can be clustered based on their runtime behaviors, their failure behaviors can be clustered in the same way.
Motivation Runtime Behavior Representation Behavior Clustering Results and Analysis Summary

9
Our work
• Runtime behavior modeling• Behavior clustering• Experimental evaluation
Motivation Runtime Behavior Representation Behavior Clustering Results and Analysis Summary

10
Outline
1. Motivation
2. Runtime Behavior Representation
3. Behavior Clustering
4. Results and Analysis
5. Summary

11
Assumptions
• Programs are structured.• Runtime environment of programs is fault free.• Runtime characterization is defined for the IA32 platform
and the target programs are assumed to be of 32 bit code.
Motivation Runtime Behavior Representation Behavior Clustering Results and Analysis Summary

12
mov %esp, %ebpcall 8048344 <f1>push %ebpmov %esp, %ebplea 0xb (%eax), %edxpop %ebpret
BIP: Branch-instruction-based partition
Code sequence(at assembly-level)
Motivation Runtime Behavior Representation Behavior Clustering Results and Analysis Summary
CALLS: CALL-state
RETS: RET-state
A procedure calling exists during program execution.
BIP-based state Runtime characteristic

13
mov %esp, %ebpjmp 804842C <main+0x94>jne 904841a <main+0x82>int $0x80
BIP: Branch-instruction-based partition
Code sequence(at assembly-level)
Motivation Runtime Behavior Representation Behavior Clustering Results and Analysis Summary
UJS: Unconditional-jump-state
The body of a loop is executed.
Runtime characteristicBIP-based state
CJFS (CJTS): Conditional-jump-with-false (true)-state
INTS: INT-state A software interrupt is generated during program execution.
If/else statements are executed.

14
UJSCJFSCJFSCALLSCALLSRETSUJSCJFSCJFSCALLSCALLSRETSUJS
How to characterize the runtime behavior ?
Motivation Runtime Behavior Representation Behavior Clustering Results and Analysis Summary
State sequence Short sequence of states (K=5)
Occurrence
<UJS CJFS CJFS CALLS CALLS> 2
<CJFS CJFS CALLS CALLS RETS> 2
<CALLS CALLS RETS UJS CJFS> 1
<CALLS RETS UJS CJFS CJFS> 1
<RETS UJS CJFS CJFS CALL> 1
0
• K is denoted as the length of the short sequence of states.• The total number of whole K-mer combinations is . (When
K=5, .)• The runtime behavior is represented as: {0, … , , … , , … , , … , , …, , … , 0}
7776
K
K
K
K
K
K
K
K
K

15
Runtime behavior
Motivation Runtime Behavior Representation Behavior Clustering Results and Analysis Summary
• Runtime behavior : Runtime spectrum• When the optimal K value is chosen, the runtime behavior can
be well represented.

16
Outline
1. Motivation
2. Runtime Behavior Representation
3. Behavior Clustering
4. Results and Analysis
5. Summary

17
Similarity between two runtime behaviors
Motivation Runtime Behavior Representation Behavior Clustering Results and Analysis Summary
Two runtime behaviors

18
Similarity between two runtime behaviors
Motivation Runtime Behavior Representation Behavior Clustering Results and Analysis Summary
Two runtime behaviors
SD ( siT , s jT )=∑𝑙=1
6K
b i ,𝑙 logbi ,𝑙
(bi , 𝑙+b j , 𝑙)/2+∑
𝑙=1
6K
b j , 𝑙 logb j , 𝑙
(b i ,𝑙+b j , 𝑙) /2
Similarity degree between two behaviors

19
Similarity between two runtime behaviors
Motivation Runtime Behavior Representation Behavior Clustering Results and Analysis Summary
Two runtime behaviors
SD ( siT , s jT )=∑𝑙=1
6K
b i ,𝑙 logbi ,𝑙
(bi , 𝑙+b j , 𝑙)/2+∑
𝑙=1
6K
b j , 𝑙 logb j , 𝑙
(b i ,𝑙+b j , 𝑙) /2
• is symmetric and a non-negative value.
• A smaller value of indicates a higher similarity.
• if and only if two behaviors are exactly the same.
Similarity degree between two behaviors

20
Behavior clustering
Motivation Runtime Behavior Representation Behavior Clustering Results and Analysis Summary
• A fuzzy clustering algorithm is used to cluster program behaviors.
FCS: fuzzy compactness and separation• A method of determining the optimal cluster number (OCN)
Hazard rate First order backward difference

21
Outline
1. Motivation
2. Runtime Behavior Representation
3. Behavior Clustering
4. Results and Analysis
5. Summary
22
Implementation
Motivation Runtime Behavior Representation Behavior Clustering Results and Analysis Summary
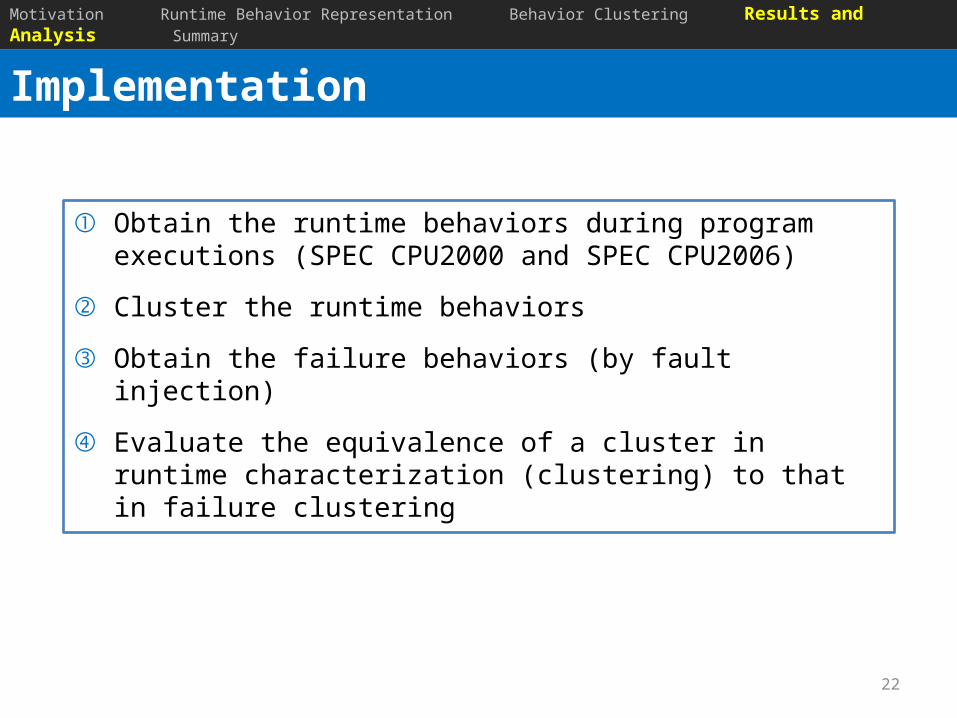
① Obtain the runtime behaviors during program executions (SPEC CPU2000 and SPEC CPU2006)
② Cluster the runtime behaviors
③ Obtain the failure behaviors (by fault injection)
④ Evaluate the equivalence of a cluster in runtime characterization (clustering) to that in failure clustering

23
Implementation : to obtain runtime behaviors
Motivation Runtime Behavior Representation Behavior Clustering Results and Analysis Summary
N inputs
.….…
…
1
M
PIN
Runtime behavior
State sequence
Runtime behavior
State sequence
Runtime behavior
State sequence1
N
.…
M programs N program executions
N runtime behaviors
Com
pile
& li
nk
…1
NN=99
M=22

24
Implementation : to cluster runtime behaviors
Motivation Runtime Behavior Representation Behavior Clustering Results and Analysis Summary
Sets of runtime behaviors
MDS : Multidimensional scaling
Sim
ilarit
y de
gree
Obtain similarity degrees of each two behaviors
Runtime behavior clustering
.…
Runtime behaviorRuntime behavior
Runtime behavior1
N

25
Implementation : to obtain failure behaviors
Motivation Runtime Behavior Representation Behavior Clustering Results and Analysis Summary
Fault type Description
MFC Missing function call
MIA Missing if construct around statements
MIFS Missing if construct plus statements
MLAC Missing “AND EXPR” in expression using as branch condition
MVAE Missing variable assignment using an expression
MVAV Missing variable assignment using a value
WPFV Wrong variable used in parameter of function call
MVIV Missing variable initialization using a value
ODC : Orthogonal Defect Classification

26
Implementation : to obtain failure behaviors
Motivation Runtime Behavior Representation Behavior Clustering Results and Analysis Summary
…
1
N
Fault injection
.…Similarity degrees between each two failure behaviors
SD ( s𝑓 iT , s 𝑓 jT )=∑𝑙=1
4❑
𝑓 𝑏i ,𝑙 log𝑓𝑏i , 𝑙
( 𝑓𝑏i , 𝑙+ 𝑓 b j , 𝑙)/2+∑
𝑙=1
4❑
𝑓𝑏 j ,𝑙 log𝑓𝑏 j ,𝑙
( 𝑓𝑏 i ,𝑙+ 𝑓𝑏 j , 𝑙)/2
N program executions
Occurrence frequencies of four failure modes
NCorrect | Aborted | Hanged | Wrong
% % % %
𝑠𝑓 𝑖𝑇={𝑏1 ,𝑏2 ,𝑏3 ,𝑏4 }
Correct | Aborted | Hanged | Wrong% % % %
𝑠𝑓 𝑖𝑇={𝑏1 ,𝑏2 ,𝑏3 ,𝑏4 }
1Correct | Aborted | Hanged | Wrong
% % % %
𝑠𝑓 𝑖𝑇={𝑏 𝑓 1,𝑏 𝑓 2 ,𝑏 𝑓 3 ,𝑏 𝑓 4 }¿650,000
N=99

27
Implementation : K and CN (cluster number)
Motivation Runtime Behavior Representation Behavior Clustering Results and Analysis Summary
• Runtime behaviors can be well represented when the optimal K value is chosen.
• Runtime behaviors can be well clustered when the optimal CN is chosen.
28
Evaluation : runtime behavior is well represented?
Motivation Runtime Behavior Representation Behavior Clustering Results and Analysis Summary
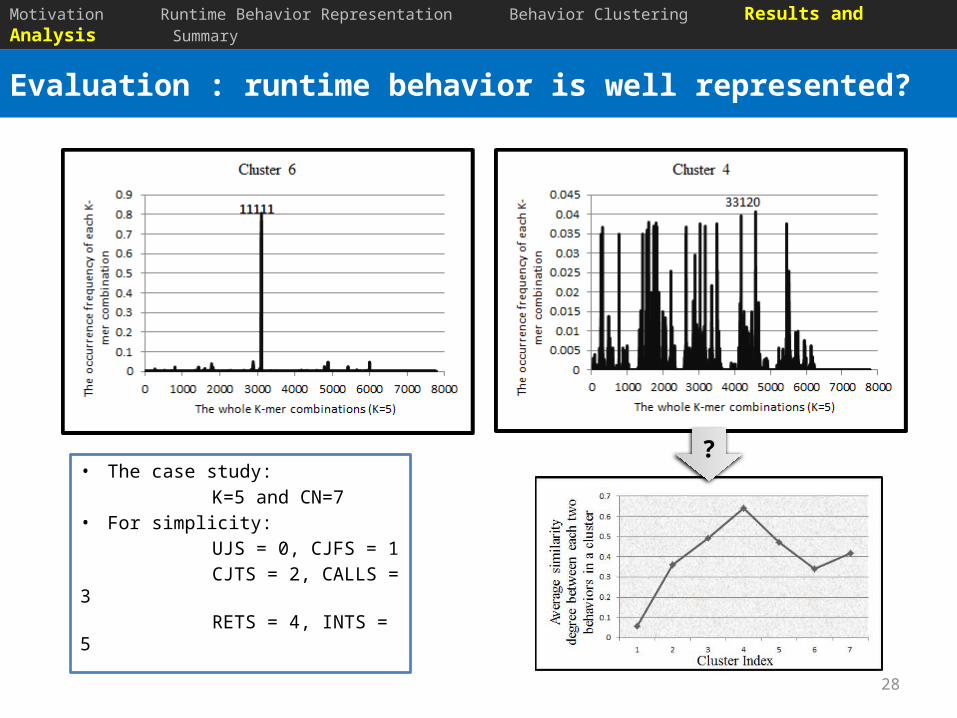
• The case study: K=5 and CN=7• For simplicity: UJS = 0, CJFS = 1 CJTS = 2, CALLS = 3 RETS = 4, INTS = 5
?
29
Evaluation : failure behaviors are well clustered?
Motivation Runtime Behavior Representation Behavior Clustering Results and Analysis Summary
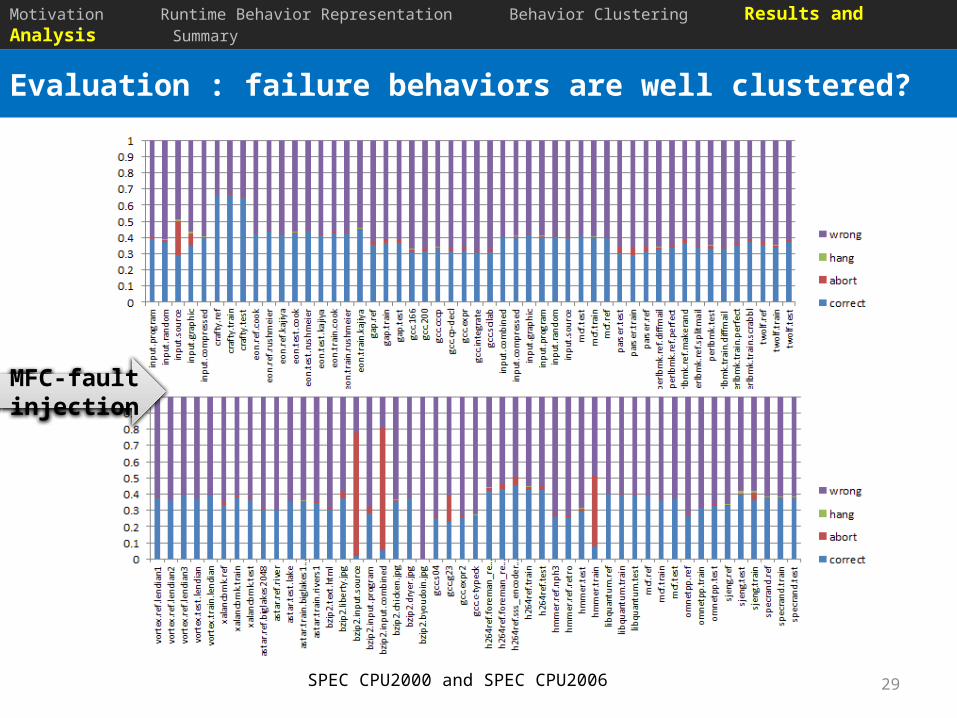
MFC-fault injection
SPEC CPU2000 and SPEC CPU2006

30
Evaluation : failure behaviors are well clustered?
Motivation Runtime Behavior Representation Behavior Clustering Results and Analysis Summary
SD ( s𝑓 iT , s 𝑓 jT )=¿• The case study: K=5 and optimal cluster number (OCN)=7• is used to describe the similarity degree• The statistics of similarity degree of MFC-induced failure
behaviors in each cluster are:
Cluster 1 Cluster 2 Cluster 3 Cluster 4 Cluster 5 Cluster 6 Cluster 7 Total
Similarity degree
99.94% 98.53% 98.23% 99.79% 76.73% 99.59% 91.91% 94.96%

31
Evaluation : failure behaviors are well clustered?
Motivation Runtime Behavior Representation Behavior Clustering Results and Analysis Summary
K=2 K=3 K=4 K=5 K=6 K=7 K=8 K=9
OCN 3,6,9 3,7,9 3,8 3,5,7 3,5,9 3,7,9 3,6 3,6
The OCN (optimal cluster number) for all the Ks

32
Evaluation : failure behaviors are well clustered?
Motivation Runtime Behavior Representation Behavior Clustering Results and Analysis Summary
K=2 K=3 K=4
OCN 3 6 9 3 7 9 3 8
Total simila
rity degree (%)
MFC 94.76 96.22 96.25 94.91 96.33 96.03 94.01 93.27
MIA 95.71 97.43 97.37 95.92 97.41 96.83 94.46 93.84
MIFS 95.14 96.97 96.86 95.17 96.6 96.17 94.16 93.57
MLAC 95.17 97.21 96.32 95.21 96.64 96.49 94.62 93.39
MVAE 95.23 97.19 96.61 96.19 97.23 96.77 95.12 94.72
MVAV 95.47 97.61 96.9 95.17 97.56 96.65 94.86 93.37
MPFV 95.01 96.98 96.67 95.41 97.12 96.83 94.55 93.39
MVIV 96.19 97.16 96.91 96.05 97.69 96.12 94.14 94.12

33
Evaluation : failure behaviors are well clustered?
Motivation Runtime Behavior Representation Behavior Clustering Results and Analysis Summary
K=2 K=3 K=4
OCN 3 6 9 3 7 9 3 8
Total simila
rity degree (%)
MFC 94.76 96.22 96.25 94.91 96.33 96.03 94.01 93.27
MIA 95.71 97.43 97.37 95.92 97.41 96.83 94.46 93.84
MIFS 95.14 96.97 96.86 95.17 96.6 96.17 94.16 93.57
MLAC 95.17 97.21 96.32 95.21 96.64 96.49 94.62 93.39
MVAE 95.23 97.19 96.61 96.19 97.23 96.77 95.12 94.72
MVAV 95.47 97.61 96.9 95.17 97.56 96.65 94.86 93.37
MPFV 95.01 96.98 96.67 95.41 97.12 96.83 94.55 93.39
MVIV 96.19 97.16 96.91 96.05 97.69 96.12 94.14 94.12

34
Evaluation : failure behaviors are well clustered?
Motivation Runtime Behavior Representation Behavior Clustering Results and Analysis Summary
K=5 K=6 K=7
OCN 3 5 7 3 5 9 3 7 9
Total similarity degree (%)
MFC 95.43 95.54 94.96 95.26 95.63 95.44 96.42 97.16 95.23
MIA 95.66 96.39 96.17 96.18 96.28 96.14 96.43 98.25 95.6
MIFS 95.64 95.72 95.31 96.29 96.33 95.46 97.18 97.22 96.01
MLAC 95.41 96.22 96.24 96.42 97.3 97.05 95.88 98.11 97.33
MVAE 96.79 97.03 95.5 95.51 96.43 96.46 96.83 98.24 95.67
MVAV 96.09 96.21 95.43 96.28 96.66 95.52 97.17 98.03 96.65
MPFV 95.7 95.82 95.68 95.56 96.45 95.62 97.4 97.79 95.51
MVIV 95.68 95.78 95.44 96.62 97 95.54 97.81 97.93 95.27

35
Evaluation : failure behaviors are well clustered?
Motivation Runtime Behavior Representation Behavior Clustering Results and Analysis Summary
K=5 K=6 K=7
OCN 3 5 7 3 5 9 3 7 9
Total similarity degree (%)
MFC 95.43 95.54 94.96 95.26 95.63 95.44 96.42 97.16 95.23
MIA 95.66 96.39 96.17 96.18 96.28 96.14 96.43 98.25 95.6
MIFS 95.64 95.72 95.31 96.29 96.33 95.46 97.18 97.22 96.01
MLAC 95.41 96.22 96.24 96.42 97.3 97.05 95.88 98.11 97.33
MVAE 96.79 97.03 95.5 95.51 96.43 96.46 96.83 98.24 95.67
MVAV 96.09 96.21 95.43 96.28 96.66 95.52 97.17 98.03 96.65
MPFV 95.7 95.82 95.68 95.56 96.45 95.62 97.4 97.79 95.51
MVIV 95.68 95.78 95.44 96.62 97 95.54 97.81 97.93 95.27

36
Evaluation : failure behaviors are well clustered?
Motivation Runtime Behavior Representation Behavior Clustering Results and Analysis Summary
K=8 K=9
OCN 3 5 3 5
Total similarity degree (%)
MFC 96.4 95.38 96.34 94.61
MIA 97.64 95.42 97.07 95.36
MIFS 97.2 95.55 96.52 95.44
MLAC 96.6 96.22 96.83 95.47
MVAE 96.77 95.99 97.61 95.58
MVAV 96.67 96.63 96.85 94.83
MPFV 96.91 96.25 96.36 95.14
MVIV 96.74 96.41 97.61 94.71

37
Evaluation : failure behaviors are well clustered?
Motivation Runtime Behavior Representation Behavior Clustering Results and Analysis Summary
K=8 K=9
OCN 3 5 3 5
Total similarity degree (%)
MFC 96.4 95.38 96.34 94.61
MIA 97.64 95.42 97.07 95.36
MIFS 97.2 95.55 96.52 95.44
MLAC 96.6 96.22 96.83 95.47
MVAE 96.77 95.99 97.61 95.58
MVAV 96.67 96.63 96.85 94.83
MPFV 96.91 96.25 96.36 95.14
MVIV 96.74 96.41 97.61 94.71

38
Evaluation : failure behaviors are well clustered?
Motivation Runtime Behavior Representation Behavior Clustering Results and Analysis Summary
• The total similarity degree of failure behavior clustering reaches the maximum when K=7.
• When K=7, the quality of failure behavior clustering based on the runtime behavior clustering is the highest.

39
Outline
1. Motivation
2. Runtime Behavior Representation
3. Behavior Clustering
4. Results and Analysis
5. Summary

40
Summary
Motivation Runtime Behavior Representation Behavior Clustering Results and Analysis Summary
• Once the optimal K and CN are chosen, runtime behaviors are well represented
based on BIP failure behaviors can be clustered according
to the runtime behavior clustering
• Expand the range of K and CN• Analyze the effectiveness of clustering fault behaviors
according to the runtime behavior clustering