profit taxation and the elasticity of the corporate income ... · national tax journal, march 2012,...
TRANSCRIPT
National Tax Journal, March 2012, 65 (1), 117–150
PROFIT TAXATION AND THE ELASTICITY OF THE CORPORATE INCOME TAX BASE: EVIDENCE FROM GERMAN CORPORATE
TAX RETURN DATA
Nadja Dwenger and Viktor Steiner
This paper estimates the elasticity of corporate taxable income with respect to the average corporate tax rate. To control for the endogeneity of the tax rate, we use an instrumental variable approach, calculating the counterfactual average tax rate that a corporation would have faced in a particular period had there been no endogenous change in corporate profi ts. This counterfactual rate is derived from a microsimulation model based on tax return data. A statistically signifi cant and relatively large point estimate of the tax base elasticity implies that a reduction in the statutory corporate tax rate would reduce corporate tax receipts less than proportionally.
Keywords: corporate income taxation, tax base elasticity, micro simulation, tax shields, tax return data
JEL Classifi cation: H25, H32
I. INTRODUCTION
Reforming the corporate income tax (CIT) persistently appears as a critical topic in both public fi nance and economic policy debates (Devereux and Sørensen, 2006;
Organisation for Economic Cooperation and Development (OECD), 2007; Merrill, 2010). Most critics stress the negative effects of the CIT on economic effi ciency and question its usefulness for raising tax revenues. International tax competition has also put pressure on CIT rates and could lead to a “race to the bottom” in the taxation of internationally mobile corporate capital. Statutory corporate tax rates have fallen in most OECD countries, a development that seems to have accelerated in recent years
Nadja Dwenger: Max Planck Institute for Tax Law and Public Finance, Munich, Germany ([email protected])
Viktor Steiner: School of Business and Economics, Free University Berlin, Berlin, Germany ([email protected])

National Tax Journal118
(OECD, 2007). For example, in Germany the statutory corporate tax rate on distributed profi ts declined from 45 percent in 1998 to 25 percent in 2001. As in other countries that reduced their statutory corporate tax rates, however, this reform has not resulted in a proportional decline in corporate tax revenues. This could be related to base broaden-ing provisions that often accompany rate reductions, such as less generous depreciation allowances (Devereux, 2008). Alternatively, some tax rate reductions be partially or even fully “self-fi nancing,” if they result in suffi ciently large increases in economic activity or reductions in income shifting and tax avoidance activities in the corporate sector. Furthermore, CIT revenue increases may occur due to income shifting within countries, as taxpayers use corporations to shelter their income from high personal tax rates (Gordon and Slemrod, 2000; Fuest and Weichenrieder, 2002).1
Empirical estimates of the elasticity of corporate tax bases to changes in corporate tax rates provide important information for assessing both the revenue and welfare implications of corporate tax policies. As Saez (2004) emphasizes, the elasticity of taxable income with respect to the marginal tax rate determines the ultimate effi ciency of a tax system, ignoring any possible external effects of taxation.2 Using accounting-based, industry-level panel data for publicly traded U.S. companies, Gruber and Rauh (2007) report an estimated CIT elasticity related to the net-of-tax marginal corporate tax rate of 0.2. This relatively small point estimate for the elasticity of the corporate tax base thus implies that the CIT is much less ineffi cient than often assumed. Gruber and Rauh further conclude, from the fairly small CIT elasticity relative to those estimated for individual income taxation, that absent external effects, the ineffi ciency of corporate taxation may be lower than the ineffi ciency of individual income taxation.3 However, as stressed by Gravelle (2007) in her comment on Gruber and Rauh, the use of the CIT elasticity to evaluate effi ciency is limited because it cannot identify the margin along which corporations adjust to tax rate changes.4
Determination of the effi ciency effects of the CIT is further complicated because capital is effectively double-taxed in many countries, including the United States and
1 In the United States, revenue from the CIT fell from between 5 and 6 percent of GDP in the early 1950s to 1 percent of GDP in 2009, as discussed in Offi ce of Management and Budget, Fiscal Year 2011 Budget, Table 2.3, “Receipts by Sources as Percentages of GDP, 1934–2015,” http://www.whitehouse.gov/sites/default/fi les/omb/budget/fy2011/assets/hist02z3.xls.
2 Saez, Slemrod, and Giertz (forthcoming) show that the elasticity of the tax base is not a suffi cient statistic to measure welfare losses if behavioral responses involve changes in activities with externalities. Chetty (2009) points out that the use of this statistic may lead to an overestimation of economic ineffi ciencies if tax avoidance includes both resource and transfer costs. If we were willing to assume that tax sheltering only included transfer costs and reallocations of resources across agents, without reducing total output (resource costs), it would generate no effi ciency loss.
3 For a discussion of the deadweight loss caused by personal income taxation, see Feldstein (1999), Giertz (2009), and Saez, Slemrod, and Giertz (forthcoming).
4 For example, one way corporations can react to changes in the CIT is by adjusting their debt ratio, which explains approximately one-third of the change in the corporate tax base induced by tax changes (Dwenger and Steiner, 2009).

Profi t Taxation and the Elasticity of the Corporate Income Tax Base 119
Germany. As opposed to a consumption tax, the CIT thus distorts saving decisions. However, these challenges do not, in our opinion, imply that the corporate taxable income elasticity is useless for evaluating the effi ciency of the CIT; it is certainly of great importance in terms of measuring the overall behavioral response of corporations to changes in the CIT rate under the existing tax structure and estimating the revenue effects of CIT reforms.
Despite its importance, no “benchmark” estimate of the corporate tax base elastic-ity currently exists for other OECD countries, nor is it known to what extent the U.S. results obtained by Gruber and Rauh might be typical of those for other countries and corporate tax regimes. Furthermore, estimated tax base elasticities may be sensitive to different defi nitions of the corporate tax base and tax rates, and are dependent on the structure of the corporate tax as well as on the modeling of the potential reverse causa-tion (endogeneity) between the tax base and tax rate.
We contribute to the literature by estimating the elasticity of the corporate tax base with respect to the average corporate tax rate (ATR) in the German economy using a comprehensive CIT return data set. Unlike the progressive rate structure available in the United States, Germany applies a uniform CIT rate that is independent of the level of corporate profi ts. Accordingly, we need other sources of variation to identify the corporate tax base elasticity, and we show that it can be identifi ed through the ATR, which differs from the statutory tax rate. Unlike the statutory tax rate our concept of the average tax burden is not confi ned to changes in the tax rate but can also capture base-broadening measures — a major advantage, because recent CIT reforms in Germany, as in other European countries, have been accompanied by simultaneous broadening of the tax base. The ATR varies across fi rms and over time due to huge differences in tax losses carried forward, differences in depreciation allowances and tax prefer-ences, and as a result of the Tax Relief Act passed at the turn of the century. This tax reform signifi cantly reduced the statutory CIT rate and simultaneously broadened the tax base by lowering depreciation allowances, restricting the use of a tax loss carry-back, and changing the treatment of non-depreciable assets that lose and then regain value.5
However, for various reasons, the ATR may be endogenous in that it is partly deter-mined by taxable income. To control for the endogeneity of changes in the ATR, we follow Gruber and Saez (2002) and Gruber and Rauh (2007) and estimate the tax base elasticity using an instrumental variable approach. As an instrument we use the counter-factual ATR that a corporation would have faced in a particular period, had there been no endogenous change in profi ts. To construct the ATR instrument, we use a detailed microsimulation model based on individual corporate tax return data.
5 In Germany, if a non-depreciable good declines in value and if this decline is likely to be permanent, fi rms are allowed to deduct the difference between its historical cost and its current value. The fi rm is required to reinstate the initial value, however, if the decline in value is reversed. This may occur, for example, if the value of land bought by a fi rm for future use is initially devalued due to some government regulation but subsequently returns to its initial level because the respective regulation is repealed.

National Tax Journal120
Tax return data provide broad coverage of the corporate sector and a detailed record of various tax shields, including used loss carry-forwards, which are relatively large for the corporate sector in the German economy.6 Further, the data include the CIT actu-ally assessed, together with components important for calculating the ATR. Because tax return data currently are available only as cross-sections, not as a panel, we built a pseudo-panel data set by aggregating fi rm-level corporate tax return data into approxi-mately 1,000 groups defi ned by industry (up to the fi ve-digit level) and region. With this pseudo-panel, we track groups of corporations rather than individual observations. Thus, we can control for observed and unobserved factors that may be correlated with both the corporate tax base and the ATR.
The remainder of this article proceeds as follows. In the next section we briefl y review the related literature. Afterwards, as a basis for specifying our empirical model, we pro-vide some background information about the measurement of the corporate tax burden and the corporate tax base. We then describe the data and detail our identifi cation and estimation of the CIT base elasticity. Our preferred specifi cation of the regression model, summarized in Section V.A, yields a statistically signifi cant and large point estimate of the average tax base elasticity, which implies that reducing the (proportional) statutory corporate tax rate reduces corporate tax receipts but less than proportionally, primarily because corporations engage in income-shifting activities. Even at the substantially reduced statutory tax rates mandated by recent tax reforms in Germany, our relatively large estimate of the CIT base elasticity indicates that substantial distortions of the CIT remain. We also fi nd statistically weak evidence for the hypothesis that the tax base is more responsive for corporations that can benefi t from various tax shields. In Section VI, we summarize our main results and conclude.
II. PREVIOUS LITERATURE
Tax base effects may arise because corporations respond to a reduction in the statutory tax rate by either increasing economic activity or by reducing income shifting. Various forms of income shifting have been studied in previous literature. Profi ts can be shifted between the corporate and personal sectors, depending on the change in the difference between the corporate and personal income tax rates (Gordon and Slemrod, 2000; Fuest and Weichenrieder, 2002). In addition, international income shifting may occur through corporate fi nancing strategies or transfer pricing (Clausing, 2009).
Recent empirical studies based on aggregate OECD data (Clausing, 2007; Brill and Hassett, 2007; Devereux, 2007) suggest that countries with statutory tax rates exceeding 30 percent tend to be on the declining segment of the CIT Laffer curve, which implies that tax rate reductions would increase corporate tax revenues.7 These studies are based on ordinary least squares (OLS) regressions of corporate tax revenues — normalized by gross domestic product — on the statutory tax rate, its square, and a couple of con-
6 Similar developments in the United States are discussed by Auerbach (2007) and Altshuler et al. (2009).7 For a single tax rate, tax revenues are maximized when the elasticity of taxable income with respect to the
marginal tax rate equals –1. More general results on the rate that maximizes tax revenues can be found in Saez (2004).

Profi t Taxation and the Elasticity of the Corporate Income Tax Base 121
trol variables, estimated on a panel of pooled OECD time-series cross-sectional data. Because the regressions do not include country fi xed effects that might be correlated with tax revenues and the statutory tax rate, it seems questionable whether they gener-ate reasonable estimates of CIT base elasticities.8 In contrast, using accounting-based, industry-level panel data for publicly traded U.S. companies, Gruber and Rauh (2007) report an estimated CIT elasticity related to the net-of-tax marginal corporate tax rate of 0.2. This elasticity is considerably smaller than the benchmark estimate of the elas-ticity of taxable personal income with respect to the net-of-tax marginal personal tax rate of roughly 0.4 obtained by Gruber and Saez (2002) for the United States.9 This relatively small estimate of the elasticity of the corporate tax base implies that, at least in the United States, reductions of the CIT rate would be only partly self-fi nancing and would substantially reduce corporate tax revenues.
There is also a large literature studying corporations’ behavioral response to changes in cross-country and cross-region tax differentials. Previous research in the United States revealed surprisingly high elasticities of reported corporate income with respect to changes in the tax rates of “tax havens” (Hines and Rice, 1994). In Canada, provinces are free to set their corporate tax rate and income of corporate groups is not consoli-dated for tax purposes, with the result that provinces engage in tax competition and multijurisdictional companies with subsidiaries in several provinces have profi t-shifting opportunities. Using administrative tax data for Canadian provinces, Mintz and Smart (2004) report high elasticities of taxable income with respect to subnational corporate tax rates. In several OECD countries, Bartelsman and Beetsma (2003) fi nd that, on average and compared to a baseline that assumes no behavioral responses, two-thirds of the revenues that would be raised by a unilateral increase in the statutory tax rate in a single country are lost due to declines in reported income. Riedl and Rocha-Akis (2007) also use aggregate OECD data and fi nd that the CIT base is negatively affected by a country’s own tax rate and positively infl uenced by the tax rates of its neighbor countries.
Weichenrieder (2009) studies profi t-shifting behavior of German multinationals in response to tax differentials. He shows that for inbound foreign direct investment (FDI), profi t-shifting from the German affi liate to the home country of the parent is less profi table the smaller the tax differential between the German affi liate and the foreign parent. For directly owned German affi liates, Weichenrieder fi nds evidence that a 10 percentage point increase in the parent’s home country tax rate reduces profi t-shifting by increasing profi tability of the German subsidiary by about 0.5 percentage point. Using the same database, Buettner et al. (2006) indicate that the impact of local taxes on corporations’ investment decisions depends on legal restrictions on interest deductions on intercompany debt. Investment in high-tax Germany is found to increase with rising tax rate differentials between the German affi liate and the tax rate in the parent’s home country (Overesch, 2009). Because of profi t-shifting opportunities, multinational fi rms thus gain in competitiveness if the parent company is located in a lower-taxing country.
8 As Clausing (2007) and Devereux (2007) note, there is not enough within-country variation in statutory tax rates to identify the tax base elasticity conditional on country fi xed effects.
9 In Germany, the elasticity most directly comparable to Gruber and Saez’s estimate is 0.6 (Gottfried and Schellhorn, 2004).
National Tax Journal122
III. MEASURING THE CORPORATE TAX BASE ELASTICITY
A. Average Tax Rate
The public fi nance literature on corporate taxation distinguishes between forward- and backward-looking measures of effective corporate tax rates (Fullerton, 1984; Devereux, 2004; Gordon, Kalambokidis, and Slemrod, 2004). Both measures differ from the statutory corporate tax rate, which is the nominal tax rate levied on taxable income at the corporate level. In most countries, including Germany, the statutory rate does not depend on the level of corporate profi ts, and the corporate tax assessed is proportional to taxable corporate income.10 To identify the corporate tax base elasticity for Germany we have to use a measure different from the statutory tax rate, namely the ATR that varies across corporations.
We construct the ATR using a backward-looking approach. These effective ATR measures are calculated ex post as the corporate tax actually assessed divided by some measure of economic corporate profi ts. Profi ts and the corporate tax assessed depend on previous corporate investment and fi nancing decisions, as well as previous and future losses, which may be offset against current profi ts according to the provisions for loss carry-forward and loss carry-backward. Backward-looking measures therefore account for all the details of the tax system without the need to model them explicitly. In the literature, the average effective tax rate is considered appropriate for measuring the relationship between tax rates and tax receipts in the corporate sector (Gordon, Kalambokidis, and Slemrod, 2004).
Because this relationship is the focus of our study, we use a backward-looking measure of the tax burden derived from corporate tax return data. Unlike the effective ATR, the ATR used in our study is not based on economic profi ts but on adjusted taxable income. Our tax-return data do not contain information on capital expenditures and thus do not allow us to construct an economic measure of income. More precisely, our ATR measure equals the ratio of the corporate tax assessed in a given year to the net profi t before loss carry-over (NPBL), i.e., ATR = corporate tax assessed / NPBL.11 If NPBL equals 0, the ATR is also 0. The NPBL differs from taxable income (TI) mainly by the amount
10 The United States, United Kingdom, and Japan tax corporate income for higher income brackets at a higher rate, whereas some European countries — e.g., Belgium, the Netherlands — provide a basic allowance for corporate income. Overall, there has been a tendency to reduce the “progressivity” of the CIT (e.g., OECD, 2007; Weichenrieder, 2007).
11 Because the German CIT is proportional, our measure of the ATR as an ATR relative to NPBL equals the statutory tax rate and marginal tax rate as long as corporations earn positive profi ts and cannot use any loss carry-over (abstracting from allowable deductions for agricultural cooperatives and industrial/provident societies, as discussed in footnote 13). All three measures are also equal for fi rms incurring a loss that cannot be carried back. The statutory tax rate, marginal tax rate, and ATR differ, however, for fi rms with unused loss carry-forward or carry-backward that are deductible against positive profi ts. Corporations are also liable for the local business tax, levied on an adjusted profi t measure (that includes a share of interest payments on long-term debt and leasing costs) at a rate which varies across municipalities (see Fossen and Bach, 2008). Since there was no change in the local business tax between 1998 and 2001 and the municipality specifi c rates hardly changed, we ignore it in out ATR simulation.
Profi t Taxation and the Elasticity of the Corporate Income Tax Base 123
of a corporation’s tax loss carry-back and carry-forward, which is deductible against current profi ts (a stylized calculation of these measures is provided in Table A1 in the Appendix),12 as well as the amount of allowable deductions for certain corporations.13 For a given level of current profi ts, corporations with unused tax loss carry-forwards or carry-backwards face very different ATRs compared with those that do not dispose of a stock of previously accrued losses.14
As we show subsequently, it is of great importance to account for these items, especially loss carry-forward, in calculating the corporate tax base.15 Variations in the amount of loss carry-forward across corporations also provide exogenous variation in the ATR for identifying the tax base elasticity, in addition to the change in the CIT induced by the Tax Relief Act that we describe in Section IV.B.1. Because tax return data do not provide all the information necessary to construct the NPBL using the same defi nition for all observation periods, we assume that other deductions, such as changes in depreciation allowances induced by the Tax Relief Act, do not affect the estimated tax base elasticity.16
B. Elasticity of the Corporate Tax Base
Our empirical analysis focuses on the elasticity of the corporate tax base, as measured by NPBL, with respect to the ATR: β ≡ (ΔNPBL/ΔATR) × (ATR/NPBL). This elasticity
12 In Germany, a net operating loss does not lead to an immediate tax rebate but is deductible against posi-tive profi ts from other years. Companies that have paid corporate income tax in previous year(s) may carry back the loss and receive a tax refund. If the loss in the following year exceeds profi ts or a legally defi ned maximum carry-back, the remaining loss must be carried forward in time; the resulting tax loss carry-forward, which is valid for an unlimited period of time, is deductible against future positive profi ts.
13 Agricultural cooperatives as well as industrial and provident societies benefi t from an allowable deduction in the amount of €15,000.
14 For our backward-looking measure of ATR we consider the amount of tax loss carry-forward effectively used to be the relevant factor. By contrast, a forward-looking measure of the tax burden would have to rely on the opportunity costs of the tax loss carry-forward used, which are given by t(t*) / (1 + r)t*, where t* is the number of years until the fi rm returns to paying taxes, t is the marginal tax rate applied in year t*, and r is the fi rm’s discount rate.
15 Bach and Dwenger (2007) show that the volume of past yet unused losses in the German corporate sector has increased from €128.3 billion (1992) to €520.3 billion (2004), or 470 percent of corporate profi ts in 2004. Cooper and Knittel (2006) fi nd similar results in the United States and report that large stocks of net operating losses were generated around the turn of the millennium, which were highly concentrated among a relatively small number of U.S. companies.
16 As Slemrod (1996) notes for personal income taxes, the estimated elasticity may be affected if the defi ni-tion of the tax base changes substantially over time. Not using a concurrent income measure might bias the elasticity estimate, if there was correlation between the ATR and base-broadening not corrected for by our income measure. The base-broadening nature of past reforms suggests this correlation would be negative: corporations that had benefi ted from generous tax shields before 2001 had a lower ATR, ceteris paribus, and then saw their tax base broadened by the reform. Unfortunately, there is no information on base-broadening factors in the data set, hence we cannot test the relevance of potential bias due to base-broadening effects. We would argue, however, that instrumenting the ATR by its simulated counterpart circumvents this problem to a large extent because the simulated ATR by construction excludes such base-broadening effects.
National Tax Journal124
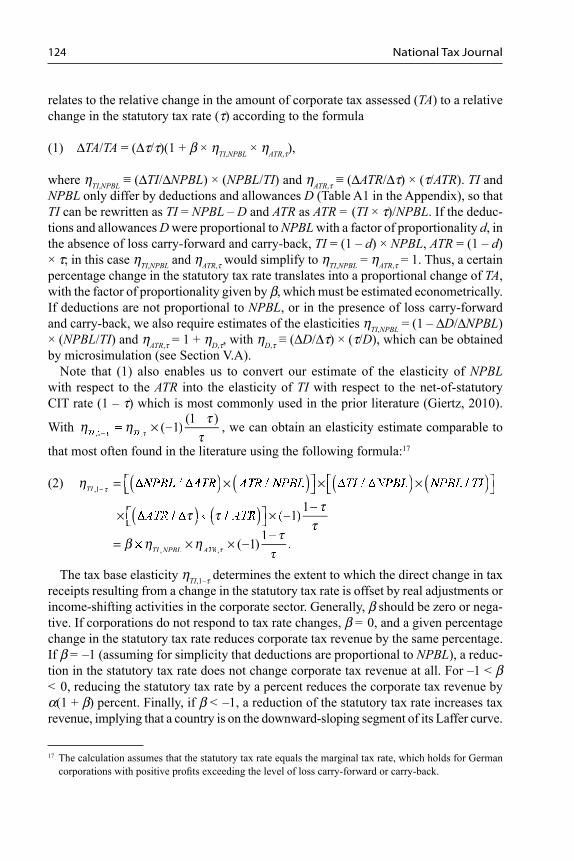
relates to the relative change in the amount of corporate tax assessed (TA) to a relative change in the statutory tax rate (τ) according to the formula
(1) ΔTA/TA = (Δτ/τ)(1 + β × ηTI,NPBL × ηATR,τ),
where ηTI,NPBL ≡ (ΔTI/ΔNPBL) × (NPBL/TI) and ηATR,τ ≡ (ΔATR/Δτ) × (τ/ATR). TI and NPBL only differ by deductions and allowances D (Table A1 in the Appendix), so that TI can be rewritten as TI = NPBL – D and ATR as ATR = (TI × τ)/NPBL. If the deduc-tions and allowances D were proportional to NPBL with a factor of proportionality d, in the absence of loss carry-forward and carry-back, TI = (1 – d) × NPBL, ATR = (1 – d) × τ; in this case ηTI,NPBL and ηATR,τ would simplify to ηTI,NPBL = ηATR,τ = 1. Thus, a certain percentage change in the statutory tax rate translates into a proportional change of TA, with the factor of proportionality given by β, which must be estimated econometrically. If deductions are not proportional to NPBL, or in the presence of loss carry-forward and carry-back, we also require estimates of the elasticities ηTI,NPBL = (1 – ΔD/ΔNPBL) × (NPBL/TI) and ηATR,τ = 1 + ηD,τ, with ηD,τ ≡ (ΔD/Δτ) × (τ/D), which can be obtained by microsimulation (see Section V.A).
Note that (1) also enables us to convert our estimate of the elasticity of NPBL with respect to the ATR into the elasticity of TI with respect to the net-of-statutory CIT rate (1 – τ) which is most commonly used in the prior literature (Giertz, 2010).
With η η ττ
= ×η −τ τη ( 1− )
(1 )TIη TI,1 ,
, we can obtain an elasticity estimate comparable to
that most often found in the literature using the following formula:17
(2) η
ττ
β η η ττ
( ) ( ) ( ) ( )( )τ ( )τ
(= ⎡⎣ ⎤⎦⎤⎤ (× ⎡⎣ ⎤⎦⎤⎤
× (⎡⎣ ⎤⎦⎤⎤ ×−
= β × ×η −
τ
τ
− ) () (×) ) (×)τ τ) () (τ×)τ ( 1− )
1
( 1− )1
.
TI
TI NPBLNN ATRTT
,1
, ,NPBLNN ATRTT
The tax base elasticity ηTI,1–τ determines the extent to which the direct change in tax receipts resulting from a change in the statutory tax rate is offset by real adjustments or income-shifting activities in the corporate sector. Generally, β should be zero or nega-tive. If corporations do not respond to tax rate changes, β = 0, and a given percentage change in the statutory tax rate reduces corporate tax revenue by the same percentage. If β = –1 (assuming for simplicity that deductions are proportional to NPBL), a reduc-tion in the statutory tax rate does not change corporate tax revenue at all. For –1 < β < 0, reducing the statutory tax rate by a percent reduces the corporate tax revenue by α(1 + β) percent. Finally, if β < –1, a reduction of the statutory tax rate increases tax revenue, implying that a country is on the downward-sloping segment of its Laffer curve.
17 The calculation assumes that the statutory tax rate equals the marginal tax rate, which holds for German corporations with positive profi ts exceeding the level of loss carry-forward or carry-back.

Profi t Taxation and the Elasticity of the Corporate Income Tax Base 125
IV. DATA AND EMPIRICAL METHODOLOGY
To measure the impact of the ATR for a given company on the level of its tax base, we estimate the elasticity of the corporate tax base with respect to the ATR. For various reasons, however, this elasticity cannot easily be identifi ed by a simple regression of log(NPBL) on log(ATR).
As we will show in Section IV.B.2, the ATR is strongly affected by the amount of loss carry-forward in a given year, which itself depends on the corporation’s profi t position that year. Imagine a corporation that earns a large absolute profi t that seems small compared with the company’s tax loss carry-forward volume. In this event, the corporation’s ATR is small, because tax losses carried forward essentially offset the profi t. A negative spurious correlation between a company’s profi t and its ATR could result. Furthermore, certain deductible allowances and expenses affect the corporation’s assessed tax and may be correlated with its profi ts, which would introduce spurious correlations between the corporation’s tax base and ATR. Finally, we acknowledge the potential for other observed and unobserved factors that may correlate with both NPBL and ATR and that need to be controlled for when we estimate the tax base elasticity.
Although it seems impossible to control for these factors on the basis of a single cross-section, we identify the tax base elasticity by taking advantage of the changes to the corporate tax system introduced by the Tax Relief Act during the period 1998–2001. Our data include corporate tax returns for the years 1998, 2001, and 2004. We construct a pseudo-panel for the estimation and control for potential endogeneity bias by account-ing for fi xed effects, as well as instrumenting the ATR following the methodology used by Gruber and Saez (2002) and Gruber and Rauh (2007). To construct the ATR instru-ment, we exploit changes in the tax law during the period spanned by our pseudo-panel data using a detailed microsimulation model based on individual corporate tax return data.
A. Data
1. C onstruction of a Pseudo-Panel from Corporate Tax Return Data
The German corporate tax return data we use come from the German Federal Statistical Offi ce, which publishes them every three years (Gräb, 2006).18 The latest year available is 2004. We restrict our analysis to 1998–2004 because, even though tax return data are available for 1995, no tax reform pertaining to corporate taxation occurred between that year and 1998. The same point could be made for 2001–2004, but we use this extended
18 Individual fi rm data are anonymous. Researchers may access the data through the “Research Data Centres of the Statistical Offi ces.” The Federal and State Statistical Offi ces, www.forschungsdatenzentren.de. English-language information about these data is available at “Corporation Tax.” Federal Statistical Offi ce, http://www.destatis.de/jetspeed/portal/cms/Sites/destatis/Internet/EN/Navigation/Statistics/FinanzenSteuern/Steuern/Koerperschaftsteuer/Koerperschaftsteuer.psml.

National Tax Journal126
period to check for any longer-term effects of the tax reform.19 Furthermore, we could not include 1992 data because industry classifi cations changed between 1992 and 1998 and it was impossible to align the data for 1992 with those used in 1998 and 2001 by industry, which was necessary for the construction of the pseudo-panel data.
The micro-data represent all corporations subject to the German CIT, which equaled approximately 700,000 fi rms in 1998 and 860,000 in 2004. The data refl ect all tax returns fi led in a given year and provide information about more than 100 items relevant for calculating the CIT. The data set also includes information about taxable income and the CIT assessed, as well as details about fi rm characteristics, such as industry, region, and legal form.
To construct the pseudo-panel data set based on the three cross-sections, we grouped corporations according to industries and the regional affi liation of their headquarters. The lowest regional level refers to the 16 German federal states (Bundesländer). A corporation’s industry and headquarters should remain unchanged over our short time horizon, so their location decision, for example, should not be infl uenced by tax reforms. Grouping by industry is natural, because some of the variation in taxation rules takes place at the industry level.
We aggregated the micro-level data into groups by applying a sequential procedure.20 First, we assessed the number of corporations within each industry at the two-digit level. For groups with many corporations at this level, we checked the three-digit level. If there were more than 50 corporations at this level, we determined whether the industry could be disaggregated to the three-digit level, with the requirement that there must be at least 50 corporations within the resulting group.21 If not, we kept the group at the two-digit level. Following this procedure we proceeded to the fi ve-digit level; some groups were quite large even at the fi ve-digit level and included several thousands of corporations. For these groups, we used regional affi liation as a subordinate classifi cation criterion and further differentiated the groups between eastern and western Germany and, if pos-sible, among federal states. We assigned each corporation to one of 1,137 groups using this procedure. The same classifi cation of groups applied to all three cross-sections.22
19 From 2001–2004, the only change in corporate tax laws was the introduction of minimum taxation, which capped the use of tax loss carry-forward. The reform did not introduce much variation in average tax rates and affected only a small share of all corporations — 1,890 companies in 2004.
20 An illustration of this procedure is available in a web appendix at http://www.wiwiss.fu-berlin.de/en/institute/wirtschaftspolitik-geschichte/steiner/index.html.
21 As a robustness check, we constructed a pseudo-panel with minimum group sizes of 40 and 45. The number of groups slightly increases with a lower minimum group size (plus 28 and two groups, respectively), but the results remain unchanged.
22 To address the slight change in the classifi cation of industries from 1998–2001, we matched prior industry identifi ers to the new ones. This match was not always possible, so we rearranged a few groups to make the data sets for the two years comparable. We excluded observations for which the industry was unknown or obviously erroneous. Revealing the industry is compulsory but leaves taxes for a given corporation unchanged; it is unlikely that there would be any systematic concealment of industry. Therefore, discard-ing these observations should not bias our results. We also drop all private households from the data set because they were only partly included in the 1998 data set and are not the focus of our study.
Profi t Taxation and the Elasticity of the Corporate Income Tax Base 127
2. Descriptive Statistics
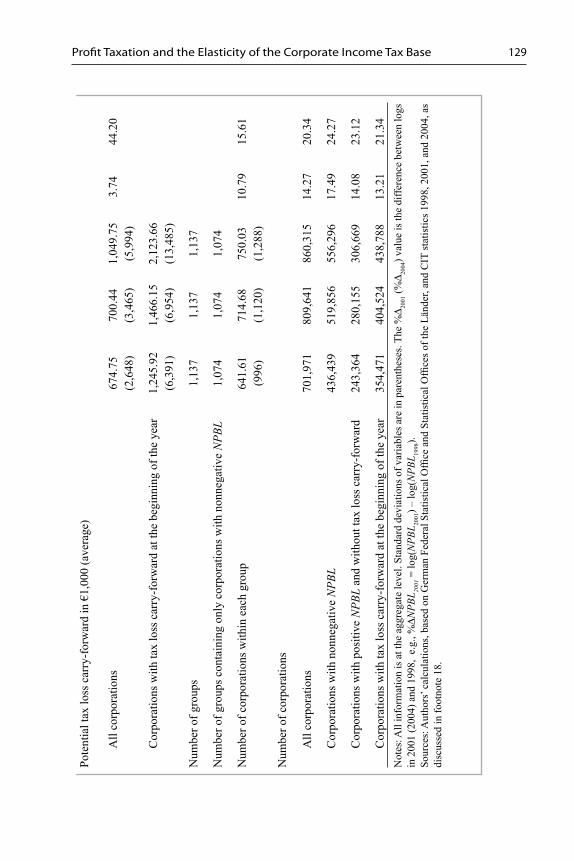
We calculated NPBL and ATR at the fi rm level for each year and then aggregated them to the group level of the pseudo-panel structure described in the previous subsection, taking into account differences in group size.23 However, we excluded corporations with a negative NPBL in a particular year from the subsequent analysis because their tax return data provide no information about the determinants of current losses that could be used to predict future losses. We try to control for potential selection effects resulting from the exclusion of these cases in the regression analysis, as we discuss subsequently. In Table 1, we present the means and standard deviations of NPBL and ATR, measured at the group level for the three years, as well as the relative changes between 1998 and 2001 or 2004.
The upper part of Table 1 shows a dramatic decline in TI during 1998–2001 and a low-level of stabilization thereafter. This decline is probably related to the economic downturn that had already started in some sectors of the German economy in 2001. TI (and NPBL) declined most at the lower tail of the distribution, suggesting that the sharp drop is largely driven by a few very large companies. Firms had an incentive to realize investment losses before 2002, because writedowns of investments in shares of affi liated companies were effective for tax purposes only until 2001 (Blasch and Weichenrieder, 2005).
Furthermore, the amount of tax loss carry-forward has steadily increased in Germany since the 1990s. From 1998–2001, both the number of fi rms with tax losses carried for-ward and the amount of tax loss carry-forward increased (Table 1). This might explain why the decline in TI was more pronounced, on average, than the one in NPBL for all corporations with positive profi ts, which dropped by almost 20 percent from 1998–2001 — from €320,000 to €265,000 — and by another 10 percent in 2001–2004.24
Because NPBL is negative for a large share of all corporations in each of the three years, we report the statistics for all corporations and for those with nonnegative NPBL separately.25 The average level for corporations with nonnegative NPBL amounted to almost €500,000 in 1998, dropped by 20 percent by 2001, and fell by more than one-third in 2004. The share of corporations reporting a positive NPBL increased slightly in this period. The declines are not due to changes in the defi nition of income because
23 We estimate the tax base elasticity by applying fi rst differences such that all variables are given as percentage changes, and we control for differences in fi rm size or other variables. Therefore, we do not need to use further weights, but can calculate the group information within each group g as the unweighted average of the individual information from fi rm i.
24 In some groups, one corporation was much larger in terms of NPBL than the next largest corporation. We excluded corporations whose NPBL exceeded the second-largest NPBL by more than the factor 100 (1998 = 11, 2001 = 10, 2004 = 1) to avoid group dominance by a single corporation. A sensitivity check showed, however, that including these few outliers does not change the results.
25 When calculating the average ATR we assumed a rate of zero for corporations with negative NPBL. To avoid problems with outliers, we dropped corporations with an exceptionally large or small average tax rate, exceeding 100 percent or –100 percent.

National Tax Journal128
Tabl
e 1
Des
crip
tive
Stat
istic
s 1998
2001
2004
%Δ
2001
%Δ
2004
TI in
€1,
000
(ave
rage
)
All
corp
orat
ions
127.
26(1
,393
)14
.17
(1,1
34)
14.8
3(1
,172
)–2
19.5
1–2
14.9
6
Cor
pora
tions
with
non
nega
tive
NPB
L34
5.46
(2,1
88)
277.
11(1
,417
)29
0.03
(1,4
93)
–22.
05–1
7.49
Net
profi t
bef
ore
loss
car
ry-o
ver (
NPB
L) in
€1,
000
(ave
rage
)
All
corp
orat
ions
321.
21(2
,206
)26
5.21
(1,4
02)
238.
11(1
,171
)–1
9.16
–29.
94
Cor
pora
tions
with
non
nega
tive
NPB
L48
8.60
(3,4
16)
386.
56(1
,924
)33
8.69
(1,6
63)
–23.
43–3
6.65
Shar
e of
cor
pora
tions
repo
rting
a p
ositi
ve N
PBL
0.55
4(0
.098
)0.
560
(0.0
98)
0.57
9(0
.087
)1.
084.
41
ATR
(ave
rage
)
All
corp
orat
ions
0.11
97(0
.048
)0.
0772
(0.0
30)
0.07
86(0
.028
)–4
3.86
–42.
06
Cor
pora
tions
with
non
nega
tive
NPB
L0.
1986
(0.0
55)
0.12
31(0
.035
)0.
1231
(0.0
33)
–47.
83–4
7.83
Profi t Taxation and the Elasticity of the Corporate Income Tax Base 129
Pote
ntia
l tax
loss
car
ry-f
orw
ard
in €
1,00
0 (a
vera
ge)
All
corp
orat
ions
674.
75(2
,648
)70
0.44
(3,4
65)
1,04
9.75
(5,9
94)
3.74
44.2
0
Cor
pora
tions
with
tax
loss
car
ry-f
orw
ard
at th
e be
ginn
ing
of th
e ye
ar1,
245.
92(6
,391
)1,
466.
15(6
,954
)2,
123.
66(1
3,48
5)
Num
ber o
f gro
ups
1,13
71,
137
1,13
7
Num
ber o
f gro
ups c
onta
inin
g on
ly c
orpo
ratio
ns w
ith n
onne
gativ
e N
PBL
1,07
41,
074
1,07
4
Num
ber o
f cor
pora
tions
with
in e
ach
grou
p64
1.61
(996
)71
4.68
(1,1
20)
750.
03(1
,288
)10
.79
15.6
1
Num
ber o
f cor
pora
tions
All
corp
orat
ions
701,
971
809,
641
860,
315
14.2
720
.34
Cor
pora
tions
with
non
nega
tive
NPB
L43
6,43
951
9,85
655
6,29
617
.49
24.2
7
Cor
pora
tions
with
pos
itive
NPB
L an
d w
ithou
t tax
loss
car
ry-f
orw
ard
243,
364
280,
155
306,
669
14.0
823
.12
Cor
pora
tions
with
tax
loss
car
ry-f
orw
ard
at th
e be
ginn
ing
of th
e ye
ar35
4,47
140
4,52
443
8,78
813
.21
21.3
4N
otes
: All
info
rmat
ion
is a
t the
agg
rega
te le
vel.
Stan
dard
dev
iatio
ns o
f var
iabl
es a
re in
par
enth
eses
. The
%Δ 20
01 (%
Δ 2004
) val
ue is
the
diffe
renc
e be
twee
n lo
gs
in 2
001
(200
4) a
nd 1
998,
e.g
., %
ΔNPB
L 2001
= lo
g(N
PBL 20
01) –
log(
NPB
L 1998
).So
urce
s: A
utho
rs’ c
alcu
latio
ns, b
ased
on
Ger
man
Fed
eral
Sta
tistic
al O
ffi ce
and
Sta
tistic
al O
ffi ce
s of t
he L
ände
r, an
d C
IT st
atis
tics 1
998,
200
1, a
nd 2
004,
as
disc
usse
d in
foot
note
18.

National Tax Journal130
the Tax Relief Act broadened the tax base and thus worked into the opposite direction. The marked decline in the average NPBL therefore occurred even though deductions for depreciation were reduced and economic activity, as measured by average sales in nomi-nal terms, increased by roughly €18 million (as discussed in Table A2 in the Appendix).
The Tax Relief Act reduced the ATR by 4.25 percentage points on average, compared with a drop of the statutory tax rate by 20 percentage points for most corporations. Various factors contributed to this difference, which we exploit to identify the tax base elasticity; we discuss these factors in more detail in Section IV.B.2.
B. Identifi ca tion and Estimation
We identify the tax base elasticity by using the pseudo-panel structure of our corpo-rate tax return data and the changes to the corporate tax system introduced by the Tax Relief Act during 1998–2001. Except for a cap on the use of tax loss carry-forward due to minimum taxation provisions that affected very few companies,26 the rate and struc-ture of the CIT did not change from 2001–2004. Because this period does not provide exogenous variation for the identifi cation of tax effects, we rely only on exogenous changes in the CIT induced by the Tax Relief Act.
1. The German CIT System and the Tax Relief Act
In Germany, as elsewhere, the CIT is levied on corporate enterprises, public and private limited companies, and other corporations (e.g., cooperatives, associations, foundations). Sole proprietorships and partnerships are not subject to the CIT; profi ts earned by an unincorporated fi rm are attributed to the fi rm’s individual partners and taxed according to their personal income tax schedules. The assessment base of the CIT, or TI, can be derived from the amount of profi ts recorded in the tax balance sheet (Appendix A). Until 2000, the German CIT system was based on the tax credit method, such that the amount of CIT assessed was credited against the personal income tax of the shareholder, and retained earnings were subject to a higher tax rate than distributed profi ts (McDonald, 2001).
The Tax Relief Act eliminated the imputation system in favor of the half-income method. Since 2001, the tax rate on corporate income has been uniform and does not depend on a corporation’s payout ratio. According to the half-income method, CIT is not allowable against other taxes and half of the dividends are subject to personal income tax.27 In addition to signifi cantly lowering the tax rate to 25 percent in 2001,28 the reform
26 Dwenger (2010) shows that the minimum taxation affected 1,800 companies in 2004; this corresponds to 0.2 percent of corporations subject to CIT in that year.
27 Unfortunately, we do not have information about a corporation’s shareholders. We neither know their par-ticipation quota nor have knowledge about other sources of income or their personal income tax. Personal income taxation in Germany is highly progressive and taxation partly depends on the participation quota. Therefore, without this information, we cannot include personal income taxation in our analysis.
28 Since 2008, the uniform tax rate has amounted to 15 percent.
Profi t Taxation and the Elasticity of the Corporate Income Tax Base 131
broadened the tax base, lowered depreciation allowances, introduced a requirement to reinstate original values, and cut the use of tax loss carry-backs.29
2. Exogenous Variation in the ATR Induced by the Tax Relief Act
The tax reform did not affect all corporations equally, and we observe substantial variation in the changes of their ATRs. First, every year, approximately 20 percent of German corporations use a tax loss carry-forward or carry-back to offset their current profi ts. These corporations do not pay any CIT and thus have an ATR of zero, which has remained unaffected by changes in the statutory tax rate. The use of tax loss carry-forward is not at the corporation’s discretion though, because any unused tax loss carry-forward must be fully offset against current profi ts.
Second, the statutory tax rate and ATR in 1998 depended on the ratio between retained and distributed earnings. A corporation that distributed no earnings was subject to a CIT rate of 45 percent,30 whereas one that distributed its whole profi t was subject to a CIT rate of only 30 percent. Splitting the tax rate is a specifi c feature of the tax credit method. Therefore, the reduction in the ATR was much greater for corporations that retained most of their earnings compared with corporations that distribute all their profi ts.
Third, some corporations were entitled to reduced statutory CIT rates in 1998. Mutual insurance societies, private foundations, and business enterprises of public corporations benefi ted from a reduced tax rate of 42 percent in 1998. At the same time, a fl at tax of 25 percent applied to different sources of foreign income. The Tax Relief Act provided no reductions in statutory tax rates but instead applied the 25 percent tax rate equally to every corporation. Therefore, the reduction in the statutory tax rate and ATR between 1998 and 2001 was smaller for corporations that had benefi ted from reduced taxation in the past. Some corporations even saw their tax rate rise; for example, operators of merchant ships in international waters were liable for a reduced rate of 22.5 percent in 1998, but in 2001 they were subject to the universal tax rate of 25 percent.
Fourth, the change in the ATR depends on asset structures. For example, corporations with large real investments in both years saw their tax base broadened in 2001 because of the lower depreciation allowances for new acquired goods, compared with 1998.
Fifth, corporations that used a fi scal year different from the calendar year switched to the half-income method and lower tax rate in 2002; in 2001, they were still taxed under the tax credit method and had to pay a tax rate of 40 percent. The reduction in the ATR for these corporations was in turn much smaller than that for corporations taxed according to the half-income method as of 2001.31
29 Until 1998, profi ts could be carried back two years up to a value of €5.1 million. In 1999, loss carry-back was restricted to one year. At the same time, it was reduced in volume; in 1999 and 2000, it was limited to €1 million and since 2001 it has been capped at €511,500 (Dwenger, 2010).
30 In 1999 and 2000, the tax rate on retained earnings declined to 40 percent.31 Blasch and Weichenrieder (2007) present transitional rules and assess whether listed corporations align
their fi scal year to the calendar year accordingly.

National Tax Journal132
3. Instrument al Variable Estimation
Following the method used by Gruber and Saez (2002) and Gruber and Rauh (2007), we use the simulated ATR the corporation would have faced in 2001 if its real tax base had not changed endogenously during 1998–2001 as an instrument for a corporation’s ATR in 2001. Thus, we only use changes in the tax law and macroeconomic effects that are exogenous to the individual corporation to identify the elasticity of the tax base with respect to the ATR. To compute simulated tax liabilities and the simulated ATRs, we use the business taxation microsimulation model BizTax.32 The method fi rst ages NPBL and all income-related components of the 1998 cross-section to 2001 values using a nominal growth rate that is exogenous to the individual corporation.33 Thirteen infl ation parameters pertain to different sources of income (e.g., profi ts and losses, dividends, and interest income from fi nancial and non-fi nancial corporations).34 Using BizTax, we simulate the corporate tax liability according to the CIT law of 2001 based on the infl ated income components. The simulated ATR for 2001 results from relating the simulated tax liability for 2001 to the infl ated NPBL for 1998.
We note the concern that this simulated ATR is not completely exogenous for cor-porations that offset part (or all) of their profi ts in 1998 against losses from the past or 1999 (loss carry-back) because the amount of profi ts that can be offset against losses from other periods is a function of the tax rules. Because the Tax Relief Act broadened the tax base and increased NPBL, it produced an increase in the ATR which implied a larger volume of losses from other periods would be needed to offset the higher NPBL. Even if the tax losses carried forward (back) were suffi cient in volume to (mainly) offset profi ts before the reform, they might no longer be so after the broadening of the tax base. In turn, the ATR would increase for corporations without suffi cient losses and stay unchanged for those with abundant losses. Because the ability to offset the higher NPBL that resulted from the tax reform might be related to unobserved factors, which also could infl uence the tax base itself, we acknowledge that tax loss carry-forward or carry-back could be endogenous. To address this potential endogeneity, we infl ate the amount of profi ts offset against losses from other periods in 1998 and use this amount
32 BizTax is a microsimulation model for business taxation in Germany that is based on offi cial tax return data and developed at DIW Berlin, in cooperation with the Federal Ministry of Finance. In addition to a detailed local business tax module, it contains a CIT simulation module that replicates the CIT assessed by tax authorities for more than 99 percent of all corporations; these corporations also account for more than 99 percent of the overall CIT revenue. BizTax can simulate the CIT liability of each corporation un-der past regulations, current law, and different tax reform scenarios. Currently the model does not predict companies’ potential behavioral responses to tax reforms, such as changes in their fi nancing and investment decisions or entries and exits.
33 We assume that income growth factors do not depend on the level of corporate income in 1998, conditional on group fi xed effects (Gruber and Saez, 2002).
34 The computation of these parameters ensured that infl ated profi ts and interest refl ected changes in the corresponding aggregates in the national accounts and the German Bundesbank corporate balance sheet statistics.
Profi t Taxation and the Elasticity of the Corporate Income Tax Base 133
as an upper limit in our simulation of a corporation’s ATR for 2001.35 In a similar vein, we use the infl ated amount of allowable deductions effectively used in 1998 when we simulate the corporation’s ATR for 2001.
In the estimation, we control for other factors that might correlate with both NPBLand ATR. For example, we estimate the regression of log(NPBL) on log(ATR) in fi rst differences and allow for group fi xed effects that may be correlated with ATR. To con-trol for time-varying factors, we include the number of corporations within a group, the share of corporations still taxed under the tax credit method in 2001, and average sales within a group. These variables also help control for changes within groups in the observation period, which could affect the effi ciency of our estimates, especially the standard error of the estimated tax base elasticity. The information on sales came from the value-added tax (VAT) statistics of the German Federal Statistical Offi ce, which were available at the same level of aggregation we used to construct our pseudo-panel data.36 For a few industries that are not subject to the VAT, we lack information on sales; some industries have VAT liability for only part of their sales so we include an interaction term between VAT liability and group sales.
As noted earlier, we restrict our regression analysis to corporations with positive NPBL. In an alternative model specifi cation, we control for potential selection effects by including the change in the share of corporations that report positive profi ts within the groups during our observation period.
Using our pseudo-panel and taking fi rst differences of equations in log-levels, we derive an estimating equation
(3) α β γ⎛
⎝
⎛⎛
⎝⎝
⎞
⎠
⎞⎞
⎠⎠
⎛
⎝⎜⎛⎛
⎝⎝
⎞
⎠⎟⎞⎞
⎠⎠+ ′Δ +′ =
NPBLNPBL
ATRTTATRTT
x uΔ +Δ tlog lα β⎛
⎝⎜⎛⎛
⎝⎝
⎞
⎠⎟⎞⎞
⎠⎠= α
NPBLog , 2001,2004,
g tL
g
g tR
gg g
,1998 ,1998
where α is a constant, β is the corporate tax base elasticity we estimate, γ is a column vector of regression coeffi cients, and Δxg is a column vector composed of fi rst differences of the control variables in group g. Furthermore, ug = ug,t – ug,1998 is a fi rst-differenced error term for each group, which may or may not be serially correlated but, conditional on Δxg, is assumed to be uncorrelated with the change in the ATR. Because we estimate the equation in fi rst-differences for two periods only, the constant α captures the overall time trend for 1998–2001 (2004).
We report simple OLS and two-stage least squares (2SLS) regression results. In the 2SLS regression, the ATR for 2001 (2004) in the relative change in ATR is instrumented with the simulated ATR for 2001 (2004). Because the rate and the structure of the CIT
35 Because our microsimulation tax model does not include a switching rule between loss and profi t, we assume a corporation reporting a profi t in 1998 does so in 2001 as well.
36 English-language information on these data is available at “Turnover Tax.” Federal Statistical Offi ce, http://www.destatis.de/jetspeed/portal/cms/Sites/destatis/Internet/EN/Navigation/Statistics/FinanzenSteuern/Steuern/Umsatzsteuer/Umsatzsteuer.psml.
National Tax Journal134
did not change from 2001–2004, any differences in the estimated β coeffi cients for the regressions in 1998–2001 and 1998–2004 indicate deviations of short-run versus long-run tax elasticities, assuming that all non-tax factors that infl uence corporate income are adequately controlled for in the estimation.37 We also estimate separate elasticities according to characteristics that may relate to the ability to shift income, such as eco-nomic sector, average size of the corporations within sectors, or the intensity of FDI.
V. ESTIMATION RESULTS
A. Basic Regr ession Results
The simple correlation of changes in the corporate tax base, as measured by positive NPBL, and the ATR from 1998–2001 is positive and signifi cant (coeffi cient of 0.240, t-value of 2.21); including control variables slightly reduces the coeffi cient to 0.164, which becomes statistically insignifi cant (t-value of 1.25). This result reproduces the correlation structure observed in our data (Table 1), that is, the decline in both NPBL and ATR.
As we noted previously, we did not expect OLS regressions of the change in NPBL on the change of the ATR to identify the tax base elasticity. Standard Hausman-Wu endogeneity tests strongly indicate that ATR is an endogenous variable, and that the OLS estimates of the tax elasticity are inconsistent. In particular, including the residual from a fi rst-stage regression of log(ATRg,2001 / ATRg,1998) on the control variables Δxg in the structural equation yields a t-value of 18.3; a standard Hausman test is signifi cant at the 1 percent level (p-value = 0.0106).
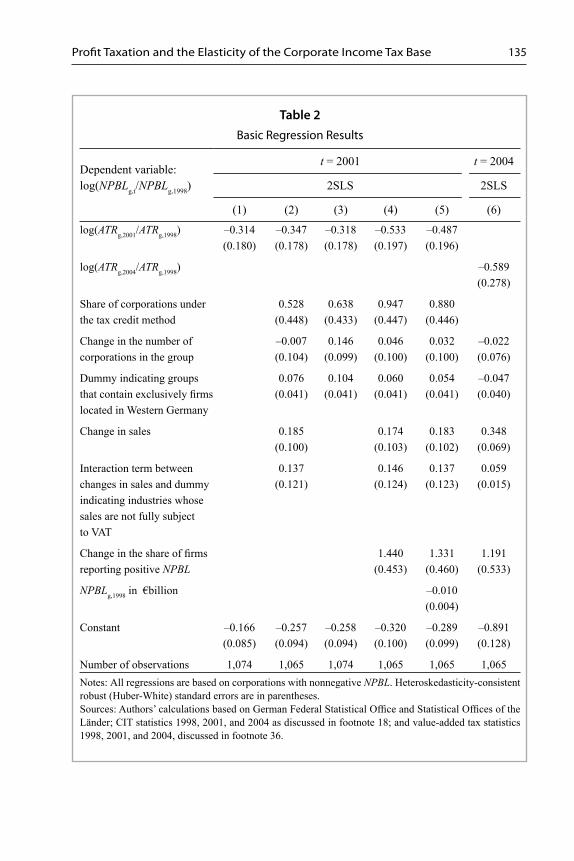
Table 2 summarizes the 2SLS regression results for the model in (3).38 We focus on 1998–2001, a period during which we observe exogenous changes in the ATR induced by the tax reform; we check whether our estimation results change when we extend the observation period to 2004 (column 6). To account for heteroskedasticity due to differences in group size and possibly serial correlation of the error terms, we report the robust standard errors of estimated coeffi cients in all regressions.
Before we comment on the 2SLS estimation results in Table 2, we consider the results of the fi rst-stage regression with the simulated ATR as our instrument for the ATR actu-ally observed in 2001. The simple correlation between the relative change in the ATR actually observed and the one obtained by the simulated ATR for 2001 is quite strong. In the fi rst-stage regression including all control variables, the R2 is almost 0.5, and the
37 Although the average ATR did not change between the two years, we note some small time variation in the ATR due to changes in loss carry-forward, accounted for by including the simulated ATR for 2004 in the regression.
38 Because NPBL is 0 even at the group level in a few cases, we could not have used these observations in the estimation with logs so we approximated log(NPBLg,t / NPBLg,1998) and log(ATRg,t / ATRg,1998) by, respec-tively, [(NPBLg,t – NPBLg,1998) / 0.5(NPBLg,t + NPBLg,1998)] and [(ATRg,t – ATRg,1998) / 0.5(ATRg,t + ATRg,1998)]. A sensitivity check shows that restricting the sample to groups with positive NPBL and estimating the log-log specifi cation does not signifi cantly change estimation results.
Profi t Taxation and the Elasticity of the Corporate Income Tax Base 135
Table 2Basic Regression Results
Dependent variable:log(NPBLg,t/NPBLg,1998)
t = 2001 t = 2004
2SLS 2SLS
(1) (2) (3) (4) (5) (6)
log(ATRg,2001/ATRg,1998) –0.314(0.180)
–0.347(0.178)
–0.318(0.178)
–0.533(0.197)
–0.487(0.196)
log(ATRg,2004/ATRg,1998) –0.589(0.278)
Share of corporations under the tax credit method
0.528(0.448)
0.638(0.433)
0.947(0.447)
0.880(0.446)
Change in the number of corporations in the group
–0.007(0.104)
0.146(0.099)
0.046(0.100)
0.032(0.100)
–0.022(0.076)
Dummy indicating groups that contain exclusively fi rms located in Western Germany
0.076(0.041)
0.104(0.041)
0.060(0.041)
0.054(0.041)
–0.047(0.040)
Change in sales 0.185(0.100)
0.174(0.103)
0.183(0.102)
0.348(0.069)
Interaction term between changes in sales and dummy indicating industries whose sales are not fully subject to VAT
0.137(0.121)
0.146(0.124)
0.137(0.123)
0.059(0.015)
Change in the share of fi rms reporting positive NPBL
1.440(0.453)
1.331(0.460)
1.191(0.533)
NPBLg,1998 in €billion –0.010(0.004)
Constant –0.166(0.085)
–0.257(0.094)
–0.258(0.094)
–0.320(0.100)
–0.289(0.099)
–0.891(0.128)
Number of observations 1,074 1,065 1,074 1,065 1,065 1,065Notes: All regressions are based on corporations with nonnegative NPBL. Heteroskedasticity-consistent robust (Huber-White) standard errors are in parentheses.Sources: Authors’ calculations based on German Federal Statistical Offi ce and Statistical Offi ces of the Länder; CIT statistics 1998, 2001, and 2004 as discussed in footnote 18; and value-added tax statistics 1998, 2001, and 2004, discussed in footnote 36.
National Tax Journal136
coeffi cient of our instrument achieves a t-statistic of approximately 30. We calculated the partial R² for our instrument to test for the relevance of the instruments explicitly in our multivariate setting — as suggested by Shea (1997) and Godfrey (1999) — and obtained a value of 0.42. Our instrument thus is highly correlated with the change in the actually observed ATR and our 2SLS estimation is not likely to suffer from the weak instrument problem (Stock, Wright, and Yogo, 2002).39
As a benchmark, column 1 reports the 2SLS estimation results without control variables. The estimated tax base elasticity is negative, with a point estimate of –0.31, which is statistically different from zero at the 10 percent level (two-sided test, t-value = –1.75). Adding the control variables leaves the point estimate of the estimated tax base elasticity in column 2 virtually unchanged but reduces its estimated standard error; the elasticity becomes signifi cant at the 5 percent level (t-value = –1.96).40
The only control variable that seems signifi cant in the regression is the relative change of sales: a 10 percent increase in sales raises the tax base by approximately 2 percent. As described earlier, the sales variable is derived from VAT statistics, the only data source available at a level of aggregation that matches the data in our pseudo-panel. In Germany, exports are exempt from VAT and thus not included in our sales variable, which potentially introduces measurement error. However, assuming export shares did not change in the observation period, this measurement error should be accounted for by the group fi xed effects. This assumption also holds for shocks to the corporate tax base, which may affect the volume of sales as long as this relation has not changed during the observation period.
Since both these assumptions clearly could be questioned, we estimated the regres-sion without the potentially endogenous sales variable (and the interaction term). In column 3, this approach has virtually no effect on the estimated tax base elasticity and a change in the ATR appears to have little effect on sales. We interpret this evidence to suggest that the change in the ATR affects the corporate tax base through income-shifting responses rather than real responses related to changes in the volume of sales.41
Another potential bias may result from a selection effect; we only include corpora-tions with nonnegative NPBL. If this selection is determined by fi xed group effects, our fi rst-difference estimation should control for it. However, we cannot rule out the possibility that the factors that affect this selection change over the observation period. Because we do not observe factors that might correlate with time-varying selection, we
39 The full fi rst-stage regression results are available in a web appendix at http://www.wiwiss.fu-berlin.de/en/institute/wirtschaftspolitik-geschichte/steiner/index.html.
40 As a sensitivity check, we included the square of the tax variable to identify any non-linear effects of tax changes on changes of the corporate tax base. The estimated coeffi cients of the linear and quadratic terms of the tax variable remained jointly statistically signifi cant at the 10 percent level and the estimated elasticities, evaluated at the sample means, were virtually identical in the two specifi cations.
41 A bivariate instrumental variable regression of the relative change in total sales from 1998–2001 on the relative change of the ATR in this period with the same instrument as in the tax base regression yielded a coeffi cient estimate of 0.056 with a t-value of 0.38.
Profi t Taxation and the Elasticity of the Corporate Income Tax Base 137
cannot control for them using a formal selectivity correction (i.e., standard Heckman selection procedure). We can, however, approximate the selection term as the average probability of nonnegative NPBL in a group, in terms of the share of corporations that report nonnegative NPBL in a given year (column 4). The change of the share of cor-porations with positive NPBL is highly signifi cant and has a relatively strong effect on the elasticity estimate; it increases in absolute value to –0.533, with a t-value of –2.7.42
The change in tax base in the observation period may correlate with its level in 1998, perhaps due to a regression-to-the-mean effect (Gruber and Saez, 2002, discuss this issue in a related context). To account for potential changes in tax base over time with respect to the initial tax base, we control for the fi rst-period NPBL in column 5. Including the level of the tax base in 1998 has virtually no effect on the estimated tax base elasticity (point estimate = –0.487). We interpret this information as alleviating potential concerns about the exclusion of lagged levels of the tax base from our estimating equation and maintain our focus on the estimation results of column 4.
The last column in Table 2 shows that the point estimate of this elasticity changes little when we extend the estimation period to 1998–2004, which gives more time for fi rms to adjust to the tax reform.43 The limited independent variation in the ATR in this latter period implies that the estimated standard error of this long-run elasticity increases substantially, and its point estimate is not statistically different from our preferred elasticity estimate in column 4. We obtained similar results when we estimated the alternative specifi cations of our basic regression model for the extended time period.44
An alternative to the two-period fi rst-difference estimator is a group fi xed effects regression using all three years and including year fi xed effects. Estimating (3) in levels, including group fi xed effects and two time dummies, yields an estimated β of –0.744 with a (robust) standard error of 0.655. This extremely large standard error results from the insuffi cient independent variation in the ATR within groups during 2001–2004 and sug-gests that the identifi cation of tax effects requires exogenous changes induced by a major tax reform. We therefore maintain our focus on the estimation results for 1998–2001.
Although somewhat sensitive to the treatment of corporate losses, our 2SLS estimates suggest a relatively strong elasticity of the tax base, as measured by NPBL, to a cor-poration’s ATR. Tax policy directly affects the statutory CIT rate rather than the ATR, which is determined by the interaction between the statutory tax rate and the tax base, and is targeted at taxable income driving tax revenues rather than NPBL. To determine
42 Adding the squared selection term leaves our estimation results unchanged. The coeffi cient for the tax base elasticity is –0.529 with a t-value of –2.70.
43 The point estimate for sales from 1998–2004 approximately doubles that of the 1998–2001 period. A bivariate regression of the relative change in total sales over 1998–2004 on the relative change of the ATR in this period — the same instrumental variable as in the tax base regression — results in a coeffi cient of –1.426 (t-value = –2.19). Unlike in the short run, a change in the ATR may infl uence real activity in the long term. Reestimating column 6 without changes in sales and the related interaction term still indicates not much effect on the elasticity of the CIT base: the tax base coeffi cient is –0.496, with a t-value of 1.77.
44 These regression results are available in a web appendix at http://www.wiwiss.fu-berlin.de/en/institute/wirtschaftspolitik-geschichte/steiner/index.html.

National Tax Journal138
the elasticity of TI with respect to the statutory CIT rate, we calculate ηTI,τ ≡ (ΔTI/Δτ) × (τ/TI) by multiplying our elasticity estimate, ηNPBL,ATR , by the product of the elasticity of TI with respect to NPBL (ηTI,NPBL) and the elasticity of the ATR with respect to the statutory corporate tax rate (ηATR,τ,).
As we discussed in Section III.B, only in the unlikely case that deductions and allowances are proportional to NPBL and in the absence of loss carry-forward and loss carry-backward is there a simple relationship among changes in the statutory corporate tax rate, the tax base elasticity, and change in tax revenues. In this case, ηTI,NPBL = ηATR,τ = 1, and our preferred estimate of ηNPBL,ATR = –0.53 implies a reduction of the statutory tax rate by 10 percent would result in an increase of TI by 5 percent. However, because the deductions are not proportional to NPBL, and considering the importance of loss carry-forward, we need estimates of ηATR,τ and ηTI,NPBL to calculate ηTI,τ. Again turning to our corporate tax microsimulation model BizTax, we fi nd ηATR,τ = 0.855 and ηTI,NPBL = 1.062.45 With these estimates and our preferred estimate for ηNPBL,ATR, we fi nd that a 10 percent reduction of the statutory tax rate increases TI by 4.8 percent and ηTI,NPBL to calculate ηTI,τ , which is only slightly smaller than the estimate we obtained with an assumption of proportionality of deductions and NPBL. Thus, we may conclude that, at least for our application, ηNPBL,ATR ≅ ηTI,τ .
How does this tax base elasticity compare with that obtained by Gruber and Rauh (2007)? They report an elasticity estimate of 0.2, yet their estimate refers to the elastic-ity of taxable income with respect to the net-of-marginal CIT rate. The statutory and marginal tax rates are (slightly) progressive in the United States, whereas the statutory corporate tax is constant in Germany. Further, Gruber and Rauh base their estimation on the effective net-of-tax rate while we focus on the average ATR.46 To make the two estimates roughly comparable, we calculate ηTI,1–τ ≡ (ΔTI/Δ(1 – τ)) × ((1 – τ)/TI) = (–1) × ηTI,τ × (1 – τ)/τ. Multiplying ηTI,τ = –0.48 by (–1) × (1 – τ)/τ = (–1) × (1 – 0.45)/0.45 = –1.22 yields the elasticity of taxable income with respect to the net-of-tax rate, ηTI,1–τ = –.48 × –1.22 = 0.58.47 This net-of-tax rate elasticity — which is comparable to the estimate obtained by Gruber and Rauh (2007) — is more than double their estimate of 0.20 for U.S. data.
We highlight two main reasons for this difference, apart from the obvious differences in the two countries. First, their study is based on accounting data and only covers part of the corporate sector. In the United States, companies that choose to be organized as S-corporations are taxed solely under the personal tax code, whereas in Germany corporations cannot adjust along this margin. For this reason we would expect a smaller
45 These simulations assume any response to a tax rate change is accounted for by the estimated tax base elasticity.
46 Note that if increases in NPBL do not increase TI, these increases effectively face a zero marginal tax rate. Conversely, increases in NPBL that are fully driven by TI face a marginal tax rate larger than the ATR. This might also partly explain the larger elasticity estimate we obtain relative to the one reported by Gruber and Rauh.
47 The factor (1 – 0.45) / 0.45 refers to the statutory CIT rate for retained profi ts in 1998.

Profi t Taxation and the Elasticity of the Corporate Income Tax Base 139
elasticity for the United States. It should be noted, however, that the data used by Gruber and Rauh only include publicly traded C-corporations; how this data restriction affects the estimated elasticity is unclear. Second, their effective tax rate measure mainly affects marginally profi table investments and does not account for various tax shields, such as the tax loss carry-forward.
Let us now turn back to our estimate of the tax base elasticity with respect to the ATR, which also can answer questions about how changes in the statutory tax rate affect corporate tax revenues (as shown in (1)). Taking our elasticity estimate of –0.5 and assuming for simplicity that proportionality exists between deductions and NPBL, we expect that a 10 percent reduction of the statutory corporate tax rate reduces corporate tax revenues by 5 percent. This amount is only half the loss in tax revenues that results from a tax rate reduction, in the absence of any income shifting and real responses of corporations to the tax change.
Thus, our estimate implies tax rate reductions are partly self-fi nancing, but it does not support recent Laffer curve estimates for the corporate sector (Clausing, 2007; Devereux, 2007; Brill and Hassett, 2007), which imply that a reduction of the statutory CIT rate increases corporate tax revenues. Even though the revenue decline was much smaller than it might have been in the absence of any behavioral response,48 consistent with our empirical tax base elasticity measure, we did not observe any increase in corporate tax revenues in this period.
Although our estimated average elasticity is not compatible with a Laffer curve effect for the corporate sector overall in Germany, certain subgroups may be more responsive to tax rate changes. That is, the average tax base elasticity may hide important differ-ences across corporations, and such heterogeneity may provide crucial information for developing tax policy. In particular, the tax base elasticity may differ according to income-shifting opportunities.49 We undertake further estimations to account at least partially for potential heterogeneity in tax base elasticities.
B. Heterogeneous Tax Base Ela sticities
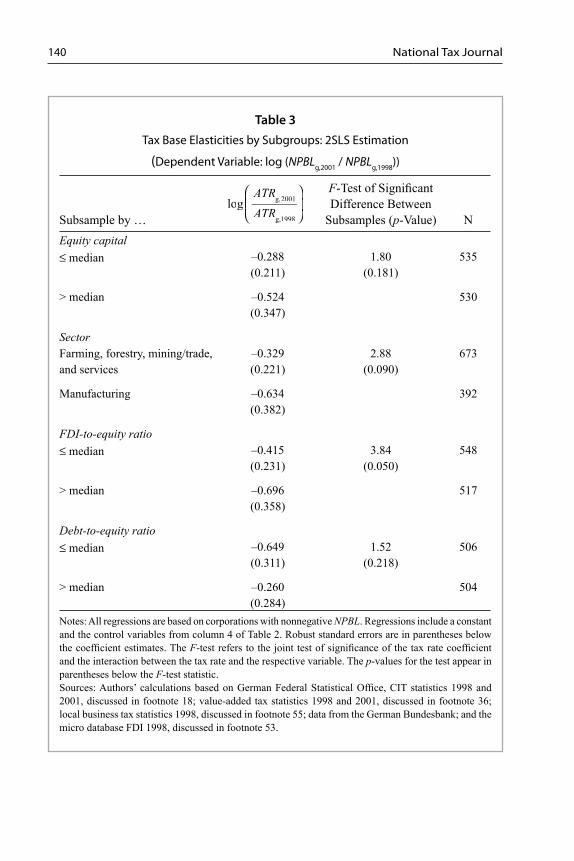
In Table 3, we report the estimated tax base elasticities by subgroups, according to our preferred model specifi cation in column 4 of Table 2. The fi rst panel summarizes the estimation results when we account for differences in the average size of corpora-tions within groups. Large corporations might have better tax-shifting opportunities than small fi rms, as well as more means at their disposal to take advantage of these opportunities. For example, fi rms might face fi xed costs to set up affi liates to use as
48 In 1998, the CIT assessed was €30.56 billion, while it amounted to €24.79 billion in 2001, i.e., CIT as-sessed declined by €5.77 billion. Without any tax base effects the reduction in the CIT rate by 44 percent would have resulted in a decline of CIT assessed by 0.44 × €30.56 billion = €13.45 billion.
49 In his study of the elasticity of taxable personal income with respect to the personal marginal income tax, Kopczuk (2005) shows that the size of this elasticity depends on the degree to which induced changes in the tax base vary across taxpayers.
National Tax Journal140
Table 3Tax Base Elasticities by Subgroups: 2SLS Estimation
(Dependent Variable: log (NPBLg,2001 / NPBLg,1998))
Subsample by …
F-Test of Signifi cant Difference Between
Subsamples (p-Value) NEquity capital≤ median –0.288
(0.211)1.80
(0.181)535
> median –0.524(0.347)
530
SectorFarming, forestry, mining/trade, and services
–0.329(0.221)
2.88(0.090)
673
Manufacturing –0.634(0.382)
392
FDI-to-equity ratio≤ median –0.415
(0.231)3.84
(0.050)548
> median –0.696(0.358)
517
Debt-to-equity ratio≤ median –0.649
(0.311)1.52
(0.218)506
> median –0.260(0.284)
504
Notes: All regressions are based on corporations with nonnegative NPBL. Regressions include a constant and the control variables from column 4 of Table 2. Robust standard errors are in parentheses below the coeffi cient estimates. The F-test refers to the joint test of signifi cance of the tax rate coeffi cient and the interaction between the tax rate and the respective variable. The p-values for the test appear in parentheses below the F-test statistic.Sources: Authors’ calculations based on German Federal Statistical Offi ce, CIT statistics 1998 and 2001, discussed in footnote 18; value-added tax statistics 1998 and 2001, discussed in footnote 36; local business tax statistics 1998, discussed in footnote 55; data from the German Bundesbank; and the micro database FDI 1998, discussed in footnote 53.
⎛
⎝⎜⎛⎛
⎝⎝
⎞
⎠⎟⎞⎞
⎠⎠
ATRTTATRTT
logg,2001
g,1998

Profi t Taxation and the Elasticity of the Corporate Income Tax Base 141
tax shelters and tax shifting costs per euro also might decline with the volume of tax avoidance. To measure such scale effects we use average equity capital,50 measured at the beginning of our observation period to avoid the potential endogeneity of changes in the ATR and equity in the observation period. By splitting the sample at the median in terms of equity capital, we fi nd that the corporate tax base of larger fi rms (–0.52) tends to be more elastic than that of smaller companies (–0.29). This difference, however, is not statistically well determined in our sample (F-test = 1.80),51 i.e., we cannot reject a null hypothesis of no difference in tax base elasticities between smaller and larger fi rms.
Next we investigate whether manufacturing fi rms are more sensitive to the ATR than fi rms in the service sector are. Studying multinational fi rms’ investment in tax havens, Gumpert, Hines, and Schnitzer (2011) fi nd that for manufacturers the probability that a fi rm invests in a tax haven positively depends on taxation in non-haven countries. In contrast, for fi rms in the service sector taxation in non-haven countries does not infl uence tax haven investment, despite their widespread presence in tax havens. The authors argue that this fi nding is due to service fi rms’ low fi xed cost of setting up a tax haven affi liate; manufacturers face higher fi xed costs in setting up an affi liate so that only those fi rms which have a large tax incentive for tax haven investment choose to bear these costs. If this relationship holds true we expect manufacturing fi rms to react more strongly to a change in the ATR than fi rms in the service sector or in agriculture.
Estimation results are given in the second panel of Table 3. Because there are few groups in farming, forestry, and mining, we aggregate them with the service and trade sector.52 When we split the sample by sector and estimate the regression model separately, we fi nd that the tax base effect in manufacturing is greater than in the agriculture and service sectors. The point estimates imply a tax base elasticity of –0.63 in manufactur-ing (statistically signifi cantly different from 0 at the 5 percent level, two-sided test), compared with only –0.33 in the combined agriculture and service sector (marginally signifi cant at the 10 percent level). The relatively large estimated standard errors pre-vent us from detecting statistically signifi cant sector differences in the estimated tax base elasticities. Although the coeffi cient of the tax variable and the sector interaction term are jointly signifi cant at the 10 percent level (F-value = 2.88), the coeffi cient of the interaction term is not signifi cant (t-value = –0.58). In other words, the data do not reject pooling the two sectors and estimating the tax base elasticity on this pooled
50 The data set records the amount of equity capital at the individual corporation level as the sum of retained earnings and contributions to capital if they occurred after the company was founded and after 1977. We approximate the average corporate capital stock within each group by adding the legal minimum deposit, which amounts to €25,000 for private limited-liability companies and €50,000 for public companies.
51 The F-test applies to a regression that includes an interaction term between the ATR and the equity ratio, where the interaction term also is instrumented by the interaction between the simulated ATR and the equity ratio.
52 Excluding corporations in farming, forestry, and mining from the estimation sample as a robustness check had very little effect on the estimation results.

National Tax Journal142
sample. We believe that this fi nding mainly refl ects the strong heterogeneity (high error variance) within sectors, though the sample size of our pseudo-panel puts tight limits on possibilities for further sector differentiation.
Another relevant differentiation of groups, suggested by the recent literature on international tax competition and FDI, distinguishes by FDI intensity within groups (e.g., Hines, 1999; Bartelsman and Beetsma, 2003). We might expect corporations that undertook relatively signifi cant FDI in the past to have better future opportunities to reduce their tax liabilities at home through transfer pricing, debt shifting, and other tax shields provided by affi liates abroad. Thus, future changes in tax rates might have stronger effects, ceteris paribus, on corporations with a relatively large FDI stock.
To test this hypothesis we obtained group-level FDI information from the Micro-database Direct Investment (MiDi) of the German Bundesbank. These data include information on German parent corporations and their foreign affi liates. The parents are required by law to report information on their FDI if the balance sheet total of the affi liate and the ownership share are larger than a given threshold (Lipponer, 2003).53 The information is available at a slightly more aggregate level than our grouping,54 but on the basis of this information, we can calculate the ratio of FDI to equity capital in 1998 and defi ne two subsamples, one with an FDI ratio less than or equal to the median, and one with an FDI ratio above the median.
The estimation results for these two subsamples, summarized in the third panel of Table 3, are compatible with the hypothesis that corporations with large direct investments abroad and thus better profi t-shifting opportunities respond more strongly to changes in the ATR than do groups with a lower level of FDI. For industries in the upper part of the FDI distribution, the point estimate implies a tax base elasticity of approximately –0.70, compared with –0.42 for groups with an FDI share below the median. Again, this difference is poorly determined statistically in our sample. The coeffi cient on the tax variable and the FDI interaction term are jointly signifi cant at the 5 percent level (F-value = 3.84) in the pooled regression, but the coeffi cient of the interaction term is not statistically signifi cantly different from 0. Nor can we reject the hypothesis that the average tax base elasticity of fi rms with a high FDI ratio is –1 and that it is 0 in the sector with a low ratio; our elasticity estimates differentiated by subgroups are not pre-cise enough to distinguish these alternative hypotheses. The average tax base elasticity across both groups remains at –0.5.
We also test the hypothesis that corporations benefi ting from tax shields react less to changes in tax rates. Interest on a corporation’s debt may act as such a shield; we expect
53 The threshold varies over time. In 1998, reporting was mandatory if the foreign affi liate’s balance sheet total exceeded €5.1 million and ownership shares/voting rights of the German parent company were between 10 percent and 50 percent. If the foreign affi liate’s balance sheet total was between €0.5 million and €5.1 million, reporting was only necessary if owenership shares/voting rights were above 20 percent. Researchers have access to the data, “Micro Data.” Deutsche Bundesbank, http://www.bundesbank.de/vfz/vfz_forschungsdaten_einzeldaten.en.php.
54 The MiDi data do not allow aggregation by federal states or industries at the four- or fi ve-digit level. To merge the MiDi data with our pseudo-panel, we impute the FDI per sales share from the MiDi data at the three-digit industry level for Germany overall to the four- and fi ve-digit level.
Profi t Taxation and the Elasticity of the Corporate Income Tax Base 143
the tax base of corporations with a relatively high debt-to-equity ratio to respond less to tax changes than would corporations that can take less advantage of this particular shield. The reason for this is that a corporation with deductions for interest payments is subject to a lower ATR when compared to a company without such a tax shield, implying that the reduction in the statutory tax rate is less valuable to the debt-fi nanced corporation. At the group level, we measure the tax shield as the amount of interest paid by a corporation on its long-term debt relative to its equity capital.55 Interest should be proportional to the level of corporate long-term debt, so we refer to this variable as the debt/equity ratio. The estimation results in the lower part of Table 3 support the hypothesis that corporations with tax shields react less strongly, as the point estimate of the tax base elasticity for groups with a relatively high debt-to-equity ratio is –0.26, not statistically different from 0, and much lower than the estimated elasticity for the comparison group (–0.65). However, the large standard errors of these estimates again do not enable us to reject the hypothesis that estimated tax base elasticities do not differ between the two groups (F-test = 1.52).
Overall, we fi nd some suggestive evidence of differences in tax base elasticities with respect to variables related to income-shifting activities and tax shields, such as the sec-tor, a corporation’s size, its FDI intensity, and its capital structure. Yet these differences are not statistically signifi cant. This insignifi cance probably refl ects the limitations of our relatively small pseudo-panel data set, which does not allow us to split the sample effectively into smaller subgroups. In addition, instrumental variable estimators tend to yield fairly large standard errors of estimated coeffi cients in small and medium-sized samples. Our preferred specifi cation thus implies that the average corporate tax base elasticity is –0.5 and there is relatively little variation across industries in terms of sec-tor, size, capital structure, or FDI intensity.
VI. CONCLUSION
This study contributes to the small empirical literature that investigates the elasticity of the corporate tax base with respect to the corporate tax rate. Knowledge of the magnitude of this elasticity is important for evaluating the revenue and welfare implications of
55 Information about interest on long-term debt is not available in the corporate income tax statistics but can be derived from local business tax statistics, which cover the same population of corporations and are available for the same years as the corporate tax statistics. The two statistics cannot be matched on the micro level, however, so we imputed information on interest payments from the local business tax statistics using the same aggregation scheme as for our pseudo-panel data (Section IV.A.1). Access to the micro-level data of the local business tax statistics is provided by “Research Data Centres of the Statistical Offi ces.” The Federal and State Statistical Offi ces, www.forschungsdatenzentren.de. English-language information about these data is available at “Trade Tax.” Federal Statistical Offi ce, http://www.destatis.de/jetspeed/portal/cms/Sites/destatis/Internet/EN/Navigation/Statistics/FinanzenSteuern/Steuern/Gewerbesteuer/Gewerbesteuer.psml. Equity capital may be negative due to differences in tax and commercial balance sheet valuations, as well as the transition rules from the tax credit to the half-income method. As a sensitivity check, we included the rare cases with negative equity capital in the estimation sample; they had almost no effect on the tax base elasticity in the subgroup with a relatively low debt-to-equity ratio.
National Tax Journal144
corporate tax policies. An important advantage of the tax return data used in this study is that they enable calculation of ATRs and the CIT base taking into account various tax shields, including unused loss carry-forwards that are of great quantitative importance for the corporate sector in the German economy for the time period analyzed. For the estimation, we used a pseudo-panel constructed from our aggregation of individual-level corporate tax return data into groups defi ned by industry and region. With this pseudo-panel, we can control for unobserved group fi xed effects, which may correlate with both the corporate tax base (i.e., NPBL) and the ATR.
The main methodological concern for our estimation of this elasticity is the potential endogeneity of the ATR, which is partly determined by taxable income. To control for this, we used as an instrumental variable the counterfactual ATR a corporation would have faced in a particular period had there been no change in profi ts within the corpora-tion’s control during the period. This counterfactual value stems from a microsimula-tion model of the corporate sector, based on tax return data for 1998 and 2001. During this period, the German government introduced a substantial tax reform that provided suffi cient exogenous variation in ATRs across corporations to identify the corporate taxable income elasticity. Statistical tests indicate our instrument is highly correlated with the change in the actually observed ATR, and that the well-known weak instrument problem does not invalidate our instrumental variable estimation.
Our 2SLS estimation of the basic regression model with the whole sample yields a statistically signifi cant, relatively large point estimate of the tax base elasticity of approximately –0.5, implying that a reduction of the (proportional) statutory corpo-rate tax rate by 10 percent would reduce corporate tax receipts by roughly 5 percent. Converting our estimate into the elasticity of taxable income with respect to the net-of-tax rate yields an estimate of 0.6, on average. This is more than double the estimate obtained with the net-of-tax rate for the United States by Gruber and Rauh (2007). Thus, our estimates imply that reductions of the statutory corporate tax rate are roughly one-half self-fi nancing, in that they signifi cantly reduce corporate income-shifting and other activities that lower the CIT base, but the German corporate sector is not on the declining segment of its Laffer curve. Because the estimated tax base elasticity is not sensitive to the growth rate of sales at the industry level, we interpret the response of the tax base to changes in the ATR as primarily a result of income-shifting activities, rather than real economic responses by the corporate sector related to sales volume (for discussions of taxable income elastiticies in the United States, see Gravelle (2007) for the CIT, Kopczuk (2005) for the personal income tax).
We fi nd some tentative evidence that certain subgroups of corporations may be much more responsive to tax rate changes than the average tax base elasticity for the whole corporate sector indicates. The estimation results regarding heterogeneous tax base elasticities are consistent with the hypothesis that the tax base is more elastic among corporations that can benefi t from income shifting, such as large corporations and cor-porations with a relatively high share of FDI. We also fi nd evidence that manufacturers which might face higher fi xed costs in setting up new affi liates react more strongly to tax incentives in their home country, compared to fi rms in the primary and tertiary sector.
Profi t Taxation and the Elasticity of the Corporate Income Tax Base 145
As we expected, the tax base of corporations with a relatively high debt-to-equity ratio responds less to tax changes. However, the weak statistical precision of these results prevents us from drawing overly strong conclusions from our pseudo-panel. Testing hypotheses about these differential effects across fi rms with greater statistical precision would require a true panel of corporate tax return data, which currently is not available for most countries, including Germany.
ACKNOWLEDGMENTS
This paper was part of a research project at DIW Berlin supported by the German Federal Ministry of Finance. The results and opinions expressed herein are those of the authors and do not necessarily refl ect the views of the Federal Ministry of Finance or DIW Berlin. We thank two anonymous referees, George Zodrow, William M. Gentry, Christian Traxler, and numerous seminar participants at DIW Berlin, the Science Cen-ter Berlin, the Deutsche Bundesbank, the Annual Meeting of the European Economic Association, the Annual Meeting of the German Economic Association, and the Annual Meeting of the Austrian Economic Association for their helpful comments on a previ-ous version of this article.
REFERENCES
Altshuler, Rosanne, Alan J. Auerbach, Michael Cooper, and Matthew Knittel, 2009. “Under-standing U.S. Corporate Tax Losses.” In Brown, Jeffrey R., and James M. Poterba (eds.), Tax Policy and the Economy, Volume 23, 73–122. National Bureau of Economic Research, Cam-bridge, MA.
Auerbach, Alan J., 2007. “Why Have Corporate Tax Revenues Declined? Another Look.” CESifo Economic Studies 53 (2), 153–171.
Bach, Stefan, and Nadja Dwenger, 2007. “Unternehmensbesteuerung: Trotz hoher Steuersätze mäßiges Aufkommen.” DIW Wochenbericht 74 (5), 57–65.
Bartelsman, Eric J., and Roel M. W. J. Beetsma, 2003. “Why Pay More? Corporate Tax Avoidance through Transfer Pricing in OECD Countries.” Journal of Public Economics 87 (9-10), 2225–2252.
Blasch, Frank, and Alfons J. Weichenrieder, 2005. “Konzepte für die Unternehmensbesteuerung.” Orientierungen zur Wirtschafts- und Gesellschaftspolitik 103, 26–33.
Blasch, Frank, and Alfons J. Weichenrieder, 2007. “When Taxation Changes the Course of the Year: Fiscal-Year Adjustment and the German Tax Reform of 2000–2001.” Fiscal Studies 28 (3), 367–377.
Brill, Alex, and Kevin A. Hassett, 2007. “Revenue-Maximizing Corporate Income Taxes: The Laffer Curve in OECD Countries.” Working Paper No. 137. American Enterprise Institute, Washington, DC.
National Tax Journal146
Buettner, Thiess, Michael Overesch, Ulrich Schreiber, and Georg Wamser, 2006. “The Impact of Thin-Capitalization Rules on Multinationals’ Financing and Investment Decisions.” Working Paper No. 06-068. ZEW Mannheim, Mannheim, Germany.
Chetty, Raj, 2009. “Is the Taxable Income Elasticity Suffi cient to Calculate Deadweight Loss? The Implications of Evasion and Avoidance.” American Economic Journal: Economic Policy 1 (2), 31–52.
Clausing, Kimberly A., 2007. “Corporate Tax Revenues in OECD Countries.” International Tax and Public Finance 14 (2), 115–133.
Clausing, Kimberly A., 2009. “Multinational Firm Tax Avoidance and Tax Policy.” National Tax Journal 62 (4), 703–725.
Cooper, Michael, and Matthew Knittel, 2006. “Partial Loss Refundability: How Are Corporate Tax Losses Used?” National Tax Journal 59 (3), 651–663.
Devereux, Michael P., 2004. “Measuring Taxes on Income from Capital.” In Sørensen, Peter Birch (ed.), Measuring the Tax Burden on Capital and Labor, 35–72. MIT Press, Cambridge, MA.
Devereux, Michael P., 2007. “Developments in the Taxation of Corporate Profi t in the OECD since 1965: Rates, Bases and Revenues.” Working Paper No. 0704. Oxford University Centre for Business Taxation, Oxford, UK.
Devereux, Michael P., 2008. “Business Taxation in a Globalized World.” Oxford Review of Economic Policy 24 (4), 625–638.
Devereux, Michael P., and Peter Birch Sørensen, 2006. “The Corporate Income Tax: International Trends and Options for Fundamental Reform.” Working Paper No. 264. European Commission, Brussels, Belgium.
Dwenger, Nadja, 2010. “Corporate Income Taxation and Firms’ Investment and Financing Deci-sions.” Doctral dissertation. Free University Berlin, Berlin, Germany, http://www.diss.fu-berlin.de/diss/receive/FUDISS_thesis_000000016178.
Dwenger, Nadja, and Viktor Steiner, 2009. “Financial Leverage and Corporate Taxation: Evidence from German Corporate Tax Return Data.” Working Paper No. 855. DIW Berlin, Berlin, Germany.
European Commission, 2005. “Concept of the ‘Tax Balance Sheet.’” Working Paper. Common Consolidated Corporate Tax Base Working Group, Brussels, Belgium.
Feldstein, Martin, 1999. “Tax Avoidance and the Deadweight Loss of the Income Tax.” Review of Economics and Statistics 81 (4), 674–680.
Fossen, Frank, and Stefan Bach, 2008. “Reforming the German Local Business Tax — Lessons from an International Comparison and a Microsimulation Analysis.” Finanzarchiv 64 (2), 245–272.
Fuest, Clemens, and Alfons J. Weichenrieder, 2002. “Tax Competition and Profi t Shifting: On the Relationship between Personal and Corporate Tax Rates.” Ifo-Studien 48 (4), 611–632.

Profi t Taxation and the Elasticity of the Corporate Income Tax Base 147
Fullerton, Don, 1984. “Which Effective Tax Rate?” National Tax Journal 37 (1), 23–41.
Giertz, Seth H., 2009. “The Elasticity of Taxable Income: Infl uences on Economic Effi ciency and Tax Revenues, and Implications for Tax Policy.” In Viard, Alan D. (ed.), Tax Policy Lessons from the 2000s, 101–136. American Enterprise Institute Press, Washington, DC.
Giertz, Seth H., 2010. “The Elasticity of Taxable Income during the 1990s: New Estimates and Sensitivity Analyses.” Southern Economic Journal 77 (2), 406–433.
Godfrey, Leslie G., 1999. “Instrument Relevance in Multivariate Linear Models.” Review of Economics and Statistics 81 (3), 550–552.
Gordon, Roger H., Laura Kalambokidis, and Joel B. Slemrod, 2004. “A New Summary Measure of the Effective Tax Rate on Investment.” In Sørensen, Peter Birch (ed.), Measuring the Tax Burden on Capital and Labor, 99–128. MIT Press, Cambridge, MA.
Gordon, Roger H., and Joel B. Slemrod, 2000. “Are ‘Real’ Responses to Taxes Simply Income Shifting between Corporate and Personal Tax Bases?” In Slemrod, Joel B. (ed.), Does Atlas Shrug? The Economic Consequences of Taxing the Rich, 240–328. Harvard University Press, Cambridge, MA.
Gottfried, Peter, and Hannes Schellhorn, 2004. “Empirical Evidence on the Effects of Marginal Tax Rates on Income — The German Case.” Working Paper No. 15. IAW Tübingen, Tübingen, Germany.
Gräb, Christoph, 2006. “Körperschaftsteuerstatistik 2001.” In Statistisches Bundesamt (ed.), Wirtschaft und Statistik, Volume 1, 66–70. Wiesbaden, Germany.
Gravelle, Jane, 2007. “Comment on Gruber and Rauh ‘How Elastic Is the Corporate Income Tax Base?’” In Auerbach, Alan J., James R. Hines Jr., and Joel B. Slemrod (eds.), Taxing Corporate Income in the 21st Century, 164–167. Cambridge University Press, Cambridge, MA.
Gruber, Jonathan, and Joshua Rauh, 2007. “How Elastic Is the Corporate Income Tax Base?” In Auerbach, Alan J., James R. Hines Jr., and Joel B. Slemrod (eds.), Taxing Corporate Income in the 21st Century, 140–163. Cambridge University Press, Cambridge, MA.
Gruber, Jonathan, and Emmanuel Saez, 2002. “The Elasticity of Taxable Income: Evidence and Implications.” Journal of Public Economics 84 (1), 1–32.
Gumpert, Anna, James R. Hines Jr., and Monika Schnitzer, 2011. “The Use of Tax Havens in Exemption Regimes.” NBER Working Paper No. 17644. National Bureau of Economic Research, Cambridge, MA.
Hines, James R. Jr., 1999. “Lessons from Behavioral Responses to International Taxation.” National Tax Journal 52 (2), 305–322.
Hines, James R. Jr., and Eric M. Rice, 1994. “Fiscal Paradise: Foreign Tax Havens and American Business.” Quarterly Journal of Economics 109 (1), 149–182.
Kopczuk, Wojciech, 2005. “Tax Bases, Tax Rates and the Elasticity of Reported Income.” Journal of Public Economics 89 (11-12), 2093–2119.
National Tax Journal148
Lipponer, Alexander, 2003. “Deutsche Bundesbank’s FDI Micro Database.” Schmollers Jahrbuch — Journal of Applied Social Science Studies 123 (4), 593–600.
McDonald, Robert L., 2001. “Cross-Border Investing with Tax Arbitrage: The Case of German Dividend Tax Credits.” Review of Financial Studies 14 (3), 617–657.
Merrill, Peter R., 2010. “Corporate Tax Policy for the 21st Century.” National Tax Journal 63 (4), 623–633.
Mintz, Jack M., and Michael Smart, 2004. “Income Shifting, Investment, and Tax Competition: Theory and Evidence from Provincial Taxation in Canada.” Journal of Public Economics 88 (6), 1149–1168.
Organisation for Economic Co-operation and Development, 2007. OECD Tax Policy Studies No. 16: Fundamental Reform of Corporate Income Tax. Organisation for Economic Co-operation and Development, Paris, France.
Overesch, Michael, 2009. “The Effects of Multinationals’ Profi t Shifting Activities on Real Investments.” National Tax Journal 62 (1), 5–23.
Riedl, Aleksandra, and Silvia Rocha-Akis, 2007. “Testing the Tax Competition Theory: How Elastic are National Tax Bases in Western Europe?” Department of Economics Working Papers No. 112. Vienna University of Economics and B.A., Vienna, Austria.
Saez, Emmanuel, 2004. “Reported Incomes and Marginal Tax Rates, 1960–2000: Evidence and Policy Implications.” In Poterba, James M. (ed.), Tax Policy and the Economy, Volume 18, 117–174. MIT Press, Cambridge, MA.
Saez, Emmanuel, Joel B. Slemrod, and Seth H. Giertz, forthcoming. “The Elasticity of Taxable Income with Respect to Marginal Rates: A Critical Review.” Journal of Economic Literature.
Shea, John, 1997. “Instrument Relevance in Multivariate Linear Models: A Simple Measure.” Review of Economics and Statistics 79 (2), 348–352.
Slemrod, Joel B., 1996. “High Income Families and the Tax Changes of the 1980s: The Anatomy of Behavioral Response.” In Feldstein, Martin, and James M. Poterba (eds.), Empirical Founda-tions of Household Taxation, 169–192. University of Chicago Press, Chicago, IL.
Stock, James H., Jonathan H. Wright, and Motohiro Yogo, 2002. “A Survey of Weak Instruments and Weak Identifi cation in Generalized Method of Moments.” Journal of Business and Economic Statistics 20 (4), 518–529.
Weichenrieder, Alfons J., 2007. “Survey on the Taxation of Small and Medium-Sized Enterprises.” Draft Report on Responses to the Questionnaire. Organisation for Economic Co-operation and Development, Paris, France, http://www.oecd.org/dataoecd/52/25/39597756.pdf.
Weichenrieder, Alfons J., 2009. “Profi t Shifting in the EU: Evidence from Germany.” International Tax and Public Finance 16 (3), 281–297.

Profi t Taxation and the Elasticity of the Corporate Income Tax Base 149
APPENDIX
1 The basis for computing a corporation’s profi t as shown in the tax balance sheet is its commercial (fi nancial) balance sheet, with adjustments prescribed by tax law. These adjustments are necessary as commercial law usually permits greater latitude in the valuation of assets, accruals, and liabilities than tax law. Because the commercial balance sheet is based on historical book values, neither commercial nor tax balance sheets include unrealised profi ts and losses; profi ts are rather determined on an accru-als basis. The European Commission (2005) provides details on the concept of tax balance sheet in Germany and on the amendments necessary between commercial and tax balance sheet.
Sales+/– deductions such as interest payments and depreciation allowances, etc.Profi t as shown in tax balance sheet 1
+/– correcting entry concerning valuation (adjustment of values of balance sheet items, non-tax-deductible losses, non-tax-relevant gains, etc.)
+ correction of activities related to shareholders (declared profi t distributions, constructive dividends, repayment of capital or capital increase, hidden contribution, other deposits under company law)
+ nondeductible operating expenses (especially taxes paid, 50 percent of payment to members of the supervisory board, and penalties)
+/– non-tax-relevant domestic increases and decreases in net worth (intercompany dividends, investment subsidies)
+/– corrections related to double taxation agreements, tax legislation relating to non-residents, and fi scal units
= Net profi t before consolidation and loss carry-over– allowable deductions for agriculture and forestry– deductible donations and contributions+/– income generated by fi scal subsidiaries= Net profi t before loss carry-over (NPBL)– loss carry-forward and loss carry-back= Net Income – allowable deductions for agricultural cooperatives= Taxable Income (TI )* statutory tax rate– tax credits for foreign-source income= Corporate income tax assessed (TA)
Table A1Components of the Corporate Tax Base and Corporate Income Tax Assessed

Table A2Descriptive Statistics for Control Variables: Aggregate Level
1998 2001 2004 Δ %2001 Δ %2004
Share of corporations under the tax credit method
1.000(0.000)
0.065(0.051)
0.000(0.000)
–273.34
Number of corporations within each group
641.61(995.65)
714.68(1,120.32)
750.03(1,287.54)
10.79 15.61
Share of groups that contain exclusively fi rms located in Western Germany
0.217(0.413)
0.217(0.413)
0.217(0.413)
0.00 0.00
Sales in €million (average) 131.35(381.56)
149.79(452.01)
119.03(350.38)
13.14 –9.85
Share of groups whose sales are not fully subject to sales tax
0.173(0.378)
0.173(0.378)
0.173(0.378)
0.00 0.00
Sales × share of groups not fully subject to sales tax
118.74(354.81)
130.71(411.76)
94.77(287.95)
9.60 –22.55
Share of corporations reporting a positive NPBL
0.938(0.053)
0.905(0.075)
0.922(0.062)
–3.58 –1.72
Sector dummies Farming, forestry, mining/trade, and services
0.635(0.482)
0.635(0.482)
0.635(0.482)
0.00 0.00
Manufacturing 0.365(0.482)
0.365(0.482)
0.365(0.482)
0.00 0.00
Equity capital in €1,000 (average in 1998) All groups 2,368.45
(18,201.99)
Low share (≤ 50%) 32.45(248.46)
Debt-to-equity ratio (average in 1998) All groups 0.273
(4.183)
Low share (≤ 50%) 0.038(0.026)
FDI-to-equity ratio (average in 1998) All groups 0.009
(0.145)
Low share (≤ 50%) 0.001(0.001)
Notes: Sales and FDI are not available at the individual level. FDI is available only at a more aggregate level (no dif-ferentiation across federal states or four- or fi ve-digit industry level); at that aggregation level, we have 45 observations. A few groups with negative debt-to-equity ratios are excluded. All information is given at the aggregate level. Standard deviations are reported in parentheses. The %Δ2001 (%Δ2004) value is calculated as the difference between logs in 2001 (2004) and 1998, e.g., %ΔNPBL2001 = log(NPBL2001) – log(NPBL1998).Sources: Authors’ calculations are based on data from the German Federal Statistical Offi ce; CIT statistics 1998, 2001, and 2004, discussed in footnote 18; value-added tax statistics 1998, 2001, and 2004, discussed in footnote 36; local business tax statistics 1998 (see footnote 55); data from the German Bundesbank; and micro database foreign direct investment 1998, discussed in footnote 53.