profiling of oracle using function calls - wordpress.com · profiling of oracle using function...
TRANSCRIPT

Profiling of Oracle using function callsBy Frits Hoogland
IntroductionThis presentation is about using the native (free) tools on Linux X86_64 to profile an executable, which is in this case the oracle database executable.
The example used in this whitepaper is taken from the ‘About multiblock reads’ presentation, which is a simple full table scan of a table which consists of 21,504 blocks, containing 1 million rows.
Versions used in the examples:- Oracle Enterprise Linux (‘OEL’) 6u3 X86_64- Oracle database 11.2.0.3 (no PSU/CPU’s) X64- Oracle Grid infrastructure 11.2.0.3 X64 for ASM
Getting startedThere are multiple things you can do when a query does not behave as desired (too slow, using too much resources, etc.). One of the most common things is to profile the query using Oracle’s trace facility at level 8, so a file is generated by the Oracle database foreground session which contains a summary of what the database did. This can be done by executing the following SQL:
TS@v11203 > alter session set events 'sql_trace level 8';
(please mind this requires the ‘alter session‘ privilege)
After which we can issue the ‘problem’ SQL. In this case the select count(*) from the test table t2, which conveniently for this test has no useful indexes for a count and so will do a full table scan:
TS@v11203 > select count(*) from t2;
COUNT(*)---------- 1000000
The result of executing this SQL appears in the tracefile as:

PARSING IN CURSOR #139921996761072 len=23 dep=0 uid=84 oct=3 lid=84 tim=1361051513832424 hv=1020534364 ad='7e3db3f8' sqlid='94dwfa8yd87kw'select count(*) from t2END OF STMTPARSE #139921996761072:c=3000,e=2712,p=1,cr=25,cu=0,mis=1,r=0,dep=0,og=1,plh=3321871023,tim=1361051513832423EXEC #139921996761072:c=0,e=15,p=0,cr=0,cu=0,mis=0,r=0,dep=0,og=1,plh=3321871023,tim=1361051513832479WAIT #139921996761072: nam='SQL*Net message to client' ela= 3 driver id=1413697536 #bytes=1 p3=0 obj#=528 tim=1361051513832523WAIT #139921996761072: nam='Disk file operations I/O' ela= 8 FileOperation=2 fileno=5 filetype=2 obj#=75579 tim=1361051513832865WAIT #139921996761072: nam='KSV master wait' ela= 2100 p1=0 p2=0 p3=0 obj#=75579 tim=1361051513835141WAIT #139921996761072: nam='ASM file metadata operation' ela= 37 msgop=33 locn=0 p3=0 obj#=75579 tim=1361051513835172WAIT #139921996761072: nam='db file sequential read' ela= 446 file#=5 block#=23938 blocks=1 obj#=75579 tim=1361051513835697WAIT #139921996761072: nam='direct path read' ela= 95 file number=5 first dba=23939 block cnt=13 obj#=75579 tim=1361051513837368WAIT #139921996761072: nam='direct path read' ela= 120 file number=5 first dba=28290 block cnt=126 obj#=75579 tim=1361051513874092WAIT #139921996761072: nam='direct path read' ela= 410 file number=5 first dba=28418 block cnt=126 obj#=75579 tim=1361051513875373FETCH #139921996761072:c=143978,e=173011,p=20942,cr=20944,cu=0,mis=0,r=1,dep=0,og=1,plh=3321871023,tim=1361051514005572STAT #139921996761072 id=1 cnt=1 pid=0 pos=1 obj=0 op='SORT AGGREGATE (cr=20944 pr=20942 pw=0 time=173001 us)'STAT #139921996761072 id=2 cnt=1000000 pid=1 pos=1 obj=75579 op='TABLE ACCESS FULL T2 (cr=20944 pr=20942 pw=0 time=76256 us cost=5738 size=0 card=1000000)'WAIT #139921996761072: nam='SQL*Net message from client' ela= 297 driver id=1413697536 #bytes=1 p3=0 obj#=75579 tim=1361051514006008FETCH #139921996761072:c=0,e=2,p=0,cr=0,cu=0,mis=0,r=0,dep=0,og=0,plh=3321871023,tim=1361051514006045WAIT #139921996761072: nam='SQL*Net message to client' ela= 2 driver id=1413697536 #bytes=1 p3=0 obj#=75579 tim=1361051514006063WAIT #139921996761072: nam='SQL*Net message from client' ela= 392 driver id=1413697536 #bytes=1 p3=0 obj#=75579 tim=1361051514006468
Careful inspection of above tracefile shows evidence of 266 blocks actually waited for (1 block via ‘db file sequential read’, 13+126+126 blocks via ‘direct path read’. The rowsource plan shows there are 20942 blocks read via physical path (pr=20942).
Strace.A way to understand how Oracle uses the operating system is by looking at the actual calls it makes to the kernel (‘system’) is ‘strace’ (trace system call and signals). Strace has to be executed as the root user on OEL6. The above execution of ‘select count(*) from t2’ results in the following output (sql_trace disabled):(in order to use strace in this way, you need to execute strace on the same server as the database foreground process is running, and find the process number of this process either in the database (V$PROCESS.SPID), or on the linux server)
[root@ol63-oracle ~]# strace -p 4015Process 4015 attached - interrupt to quitread(16, "\0014\0\0\6\0\0\0\0\0\21i&\376\377\377\377\377\377\377\377\2\0\0\0\0\0\0\0\7\0\0"..., 8208) = 308getrusage(RUSAGE_SELF, {ru_utime={0, 124981}, ru_stime={0, 258960}, ...}) = 0times({tms_utime=12, tms_stime=25, tms_cutime=0, tms_cstime=0}) = 429797470getrusage(RUSAGE_SELF, {ru_utime={0, 124981}, ru_stime={0, 258960}, ...}) = 0getrusage(RUSAGE_SELF, {ru_utime={0, 124981}, ru_stime={0, 258960}, ...}) = 0

times({tms_utime=12, tms_stime=25, tms_cutime=0, tms_cstime=0}) = 429797470getrusage(RUSAGE_SELF, {ru_utime={0, 124981}, ru_stime={0, 258960}, ...}) = 0times({tms_utime=12, tms_stime=25, tms_cutime=0, tms_cstime=0}) = 429797470getrusage(RUSAGE_SELF, {ru_utime={0, 124981}, ru_stime={0, 258960}, ...}) = 0times({tms_utime=12, tms_stime=25, tms_cutime=0, tms_cstime=0}) = 429797470getrusage(RUSAGE_SELF, {ru_utime={0, 124981}, ru_stime={0, 258960}, ...}) = 0times({tms_utime=12, tms_stime=25, tms_cutime=0, tms_cstime=0}) = 429797470times({tms_utime=12, tms_stime=25, tms_cutime=0, tms_cstime=0}) = 429797470times({tms_utime=12, tms_stime=25, tms_cutime=0, tms_cstime=0}) = 429797470times({tms_utime=12, tms_stime=25, tms_cutime=0, tms_cstime=0}) = 429797470times({tms_utime=12, tms_stime=25, tms_cutime=0, tms_cstime=0}) = 429797470getrusage(RUSAGE_SELF, {ru_utime={0, 124981}, ru_stime={0, 258960}, ...}) = 0getrusage(RUSAGE_SELF, {ru_utime={0, 124981}, ru_stime={0, 258960}, ...}) = 0getrusage(RUSAGE_SELF, {ru_utime={0, 124981}, ru_stime={0, 258960}, ...}) = 0times({tms_utime=12, tms_stime=25, tms_cutime=0, tms_cstime=0}) = 429797470getrusage(RUSAGE_SELF, {ru_utime={0, 124981}, ru_stime={0, 258960}, ...}) = 0getrusage(RUSAGE_SELF, {ru_utime={0, 124981}, ru_stime={0, 258960}, ...}) = 0getrusage(RUSAGE_SELF, {ru_utime={0, 124981}, ru_stime={0, 258960}, ...}) = 0getrusage(RUSAGE_SELF, {ru_utime={0, 124981}, ru_stime={0, 258960}, ...}) = 0times({tms_utime=12, tms_stime=25, tms_cutime=0, tms_cstime=0}) = 429797470times({tms_utime=12, tms_stime=25, tms_cutime=0, tms_cstime=0}) = 429797470getrusage(RUSAGE_SELF, {ru_utime={0, 124981}, ru_stime={0, 258960}, ...}) = 0mmap(0x7f4220d19000, 524288, PROT_READ|PROT_WRITE, MAP_PRIVATE|MAP_FIXED, 7, 0) = 0x7f4220d19000io_submit(139922028630016, 1, {{0x7f4220ede450, 0, 0, 0, 257}}) = 1mmap(NULL, 2097152, PROT_READ|PROT_WRITE, MAP_PRIVATE|MAP_NORESERVE, 7, 0x4f4000) = 0x7f4220a89000mmap(0x7f4220a89000, 1114112, PROT_READ|PROT_WRITE, MAP_PRIVATE|MAP_FIXED, 7, 0) = 0x7f4220a89000io_submit(139922028630016, 1, {{0x7f4220ede1f8, 0, 0, 0, 257}}) = 1io_getevents(139922028630016, 2, 128, {{0x7f4220ede450, 0x7f4220ede450, 106496, 0}, {0x7f4220ede1f8, 0x7f4220ede1f8, 122880, 0}}, {0, 0}) = 2...
If you look at this output it is relatively short because we have eliminated all the sql_trace enabled writes to the trace file, but it’s also hard to understand which calls belong to which actions in the Oracle process (PARSE/EXEC/WAIT/FETCH). Many folks do this because a lot of extra “lseek” and “write” operations to the trace file in the output seem to lack value. However, it’s possible to link the two together by letting strace display all information of a write call using the -e write=all option (together with -e all to get strace to fetch any system call, besides the write call) ,and having enabled sql_trace at level 8 to let Oracle write events it finds notably during execution:
[root@ol63-oracle ~]# strace -p 4015 -e write=all -e all
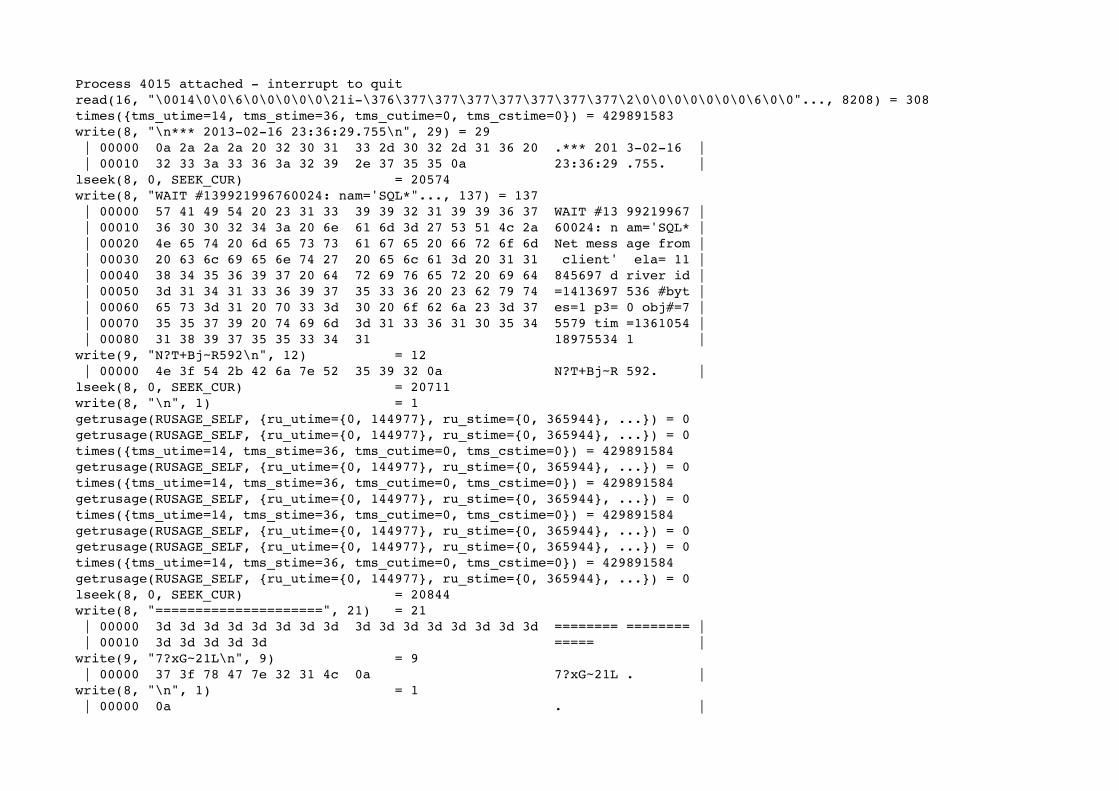
Process 4015 attached - interrupt to quitread(16, "\0014\0\0\6\0\0\0\0\0\21i-\376\377\377\377\377\377\377\377\2\0\0\0\0\0\0\0\6\0\0"..., 8208) = 308times({tms_utime=14, tms_stime=36, tms_cutime=0, tms_cstime=0}) = 429891583write(8, "\n*** 2013-02-16 23:36:29.755\n", 29) = 29 | 00000 0a 2a 2a 2a 20 32 30 31 33 2d 30 32 2d 31 36 20 .*** 201 3-02-16 | | 00010 32 33 3a 33 36 3a 32 39 2e 37 35 35 0a 23:36:29 .755. |lseek(8, 0, SEEK_CUR) = 20574write(8, "WAIT #139921996760024: nam='SQL*"..., 137) = 137 | 00000 57 41 49 54 20 23 31 33 39 39 32 31 39 39 36 37 WAIT #13 99219967 | | 00010 36 30 30 32 34 3a 20 6e 61 6d 3d 27 53 51 4c 2a 60024: n am='SQL* | | 00020 4e 65 74 20 6d 65 73 73 61 67 65 20 66 72 6f 6d Net mess age from | | 00030 20 63 6c 69 65 6e 74 27 20 65 6c 61 3d 20 31 31 client' ela= 11 | | 00040 38 34 35 36 39 37 20 64 72 69 76 65 72 20 69 64 845697 d river id | | 00050 3d 31 34 31 33 36 39 37 35 33 36 20 23 62 79 74 =1413697 536 #byt | | 00060 65 73 3d 31 20 70 33 3d 30 20 6f 62 6a 23 3d 37 es=1 p3= 0 obj#=7 | | 00070 35 35 37 39 20 74 69 6d 3d 31 33 36 31 30 35 34 5579 tim =1361054 | | 00080 31 38 39 37 35 35 33 34 31 18975534 1 |write(9, "N?T+Bj~R592\n", 12) = 12 | 00000 4e 3f 54 2b 42 6a 7e 52 35 39 32 0a N?T+Bj~R 592. |lseek(8, 0, SEEK_CUR) = 20711write(8, "\n", 1) = 1getrusage(RUSAGE_SELF, {ru_utime={0, 144977}, ru_stime={0, 365944}, ...}) = 0getrusage(RUSAGE_SELF, {ru_utime={0, 144977}, ru_stime={0, 365944}, ...}) = 0times({tms_utime=14, tms_stime=36, tms_cutime=0, tms_cstime=0}) = 429891584getrusage(RUSAGE_SELF, {ru_utime={0, 144977}, ru_stime={0, 365944}, ...}) = 0times({tms_utime=14, tms_stime=36, tms_cutime=0, tms_cstime=0}) = 429891584getrusage(RUSAGE_SELF, {ru_utime={0, 144977}, ru_stime={0, 365944}, ...}) = 0times({tms_utime=14, tms_stime=36, tms_cutime=0, tms_cstime=0}) = 429891584getrusage(RUSAGE_SELF, {ru_utime={0, 144977}, ru_stime={0, 365944}, ...}) = 0getrusage(RUSAGE_SELF, {ru_utime={0, 144977}, ru_stime={0, 365944}, ...}) = 0times({tms_utime=14, tms_stime=36, tms_cutime=0, tms_cstime=0}) = 429891584getrusage(RUSAGE_SELF, {ru_utime={0, 144977}, ru_stime={0, 365944}, ...}) = 0lseek(8, 0, SEEK_CUR) = 20844write(8, "=====================", 21) = 21 | 00000 3d 3d 3d 3d 3d 3d 3d 3d 3d 3d 3d 3d 3d 3d 3d 3d ======== ======== | | 00010 3d 3d 3d 3d 3d ===== |write(9, "7?xG~21L\n", 9) = 9 | 00000 37 3f 78 47 7e 32 31 4c 0a 7?xG~21L . |write(8, "\n", 1) = 1 | 00000 0a . |

write(8, "PARSING IN CURSOR #1399219986220"..., 138) = 138 | 00000 50 41 52 53 49 4e 47 20 49 4e 20 43 55 52 53 4f PARSING IN CURSO | | 00010 52 20 23 31 33 39 39 32 31 39 39 38 36 32 32 30 R #13992 19986220 | | 00020 37 32 20 6c 65 6e 3d 32 33 20 64 65 70 3d 30 20 72 len=2 3 dep=0 | | 00030 75 69 64 3d 38 34 20 6f 63 74 3d 33 20 6c 69 64 uid=84 o ct=3 lid | | 00040 3d 38 34 20 74 69 6d 3d 31 33 36 31 30 35 34 31 =84 tim= 13610541 | | 00050 38 39 37 35 38 36 36 32 20 68 76 3d 31 30 32 30 89758662 hv=1020 | | 00060 35 33 34 33 36 34 20 61 64 3d 27 37 65 33 64 62 534364 a d='7e3db | | 00070 33 66 38 27 20 73 71 6c 69 64 3d 27 39 34 64 77 3f8' sql id='94dw | | 00080 66 61 38 79 64 38 37 6b 77 27 fa8yd87k w' |lseek(8, 0, SEEK_CUR) = 21004write(8, "\n", 1) = 1 | 00000 0a . |write(9, "7?vG~B21\n", 9) = 9 | 00000 37 3f 76 47 7e 42 32 31 0a 7?vG~B21 . |write(8, "select count(*) from t2", 23) = 23 | 00000 73 65 6c 65 63 74 20 63 6f 75 6e 74 28 2a 29 20 select c ount(*) | | 00010 66 72 6f 6d 20 74 32 from t2 |write(8, "\n", 1) = 1 | 00000 0a . |write(8, "END OF STMT", 11) = 11 | 00000 45 4e 44 20 4f 46 20 53 54 4d 54 END OF S TMT |write(8, "\n", 1) = 1 | 00000 0a . |write(8, "PARSE #139921998622072:c=0,e=658"..., 103) = 103 | 00000 50 41 52 53 45 20 23 31 33 39 39 32 31 39 39 38 PARSE #1 39921998 | | 00010 36 32 32 30 37 32 3a 63 3d 30 2c 65 3d 36 35 38 622072:c =0,e=658 | | 00020 2c 70 3d 30 2c 63 72 3d 30 2c 63 75 3d 30 2c 6d ,p=0,cr= 0,cu=0,m | | 00030 69 73 3d 30 2c 72 3d 30 2c 64 65 70 3d 30 2c 6f is=0,r=0 ,dep=0,o | | 00040 67 3d 31 2c 70 6c 68 3d 33 33 32 31 38 37 31 30 g=1,plh= 33218710 | | 00050 32 33 2c 74 69 6d 3d 31 33 36 31 30 35 34 31 38 23,tim=1 36105418 | | 00060 39 37 35 38 36 32 33 9758623 |write(8, "\n", 1) = 1 | 00000 0a . |getrusage(RUSAGE_SELF, {ru_utime={0, 144977}, ru_stime={0, 365944}, ...}) = 0getrusage(RUSAGE_SELF, {ru_utime={0, 144977}, ru_stime={0, 365944}, ...}) = 0getrusage(RUSAGE_SELF, {ru_utime={0, 144977}, ru_stime={0, 365944}, ...}) = 0lseek(8, 0, SEEK_CUR) = 21145write(8, "EXEC #139921998622072:c=0,e=225,"..., 102) = 102 | 00000 45 58 45 43 20 23 31 33 39 39 32 31 39 39 38 36 EXEC #13 99219986 |
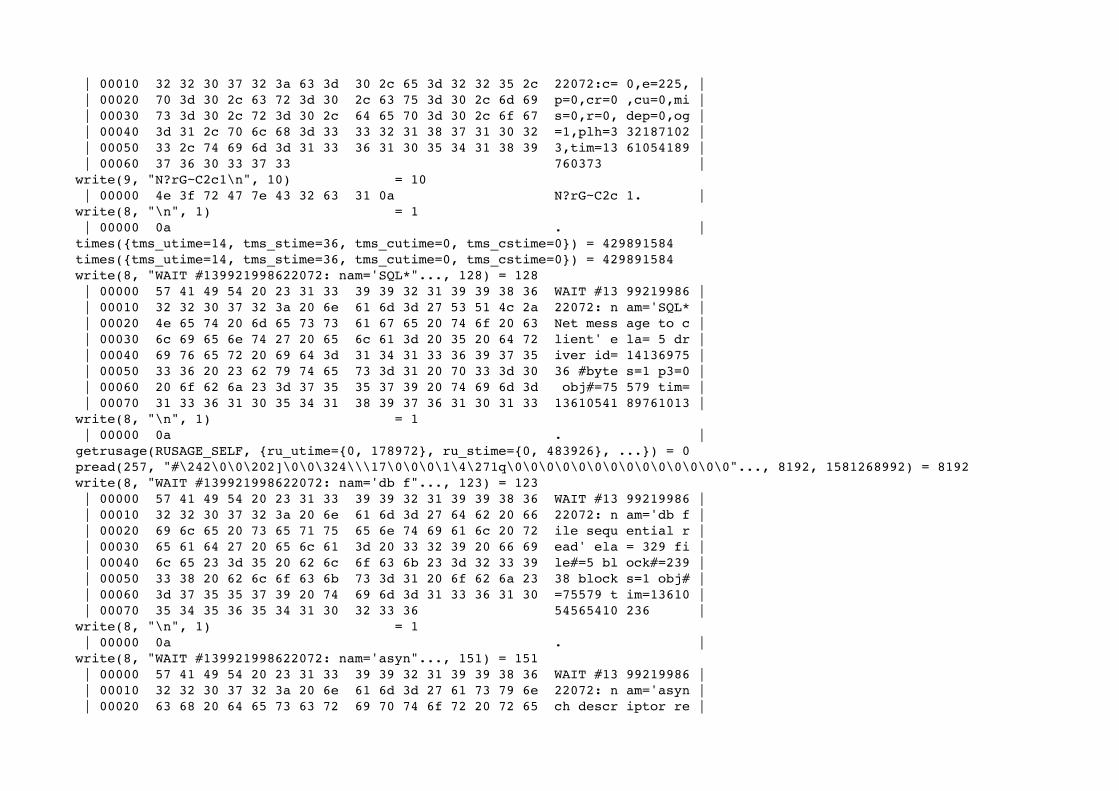
| 00010 32 32 30 37 32 3a 63 3d 30 2c 65 3d 32 32 35 2c 22072:c= 0,e=225, | | 00020 70 3d 30 2c 63 72 3d 30 2c 63 75 3d 30 2c 6d 69 p=0,cr=0 ,cu=0,mi | | 00030 73 3d 30 2c 72 3d 30 2c 64 65 70 3d 30 2c 6f 67 s=0,r=0, dep=0,og | | 00040 3d 31 2c 70 6c 68 3d 33 33 32 31 38 37 31 30 32 =1,plh=3 32187102 | | 00050 33 2c 74 69 6d 3d 31 33 36 31 30 35 34 31 38 39 3,tim=13 61054189 | | 00060 37 36 30 33 37 33 760373 |write(9, "N?rG~C2c1\n", 10) = 10 | 00000 4e 3f 72 47 7e 43 32 63 31 0a N?rG~C2c 1. |write(8, "\n", 1) = 1 | 00000 0a . |times({tms_utime=14, tms_stime=36, tms_cutime=0, tms_cstime=0}) = 429891584times({tms_utime=14, tms_stime=36, tms_cutime=0, tms_cstime=0}) = 429891584write(8, "WAIT #139921998622072: nam='SQL*"..., 128) = 128 | 00000 57 41 49 54 20 23 31 33 39 39 32 31 39 39 38 36 WAIT #13 99219986 | | 00010 32 32 30 37 32 3a 20 6e 61 6d 3d 27 53 51 4c 2a 22072: n am='SQL* | | 00020 4e 65 74 20 6d 65 73 73 61 67 65 20 74 6f 20 63 Net mess age to c | | 00030 6c 69 65 6e 74 27 20 65 6c 61 3d 20 35 20 64 72 lient' e la= 5 dr | | 00040 69 76 65 72 20 69 64 3d 31 34 31 33 36 39 37 35 iver id= 14136975 | | 00050 33 36 20 23 62 79 74 65 73 3d 31 20 70 33 3d 30 36 #byte s=1 p3=0 | | 00060 20 6f 62 6a 23 3d 37 35 35 37 39 20 74 69 6d 3d obj#=75 579 tim= | | 00070 31 33 36 31 30 35 34 31 38 39 37 36 31 30 31 33 13610541 89761013 |write(8, "\n", 1) = 1 | 00000 0a . |getrusage(RUSAGE_SELF, {ru_utime={0, 178972}, ru_stime={0, 483926}, ...}) = 0pread(257, "#\242\0\0\202]\0\0\324\\\17\0\0\0\1\4\271q\0\0\0\0\0\0\0\0\0\0\0\0\0\0"..., 8192, 1581268992) = 8192write(8, "WAIT #139921998622072: nam='db f"..., 123) = 123 | 00000 57 41 49 54 20 23 31 33 39 39 32 31 39 39 38 36 WAIT #13 99219986 | | 00010 32 32 30 37 32 3a 20 6e 61 6d 3d 27 64 62 20 66 22072: n am='db f | | 00020 69 6c 65 20 73 65 71 75 65 6e 74 69 61 6c 20 72 ile sequ ential r | | 00030 65 61 64 27 20 65 6c 61 3d 20 33 32 39 20 66 69 ead' ela = 329 fi | | 00040 6c 65 23 3d 35 20 62 6c 6f 63 6b 23 3d 32 33 39 le#=5 bl ock#=239 | | 00050 33 38 20 62 6c 6f 63 6b 73 3d 31 20 6f 62 6a 23 38 block s=1 obj# | | 00060 3d 37 35 35 37 39 20 74 69 6d 3d 31 33 36 31 30 =75579 t im=13610 | | 00070 35 34 35 36 35 34 31 30 32 33 36 54565410 236 |write(8, "\n", 1) = 1 | 00000 0a . |write(8, "WAIT #139921998622072: nam='asyn"..., 151) = 151 | 00000 57 41 49 54 20 23 31 33 39 39 32 31 39 39 38 36 WAIT #13 99219986 | | 00010 32 32 30 37 32 3a 20 6e 61 6d 3d 27 61 73 79 6e 22072: n am='asyn | | 00020 63 68 20 64 65 73 63 72 69 70 74 6f 72 20 72 65 ch descr iptor re |
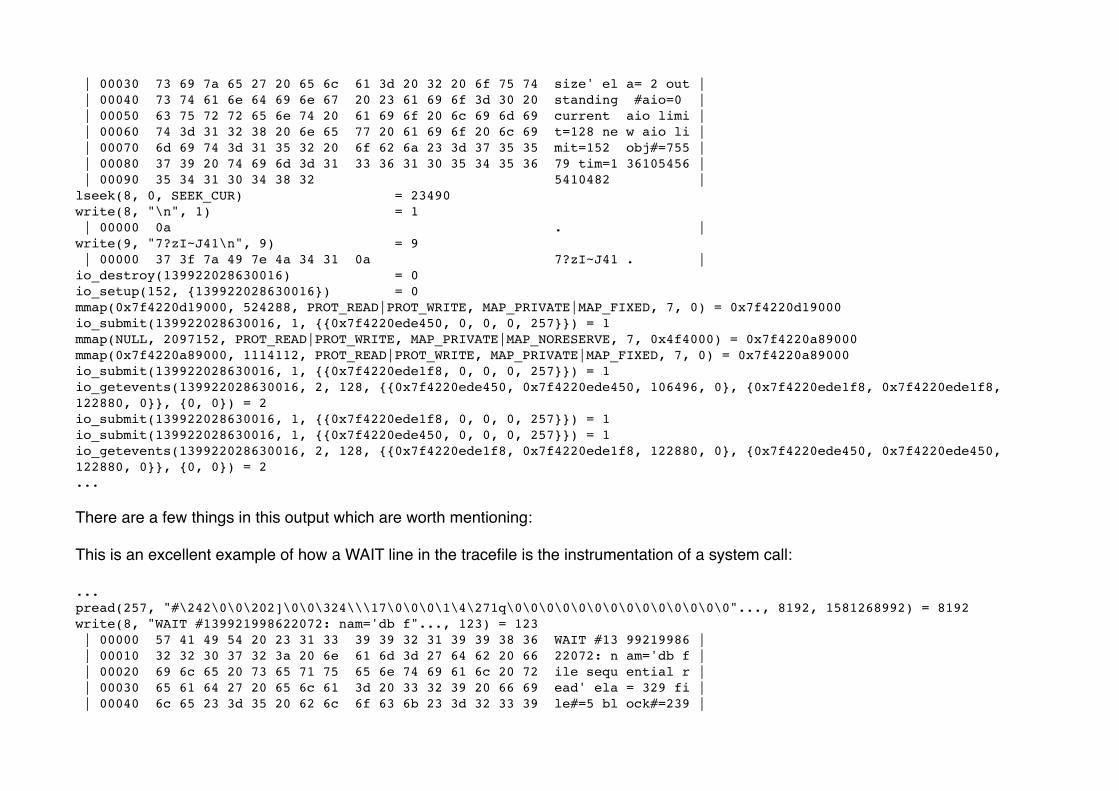
| 00030 73 69 7a 65 27 20 65 6c 61 3d 20 32 20 6f 75 74 size' el a= 2 out | | 00040 73 74 61 6e 64 69 6e 67 20 23 61 69 6f 3d 30 20 standing #aio=0 | | 00050 63 75 72 72 65 6e 74 20 61 69 6f 20 6c 69 6d 69 current aio limi | | 00060 74 3d 31 32 38 20 6e 65 77 20 61 69 6f 20 6c 69 t=128 ne w aio li | | 00070 6d 69 74 3d 31 35 32 20 6f 62 6a 23 3d 37 35 35 mit=152 obj#=755 | | 00080 37 39 20 74 69 6d 3d 31 33 36 31 30 35 34 35 36 79 tim=1 36105456 | | 00090 35 34 31 30 34 38 32 5410482 |lseek(8, 0, SEEK_CUR) = 23490write(8, "\n", 1) = 1 | 00000 0a . |write(9, "7?zI~J41\n", 9) = 9 | 00000 37 3f 7a 49 7e 4a 34 31 0a 7?zI~J41 . |io_destroy(139922028630016) = 0io_setup(152, {139922028630016}) = 0mmap(0x7f4220d19000, 524288, PROT_READ|PROT_WRITE, MAP_PRIVATE|MAP_FIXED, 7, 0) = 0x7f4220d19000io_submit(139922028630016, 1, {{0x7f4220ede450, 0, 0, 0, 257}}) = 1mmap(NULL, 2097152, PROT_READ|PROT_WRITE, MAP_PRIVATE|MAP_NORESERVE, 7, 0x4f4000) = 0x7f4220a89000mmap(0x7f4220a89000, 1114112, PROT_READ|PROT_WRITE, MAP_PRIVATE|MAP_FIXED, 7, 0) = 0x7f4220a89000io_submit(139922028630016, 1, {{0x7f4220ede1f8, 0, 0, 0, 257}}) = 1io_getevents(139922028630016, 2, 128, {{0x7f4220ede450, 0x7f4220ede450, 106496, 0}, {0x7f4220ede1f8, 0x7f4220ede1f8, 122880, 0}}, {0, 0}) = 2io_submit(139922028630016, 1, {{0x7f4220ede1f8, 0, 0, 0, 257}}) = 1io_submit(139922028630016, 1, {{0x7f4220ede450, 0, 0, 0, 257}}) = 1io_getevents(139922028630016, 2, 128, {{0x7f4220ede1f8, 0x7f4220ede1f8, 122880, 0}, {0x7f4220ede450, 0x7f4220ede450, 122880, 0}}, {0, 0}) = 2...
There are a few things in this output which are worth mentioning:
This is an excellent example of how a WAIT line in the tracefile is the instrumentation of a system call:
...pread(257, "#\242\0\0\202]\0\0\324\\\17\0\0\0\1\4\271q\0\0\0\0\0\0\0\0\0\0\0\0\0\0"..., 8192, 1581268992) = 8192write(8, "WAIT #139921998622072: nam='db f"..., 123) = 123 | 00000 57 41 49 54 20 23 31 33 39 39 32 31 39 39 38 36 WAIT #13 99219986 | | 00010 32 32 30 37 32 3a 20 6e 61 6d 3d 27 64 62 20 66 22072: n am='db f | | 00020 69 6c 65 20 73 65 71 75 65 6e 74 69 61 6c 20 72 ile sequ ential r | | 00030 65 61 64 27 20 65 6c 61 3d 20 33 32 39 20 66 69 ead' ela = 329 fi | | 00040 6c 65 23 3d 35 20 62 6c 6f 63 6b 23 3d 32 33 39 le#=5 bl ock#=239 |

| 00050 33 38 20 62 6c 6f 63 6b 73 3d 31 20 6f 62 6a 23 38 block s=1 obj# | | 00060 3d 37 35 35 37 39 20 74 69 6d 3d 31 33 36 31 30 =75579 t im=13610 | | 00070 35 34 35 36 35 34 31 30 32 33 36 54565410 236 |write(8, "\n", 1) = 1 | 00000 0a ...
We see Oracle doing a pread to filedescriptor 257, which is timed by Oracle using the ‘db file sequental read’ wait. A pread system call means Oracle asks the system for a number of bytes (8192 in this case), and waits for the request to complete. Because it waits for the request to complete, it cannot do anything else.
The next example shows a WAIT that is not direct instrumentation of the system call or calls (whilst it seems quite logical that it should be):
...write(8, "WAIT #139921998622072: nam='asyn"..., 151) = 151 | 00000 57 41 49 54 20 23 31 33 39 39 32 31 39 39 38 36 WAIT #13 99219986 | | 00010 32 32 30 37 32 3a 20 6e 61 6d 3d 27 61 73 79 6e 22072: n am='asyn | | 00020 63 68 20 64 65 73 63 72 69 70 74 6f 72 20 72 65 ch descr iptor re | | 00030 73 69 7a 65 27 20 65 6c 61 3d 20 32 20 6f 75 74 size' el a= 2 out | | 00040 73 74 61 6e 64 69 6e 67 20 23 61 69 6f 3d 30 20 standing #aio=0 | | 00050 63 75 72 72 65 6e 74 20 61 69 6f 20 6c 69 6d 69 current aio limi | | 00060 74 3d 31 32 38 20 6e 65 77 20 61 69 6f 20 6c 69 t=128 ne w aio li | | 00070 6d 69 74 3d 31 35 32 20 6f 62 6a 23 3d 37 35 35 mit=152 obj#=755 | | 00080 37 39 20 74 69 6d 3d 31 33 36 31 30 35 34 35 36 79 tim=1 36105456 | | 00090 35 34 31 30 34 38 32 5410482 |lseek(8, 0, SEEK_CUR) = 23490write(8, "\n", 1) = 1 | 00000 0a . |write(9, "7?zI~J41\n", 9) = 9 | 00000 37 3f 7a 49 7e 4a 34 31 0a 7?zI~J41 . |io_destroy(139922028630016) = 0io_setup(152, {139922028630016}) = 0...
First we see the wait ‘asynch descriptor resize’, which could be a pointer to the operating system setup of the ‘io context’, which is the operating system administration of the process’ asynchronous IO’s. But upon closer examination, it can’t be, because the wait is written before the actual setup of the ‘io context’ on the operating system level is done (io_destroy and io_setup).

If you want to read more on how linux works, an excellent place to look is at http://lxr.linux.no (The Linux Cross Reference). This website contains the linux kernel source annotated, which means that you can search for kernel functions, calls and struct’s.
As you are probably aware, the layers which are visible using the techniques described above are database SQL execution and operating system/kernel interaction of the Oracle executable.
But what if you need to dig deeper into what Oracle is doing?
This is possible, but requires you to understand what Oracle actually is. Oracle is a C program which is dynamically linked with several oracle database libraries and operating system libraries. Because of the dynamic linking the executable needs to find (either system or userspace) functions at runtime, which is where the symbol table comes into play. The function of the symbol table is to provide a table of symbolic names for function addresses (among other addresses, like variables)
Having the symbol table means that if you have a mechanism that can keep track of function calls of an executable, it can display the name of the function call, rather than an address.
The symbols, of which the functions in the executable are part of, can be made visible using the ‘nm’ function. To get all the functions in the Oracle executable:
$ nm $ORACLE_HOME/bin/oracle | grep -e\ T\
(to see the variables in the executables, exchange ‘T’ with ‘A’)
To gain more understanding of the functions and naming of the Oracle executable, read the word document inside MOS note: 1321720.1.
We have looked at sql trace and system call tracing, but neither can be used to profile the userspace functions (which were made visible using ‘nm’). A profiling tool that can be used to do userspace function call tracing is dtrace. But at the moment of writing, only dtrace on Solaris can do userspace function call tracing, not dtrace on Linux. The answer of the linux community to dtrace was ‘systemtap’. However, to my understanding, systemtap cannot do userspace function profiling, especially using default provided kernels in RedHat and Oracle Linux.
With Linux kernel 2.6.32 came a new tool: perf

Perf is a utility which enables a multiple profiling methods. This can be done for a single process, or on the entire system. A few of these profiling methods include:
Function call profiling (this uses two sessions, one oracle foreground session, one root session executing perf):
# perf record -g -p 3398 -e cpu-clock
Please mind 3398 is the process ID of the Oracle foreground process, and ‘-e cpu-clock’ is needed to run perf inside a VM, because the CPU registers cannot be read directly.Now run the ‘problem SQL’ :
TS@v11203 > select count(*) from t2;
Once the execution is done, go back to the root session and terminate the perf record session (CTRL-c). This terminates the collection/sampling. Now generate a report of the collected data:
# perf report
# Events: 176 cpu-clock## Overhead Command Shared Object Symbol# ........ ....... ................. ...........................# 64.77% oracle [kernel.kallsyms] [k] _raw_spin_unlock_irqrestore | --- _raw_spin_unlock_irqrestore mptspi_qcmd scsi_dispatch_cmd scsi_request_fn __blk_run_queue queue_unplugged blk_flush_plug_list blk_finish_plug generic_file_read_iter

generic_file_aio_read aio_rw_vect_retry aio_run_iocb io_submit_one do_io_submit sys_io_submit system_call_fastpath io_submit
4.55% oracle oracle [.] sxorchk | --- sxorchk kcbhxoro kcbhvbo kcbzvb kcbldrget kcbgtcr ktrget3 ktrget2 kdst_fetch kdstf00000010000kmP kdsttgr qertbFetch qerstFetch qergsFetch
So, what do we see here?
The top 2 executing functions gathered by perf are _raw_spin_unlock_irqrestore for 64.77%, which was executing in kernel mode ([k]), and sxorchk for 4.55%, which was executing in usermode ([.]).
Another very useful command is perf top, which is the equivalence of the linux top command, but for userspace and kernelspace function calls. Perf top displays information about an active system or process. This is real time information, so it does not record information like perf record does.

Perf is a very good tool to learn about active functions inside processes, and the call stack of these active functions. This helps in identifying functions which are important (meaning expensive or taking a lot of time).
But what if you want the functions organised by time, instead of percentage active? This is where gdb (the gnu debugger) comes into play. First, a word of caution: gdb stops a process from execution once you attach. This means that it is probably a bad idea to attach to critical background processes (for example, lgwr, ckpt, dbw0, etc.), in fact any process on a critical production system.
Gdb is a debugger, not a profiler. By using the available options in gdb it can be made to do so. Next up is shown how to profile the IO calls done using a direct path read full table scan:
Please mind this also requires a two-fold setup: an oracle session for executing SQL, and a root session for executing gdb.
Attach to the Oracle foreground:
# gdb -p 2992GNU gdb (GDB) Red Hat Enterprise Linux (7.2-56.el6)Copyright (C) 2010 Free Software Foundation, Inc.License GPLv3+: GNU GPL version 3 or later <http://gnu.org/licenses/gpl.html>This is free software: you are free to change and redistribute it.There is NO WARRANTY, to the extent permitted by law. Type "show copying"and "show warranty" for details.This GDB was configured as "x86_64-redhat-linux-gnu".For bug reporting instructions, please see:<http://www.gnu.org/software/gdb/bugs/>.Attaching to process 2992Reading symbols from /u01/app/oracle/product/11.2.0.3/dbhome_1/bin/oracle...(no debugging symbols found)...done.Reading symbols from /u01/app/oracle/product/11.2.0.3/dbhome_1/lib/libodm11.so...(no debugging symbols found)...done.Loaded symbols for /u01/app/oracle/product/11.2.0.3/dbhome_1/lib/libodm11.soReading symbols from /u01/app/oracle/product/11.2.0.3/dbhome_1/lib/libcell11.so...done.Loaded symbols for /u01/app/oracle/product/11.2.0.3/dbhome_1/lib/libcell11.soReading symbols from /u01/app/oracle/product/11.2.0.3/dbhome_1/lib/libskgxp11.so...(no debugging symbols found)...done.Loaded symbols for /u01/app/oracle/product/11.2.0.3/dbhome_1/lib/libskgxp11.soReading symbols from /lib64/librt.so.1...Reading symbols from /usr/lib/debug/lib64/librt-2.12.so.debug...done.
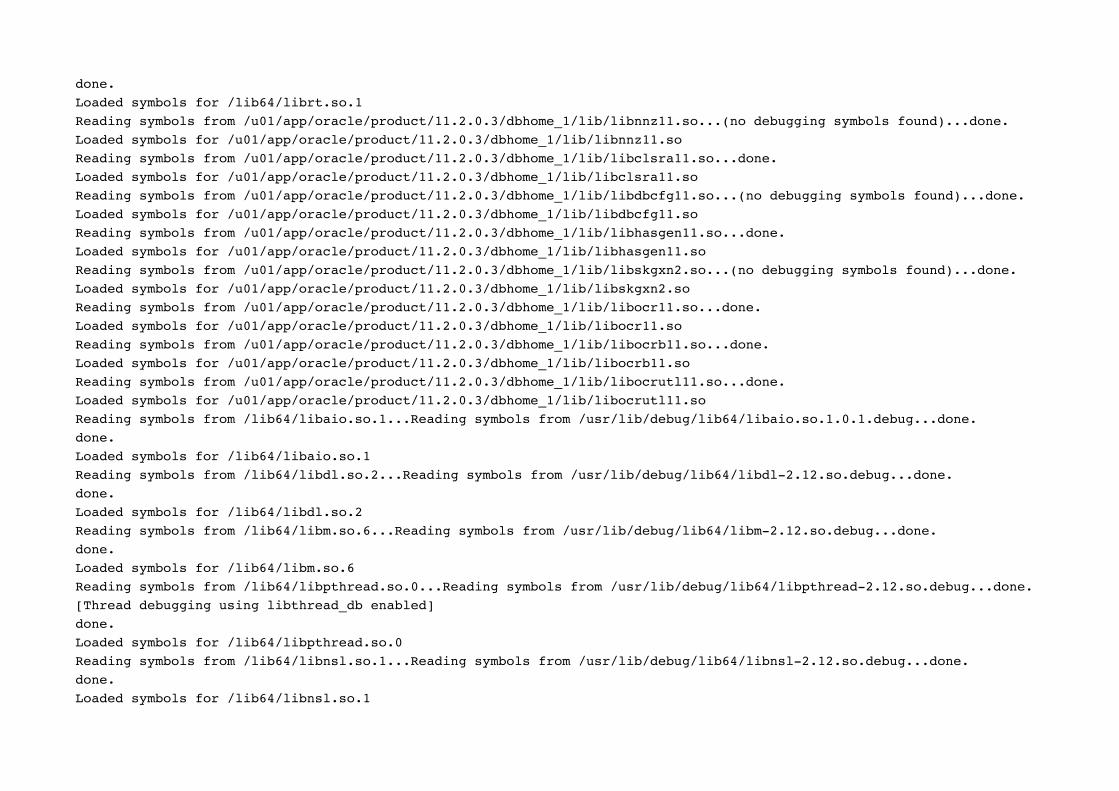
done.Loaded symbols for /lib64/librt.so.1Reading symbols from /u01/app/oracle/product/11.2.0.3/dbhome_1/lib/libnnz11.so...(no debugging symbols found)...done.Loaded symbols for /u01/app/oracle/product/11.2.0.3/dbhome_1/lib/libnnz11.soReading symbols from /u01/app/oracle/product/11.2.0.3/dbhome_1/lib/libclsra11.so...done.Loaded symbols for /u01/app/oracle/product/11.2.0.3/dbhome_1/lib/libclsra11.soReading symbols from /u01/app/oracle/product/11.2.0.3/dbhome_1/lib/libdbcfg11.so...(no debugging symbols found)...done.Loaded symbols for /u01/app/oracle/product/11.2.0.3/dbhome_1/lib/libdbcfg11.soReading symbols from /u01/app/oracle/product/11.2.0.3/dbhome_1/lib/libhasgen11.so...done.Loaded symbols for /u01/app/oracle/product/11.2.0.3/dbhome_1/lib/libhasgen11.soReading symbols from /u01/app/oracle/product/11.2.0.3/dbhome_1/lib/libskgxn2.so...(no debugging symbols found)...done.Loaded symbols for /u01/app/oracle/product/11.2.0.3/dbhome_1/lib/libskgxn2.soReading symbols from /u01/app/oracle/product/11.2.0.3/dbhome_1/lib/libocr11.so...done.Loaded symbols for /u01/app/oracle/product/11.2.0.3/dbhome_1/lib/libocr11.soReading symbols from /u01/app/oracle/product/11.2.0.3/dbhome_1/lib/libocrb11.so...done.Loaded symbols for /u01/app/oracle/product/11.2.0.3/dbhome_1/lib/libocrb11.soReading symbols from /u01/app/oracle/product/11.2.0.3/dbhome_1/lib/libocrutl11.so...done.Loaded symbols for /u01/app/oracle/product/11.2.0.3/dbhome_1/lib/libocrutl11.soReading symbols from /lib64/libaio.so.1...Reading symbols from /usr/lib/debug/lib64/libaio.so.1.0.1.debug...done.done.Loaded symbols for /lib64/libaio.so.1Reading symbols from /lib64/libdl.so.2...Reading symbols from /usr/lib/debug/lib64/libdl-2.12.so.debug...done.done.Loaded symbols for /lib64/libdl.so.2Reading symbols from /lib64/libm.so.6...Reading symbols from /usr/lib/debug/lib64/libm-2.12.so.debug...done.done.Loaded symbols for /lib64/libm.so.6Reading symbols from /lib64/libpthread.so.0...Reading symbols from /usr/lib/debug/lib64/libpthread-2.12.so.debug...done.[Thread debugging using libthread_db enabled]done.Loaded symbols for /lib64/libpthread.so.0Reading symbols from /lib64/libnsl.so.1...Reading symbols from /usr/lib/debug/lib64/libnsl-2.12.so.debug...done.done.Loaded symbols for /lib64/libnsl.so.1
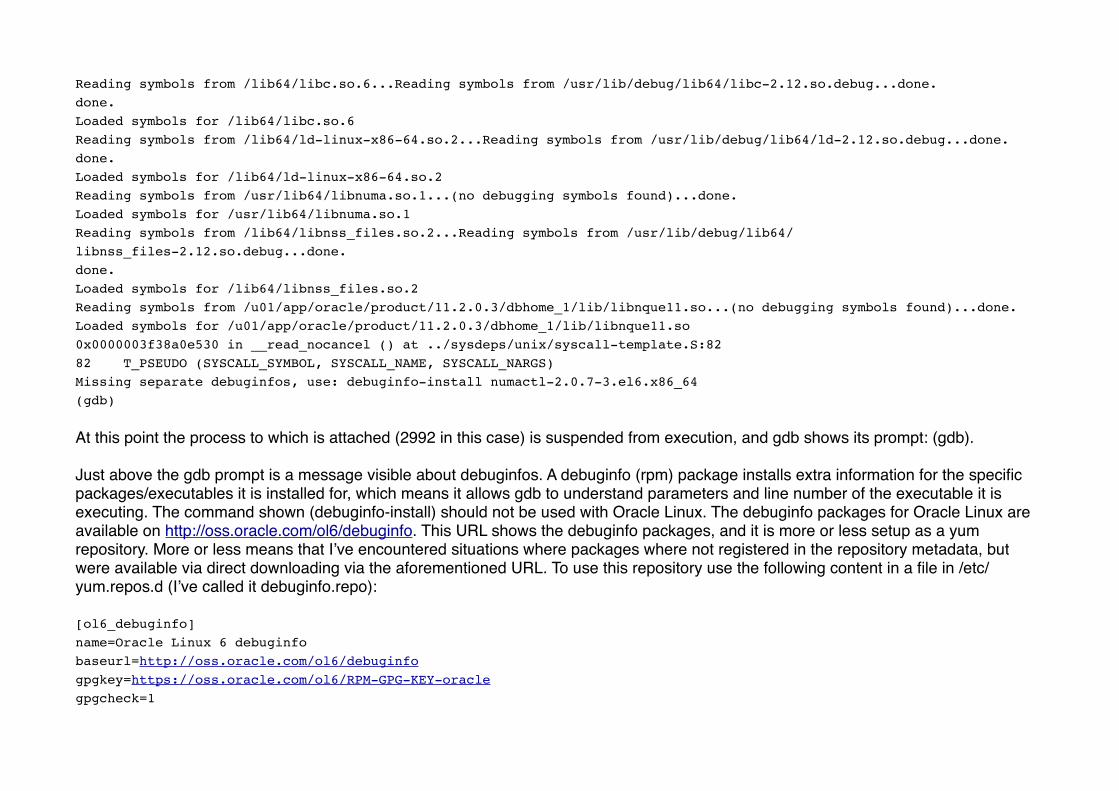
Reading symbols from /lib64/libc.so.6...Reading symbols from /usr/lib/debug/lib64/libc-2.12.so.debug...done.done.Loaded symbols for /lib64/libc.so.6Reading symbols from /lib64/ld-linux-x86-64.so.2...Reading symbols from /usr/lib/debug/lib64/ld-2.12.so.debug...done.done.Loaded symbols for /lib64/ld-linux-x86-64.so.2Reading symbols from /usr/lib64/libnuma.so.1...(no debugging symbols found)...done.Loaded symbols for /usr/lib64/libnuma.so.1Reading symbols from /lib64/libnss_files.so.2...Reading symbols from /usr/lib/debug/lib64/libnss_files-2.12.so.debug...done.done.Loaded symbols for /lib64/libnss_files.so.2Reading symbols from /u01/app/oracle/product/11.2.0.3/dbhome_1/lib/libnque11.so...(no debugging symbols found)...done.Loaded symbols for /u01/app/oracle/product/11.2.0.3/dbhome_1/lib/libnque11.so0x0000003f38a0e530 in __read_nocancel () at ../sysdeps/unix/syscall-template.S:8282! T_PSEUDO (SYSCALL_SYMBOL, SYSCALL_NAME, SYSCALL_NARGS)Missing separate debuginfos, use: debuginfo-install numactl-2.0.7-3.el6.x86_64(gdb)
At this point the process to which is attached (2992 in this case) is suspended from execution, and gdb shows its prompt: (gdb).
Just above the gdb prompt is a message visible about debuginfos. A debuginfo (rpm) package installs extra information for the specific packages/executables it is installed for, which means it allows gdb to understand parameters and line number of the executable it is executing. The command shown (debuginfo-install) should not be used with Oracle Linux. The debuginfo packages for Oracle Linux are available on http://oss.oracle.com/ol6/debuginfo. This URL shows the debuginfo packages, and it is more or less setup as a yum repository. More or less means that I’ve encountered situations where packages where not registered in the repository metadata, but were available via direct downloading via the aforementioned URL. To use this repository use the following content in a file in /etc/yum.repos.d (I’ve called it debuginfo.repo):
[ol6_debuginfo]name=Oracle Linux 6 debuginfobaseurl=http://oss.oracle.com/ol6/debuginfogpgkey=https://oss.oracle.com/ol6/RPM-GPG-KEY-oraclegpgcheck=1
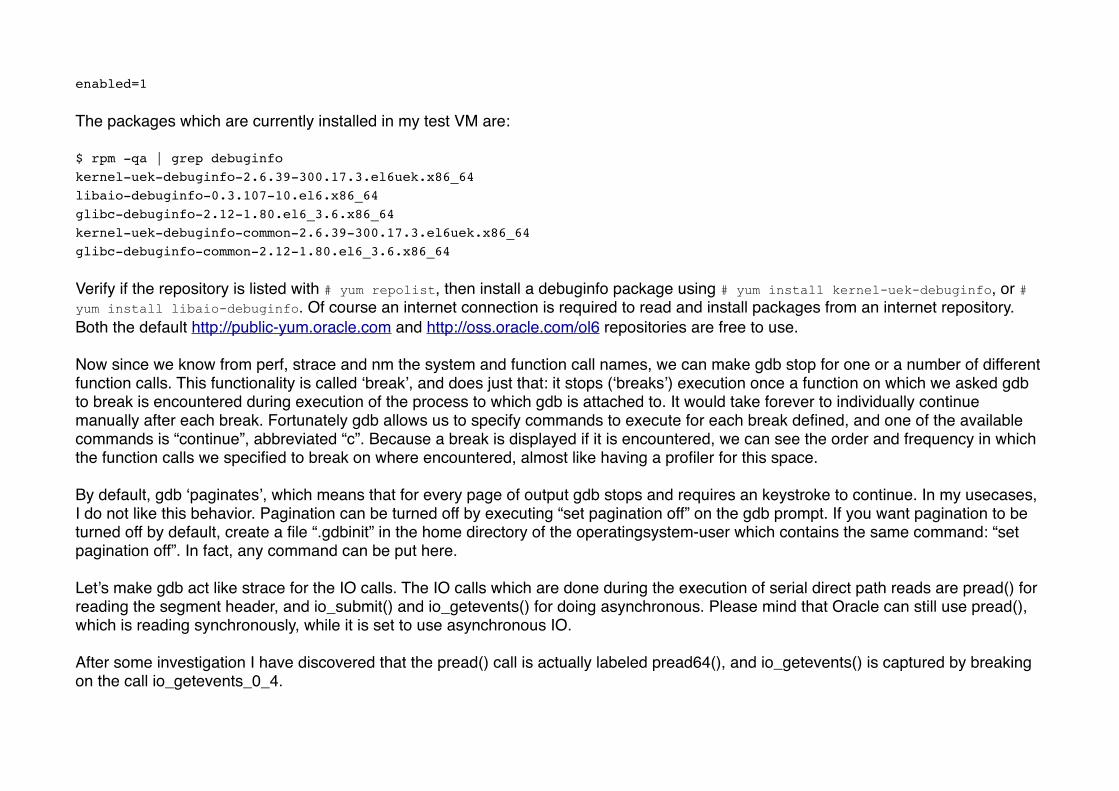
enabled=1
The packages which are currently installed in my test VM are:
$ rpm -qa | grep debuginfokernel-uek-debuginfo-2.6.39-300.17.3.el6uek.x86_64libaio-debuginfo-0.3.107-10.el6.x86_64glibc-debuginfo-2.12-1.80.el6_3.6.x86_64kernel-uek-debuginfo-common-2.6.39-300.17.3.el6uek.x86_64glibc-debuginfo-common-2.12-1.80.el6_3.6.x86_64
Verify if the repository is listed with # yum repolist, then install a debuginfo package using # yum install kernel-uek-debuginfo, or # yum install libaio-debuginfo. Of course an internet connection is required to read and install packages from an internet repository. Both the default http://public-yum.oracle.com and http://oss.oracle.com/ol6 repositories are free to use.
Now since we know from perf, strace and nm the system and function call names, we can make gdb stop for one or a number of different function calls. This functionality is called ‘break’, and does just that: it stops (‘breaks’) execution once a function on which we asked gdb to break is encountered during execution of the process to which gdb is attached to. It would take forever to individually continue manually after each break. Fortunately gdb allows us to specify commands to execute for each break defined, and one of the available commands is “continue”, abbreviated “c”. Because a break is displayed if it is encountered, we can see the order and frequency in which the function calls we specified to break on where encountered, almost like having a profiler for this space.
By default, gdb ‘paginates’, which means that for every page of output gdb stops and requires an keystroke to continue. In my usecases, I do not like this behavior. Pagination can be turned off by executing “set pagination off” on the gdb prompt. If you want pagination to be turned off by default, create a file “.gdbinit” in the home directory of the operatingsystem-user which contains the same command: “set pagination off”. In fact, any command can be put here.
Let’s make gdb act like strace for the IO calls. The IO calls which are done during the execution of serial direct path reads are pread() for reading the segment header, and io_submit() and io_getevents() for doing asynchronous. Please mind that Oracle can still use pread(), which is reading synchronously, while it is set to use asynchronous IO.
After some investigation I have discovered that the pread() call is actually labeled pread64(), and io_getevents() is captured by breaking on the call io_getevents_0_4.

This is how it’s done (this is in gdb, attached to an Oracle foreground session, with my .gdbinit in place):
(gdb) break pread64Breakpoint 1 at 0x3f38a0ee20: file ../sysdeps/unix/syscall-template.S, line 82. (2 locations)(gdb) commandsType commands for breakpoint(s) 1, one per line.End with a line saying just "end".>c>end(gdb) break io_submitBreakpoint 2 at 0x3f38200660: file io_submit.c, line 23.(gdb) commandsType commands for breakpoint(s) 2, one per line.End with a line saying just "end".>c>end(gdb) break io_getevents_0_4Breakpoint 3 at 0x3f38200620: file io_getevents.c, line 46.(gdb) commandsType commands for breakpoint(s) 3, one per line.End with a line saying just "end".>c>end(gdb)
The executable to which the gdb session is attached is still suspended, in order to let the executable progress execution issue ‘c’ or ‘continue’.
If the buffer cache is empty, the following gdb output is shown when a serial direct path read is executed:
(gdb) cContinuing.

Breakpoint 1, pread64 () at ../sysdeps/unix/syscall-template.S:8282! T_PSEUDO (SYSCALL_SYMBOL, SYSCALL_NAME, SYSCALL_NARGS)
Breakpoint 2, io_submit (ctx=0x7fec47ed4000, nr=1, iocbs=0x7fffea604f10) at io_submit.c:2323! io_syscall3(int, io_submit, io_submit, io_context_t, ctx, long, nr, struct iocb **, iocbs)
Breakpoint 2, io_submit (ctx=0x7fec47ed4000, nr=1, iocbs=0x7fffea604f10) at io_submit.c:2323! io_syscall3(int, io_submit, io_submit, io_context_t, ctx, long, nr, struct iocb **, iocbs)
Breakpoint 3, io_getevents_0_4 (ctx=0x7fec47ed4000, min_nr=2, nr=128, events=0x7fffea60d578, timeout=0x7fffea60e580) at io_getevents.c:4646! ! if (ring==NULL || ring->magic != AIO_RING_MAGIC)
Breakpoint 2, io_submit (ctx=0x7fec47ed4000, nr=1, iocbs=0x7fffea604f50) at io_submit.c:2323! io_syscall3(int, io_submit, io_submit, io_context_t, ctx, long, nr, struct iocb **, iocbs)
Breakpoint 2, io_submit (ctx=0x7fec47ed4000, nr=1, iocbs=0x7fffea604f50) at io_submit.c:2323! io_syscall3(int, io_submit, io_submit, io_context_t, ctx, long, nr, struct iocb **, iocbs)
Breakpoint 3, io_getevents_0_4 (ctx=0x7fec47ed4000, min_nr=2, nr=128, events=0x7fffea60d578, timeout=0x7fffea60e580) at io_getevents.c:4646! ! if (ring==NULL || ring->magic != AIO_RING_MAGIC)
What we see is first ‘c’ for continuing the executable, after which two IO requests are submitted individually with two io_submit calls (nr=1), which are then are both reaped with an io_getevents call which reaps both (min_nr=2).
This is still not very exciting, this is the same can be seen with strace.
Let’s save the breakpoints and commands in the gdb session (please mind to interrupt the debugging session with CTRL-c to get back to the gdb prompt):
(gdb) save breakpoints io1Saved to file ‘io1’

The file io1 is saved in the current working directory, and simply contains the commands to reproduce the breakpoints and accompanying commands. The file ‘io1’ can be loaded and executed in another gdb session by using the ‘source’ command.
In order to gain more understanding, and show where gdb performs functionality which can not be performed with strace, let’s add the functions for wait registration: kslwtbctx (Oracle 11.2, with Oracle 10.2 this function was named kslwtb_tm), which is the function to start timing a wait event, and kslwtectx (Oracle 10.2: kslwte_tm) to end the timing of the wait interface. Please mind I use ‘rbreak’ here, which means ‘break by regular expression’, so I can enter a single break statement to break on a group of functions.
(gdb) rbreak ^kslwt[be]ctxBreakpoint 4 at 0x8f9a652<function, no debug info> kslwtbctx;Breakpoint 5 at 0x8fa1334<function, no debug info> kslwtectx;(gdb) commandsType commands for breakpoint(s) 4-5, one per line.End with a line saying just "end".>c>end(gb) save breakpoints io2Saved to file ‘io2’
If I run the same SQL again, the beginning and ending of the waits can clearly be seen, but they do not add much information regarding the asynchronous IO calls. We can see pread64() be timed:
Breakpoint 4, 0x0000000008f9a652 in kslwtbctx ()
Breakpoint 1, pread64 () at ../sysdeps/unix/syscall-template.S:8282! T_PSEUDO (SYSCALL_SYMBOL, SYSCALL_NAME, SYSCALL_NARGS)
Breakpoint 5, 0x0000000008fa1334 in kslwtectx ()
But the timing is missing for the asynchronous IO calls:

Breakpoint 2, io_submit (ctx=0x7fec47ed4000, nr=1, iocbs=0x7fffea604f10) at io_submit.c:2323! io_syscall3(int, io_submit, io_submit, io_context_t, ctx, long, nr, struct iocb **, iocbs)
Breakpoint 2, io_submit (ctx=0x7fec47ed4000, nr=1, iocbs=0x7fffea604f10) at io_submit.c:2323! io_syscall3(int, io_submit, io_submit, io_context_t, ctx, long, nr, struct iocb **, iocbs)
Breakpoint 3, io_getevents_0_4 (ctx=0x7fec47ed4000, min_nr=2, nr=128, events=0x7fffea60d578, timeout=0x7fffea60e580) at io_getevents.c:4646! ! if (ring==NULL || ring->magic != AIO_RING_MAGIC)
Breakpoint 2, io_submit (ctx=0x7fec47ed4000, nr=1, iocbs=0x7fffea604f50) at io_submit.c:2323! io_syscall3(int, io_submit, io_submit, io_context_t, ctx, long, nr, struct iocb **, iocbs)
Breakpoint 2, io_submit (ctx=0x7fec47ed4000, nr=1, iocbs=0x7fffea604f50) at io_submit.c:2323! io_syscall3(int, io_submit, io_submit, io_context_t, ctx, long, nr, struct iocb **, iocbs)
Breakpoint 3, io_getevents_0_4 (ctx=0x7fec47ed4000, min_nr=2, nr=128, events=0x7fffea60d578, timeout=0x7fffea60e580) at io_getevents.c:4646! ! if (ring==NULL || ring->magic != AIO_RING_MAGIC)
Please mind I am running these tests in a VM, and the blockdevices used by ASM are probably in the cache of the underlying operating system. So my IO has a very low latency!
Because the current output does not provide any pointers to how asynchronous io is done, clearly we need to do something more to understand how it works. Luckily, with Oracle and RedHat Linux 6 comes ‘cgroups’: control groups. Cgroups is functionality to control resource usage. This also allows control over blockdevices. One of the things which can be controlled, is IOPS! Let’s throttle IOPS for the Oracle database foreground session to 1 IOPS (please remember we are NOT doing this to a production system):
# [ ! -d /cgroup/blkio ] && mkdir -p /cgroup/blkio# mount -t cgroup -o blkio none /cgroup/blkio# cgcreate -g blkio:/iothrottle# printf "8:16 1\n8:32 1\n" > /cgroup/blkio/iothrottle/blkio.throttle.read_iops_device

I use ‘/cgroup’ as the central point for the cgroups controllers. In fact, this can be any directory. For throttling IO, we use the ‘blkio’ controller. Next, we mount the blkio cgroup metafilesystem, and create a cgroup ‘iothrottle’ in it. Finally, the major and minor number and IOPS (format: major minor IOPS) of the two blockdevices which are used by ASM are echoed in the meta-file ‘/cgroup/blkio/iothrottle/blkio.throttle.read_iops_device’.
In order to fetch the major and minor number of the blockdevices ASM is using, log in to the ASM instance, and list the asm_diskstring parameter which is used to point your ASM instance to where it can find the blockdevices. I’ve setup the blockdevices using udev to a custom location to avoid confusion with other blockdevices, my asm_diskstring parameter is: /dev/oracleasm/*. Once you know the location, specify a full list of the directory/location to get the major and minor numbers of the blockdevices:
$ ls -l /dev/oracleasm/*brw-rw----. 1 oracle dba 8, 16 Feb 28 15:32 /dev/oracleasm/disk1brw-rw----. 1 oracle dba 8, 32 Feb 28 15:31 /dev/oracleasm/disk2
At this point, the cgroups blkio controller has a cgroup called ‘iothrottle’ and is active at this moment. It will not do anything yet, we need to add a process ID to the cgroup. In order to do that, we use the same process id as we use for gdb, the process id of the oracle foreground process:
# echo 11683 > /cgroup/blkio/iothrottle/tasks
Now setup gdb again to attach to the oracle foreground process, and do the ‘select count(*) from t2’ again. Let’s see what the result of the throttling is:
The pread64 call (segment header) is not changed. It is a single IO call, there’s not much that changes about it when IO is (severely) throttled)
But the asynchronous IO now reveals a completely different pattern:
Breakpoint 2, io_submit (ctx=0x7fec47ed4000, nr=1, iocbs=0x7fffea604f10) at io_submit.c:2323! io_syscall3(int, io_submit, io_submit, io_context_t, ctx, long, nr, struct iocb **, iocbs)
Breakpoint 2, io_submit (ctx=0x7fec47ed4000, nr=1, iocbs=0x7fffea604f10) at io_submit.c:2323! io_syscall3(int, io_submit, io_submit, io_context_t, ctx, long, nr, struct iocb **, iocbs)

Breakpoint 3, io_getevents_0_4 (ctx=0x7fec47ed4000, min_nr=2, nr=128, events=0x7fffea60d578, timeout=0x7fffea60e580) at io_getevents.c:4646! ! if (ring==NULL || ring->magic != AIO_RING_MAGIC)
Breakpoint 3, io_getevents_0_4 (ctx=0x7fec47ed4000, min_nr=2, nr=128, events=0x7fffea610658, timeout=0x7fffea611660) at io_getevents.c:4646! ! if (ring==NULL || ring->magic != AIO_RING_MAGIC)
Breakpoint 3, io_getevents_0_4 (ctx=0x7fec47ed4000, min_nr=2, nr=128, events=0x7fffea60d378, timeout=0x7fffea60e380) at io_getevents.c:4646! ! if (ring==NULL || ring->magic != AIO_RING_MAGIC)
Breakpoint 3, io_getevents_0_4 (ctx=0x7fec47ed4000, min_nr=2, nr=128, events=0x7fffea610458, timeout=0x7fffea611460) at io_getevents.c:4646! ! if (ring==NULL || ring->magic != AIO_RING_MAGIC)
Breakpoint 4, 0x0000000008f9a652 in kslwtbctx ()
Breakpoint 3, io_getevents_0_4 (ctx=0x7fec47ed4000, min_nr=1, nr=128, events=0x7fffea60d368, timeout=0x7fffea60e370) at io_getevents.c:4646! ! if (ring==NULL || ring->magic != AIO_RING_MAGIC)
Breakpoint 5, 0x0000000008fa1334 in kslwtectx ()
It’s the well known two io_submit() calls at start to get two IO’s in flight, then a number of io_getevents() calls (4 with Oracle 11.2.0.3), then a kslwtbctx() which marks entering a wait, then another io_getevents() call (at which the output on the screen shows waiting, which is for an IO to become available), then kslwtectx() to mark the end of waiting.
Please mind min_nr, which is 2, and only 1 for the io_getevents() call in between the begin and end wait calls.
Why are the first 4 io_getevents() calls not inside the wait, and the fifth is?
Let’s think about what we’ve seen up to now: the Oracle foreground executes a number of calls to reap IO’s without wait-event timing (kslwtbctx(), kslwtectx()), which explains why serial direct path reads can have “missing” IO’s in a tracefile!

Since Oracle has put multiple IO’s in flight simultaneously, many of them are completed under the cover of another that has taken longer, and so we have indeed not waited for them, leading to the difference between the number of blocks read and the number of blocks read that appear in the trace file.
To understand more, we need to look at the parameter ‘timeout’. Because the debuginfo package for libaio is installed, gdb understands these parameters. Please mind ‘timeout’ is a ‘struct’, which consist of two longs, tv_sec (for setting the number of seconds) and tv_nsec (for setting the number of nanoseconds).
Let’s modify the break on io_getevents_0_4 to display the contents of the timeout struct:
(gdb) info breakNum Type Disp Enb Address What1 breakpoint keep y <MULTIPLE> ! breakpoint already hit 1 time c1.1 y 0x0000003f38a0ee20 ../sysdeps/unix/syscall-template.S:821.2 y 0x0000003f386d97b0 ../sysdeps/unix/syscall-template.S:822 breakpoint keep y 0x0000003f38200660 in io_submit at io_submit.c:23! breakpoint already hit 173 times c3 breakpoint keep y 0x0000003f38200620 in io_getevents_0_4 at io_getevents.c:46! breakpoint already hit 558 times c4 breakpoint keep y 0x0000000008f9a652 <kslwtbctx+4>! breakpoint already hit 101 times c5 breakpoint keep y 0x0000000008fa1334 <kslwtectx+4>! breakpoint already hit 101 times c(gdb) commands 3Type commands for breakpoint(s) 3, one per line.End with a line saying just "end".>print *timeout

>c>end
And redo the ‘select count(*) from t2’ again:
Breakpoint 2, io_submit (ctx=0x7fec47ed4000, nr=1, iocbs=0x7fffea604f10) at io_submit.c:2323! io_syscall3(int, io_submit, io_submit, io_context_t, ctx, long, nr, struct iocb **, iocbs)
Breakpoint 2, io_submit (ctx=0x7fec47ed4000, nr=1, iocbs=0x7fffea604f10) at io_submit.c:2323! io_syscall3(int, io_submit, io_submit, io_context_t, ctx, long, nr, struct iocb **, iocbs)
Breakpoint 3, io_getevents_0_4 (ctx=0x7fec47ed4000, min_nr=2, nr=128, events=0x7fffea60d578, timeout=0x7fffea60e580) at io_getevents.c:4646! ! if (ring==NULL || ring->magic != AIO_RING_MAGIC)$1 = {tv_sec = 0, tv_nsec = 0}
Breakpoint 3, io_getevents_0_4 (ctx=0x7fec47ed4000, min_nr=2, nr=128, events=0x7fffea610658, timeout=0x7fffea611660) at io_getevents.c:4646! ! if (ring==NULL || ring->magic != AIO_RING_MAGIC)$2 = {tv_sec = 0, tv_nsec = 0}
Breakpoint 3, io_getevents_0_4 (ctx=0x7fec47ed4000, min_nr=2, nr=128, events=0x7fffea60d378, timeout=0x7fffea60e380) at io_getevents.c:4646! ! if (ring==NULL || ring->magic != AIO_RING_MAGIC)$3 = {tv_sec = 0, tv_nsec = 0}
Breakpoint 3, io_getevents_0_4 (ctx=0x7fec47ed4000, min_nr=2, nr=128, events=0x7fffea610458, timeout=0x7fffea611460) at io_getevents.c:4646! ! if (ring==NULL || ring->magic != AIO_RING_MAGIC)$4 = {tv_sec = 0, tv_nsec = 0}
Breakpoint 4, 0x0000000008f9a652 in kslwtbctx ()

Breakpoint 3, io_getevents_0_4 (ctx=0x7fec47ed4000, min_nr=1, nr=128, events=0x7fffea60d368, timeout=0x7fffea60e370) at io_getevents.c:4646! ! if (ring==NULL || ring->magic != AIO_RING_MAGIC)$5 = {tv_sec = 600, tv_nsec = 0}
Breakpoint 5, 0x0000000008fa1334 in kslwtectx ()
Now everything falls in place! The timeout struct is set to ‘0’, which means io_getevents() is “non blocking”, for the non wait-event timed io_getevents() calls, and probably if these calls are not successful (gdb doesn’t tell if the call was successful or not), the Oracle foreground registers a wait, and then issues io_getevents() with timeout set to 600 (seconds), which makes the io_getevents() call blocking, waiting for a single IO result.