professional services industry -...
TRANSCRIPT

2012 PSVillage
Professional Services Industry Benchmark Report
©2012 PSVillage, Inc. Page 2
Table of Contents
Letter from Report Sponsor Unanet Technologies …………………………………………………………. 6
Executive Summary ………………………………………………………………………………………………………… 7 Introduction ………………………………………………………………………………………………………………….… 10 What Makes the PSVillage Survey Unique ………………………………………..……….……………… 10 Benchmark Objectives ………………………………..…………………………………….……………………… 11 How Survey Was Conducted ……………………………………………………………………………..……… 11 PSVillage Member Key Findings ………………………………………………………………………………………. 12
Analyzing the Benchmark Results ……………………………………………………………………………………. 14 How to use the Results ……………………………………………………………………………………………… 14 Get a Visual Dashboard Tailored for Your PS Business ……………………………….…...…………. 14
Benchmark Demographics ……………………………………………………………………………………………… 18 Company ……………………………………………………………………….……………………….………………… 18 Professional Services Business ……………………………………………………….……….………………… 20 Use of Indirect Resources ……………………………………………………………………….………………… 21
PS Human Capital ………………………………………………………………………….……………………………… 22 Professional Services Roles Surveyed ………………………………………………………………………. 22 Observations Regarding Roles …………………………………………………………………………………. 25 Observations Regarding Salaries ……………………………………………………………………………… 26
PS Financials ……………………………………………………………………………………….……………….….….…. 28 Utilization ………………………………………………………………………………………………………….……… 28 Expense Targets ……………………………………………………………………………………………………….. 31 Profitability Margins ………………………………………………………………………………………….….….. 34 Projected Growth …………………………………………………………………………………………………….. 35
PS Operations ……………………………………………………………………………………….………………….…… 36 Project Management Office …………………………………………………………………………………….. 36 Automated System for PS Operations ………………………………………………………………………. 36 Knowledgebase Adoption ………………………………………………………………………………………… 37 Pricing Strategies ……………………………………………………………………………………………………… 37
Next Steps ……………………………………………………………………………….…………………….……………… 38 To Gain Access to the Survey Results ………………………………………………………………………. 38 To Complete the Benchmark Survey …………………………………….…………………………………. 38 About PSVillage ……………………………..…………………………………………..…………………………… 38 About Report Sponsor …………………………………………..………………………………………………... 39

2012 PSVillage
Professional Services Industry Benchmark Report
©2012 PSVillage, Inc. Page 3
Appendix A: Benchmark Data Points ……………………………………………………………………………… 41 Figures & Tables Figure 1: Financials and Operations Dashboard ………………………………………………….………… 15
Figure 2: Human Capital – Management Dashboard ………………………………………….………… 15
Figure 3: Human Capital – PS Operations Dashboard …………………………………………………… 16
Figure 4: Human Capital – Sales Support Dashboard …………………………………………………….. 16
Figure 5: Human Capital -‐ Delivery Resources Dashboard …………………………………………….. 17
Figure 6: Demographics -‐ Total Company Revenue ………………………………………………………. 18
Figure 7: Demographics -‐ Total Company Employees …………………………………………………… 19
Figure 8: Demographics -‐ Delivery Model ……………………………………………………………………. 19
Figure 9: Demographics -‐ Professional Services Revenue …………………………………………….. 20
Figure 10: Demographics – Professional Services Employees ……………………………………….. 20
Figure 11: Percentage of Indirect Resources …………………………………………………………………. 21
Table 1: Professional Services Roles Surveyed ………………………………………………………………… 22
Figure 12: Number of Resources in the Role …………………………………………………………………. 23
Figure 13: Target Billable Utilization ……………………………………………………………………………… 23
Figure 14: Average Base Salary ……………………………………………………………………………………… 24
Figure 15: Target Bonus as Percentage of Base Salary …………………………………………………… 24
Figure 16: Billable Rate/Hour ………………………………………………………………………………………… 24
Figure 17: Years of PS Experience in Role ……………………………………………………….……………. 25
Figure 18: Percent of Time Spent Traveling ……………………………………………………….…………. 25
Figure 19: Percentage of Companies with Dedicated Services Sales Reps …………………….. 26
Figure 20: Average Target PS Billable Percentage ………………………………………………………….. 28
Figure 21: Blended Target Utilization …………………………………………………………………………….. 29
Figure 22: Percentage of PSOs with Target Billable Utilization Below 75% for Delivery … 30

2012 PSVillage
Professional Services Industry Benchmark Report
©2012 PSVillage, Inc. Page 4
Figure 23: Utilization Rates: For Pure Services Org with Company Revenue < $100M ….. 30 Figure 24: Utilization Rates: For PSOs in Product Centric Companies…………………………… 30
Figure 25: Percentage of PS Revenue Allocated to SG&A …………………………………………….. 31
Figure 26: Sales Expense Target …………………………………………………………………………………….. 32 Figure 27: Average Cost of Services Sold ……………………………….……………………………………… 33
Figure 28: Gross Margin Target Percentage ………………………………………………………………….. 34
Figure 29: Operating Income Margin …………………………………………………………………………….. 35
Figure 30: Using Automated Systems to Manage PS Operations ……………………………………. 36
Figure 31: Companies Using Knowledgebase ………………………………………………………………….. 37


2012 PSVillage
Professional Services Industry Benchmark Report
©2012 PSVillage, Inc. Page 6
Unanet Technologies is excited to sponsor the PSVillage 2012 Professional Services Benchmark Report. We are pleased to share this invaluable research to enable you to compare your organization’s performance against your peers and identify areas for improvement in your operations, project delivery, human capital, and financial management. The benchmark report, which surveyed over 150 service executives in the technology sector, provides detailed insight into key performance indicators (KPIs) and metrics for services organizations. Nineteen roles across the professional services organization (in management, delivery, sales, and operations) were surveyed to compile insights that help leaders more effectively run a professional services organization. Unanet has helped more than 900 project-‐based services organizations automate processes across the bid-‐to-‐bill lifecycle, supporting budgeting, forecasting, planning and tracking. In addition to lowering administration costs and improving efficiency, Unanet provides real-‐time insight into the key metrics that drive performance. This is essential, both to optimize short-‐term success, and for longer-‐term process maturity and improvement. Now, by benchmarking against peers using the data in the PSVillage report, and comparing performance in key areas, you can identify new improvement strategies for opportunities and priorities, taking into account different sizes of organizations, and many other factors. We believe that this 2012 PSVillage Professional Services Industry Benchmark Report represents an invaluable resource for your organization. Regards,
Fran Craig CEO & Founder Unanet Technologies
LETTER FROM OUR SPONSOR

2012 PSVillage
Professional Services Industry Benchmark Report
©2012 PSVillage, Inc. Page 7
The 2012 PSVillage Professional Services Industry Benchmark is designed to enable technology professional services organizations to measure their performance against their peers and to identify areas for improvement in human capital, finance, and operations management. During the second half of 2011, nearly 150 professional services executives from software/hardware companies or technology consulting firms completed our 147-‐question survey. The primary intent of the survey was to capture for the first time a set of professional services human capital metrics that go beyond the typical salary surveys. Nineteen (19) roles across the professional services organization (in management, delivery, sales, and operations) were surveyed, capturing the following for each role: number of resources in the role, target billable utilization, average base salary, target bonus as a percent of base salary, billable rate per hour, years of professional services experience in the role, and average percent travel. A rich set of financial metrics was also included in the benchmark, as well as key questions relating to pricing and investments in operations management. In designing the survey, we considered that PS organizations differ—sometimes significantly—due to their size, location, and/or business model. It is important for executives to compare their business to similar organizations. To accommodate this need, we decided to put the data—along with filters to tailor the results—in your expert hands. You can filter the data by geography, company revenue, PS revenue, PS headcount, and software delivery model—or a combination of these parameters. So what makes our survey unique? You can go online, view the results in table and graph format, use filters to measure your performance against comparable organizations, go back and view the data months later as more surveys are completed throughout 2012, and be confident in results that were completed by executives with P&L responsibility. For many executives, that is all that they need to analyze their professional services performance. For others, who would prefer to see the results presented in document format, we created this report. With 147 data points in the study—plus the ability to filter the data in many ways using various selections for five different filters, all the possible results are too numerous to present. But you can get a good understanding of the metrics and the results, and then, if you choose, you can go online, examine the actual aggregated results, and apply the appropriate filters to do more in-‐depth analysis in areas of interest. Some of our members have already analyzed the survey data online and applied what they learned to improve their professional services business. We included some of their comments in this report so you see how they used the information. One PS vice president used the salary
EXECUTIVE SUMMARY

2012 PSVillage
Professional Services Industry Benchmark Report
©2012 PSVillage, Inc. Page 8
data to help create and validate a new compensation plan. Another vice president used the data to verify that his company’s PS bill rates are in line with competitors. And a third vice president used the filters to research bill rates for consultants and senior consultants at comparable companies to create a pricing model for a new packaged service offering. Some executives commented about how delivery models have evolved and others shared their views on respondent’s expense targets and profitability margins. In this report, we note some observations about the results. But our real intention here is to empower you to analyze the performance of your PS organization. Here are some interesting observations from the survey results:
Ø PS Managers Salaries: At the professional services management level, there is a surprising level of uniformity across company size, as well as pure services and product-‐centric companies, for base salaries. However, professional services managers at companies with over $1 billion in revenue do benefit from higher salaries.
Ø Automated Systems for PS Operations: 38% of respondents lack automated systems to manage their business, likely contributing to inefficient processes that may be impacting expenditures and revenues.
Ø PS Resource and Operations Management Roles: A majority of respondent companies function without dedicated operations managers or resource managers—most likely performing these functions with shared resources.
Ø Dedicated Services Sales Reps: Surprisingly, only 36% of pure services respondents have dedicated sales staff.
Ø Target Billable Utilization for Delivery Roles: Most delivery roles show target utilizations over 50%. But, most remarkable is the large percentage of PS organizations with target billable utilization rates that are below 75% for delivery roles.
Ø PS R&D Expense Target: 59% of respondents target less than 3% of their budget to R&D. These companies may want to consider a larger investment in this area in order to optimize service delivery and improve their bottom line.
Ø PS Sales Expense Target Percentage: About one quarter (23%) of companies surveyed target less than 4% of their budget for sales.
Ø PS G&A Expense Target Percentage: The percent of the PS budget targeted to G&A varied widely. It was surprising to see that 31% of companies budgeted more than 10% for G&A. The amount budgeted was greater for larger companies than for smaller companies.
Ø PS Average Cost of Services Sold Target Percentage: The average target COSS for all respondents is 74 percent—as expected.

2012 PSVillage
Professional Services Industry Benchmark Report
©2012 PSVillage, Inc. Page 9
After the setback in 2009, the professional services sector showed healthy profitability numbers for 2011 and strong projections for 2012. Here are a few of the results:
Ø PS Gross Margin Target Percentage: Almost three-‐quarters (70%) of the companies surveyed had a healthy gross margin of 30% or more. And over one-‐third (35%) of the companies surveyed had achieved gross margins of 40% or more.
Ø PS Operating Income Margin: 64% of companies surveyed achieved a healthy operating income margin of 15% or more last year. And 85% reached an operating profit of 10% or more. Clearly, it was a good year for many professional services organizations.
Ø Projected Growth: Companies budgeted year-‐over-‐year growth ranging up to 60%, with one-‐quarter of the respondents projecting a healthy 10 to 15% growth. For companies with revenue of $100 million or more, one-‐third of the respondents anticipate 10 to 15% growth and 28% expect to grow 20 to 40%.
It is encouraging to see such a large group of thriving businesses. This is a positive sign that the economy is getting stronger and PS organizations are doing well and becoming more confident in future business prospects. After you read this report, we encourage you to view the actual benchmark results online with the filter selections that most closely match your organization. Many thanks to our members, and to Unanet Technologies, our report sponsor, for helping us to deliver this report and the online benchmark results. We hope this information will help you enhance your PS human capital, finance, and management operations. And we look forward to your feedback so we can continue to make the PSVillage benchmark more valuable each year. All the best, Terry Jansen President & Founder PSVillage

2012 PSVillage
Professional Services Industry Benchmark Report
©2012 PSVillage, Inc. Page 10
PSVillage is a community created to benefit leaders of technology professional services (PS) organizations. Over the years, PSVillage has grown to include more than 2,000 members across the Americas, Europe and Asia-‐Pacific. During the second half of 2011, PSVillage conducted its first online benchmark survey of technology professional services organizations (PSO). Nearly 150 professional services executives completed the survey that included 147 questions designed to analyze professional services human capital metrics, as well as finance and business operations Key Performance Indicators (KPIs). The purpose of this report is to present high-‐level results from the survey. With nearly 150 data points in the study—plus the ability to filter the data in numerous ways using various options for five different filters, not all the possible results will be presented. You can view the actual benchmark results online and apply the filters that are relevant to you. Likewise, there is no attempt to analyze how your organization is doing against some arbitrary standards. This is a benchmark review, not an analysis that will give you a grade or tell you how mature your organization is today. Some general observations are called out, and the data—along with filters to help you with your own analysis—is put in your expert hands.
What Makes the PSVillage Survey Unique? The 2012 PSVillage Professional Services Industry Benchmark is a first of its kind. Unlike traditional surveys that are static, the PSVillage survey is unique in the following ways:
• The survey results are presented online in table and graph format. So instead of wading through hundreds of pages to find the key findings that are the most interesting, you can readily view the actual aggregated responses.
• Using the dynamic online filters built into the reporting tools, you can quickly and easily tailor the results to measure your performance against comparable organizations. The data can be filtered by geography, company revenue, PS revenue, PS headcount, and software delivery model—or a combination of these parameters.
• The surveys were completed by PSVillage members who are professional services executives or senior managers with staff and P&L responsibility in software/hardware companies or technology consulting firms. The survey respondents were screened to ensure that they meet these qualifications. Unlike surveys where anyone in the organization can respond, you can count on getting accurate results from respondents who have full access to the financials and other business metrics.
• The data is dynamically updated as members’ survey responses are added to the
database throughout the year—so you always have access to the most current data.
INTRODUCTION

2012 PSVillage
Professional Services Industry Benchmark Report
©2012 PSVillage, Inc. Page 11
These key elements create a survey in which you can view the actual data, select the results of companies that most closely match your environment, and feel confident in data submitted by senior managers. And as economic conditions shift throughout the year, the dynamic survey results reflect the changing environment for professional services organizations worldwide. Benchmark Objectives The primary intent of the survey was to capture for the first time a set of professional services human capital metrics that go beyond the typical salary surveys. Instead of simply capturing salaries for consultants and project managers, 19 roles across the professional services organization (in management, delivery, sales, and operations) were surveyed. For each professional services role, respondents provided the following information (as appropriate): number of resources in the role, target billable utilization, average base salary, target bonus as a percent of base salary, billable rate per hour, years of professional services experience in the role, and average percent travel. This detailed level of professional services human resource key findings is not available from any other source. In addition, the survey captures other business operations metrics that help leaders more effectively run a professional services organization. Financial metrics span the following areas: professional services utilization, expense targets, profitability margins, and projected annual growth. Other business operations metrics cover pricing and the use of a project management office (PMO), an automated system to manage professional services operations, and a delivery solution knowledgebase. How Survey Was Conducted The survey questions were assembled through interviews with senior professional services executives, all of whom were managing professional services organizations at the time and have extensive experience running PSOs. In all cases, the criteria for creating the survey were the same: capture the information that is of utmost value to professional services leaders, yet not readily available. All PSVillage members—as well as non-‐members—with professional services staff and P&L responsibility were invited to participate in the survey. The survey respondents were screened to ensure that they met the criteria to participate. This level of management participation provides a top-‐down view of PSOs, allowing the survey to include questions regarding organizational dynamics that typically are not found in benchmark studies. With an online approach (as compared to email and spreadsheets), the benchmark is always available for qualified respondents to participate and the results are immediately added to the database (after review by PSVillage to ensure the respondent met the qualifying criteria). If you are a qualified professional services leader, you can complete the survey now by going to the following URL: https://www.psvillage.com/it-‐professional-‐services-‐industry-‐benchmark

2012 PSVillage
Professional Services Industry Benchmark Report
©2012 PSVillage, Inc. Page 12
Insights Garnered by PSVillage Members Because the development of this benchmark was a community effort, we asked our members for their insights relevant to their PS organization. Here are some of their observations: From a professional services vice president at a medium-‐sized U.S. SaaS company:
• “I'm currently working on a new variable compensation plan for my PS team and the ability to ensure that we are competitive across all roles is critical. It is particularly helpful to be able to filter the data in many ways. It ensures that I'm comparing apples to apples.”
• “I was pleased to validate that our billable rates are clearly within the norm with peers, despite what customers claim.”
• “I'm considering adding a services sales representative. The survey was particularly useful in helping me determine a competitive compensation package.”
From a vice president of professional services at a medium-‐sized U.S. software company:
• “I look at survey data at least yearly, sometimes quarterly, to benchmark the operations of my services organization against the collective services community. I’m particularly interested in following metrics: gross margin, year-‐over-‐year growth rate, revenue mix, target utilization and utilization models. The PS Village benchmark results provide a good source of data on which to base decisions or to initiate some detailed research.”
• “I also found the data on PS sales and marketing expenses insightful. We haven’t developed much in this area and I was interested in seeing what others are doing.”
• “By using the filters, I’m able to compare our salaries and bonuses, as well as number of
resources in each role, with PS organizations of comparable size.”
• “We are implementing a new packaged service offering. I used the filters to research billing rates for consultants and senior consultants at comparable companies (embedded services organizations with on-‐premise software and similar revenue and headcount). The rates in the survey validated the service price point and gave me key factual data to support my pricing model. “
From a professional services leader at a small U.S.-‐based software company:
• “The distribution of contract types (fixed price vs. time & materials) is relatively even. I expected to see a heavy emphasis on time and material contracts.”
PSVillage Member Key Findings

2012 PSVillage
Professional Services Industry Benchmark Report
©2012 PSVillage, Inc. Page 13
• “We value our project managers; they do much more than project management. After viewing the project manager salary results, we may need to consider providing target salary adjustments for our project managers. I also learned that our project manager billable rates are in-‐line with others and that the $200/hour mark is valid.”
• “We are comfortable with our headcount and revenue with respect to the economy. But it was interesting to look at the benchmark results for companies ‘one-‐up’ in the filter ranges to see what we might expect if and when we decide to grow our business.”
From a consulting vice president at a medium-‐sized U.S. SaaS company:
• “The results indicate significant differences in business models between larger and small companies, and not just salaries. Utilization rates and gross margins differ significantly as well.”
From a US professional services vice president at a large European-‐based software enterprise:
• “The growth of pure on-‐demand (SaaS) delivery models is striking (19% of respondents).
• “The miniscule number of firms (3% of respondents) providing pure custom app development demonstrates either a membership bias or a decline in this delivery model.”
• “Marketplace pressure from customers/competitors is evident based on the following: -‐ 23% of respondents have overall target billability < 65%
(must have to give away a lot) -‐ 29% of respondents have gross margin targets < 30%
(must have to give away hours or reduce prices) -‐ 10% of respondents have overhead > 25% of revenue -‐ 15% of respondents have operating income targets < 10%
• “Perhaps the most mind-‐boggling finding to me is that 38% of respondents lack automated systems to manage their businesses. No wonder margin and income targets are low for many—they have no way to manage their business.”

2012 PSVillage
Professional Services Industry Benchmark Report
©2012 PSVillage, Inc. Page 14
INTRODUCTION
How to Use the Results Benchmarking has been defined as “the process of regularly comparing oneself to others performing similar activities so as to continuously improve.” Because the PSVillage benchmark results are presented online, you can easily view the data in table and graph format and compare yourself to all respondent technology professional services organizations. The observations provided by PSVillage members in the prior section are just a few of the key findings that can be gleaned from the study. With the online filtering capability, you can zoom in on PS organizations that match your own, inspect their business and finance operations metrics, and determine how your PS organization can achieve competitive advantage. There are five filters that allow you to slice the data in a variety of ways. For example, you can ask to see “North American PSOs with 50-‐100 PS employees and less than $100 million in PS revenue” or “European companies with company revenue between $100 million and $1 billion.” The survey results include the following: 147 metrics, 12 charts, and 5 filters. See Appendix A at the end of this report for a complete listing of the metrics, charts, and filters. Get a Visual Dashboard Tailored for your PS Business As a business executive, you want to see a high-‐level summary of important business metrics as well as the detailed data. The PSVillage study results present the key findings at both levels: pie charts, which are automatically generated based on the filters selected, provide a visual display of the key metrics and tables provide more granular information. To give you an example of the high-‐level graphics available, as well as the value of filters, let’s look at a professional services dashboard with filters applied as follows:
-‐ North America -‐ Company Revenue: $10M -‐ $100M -‐ PS Headcount: 26-‐50
ANALYZING THE BENCHMARK RESULTS

2012 PSVillage
Professional Services Industry Benchmark Report
©2012 PSVillage, Inc. Page 15
Figure 1: Financials & Operations Dashboard
The Financials and Operations dashboard in Figure 1 graphically depicts the following metrics: utilization models, average salary by group, average cost of services sold, and average total costs. Applying the filters mentioned above (North America, company revenue $10M-‐$100M, and PS headcount 26-‐50), 52% of respondents use a 1920-‐hour work year as the basis for their utilization rates. The average base salary for PS management is $131K, while the average base salary for delivery resources is $104K. Figure 2: Human Capital – Management Dashboard
The graph in Figure 2 displays average base salaries for PS management. Applying the same filters (North America, company revenue $10M-‐$100M, and PS headcount 26-‐50), the average base salary for general manager/senior VP of professional services is $213K, the VP of professional services commands an average base salary of $166K, directors average $141K, while managers and engagement managers average $116K and $111K, respectively.

2012 PSVillage
Professional Services Industry Benchmark Report
©2012 PSVillage, Inc. Page 16
Figure 3: Human Capital – PS Operations Dashboard
This pie chart in Figure 3 displays average base salaries for PS operations staff. For the respondents who meet the filter criteria (North America, company revenue $10M-‐$100M, and PS headcount 26-‐50), the average base salary for vice presidents of PS operations is $163K, while directors of PS operations earn on average $138K. The average base salary for resource managers and PS operations managers is $101K and $82K, respectively. Figure 4: Human Capital – Sales Support Dashboard
The graph in Figure 4 presents average base salaries for PS sales support staff. Using the same filter criteria as above, average base salaries are as follows: VP/director of services sales ($155K), presales personnel ($119K), and services sales reps ($113K).

2012 PSVillage
Professional Services Industry Benchmark Report
©2012 PSVillage, Inc. Page 17
Figure 5: Human Capital – Delivery Resources Dashboard
The graph in Figure 5 displays average base salaries for professional services delivery resources. For the survey respondents who meet the filter criteria (based in North America, company revenue $10M-‐$100M, and PS headcount 26-‐50), the average base salaries are as follows: solution architects ($119K), senior consultants ($114K), project managers ($108K), indirect resources ($105K), business analysts ($99K), consultants ($95K), and junior consultants ($63K).

2012 PSVillage
Professional Services Industry Benchmark Report
©2012 PSVillage, Inc. Page 18
Company Although the professional services industry includes accounting services, legal services, as well as a number of other services, the PSVillage PS Industry Benchmark Survey focuses only on technology services. The companies surveyed include both pure technology services firms, as well as PSOs within software and hardware product-‐centric companies. Company Location: The survey included participants worldwide. However 92% of the 2011 respondent companies are located in North America with most of their employees in the United States. In 2012, PSVillage hopes to grow participation in Western Europe and Asia Pacific. Company Industry: Respondents cover nine (9) industries with the majority of respondents from high-‐technology companies. This is not surprising because PSVillage focuses on technology professional services.
-‐ High Tech -‐ Communications -‐ Consumer Packaged Goods -‐ Financial
Services/Banking/Insurance
-‐ Health Care/Biotech/Pharmaceutical -‐ Manufacturing -‐ Retail -‐ Utilities/Energy -‐ Multi-‐Industry
Company Size by Revenue: Three-‐quarters of the survey respondents represent companies with total company revenue between $10 million and $1 billion.
Company Size by Number of Employees: 57% of the survey respondents represent companies with 20 to 500 employees and 41% represent companies with over 1,000 employees.
0% 10% 20% 30% 40% 50% 60%
Under $10 Million $10 -‐ $100 M $100M -‐ $1B
$1 -‐ 5B Over $5 Billion
Percentage of Respondents
Figure 6: Total Company Revenue
BENCHMARK DEMOGRAPHICS

2012 PSVillage
Professional Services Industry Benchmark Report
©2012 PSVillage, Inc. Page 19
Delivery Model: Of all respondents, 14% offer solely an on-‐premise software solution, 18% offer solely on-‐demand services, and only 2% offer solely hosted services. Whereas, 41% offer a combination of on-‐premise and off-‐premise (hosted or on demand) services. The responses indicate that enterprise computing is not going to be purely on-‐premise or in-‐the-‐cloud; instead they will exist together in harmony. Of the nearly 150 companies who responded to the survey, 20% are pure consulting firms.
0% 5% 10% 15% 20% 25% 30% 35% 40%
Under 20 21 -‐ 100 101 -‐ 500
501 -‐ 1,000 1,001 -‐ 5,000 Over 5,000
Percentage of Respondents
Figure 7: Total Company Employees
0% 5% 10% 15% 20% 25%
Management Consulung Pure Services Consulung Firm
Custom Applicauon Development Hosted + On Demand + On Premise
Hosted + On Premise Hosted
On Demand + On Premise On Demand (SaaS /Cloud)
On Premise (Commercial Licensing)
Percentage of Respondents
Figure 8: Delivery Model

2012 PSVillage
Professional Services Industry Benchmark Report
©2012 PSVillage, Inc. Page 20
Professional Services Business PSO Size by Revenue: Three-‐quarters of the survey respondents represent professional services practices with total revenue between $1 – 20 million.
PSO Size by Number of Employees: Half of the survey respondents represent professional services practices with 11 to 50 employees and 40% have over 50 employees.
0% 5% 10% 15% 20% 25% 30% 35% 40% 45% 50%
Under $1 Million
$1 -‐ 5 Million
$6 -‐ 20 Million
Over $20 Million
Percentage of Respondents
Figure 9: Professional Services Revenue
0% 5% 10% 15% 20% 25% 30%
Under 10 11 -‐ 25 26 -‐ 50
51 -‐ 100 101 -‐ 250 Over 250
Percentage of Respondents
Figure 10: Professional Services Employees

2012 PSVillage
Professional Services Industry Benchmark Report
©2012 PSVillage, Inc. Page 21
Use of Indirect Resources Percentage of Indirect Resources: For three-‐quarters of the companies surveyed, 75% of their resources are employees versus offshore, partners or third party subcontractors. Only 7% use indirect resources for more than half their resources.
PS Revenue Mix Consistent with the number of indirect resources, 85% of the companies surveyed have 70% or more of their revenue coming direct. Only 9% of respondents have over half their revenue coming from subcontractors.
0% 10% 20% 30% 40% 50% 60%
Under 10%
11 -‐ 25%
26 -‐ 50%
51 -‐ 75%
76 -‐ 100%
Percentage of Respondents
Figure 11: Percentage of Indirect Resources
2012 PSVillage
Professional Services Industry Benchmark Report
©2012 PSVillage, Inc. Page 22
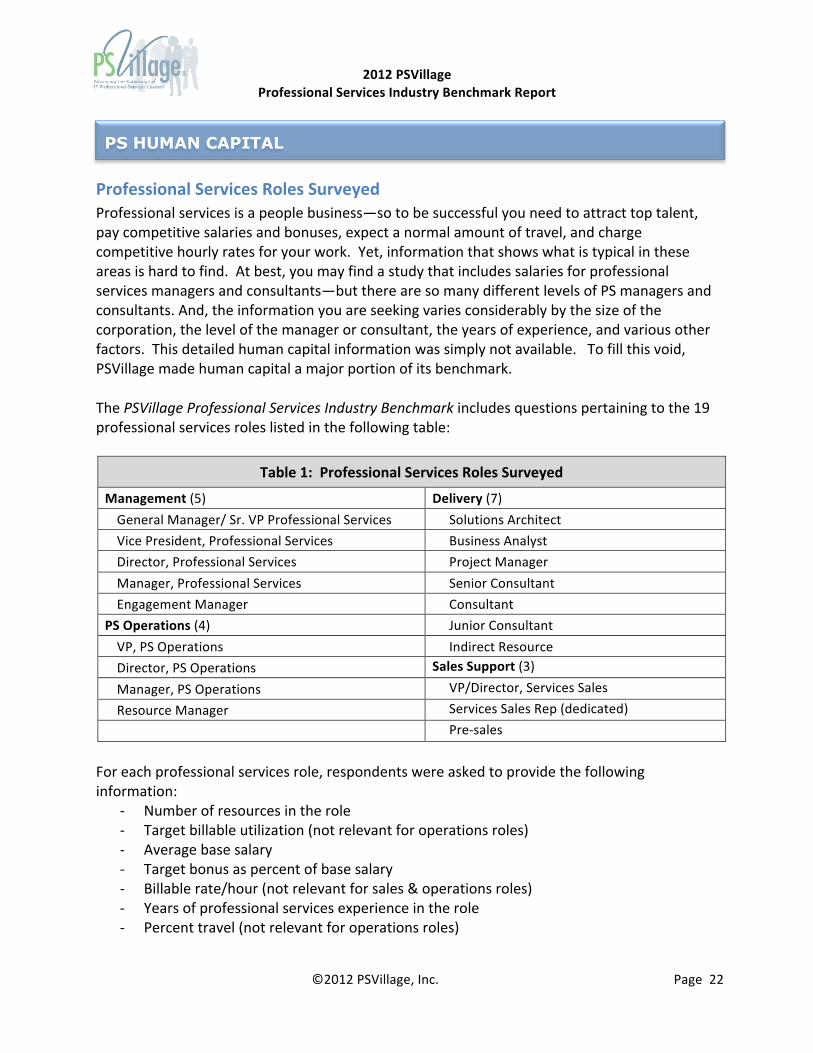
Professional Services Roles Surveyed Professional services is a people business—so to be successful you need to attract top talent, pay competitive salaries and bonuses, expect a normal amount of travel, and charge competitive hourly rates for your work. Yet, information that shows what is typical in these areas is hard to find. At best, you may find a study that includes salaries for professional services managers and consultants—but there are so many different levels of PS managers and consultants. And, the information you are seeking varies considerably by the size of the corporation, the level of the manager or consultant, the years of experience, and various other factors. This detailed human capital information was simply not available. To fill this void, PSVillage made human capital a major portion of its benchmark. The PSVillage Professional Services Industry Benchmark includes questions pertaining to the 19 professional services roles listed in the following table:
Table 1: Professional Services Roles Surveyed
Management (5) Delivery (7) General Manager/ Sr. VP Professional Services Solutions Architect Vice President, Professional Services Business Analyst Director, Professional Services Project Manager Manager, Professional Services Senior Consultant Engagement Manager Consultant
PS Operations (4) Junior Consultant VP, PS Operations Indirect Resource Director, PS Operations Sales Support (3)
Manager, PS Operations VP/Director, Services Sales Resource Manager Services Sales Rep (dedicated) Pre-‐sales
For each professional services role, respondents were asked to provide the following information:
-‐ Number of resources in the role -‐ Target billable utilization (not relevant for operations roles) -‐ Average base salary -‐ Target bonus as percent of base salary -‐ Billable rate/hour (not relevant for sales & operations roles) -‐ Years of professional services experience in the role -‐ Percent travel (not relevant for operations roles)
PS HUMAN CAPITAL

2012 PSVillage
Professional Services Industry Benchmark Report
©2012 PSVillage, Inc. Page 23
0% 10% 20% 30% 40% 50% 60%
Under 25% 26 -‐ 50% 51 -‐ 75% 76 -‐ 100%
Percentage of Respondents
Figure 13: Target Billable U`liza`on
Consultant
Senior Consultant
As is true for all the PSVillage survey results, you can filter the information by:
-‐ Company HQ location (North America, Asia Pacific, Western Europe) -‐ Total company revenue -‐ PS revenue -‐ PS headcount -‐ Delivery model
With 19 professional services roles, up to seven pieces of information for each role, and various filters to apply to the data, the amount of data is too extensive to present all the results in this report. To give you a flavor of the information available, the results for a Consultant and Senior Consultant are presented here.
0% 10% 20% 30% 40% 50% 60%
None
1
2-‐10
11-‐25
26-‐50
51-‐100
101-‐500
Over 500
Percentage of Respondents
Figure 12: Number of Resources in the Role
Consultant
Senior Consultant

2012 PSVillage
Professional Services Industry Benchmark Report
©2012 PSVillage, Inc. Page 24
0% 10% 20% 30% 40% 50% 60% 70%
0 -‐ 50K
51 -‐ 75k
76 -‐ 100K
101 -‐ 125K
126 -‐ 150K
151 -‐ 200K
Figure 14: Average Base Salary
Consultant
Senior Consultant
0% 10% 20% 30% 40% 50%
None
1 -‐ 10%
11 -‐ 20%
21 -‐ 30%
Over 30%
Figure 15: Target Bonus as Percentage of Base Salary
Consultant
Senior Consultant
0% 5% 10% 15% 20% 25% 30% 35%
Under $100 $101 -‐ 125 $126 -‐ 150 $151 -‐ 175 $176 -‐ 200 $201 -‐ 250 $251 -‐ 300 $301 -‐ 500
Percentage of Respondents
Figure 16: Billable Rate/ Hour
Consultant
Senior Consulant

2012 PSVillage
Professional Services Industry Benchmark Report
©2012 PSVillage, Inc. Page 25
Observations Regarding Roles PS Resource and Operations Management Roles How efficiently PSOs manage and deploy their resources and manage overall business operations significantly impacts the bottom line. To help better understand and manage resources and managers, 62% of companies who participated in the survey have implemented an automated system to manage their professional services operations. And yet, regardless of company size, a majority of respondent companies function without dedicated operations managers (VP PS Operations, Director PS Operations, Manager PS Operations) or resource managers. Resource managers are primarily responsible for assigning appropriate resources to client engagements. This includes tasks such as monitoring status of ongoing projects to understand when resources will become available, identifying available resources based on expertise and location to participation in post-‐sales activities, and maintaining current information for resource skillsets, availability schedules, and delivery restrictions to assist in rapid fulfillment of
0% 10% 20% 30% 40% 50% 60% 70% 80%
Under 2 yrs
3 -‐ 5 yrs
6 -‐ 10 yrs
11 -‐ 15 yrs
16 -‐ 20 yrs
Percentage of Respondents
Figure 17: Years of PS Experience in Role
Consultant
Senior Consultant
0% 5% 10% 15% 20% 25% 30% 35% 40%
No Travel
1 -‐ 10% Travel
11 -‐ 40% Travel
41 -‐ 75% Travel
76 -‐ 100% Travel
Percentage of Respondents
Figure 18: Percent of Time Spent Traveling
Consultant
Senior Consultant

2012 PSVillage
Professional Services Industry Benchmark Report
©2012 PSVillage, Inc. Page 26
resources in projects. Only 25% of respondents employ a resource manager. Given the importance of resource management, a larger percent of respondent companies with resource managers might be expected. Operations managers help with driving operational efficiency in the PS organizations (e.g., forecasting, metrics reporting, time and billing collection and analysis). Most PS organization performs these tasks, yet the survey indicates that only 35% of companies have a dedicated operations manager, director or VP. That means that the majority of organizations are performing these functions with shared resources, such as PS management, finance management, and corporate administration. Services Sales Roles For companies with less than $10 million in revenue, 40% of respondents have 1 to 5 dedicated services sales reps. For companies larger than $10 million in revenue, the bigger the company, the more likely it has dedicated services sales reps. And surprisingly, only 36% of pure services respondents have dedicated sales staff.
The survey results indicate that average salaries and bonuses of services sales reps is considerably greater than that of delivery resources with similar years of experience, providing a potential career path for senior consultants. Observations Regarding Salaries PS Managers At the professional services management level, there is a surprising level of uniformity across company size, as well as pure services and product-‐centric companies, for base salaries. However, professional services managers at large companies with over $1 billion in revenue do benefit from higher salaries than managers at companies with less revenue. Whereas at the General Manager, Senior VP, and VP level, base salaries definitely progress upward as the size of the company increases.
0% 10% 20% 30% 40% 50% 60% 70%
Under $10Million $10M -‐ 100M $100M -‐ 1 B
Over $1Billion
Percentage of Respondents Compa
ny Reven
ue
Figure 19: Percentage of Companies with Dedicated Services Sales Reps

2012 PSVillage
Professional Services Industry Benchmark Report
©2012 PSVillage, Inc. Page 27
PS Delivery Resources As you would expect, base salaries increase for delivery roles as you move up the ranks from junior consultant to consultant to senior consultant to solution architect. Overall, project manager salaries closely match those of senior project managers. For the professional services roles in your organization, be sure to check out the online benchmark data for the average base salary, target bonus as a percent of base, target billable utilization, billable rate per hour, years of experience in the role, and percent travel. Also, keep in mind that you can zero in on professional services teams that match your organization by filtering the data by location, company revenue, PS revenue, PS headcount, and delivery model.

2012 PSVillage
Professional Services Industry Benchmark Report
©2012 PSVillage, Inc. Page 28
PS Utilization Utilization Models Utilization is a key metric for measuring the performance of any professional services business. It tells you how much of your organization’s capacity is being spent on revenue-‐producing work. It is measured as a percentage of how many hours are spent working on billable projects versus the total time available to work on projects. To measure utilization rates, you need to start with the total hours available for billable work. The maximum hours in a work year is 2080 (40 hours per week x 52 weeks). For PS Survey respondents, 1920 billable hours annually was the most popular target standard (27%). This was closely followed by a 2000 billable hour standard.
1920 hours = 2080 hours/year – 160 hours (or 4 weeks) for holidays, vacation, and training
2000 hours = 2080 hours/year – 80 hours (or 2 weeks) for holidays and vacation
Our results show that smaller companies use a bigger base for their utilization formula, expecting their consultants to work more billable hours than larger companies. For larger companies (with revenue of $100 million or more), 50% use a baseline of 1,352 to 1,760 hours/year. And more than 30% of the larger companies start with 1560 hours or less (75% or less of 2080 possible work days) as the baseline for their utilization models. Target Billable Percentage It is important to establish the number of hours that must be billed in a month to bring in sufficient revenue to cover salary and operating expenses. About half of the respondents target 66 to 75% billable work on average, with another quarter of companies targeting 76 to 85%.
0% 5% 10% 15% 20% 25% 30% 35% 40%
Under 45% 46 -‐ 55% 56 -‐ 65% 66 -‐ 75% 76 -‐ 85% Over 85%
Percentage of Respondents
Figure 20: Average Target PS Billable Percentage
PS FINANCIALS

2012 PSVillage
Professional Services Industry Benchmark Report
©2012 PSVillage, Inc. Page 29
Blended Target Utilization As stated earlier, utilization tells you how much of your organization’s capacity is being spent on revenue-‐producing work.
Utilization rate for organization = Total billable hours / Hours available x number of billable employees
73% of respondents overall have a blended utilization rate between 66 to 90%. Blended target utilization is higher in companies with less than $100 million in revenue than in companies with more than $100 million in revenue. 35% of respondent companies with less than $100 billion in revenue have a 76 to 90% utilization rate.
Target Billable Utilization for Each PS Role The PSVillage survey captures target billable utilization for the following 15 job roles: General Manager, PS Vice President, PS Director, PS Manager, Engagement Manager, VP/Director of Services Sales, Service Sales Rep, Presales role, Solution Architect, Business Analyst, Project Manager, Senior Consultant, Consultant, Junior Consultant, and Indirect Resources.
Overall, utilization targets for senior PS leaders (General Manager, VP, Director, and Services Sales Director) were less than 25% and for PS managers were less than 50%. Half of engagement managers had target utilization rates of 51 to 75%. Most delivery roles had target utilizations over 50%. But, most surprising is the large percentage of professional services organizations with target billable utilization rates that are below 75% for delivery roles.
0% 10% 20% 30% 40% 50% 60%
40 -‐ 50%
51 -‐ 65%
66 -‐75%
76 -‐ 90%
Percentage of Respondents
Figure 21: Blended Target U`liza`on
Companies with <$100M revenue
Companies with >$100M revenue

2012 PSVillage
Professional Services Industry Benchmark Report
©2012 PSVillage, Inc. Page 30
By using the filters available with the online benchmark data results, for just about any professional services role in your organization, you can see what companies in your location and of your company size and/or PSO size are targeting for utilization rates. Let’s filter the data to look at companies in North America with total revenue of less than $100 million, and then look at utilization rates for 3 roles (project manager, senior consultant, solution architect) at pure services organizations and at PSOs in product-‐centric companies.
0% 10% 20% 30% 40% 50% 60% 70% 80%
Junior Consultant Consultant
Senior Consultant Project Manager Business Analyst
Soluuon Architect
Figure 22: Percentage of PSOs with Target Billable U`liza`on Rates Below 75% for Delivery Roles
0% 10% 20% 30% 40% 50% 60% 70% 80%
26 -‐ 50%
51 -‐ 75%
76 -‐ 100%
Figure 23: U`liza`on Rates: North America Pure Services Org with Company Revenue < $100M
Project Manager
Senior Consultant
Soluuon Architect
0% 10% 20% 30% 40% 50% 60%
0
<25%
26 -‐ 50%
51 -‐ 75%
76 -‐ 100%
Figure 24: U`liza`on Rates: North America PSOs in Product-‐Centric with Company Revenue < $100M
Project Manager
Senior Consultant
Soluuon Architect

2012 PSVillage
Professional Services Industry Benchmark Report
©2012 PSVillage, Inc. Page 31
When looking at utilization rates, you also may like to know how many of the survey respondents actually utilize these roles. You can extract this information from the online benchmark data. For example, for senior consultants in PSOs within product companies with less than $100M in revenue: 16% of companies have none, 4% have 1, 66% have 2 to 10 and 14% have 11 to 25. If you look at just the 6 roles we viewed earlier (Solution Architect, Business Analyst, Project Manager, Senior Consultant, Consultant, Junior Consultant), the data shows significant differences between utilization targets and number of resources at pure service firms and PS organizations in product-‐centric companies. Of course, as expected, there are also differences for these roles in small companies versus large companies. PS Expense Targets PS Selling, General & Administrative (SG&A) Expenses SG&A is the sum of all direct and indirect selling expenses and all management or administrative expenses. A good management team will keep SG&A expenses (overhead) under tight control and limited to a certain percentage of revenue. For the companies surveyed, the percent of PS revenue allocated to SG&A varied significantly.
PS Selling Expense Target Percentage A well-‐defined sales process—including qualification, proposal development, and contract management—helps identify opportunities, close engagements, and reduce the risk of failure. To execute this process, companies need to decide whether to use the product sales team, a services sales team, partners, engagement managers, PS managers, or other resources. Among the survey respondents, the sales budget varied considerably from less than 4% to over 25%. Larger companies with annual revenue of $100 million or more target a larger percent of their budget to sales expenses than smaller companies.
0% 5% 10% 15% 20% 25% 30% 35%
Under 10%
16 -‐ 25%
Over 35%
Percentage of Respondents
Figure 25: Percent of PS Revenue Allocated to SG&A

2012 PSVillage
Professional Services Industry Benchmark Report
©2012 PSVillage, Inc. Page 32
Surprisingly, about one quarter (23%) of companies surveyed target less than 4% of their budget for sales. These companies may want to look at increasing their sales efforts.
PS Marketing Expense Target Percentage Professional services organizations in product companies need to decide whether to create a marketing department dedicated to services or to ask the product marketing department to handle the function. In some cases, pure services organizations or embedded PS organizations reduce marketing expenses by outsourcing marketing functions. Three quarters of the survey respondents spend 3% or less of their budget on marketing. Smaller companies spent a slightly larger percent of the budget on marketing than larger companies. PS Practice Development (R&D) Expense Target Percentage Professional services organizations need to invest in managing intellectual property, and building and enhancing methodologies and tools. The percent of the budget targeted to R&D varied, with 59% targeting less than 3%, 11% targeting 3 to 4%, and 30% targeting 5% or more. It is surprising to see that 59% target less than 3% of their budget to R&D. These companies may want to consider a larger investment in this area in order to optimize service delivery and improve their bottom line.
0% 10% 20% 30% 40%
Under 4%
4 -‐ 5%
6 -‐ 7%
8 -‐ 10%
11 -‐ 15%
16 -‐ 20%
21-‐25%
Over 25%
Percentage of Respondents
Figure 26: Sales Expense Target
Companies with <$100M revenue
Companies with >$100M revenue

2012 PSVillage
Professional Services Industry Benchmark Report
©2012 PSVillage, Inc. Page 33
PS G&A Expense Target Percentage G&A expenses include the expenses that are not captured in cost of services, sales, marketing or R&D. It includes rent, utility costs, management and other administrative costs. The percent of the professional services budget targeted to G&A varied widely, with 28% budgeting less than 7% and 31% budgeting more than 10%. The amount budgeted was greater for larger companies than for smaller companies. It is surprising to see such a large percentage of companies budgeting more than 10% for G&A. PS Average Cost of Services Sold Target Percentage The cost of services sold (COSS) includes the cost of human resources and materials required to deliver the services to customers. In this survey, PS COSS was calculated based on the respondent’s target percentage answers for the following: selling expense, marketing expense, R&D expense, and G&A expense. The average target for all respondents is 74%.
0% 10% 20% 30% 40% 50% 60%
Under 50%
50 -‐ 75%
76 -‐ 90%
Over 90%
Percentage of Respondents
Figure 27: Average Cost of Services Sold

2012 PSVillage
Professional Services Industry Benchmark Report
©2012 PSVillage, Inc. Page 34
Profitability Margins If the business model of your PS organization is to support product sales and drive product revenue, your goals for revenue, utilization, and other measures will be lower than if your mission is to maximize services revenue. However, if your company’s services strategy is to become a services-‐led business, the PS organization needs to reach a higher level of profitability. Compare your organization’s profitability goals with that of your peers in the benchmark with consideration of the overall objectives for your professional services business. PS Gross Margin Target Percentage The professional services gross margin is a measure of profitability; it is the difference between what customers pay for the services and what it costs the company to deliver the services. In the benchmark survey, targeted gross margin percentages varied greatly. (Gross Margin Percentage = (Revenue – Cost of Goods Sold)/Revenue)
Almost three-‐quarters (70%) of the companies surveyed had a healthy gross margins of 30% or more. And over one-‐third (35%) of the companies surveyed had achieved gross margins of 40% or more. Margin expectations varied significantly between larger and smaller companies. The majority (72%) of companies with revenues over $100 million have target gross margin percentages in the range of 20 to 44%, while the majority (74%) of companies with revenues less than $100 million target higher gross margins percentages, in the range of 30 to 60%. If the targets are realized, the smaller companies in this study are operating more efficiently than their larger competitors.
0% 2% 4% 6% 8% 10% 12% 14% 16% 18% 20%
Under 20% 20 -‐ 24% 25 -‐ 29% 30 -‐ 34
35 -‐ 39% 40 -‐ 44% 45 -‐ 49% Over 50%
Percentage of Respondents
Figure 28: Gross Margin Target Percentage

2012 PSVillage
Professional Services Industry Benchmark Report
©2012 PSVillage, Inc. Page 35
PS Operating Income Margin PS operating income margin, also known as operating profit, is calculated by subtracting COSS, sales costs, G&A costs, R&D costs, and marketing costs from revenue. 64% of companies surveyed achieved a healthy operating income margin of 15% or more last year. And 85% reached an operating profit of 10% or more. Clearly, it was a good year for many professional services organizations.
Margin on Indirect Revenue Indirect revenue, also known as pass-‐through revenue, produces lower margins than direct revenue because you can only add so much “uplift” for managing outside resources. So, clearly, the revenue is less than when your consultants deliver the services and you receive the full service margin. For survey respondents, the average margin on indirect revenue varies significantly from less than 10% to 60%, with 10 to 20% targeted by one-‐fifth the respondents and 21 to 30% targeted by about one-‐third.
Projected Growth Companies budgeted year over year grow up to 60%, with one-‐quarter of the respondents projecting a healthy 10 to 15% growth. For companies with revenue of $100 million or more, one-‐third of the respondents anticipate 10 to 15% growth and 28% expect to grow 20 to 40%. It is nice to see such a large group of thriving businesses. This is a good sign that the economy is getting stronger and PS executives are becoming more confident in future business prospects.
0% 5% 10% 15% 20% 25% 30% 35%
Under 7% 7 -‐ 9%
10 -‐ 11% 12 -‐ 14% 15 -‐ 20% 21 -‐ 25% 26 -‐ 30% Over 30%
Percentage of Respondents
Figure 29: Opera`ng Income Margin

2012 PSVillage
Professional Services Industry Benchmark Report
©2012 PSVillage, Inc. Page 36
Project Management Office The Project Management Office (PMO) is responsible for setting standards, developing processes for delivering projects, maintaining a central knowledgebase, and promoting continuous learning. Overall, 42% of companies who participated in the PSVillage survey have a PMO. As expected, larger companies are more likely to have a PMO than smaller companies. For companies with revenue of $100 million or more, 66% have a PMO. For companies with revenues of $1 billion or more, 70% have a PMO.
Automated System for PS Operations Professional Services Automation (PSA) software greatly assists professional services organizations with client management, resource management, and other aspects of the PS business. Users can monitor metrics to better understand operations and improve efficiency and profitability. Overall, 62% of companies who participated in the PSVillage survey have adopted an automated system to manage their PS operations. For companies with revenue of $100 million or more, 70% have adopted an automated system.
As the data shows, 38 percent of respondents lack automated systems to manage their business, likely contributing to inefficient processes that may be impacting expenditures and revenues.
0% 10% 20% 30% 40% 50% 60% 70% 80%
Under $10 Million
$10M -‐ $100M
$100M -‐ 1B
Over $1 Billion
Percentage of Respondents
Compa
ny Reven
ue
Figure 30: Using Automated System to Manage PS Opera`ons
PS OPERATIONS

2012 PSVillage
Professional Services Industry Benchmark Report
©2012 PSVillage, Inc. Page 37
Knowledgebase Adoption Knowledge acquired on a project can be applied to similar projects in the future if it is captured and organized. Overall, 73% of companies who participated in the PSVillage Survey use a knowledgebase to support service delivery. For companies with revenue of $100 million or more, a whopping 84% use a knowledgebase. Whereas, surprisingly only 54% of pure service firms have implemented a knowledgebase.
For pure services companies who responded to the survey, only 50% use PSA software and only 54% use a knowledgebase—a fair amount less than PS organizations in product companies.
Pricing Strategies Professional services organizations have two main approaches to setting fees for services: charge for the time and materials working on a project, and provide an upfront fixed price for the project. Survey respondents showed a variation in the use of these pricing strategies. 45% said that they used T&M pricing from 70-‐100% of the time, whereas 32% said that 70 to 100% of their projects are fixed price. The number of T&M projects was somewhat greater than the number of fixed-‐price projects. Yet, as one of our members pointed out, he was surprised to see that the number of T&M priced and fixed-‐price projects were relatively even. He expected to see a much larger percentage of fixed-‐price projects. The vast majority of companies surveyed use a standard rate chart and standardized templates for quoting and estimating. And, as expected, the few companies who do not use these standard tools are smaller companies.
0% 10% 20% 30% 40% 50% 60% 70% 80% 90% 100%
Under 10 Million
$10M -‐ 100M
$100M -‐ $1B
Over $1 Billion
Percentage of Repondents
Compa
ny Reven
ue
Figure 31: Companies Using Knowledgebase

2012 PSVillage
Professional Services Industry Benchmark Report
©2012 PSVillage, Inc. Page 38
To Gain Access to the Survey ResultsThis report presents some of the highlights of the benchmark results. With 147 data points in the study and the ability to filter the data in numerous ways using various options for five different filters, we could not present all the possible results; the goal was to present sample data and observations. You can view the actual benchmark results online and apply the filter selections that most closely match your organization. Go to the PSVillage website to learn more and purchase 30-‐day or one-‐year access to the benchmark results. To Complete the Benchmark Survey Professional services managers with P&L responsibility are welcome to complete the benchmark survey. To obtain a login ID, register as a Guest or Premium Member on the PSVillage website. After you login, you can access the survey by selecting My Profile and select PS Benchmark Survey (in the upper right of the profile page). About PSVillage PSVillage is an industry-‐leading, global community of more than 2,000 technology professional services leaders representing over 750 companies. Established in 2004, PSVillage is the largest and most influential community of technology professional services leaders in the world and is committed to advancing the knowledge of the IT professional services community.
The PSVillage website, www.psvillage.com, contains articles and newsletters that provide fresh insights on current topics. Members gain valuable knowledge from webinars, research, and the PSVillage Library—a rich repository of practical tools, methods, and resources to help build, run, and optimize a professional services business. On a daily basis, PS leaders can reach out to peers globally, and pose questions and hold vibrant conversations through an online Forum. On-‐site networking events—such as the popular executive breakfast meetings in major U.S. cities—provide opportunities for members to meet in-‐person and exchange information. And whether a manager is looking for the next employee or the next job for career advancement, the online job board can help.
Go to the PSVillage website to learn more, join the community, and purchase 30-‐day or one-‐year access to the benchmark results.
NEXT STEPS

2012 PSVillage
Professional Services Industry Benchmark Report
©2012 PSVillage, Inc. Page 40
Thank You to Our Community Contributors According to the African proverb made popular by our former first lady of the United States, “It takes a village to raise a child.” And it took our village of professional services managers and executives to develop the benchmark survey, gather the data, and publish this report. PSVillage would like to thank our entire community for their participation in making this resource available. We’d especially like to thank the following members who contributed to this report:
Mary Ann Whiteman, CEO, Whiteman Consulting, Inc. Joe Longo, Vice President, Consulting, MetricStream Bill Geist, Vice President, Professional Services, International Business Systems
Chad Williams, Vice President, Services and Renewals, Advent Software Debra Brucato, Vice President, Professional Services, ViryaNet Bret Bowser, Director, Operations and Professional Services, EOS Group, Inc. Jeffrey Piper, Vice President, Professional Services, SpringCM Brian Whitefield, Director of Professional Services, Empirix Ray Wolf, CEO, Green Integrated Services
And a very special thanks to Unanet Technologies, our report sponsor.

2012 PSVillage Professional Services Industry Benchmark Report
©2012 PSVillage, Inc. Page 41
Appendix A: Benchmark Data Points The PSVillage PS Industry Benchmark Survey includes the following filters, charts, and data points:
Filters -‐ Company Location -‐ Total Company Revenue -‐ PS Revenue -‐ PS Headcount -‐ Delivery Model
Charts -‐ Demographics
o Company HQ Location o Company Industry o Delivery Model o Total Company Revenue
-‐ Human Capital o Management – Average Salaries o Sales Support – Average Salaries o PS Operations – Average Salaries o Delivery Resources – Average Salaries
-‐ Financials o Utilization Models o Average Salary by Group o Average Cost of Services Sold o Average Total Costs
Data Points
Demographics -‐ Company
o HQ Location o Industry/Vertical o Solution Delivery Model o Total Company Revenue o Number of Employees
-‐ Professional Services Business o Revenue for Respondent’s Area of P&L Responsibility o Number of PS Employees (direct + indirect)
-‐ Indirect Resources o Percentage of Indirect Resources (offshore, partners or 3rd party) o Revenue Mix (direct vs. indirect)

2012 PSVillage Professional Services Industry Benchmark Report
©2012 PSVillage, Inc. Page 42
• Human Capital
-‐ Management Roles Surveyed o GM/SVP-‐Professional Services o Vice President, Professional Services o Director, Professional Services o Manager, Professional Services o Engagement Manager
-‐ Sales Support Roles Surveyed o VP /Director of Services Sales o Services Sales Rep (dedicated) o Pre-‐sales
-‐ PS operations Roles Surveyed o VP, PS Operations o Director, PS Operations o Manager, PS Operations o Resource Manager
-‐ Delivery Roles Surveyed o Solution Architect o Business Analyst o Project Manager o Senior Consultant o Consultant o Junior Consultant o Indirect Resource
-‐ Metrics for each of the above 19 roles
o # Resources in this role o Target Billable Utilization (not relevant for operations roles) o Average Base Salary o Target Bonus % of Base o Billable rate/hour (not relevant for sales & operations roles) o Years PS experience in role o % Travel (not relevant for operations roles)
• Financials
-‐ Utilization o Utilization Models o Target PS Billable Percentage o PS Blended Target Utilization
-‐ Expense Targets o Selling Expense o Marketing Expense o Practice Development (R&D) o G&A Expense o Cost of Services Sold o Percent of PS Revenue allocated to SG&A/Overhead

2012 PSVillage Professional Services Industry Benchmark Report
©2012 PSVillage, Inc. Page 43
• Financials (continued) -‐ Profitability Margins
o PS Gross Margin Target o PS Operating Income Margin o Margin on Indirect Revenue
-‐ Projected Annual Growth
• Operations -‐ Project Management Office (PMO) -‐ Automated System to Manage PS Operations -‐ Knowledgebase for Services Delivery -‐ Pricing
o Standard Rate Chart? o Standard template for Quoting & Estimating? o Percentage of Fixed Price / T&M projects

2012 PSVillage Professional Services Industry Benchmark Report
©2012 PSVillage, Inc. Page 44
©PSVillage, Inc. 2012 PSVillage has used its best efforts in conducting the survey and publishing this report. PSVillage does not assume, and hereby disclaims any liability for any loss or damage caused by errors or omissions in this report, resulting from negligence, accident, or other caused. No part of this publication may be reproduced or transmitted in any form without the prior written permission of PSVillage, Inc. It is illegal to copy, fax, or email any of the contents of this document without permission.
PSVillage, Inc. Santa Clara, CA
(408) 246-‐2867 Email: [email protected] www.psvillage.com