professional report - theses
TRANSCRIPT

Salinity Risk in the Corangamite Region, Australia
Peter Dahlhaus 13
2 Regional overview
This chapter provides the biophysical context for the Corangamite region as a
synopsis of the physical and environmental elements considered relevant to the
origins and distribution of salinity. Sources of the data are identified and their
genesis explained where the data sets have been generated specifically for this
research. The review of previous work assists in clarifying the research questions
addressed in this thesis.
2.1 Physiography and drainage
The physiography of the Corangamite region is categorised into regions according
to its geography and landform (Figure 2.1). The northern portion is generally
referred to as the Central Highlands or Midlands (Hills 1940) and comprises the
southern slopes of the Great Dividing Range which forms the watershed between
the South East Coast Division and the Murray Darling Division of the Australian
Drainage Divisions (GA 1997). The central portion comprises the Western
District Plains or Victorian Volcanic Plains which are low undulating plains with
numerous lakes and wetlands. The southern portion comprises the Coastal Plain
or Heytesbury region in the west, the mountainous Otway Ranges and foothills in
the south, and the undulating Barrabool Hills and Bellarine Peninsula in the east.
The highest elevations in the Corangamite region are in the north, with the
volcanic cones of Mt Buninyong (745 m), Mt Warrenheip (741 m), and Tipperary
Hill (743 m) rising above the axis of the drainage divide along the northern
eastern boundary (740 m maximum). In general, the landscapes of the northern
highlands are characterised by undulating low hills dissected by a dendritic
drainage pattern that forms the upper catchments of the Moorabool River, Leigh
River, and Woady Yaloak River drainage systems. The primary drainage trends
parallel to the strike of the bedrock strata and the secondary drainage is controlled
by geological boundaries (i.e. lithological boundaries) and rock structures (i.e.
faults, joints). The Otway Ranges in the south rise to 686 m (Mt Cowley) and
have developed more rugged topography comprising ridges and spurs separated
by deeply dissected steep valleys. The drainage is strongly controlled by the
geological structure. Drainage on the south and eastern slopes forms short but

Salinity Risk in the Corangamite Region, Australia
Peter Dahlhaus 14
deeply incised rivers which drain to the Southern Ocean, and the northern and
western slopes drain to the Barwon River and Gellibrand River systems.
Figure 2.1 Physiography of the Corangamite region
Four Drainage Basins lie within the Corangamite region (GA 1997), viz: Barwon
River (Basin 33), which includes the Barwon and Leigh rivers; Lake Corangamite
(Basin 34) which includes the Woady Yaloak River system; and Otway Coast
(Basin 35) which includes the
Curdies and Gellibrand rivers; and
almost all of the Moorabool River
(Basin 32), apart from the Little
River catchment in the far east
(Figure 2.2).
Figure 2.2 Drainage basins of the
Corangamite region

Salinity Risk in the Corangamite Region, Australia
Peter Dahlhaus 15
Over 1500 lakes and wetlands are a feature of the region, including the
internationally significant Lake Corangamite, Lake Gnarpurt, Lake Connewarre,
Lake Murdeduke, Lake Colac, Lake Colongulac and Lake Beeac.
2.1.1 Physiography and drainage data sources
2.1.1.1 Terrain data
Due to the unavailability of a regional digital elevation model (DEM) at the
commencement of this research, a model (Figure 2.1) was constructed using the
10m contours and spot heights featured on the 113 published 1:25,000 VicMap
topographic maps for the Corangamite region. The model was hydrologically
enforced and the estimated accuracy for 90 % of the data is ±22.5 m horizontal
and ±5 m vertical. The digital processing was completed by Tony Davidson,
Geographic Information System (GIS) consultant, Hobart, Tasmania, and the
details of the model construction and calibration are appended (Appendix B).
As the research progressed, more accurate DEM data became available through
projects initiated by the Corangamite CMA. These data were collected using
airborne Light Detection and Ranging (LIDAR) technology, which resulted in
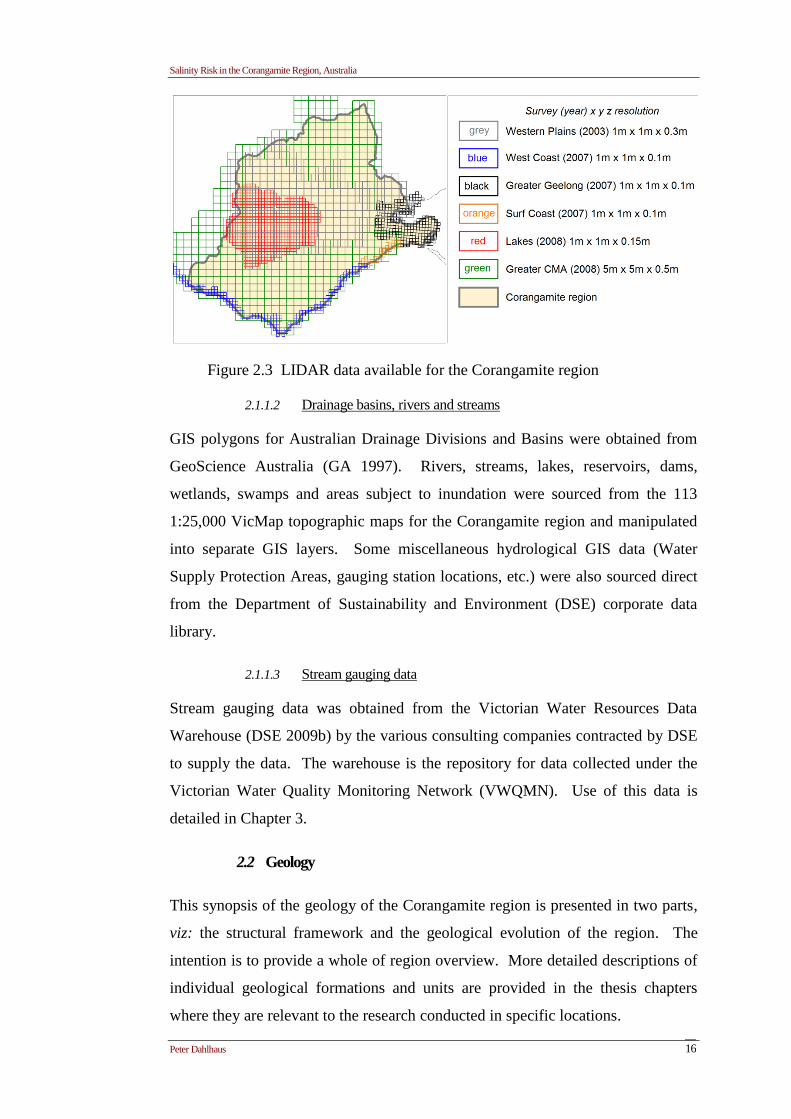
vastly improved accuracy and resolution of the DEM. The first of the LIDAR
data was collected across the Western District Plains in 2003 and the data
supplied as raw x,y,z data files that were processed (by this author) into a numeric
surface using 1 m x 1 m grid spacing. A series of subsequent LIDAR surveys
were flown in 2007 & 2008, some with very high accuracy (±1m horizontal and
±0.1m vertical). These data were generally supplied as a regularly spaced x,y,z
data files (i.e. interpolated x,y,z points) which were converted to GIS grid formats
by the author. One difficulty with the higher resolution data is the size of the
datasets (approximately 600 Gigabytes total), which limited the manipulation of
the data to tiles (either 5 km x 5 km or 2 km x 2 km). The resulting coverage of
high resolution DEM is illustrated in Figure 2.3.
More details on the collection and quality assurance of the LIDAR data are
appended (Appendix B).
Salinity Risk in the Corangamite Region, Australia
Peter Dahlhaus 16
Figure 2.3 LIDAR data available for the Corangamite region
2.1.1.2 Drainage basins, rivers and streams
GIS polygons for Australian Drainage Divisions and Basins were obtained from
GeoScience Australia (GA 1997). Rivers, streams, lakes, reservoirs, dams,
wetlands, swamps and areas subject to inundation were sourced from the 113
1:25,000 VicMap topographic maps for the Corangamite region and manipulated
into separate GIS layers. Some miscellaneous hydrological GIS data (Water
Supply Protection Areas, gauging station locations, etc.) were also sourced direct
from the Department of Sustainability and Environment (DSE) corporate data
library.
2.1.1.3 Stream gauging data
Stream gauging data was obtained from the Victorian Water Resources Data
Warehouse (DSE 2009b) by the various consulting companies contracted by DSE
to supply the data. The warehouse is the repository for data collected under the
Victorian Water Quality Monitoring Network (VWQMN). Use of this data is
detailed in Chapter 3.
2.2 Geology
This synopsis of the geology of the Corangamite region is presented in two parts,
viz: the structural framework and the geological evolution of the region. The
intention is to provide a whole of region overview. More detailed descriptions of
individual geological formations and units are provided in the thesis chapters
where they are relevant to the research conducted in specific locations.

Salinity Risk in the Corangamite Region, Australia
Peter Dahlhaus 17
2.2.1 Structural evolution and framework
The following description is largely summarised from VandenBerg et al. (2000)
and Birch (ed.) (2003).
In relation to the Palaeozoic structural framework of Australia, the Corangamite
region lies wholly within the Tasman Fold Belt System which comprises those
rocks accreted to the eastern margin of the Australian craton during Phanerozoic
orogenesis (VandenBerg et al. 2000). In western Victoria, the major fault zones
are used to divide the structural ranking (Figure 2.4). Two fold belts (Delamarian
and Lachlan), one terrane (Whitelaw) and three structural zones (Grampians-
Stavely, Stawell, and Bendigo) lie within the boundaries of the Corangamite
region.
(after VandenBerg et al., 2000)
Figure 2.4. Major structural zones of Western Victoria
2.2.1.1 Fold belts
The Moyston Fault, one of the largest in the Tasman Fold Belt System, forms the
boundary between the Delamarian Fold Belt and the Lachlan Fold Belt (Cayley
and Taylor 1998). Although not seen at the surface within the Corangamite
region, the Delamarian Fold Belt mainly comprises the Neoproterozoic-Cambrian
rocks deformed in the Late Cambrian Delamarian Orogeny. Only the extreme

Salinity Risk in the Corangamite Region, Australia
Peter Dahlhaus 18
south west corner of the Corangamite region is underlain by the Delamarian
basement and the majority lies within the Lachlan Fold Belt, comprising mainly
Cambrian to Devonian rocks deformed during several orogenic events from the
Late Ordovician to the Carboniferous.
2.2.1.2 Terranes
The Lachlan Fold Belt Rocks within the Corangamite region form part of the
Whitelaw Terrane, which has its boundary in eastern Victorian at the Governor
Fault. The Whitelaw Terrane is characterised by northerly structural trends,
resulting from east-west compression in a series of orogenic episodes from the
Late Ordovician to Middle Devonian (VandenBerg et al. 2000). In the east,
Silurian to Devonian sediments of the Whitelaw Terrane were deposited onto the
Selwyn Block, a north-dipping basement of Neoproterozoic – Cambrian rocks
which fits with the western Tasmanian Palaeozoic terrane of rocks deformed
during the Late Cambrian Tyennan Orogeny. The Governor Fault bounds the
eastern edge of the Selwyn Block. South of the Bambra Fault the Cretaceous
Otway Group rocks probably lie directly on the Selwyn Block.
2.2.1.3 Structural Zones
The Grampians-Stavely structural zone forms the eastern margin of the
Delamarian Fold Belt and underlies the extreme south western corner of the
Corangamite region (Figure 2.4). The basement rocks are interpreted as low-
grade metasedimentary rocks, such as black slates and quartz-rich turbidites
(VandenBerg et al. 2000).
Apart from the south west corner, the western half of the Corangamite region is
underlain by rocks of the Stawell Zone, which is bounded by the Moyston Fault
on the west and the Avoca Fault on the east. The Stawell Zone is interpreted as a
thin-skinned fold and thrust belt composed of Cambrian oceanic volcanics
overlain by Cambro-Ordovician turbidites, which were derived from the
Delamarian Fold Belt. Along the western margin, the Lachlan Fold Belt was
thrust over the Delamarian Fold belt, resulting in a 15 km wide metamorphic
complex in the hanging wall of the Moyston fault. Across the zone the structures
are complex, resulting from major deformation early in the Benambran Orogeny.
The majority of the rocks exposed at the surface are the sandstones and mudstones

Salinity Risk in the Corangamite Region, Australia
Peter Dahlhaus 19
of the St Arnaud Group, comprising thick Cambro-Ordovician turbiditic
sediments which were folded along north-south axes. Post-tectonic intrusion of I-
type granites occurred in the Upper Devonian.
The eastern portion of the Corangamite region lies within the Bendigo Zone,
bounded by the Avoca Fault on the west and the Mount William Fault on the east.
The majority of the Bendigo Zone rocks are turbiditic sediments of the Ordovician
Castlemaine Group, deformed into tight chevron folds by east-west compression.
The main deformation has been interpreted as a thin-skinned fold and thrust belt
formed in the Late Ordovician to Early Silurian, at the commencement of the
Benambran Orogeny. The sandstones and mudstones of the Castlemaine Group
are exposed at the surface in the northern upland area of the Corangamite region.
The Castlemaine Group rocks were intruded by granites during magmatic activity
in the Late Devonian.
Rocks of the Melbourne Zone may form the basement of the Bellarine Peninsula,
but it remains unknown. In the Barrabool Hills, near Geelong, a small outcrop of
metagabbro, the Ceres Gabbro, has been interpreted as an outcrop of the
Neoproterozoic Selwyn Block (Morand 1995). The metagabbro is overlain by
Cretaceous sediments and it is assumed that a similar relationship occurs further
east, under the Bellarine Peninsula (Dr Vincent Morand 2008 pers. comm.).
2.2.1 Geological development of the region
This section provides a brief summary of the geological evolution of the
Corangamite region to provide the context for the spatial distribution of the
surface geology (Figure 2.5), the geomorphology (section 2.3) and the distribution
of the hydrogeology (section 2.6). It has been largely summarised from the latest
edition of The Geology of Victoria (Birch 2003) and those additional references
cited throughout.

Salinity Risk in the Corangamite Region, Australia
Peter Dahlhaus 20
Figure 2.5 Surface geology of the Corangamite region.
Modified from GeoScience Victoria (2008)

Salinity Risk in the Corangamite Region, Australia
Peter Dahlhaus 21
2.2.1.1 Palaeozoic
At the commencement of the Palaeozoic, the majority of the Corangamite region
lay within the ocean basins off the eastern edge of the Australian craton, which
formed part of Gondwanaland. In the Late Cambrian, the Delamarian Orogeny
folded, faulted and regionally metamorphosed the rocks of the Grampians-Stavely
Zone to form the Delamarian Highlands, adjacent to the western boundary of the
Corangamite region. At the same time the Tyennan Orogeny affected the
Neoproterozoic rocks of the Selwyn Block, which now underlies the eastern and
southern parts of the region.
The Delamarian Highlands provided the source for extensive deposition of
sediments from the Late Cambrian to the Upper Ordovician, which covered the
Cambrian thoeleiitic volcanics of the ocean floor. The sediments were deposited
as turbidites in a deep marine environment along the edge of the Australian
(Gondwana) craton. The sediments form a remarkably monotonous sequence of
turbidites which extend across much of the Lachlan Fold Belt. The Cambrian
sediments – the St Arnaud Group – outcrop west of the Avoca Fault, in the
Stawell Zone. The Ordovician sediments – the Castlemaine Group – widely
outcrop in the Bendigo Zone. The distinction between the two groups is on the
basis of fossil (graptolite) content. East of the Avoca Fault, the turbidites are
unfossiliferous, contain Delamarian zircons (Williams et al. 1994), and are
assumed Cambrian in age, whereas west of the Avoca Fault, the turbidites are
similar in character to fossiliferous Ordovician sediments further north (Fergusson
and VandenBerg 2003).
The turbidite sequences comprise quartz-rich sandstone and mudstone with minor
granule conglomerate and black shale. The St Arnaud Group rocks and the base
sequences of the Castlemaine Group generally lack black shale beds, since the
overall sediment transport was from the west. In general, the Castlemaine Group
contains more thick beds, with sandstone dominated facies metres to tens of
metres thick, intercalated with similarly thick mudstone facies.
The turbidite fan sediments were regionally deformed by the Benambran
Orogeny, a relatively long-lived event that began in the Upper Ordovician. The

Salinity Risk in the Corangamite Region, Australia
Peter Dahlhaus 22
evidence for deformation is largely based on field mapping and the dating of
metamorphic mica growth. The orogeny was caused by east-west convergence,
between the Selwyn Block to the east and the margin of the Delamarian Fold Belt
to the west. The east-dipping Moyston fault formed along the western edge of the
Stawell Zone as the Cambrian ocean-floor volcanics and turbidites were thrust
over the Delamarian margin. Further east, thin-skinned tectonic deformation
produced major listric faults, the most significant of which - the Avoca Fault –
separates the Stawell Zone from the Bendigo Zone. The Avoca Fault Zone is a
west-dipping thrust which brought slivers of the Cambrian sea floor volcanics to
the surface. Away from these major faults, large upright folds developed,
disrupted by reverse faults with throws of hundreds of metres (Taylor et al. 1996).
The majority of the deformation in the Corangamite region (Stawell and Bendigo
Zones) had probably occurred by the Mid Silurian, resulting in substantial
shortening and thickening of the turbidite sediments through thrusting, folding,
cleavage development and faulting. The deformation was also responsible for the
injection of quartz veins (hydrothermal emplacement) mostly into the spaces
created by the faulting and folding. Some mineralisation accompanied the quartz
emplacement, including gold, sulphides and carbonates.
By the end of the Silurian, the rocks had been accreted to the edge of the
Australian (Gondwana) craton. The regional metamorphism is generally low
grade (greenschist facies or lower), except in a 15km wide zone along the western
edge of the Stawell Zone, where the higher grades occur in the hanging wall of the
Moyston Fault. During the Early Devonian, intrusion of post-tectonic granites
occurred in the Stawell and Bendigo Zones, although outside of the Corangamite
region. The thermal history of these intrusions suggests that several kilometres
had already been eroded off the regionally deformed and uplifted Cambro-
Ordovician turbidites by the time of their emplacement.
The next significant event recorded in the Palaeozoic rocks of the region is the
Mid Devonian Tabberabberan Orogeny, which had little effect on the rocks of
western Victoria. The orogeny reactivated Benambran faults, generated some
new brittle fault structures and produced some kinking and cleavage formation in
the eastern edge of the Bendigo Zone. Following the Tabberabberan Orogeny,
Salinity Risk in the Corangamite Region, Australia
Peter Dahlhaus 23
Late Devonian post-tectonic granitic magmas intrusions were emplaced across the
Stawell and Bendigo Zones. These intrusions mark the last tectonic events of the
Palaeozoic and cut across all the regionally developed structural fabrics and
mineralised faults.
A long period of tectonic stability existed throughout the late Palaeozoic and early
Mesozoic. By the Late Carboniferous and Early Permian this part of Gondwana
lay close to the South Pole and was subjected to glaciation. Remnants of glacial,
glaciofluvial, glaciomarine and shallow marine sediments have been preserved in
down faulted blocks adjacent to the north east boundary of the Corangamite
region (O'Brien et al. 2003).
2.2.1.2 Mesozoic
During the early Mesozoic, western Victoria was subjected to extensive
denudation, recognised as the Mesozoic palaeosurface. Northwest of the
Corangamite region, remnants of the Mesozoic palaeosurface form plateaus
(Mount Cole, Mount Lonarch and Mount Avoca) close to the roof level of some
of the Late Devonian granites, which suggests that erosion stripped at least two
kilometres from the surface (Cayley and McDonald 1995).
The commencement of the Australian – Antarctica split in the final Gondwana
break-up was marked in western Victoria by a mafic dyke swarm. Ultramafic
(Lamprophyre) dykes were intruded during the Late Jurassic, including one near
the Moorabool River at Meredith with a K-Ar age of 167±8 Ma (McKenzie et al.
1984; Duddy 2003). The dykes are related to crustal tension which developed a
series of half-grabens separated by Palaeozoic basement highs in the southern
portion of the Corangamite region. The majority of these east to north-east
trending half-grabens are bounded by north-dipping normal faults on their
southern margins and numerous minor south-dipping faults on their northern
margins. However, east of Port Campbell, the fault polarity changes and is
attributed to the influence of the pre-rift structures of the Palaeozoic basement (the
Moyston fault?) (Edwards et al. 1996).
The Mid Cretaceous subsidence of the rift was accompanied by kilometre-scale
uplift of the Palaeozoic rocks in the north of the region, creating rapid erosion and

Salinity Risk in the Corangamite Region, Australia
Peter Dahlhaus 24
incision (Duddy 2003). Large debris fans formed at the base of the Palaeozoic
slopes (Edwards et al. 1996). The rejuvenated drainage deeply dissected the
Mesozoic palaeosurface and a drainage divide, which is a precursor to the present
Great Dividing Range, developed parallel to the present coast (Taylor et al. 1996;
Holdgate et al. 2006).
Following a minor depositional break in the Early Cretaceous, subsidence and
sedimentation resumed in the south of the Corangamite region, although the major
transport direction was now from the east. Large high-energy braided river
systems deposited a massive volume of volcanolithic sediments, derived from
large volcanoes to the east of Victoria (Edwards et al. 1996; Duddy 2003). These
thick sediments of the Lower Cretaceous are exposed as the Otway Group
sandstones and mudstones which form the present day southern upland areas of
the Corangamite region.
As the sea-floor spreading developed, oceanic crust had developed by the Late
Cretaceous and a narrow sea formed which cut the supply of volcanolithic
sediment. Significant uplift of the Otway Ranges occurred at the start of the Late
Cretaceous prior to the first marine incursion and deposition of the Sherbrook
Group sediments within the Early Cretaceous troughs (Duddy 2003). The reduced
sediment supply was mainly from the rejuvenated erosion of the Palaeozoic
highlands to the north, and three major depositional basins – the Gippsland, Bass
and Otway Basins – developed as subsidence occurred in discrete regions
(Edwards et al. 1996).
The depositional environments of the Late Cretaceous Sherbrook Group
sediments in the Otway Basin suggest that the marine transgression commenced
in the west with littoral, deltaic and tidal environments giving way to shallow
estuaries and marginal marine environments. The marine transgression was at its
peak by 85 Ma, when deep marine environments persisted. A rapid marine
regression followed, during which extensive deposition of fine-grained deltaic
sediments was recorded, which progressively gives way to fluvial sediments as
the delta prograded into the basin. This phase of deposition was terminated by
widespread uplift at about 65 Ma (Edwards et al. 1996).

Salinity Risk in the Corangamite Region, Australia
Peter Dahlhaus 25
2.2.1.3 Cainozoic
By the early Tertiary the renewed erosion of the Mesozoic palaeosurface in the
north of the Corangamite region had created broad valleys of scree, outwash and
braided river deposits between meridional ridges of Palaeozoic bedrock. The
elevation and position of the remnant gravels suggests that the Mesozoic
palaeosurface had been dissected to depths of 500 to 700 m by the early Tertiary,
creating a topography which persisted in its general form throughout the Tertiary
(Taylor et al. 1996; Holdgate et al. 2006).
In the Otway Basin, extensional faulting continued as the continent moved north
and major subsidence and marine transgression deposited a series of sediments –
the Wangerrip Group – in the Port Campbell Embayment and Colac Trough
(Holdgate and Gallagher 2003). Initially, a gently undulating, seaward sloping
plain which had had formed by the early Tertiary was covered by sediment
brought down by rivers from the north. These deposits of fluvial gravels were
reworked along the coast to form coastal sands. As the marine transgression
proceeded, marginal marine and then deep water sediments followed (Edwards et
al. 1996).
By the Early Eocene large deltaic sedimentary systems had developed in places,
depositing sands and gravels from the north. As the delta prograded, the
environments of deposition changed from shallow marine to littoral to back beach
lagoonal. Elsewhere non-marine fluvial environments dominated the upper delta
plain and floodplains of the river systems. The deposition of the Wangerrip
Group ceased with regional uplift at the commencement of the Middle Eocene
(Holdgate and Gallagher 2003).
As the rate of sea-floor spreading increased, a wide seaway formed between
Australia and Antarctica, creating open marine depositional environments. The
middle Eocene to early Oligocene was a time of major global climate change and
significant turnovers in marine and terrestrial biota. The change is attributed to
the development of the circum-Antarctic current, which resulted in the formation
of significant ice sheets on the Antarctic continent (Berggren and Prothero 1992).
In particular, the opening of the Drake Passage at about 30 Ma and the closure of

Salinity Risk in the Corangamite Region, Australia
Peter Dahlhaus 26
the equatorial ocean currents by the approach of India to Eurasia created a
massive drop in global temperatures in the early Oligocene (Williams et al. 1993).
In the north of the Corangamite region, the onset of drier conditions reduced
streamflows, resulting in smaller streams following the broad valleys dissecting
the Mesozoic palaeosurface. Dendritic drainage patterns developed and the
streams gradually incised the deposits of coarser gravels deposited in the earlier,
higher energy environments, to expose the highly weathered bedrock. By the late
Oligocene these valleys in weathered Palaeozoic rocks had been well developed
(Taylor et al. 1996).
Further south in the subsiding Otway Basin, deposition recommenced to form the
Nirranda Group sediments. Around the basinal margins, erosion of the uplifted
Wangerrip Group provided a sediment source for beach, estuarine and lagoonal
sediments, whereas further south, open water marine carbonate sediments were
laid down. A marine regression in the mid-Oligocene halted the Nirranda Group
deposition (Holdgate and Gallagher 2003).
The late Oligocene and early Miocene is marked by a major marine transgression,
which resulted in significant changes to the deposition regimes throughout the
Corangamite region. As the stream base level rose, alluvial sediment began to fill
the valleys of the dissected northern highlands, forming 'deep lead' channels. In
the Otway Basin, the terrestrial sediment source lessened and biological sediment
(carbonates) predominate. Initial carbonate sedimentation occurred in high-
energy shallow marine conditions, but by the early Miocene, deep water
continental shelf conditions had formed (Holdgate and Gallagher 2003). The
marine sediments truncate the deep leads to the north, as the invading sea
dispersed the former drainage channels (Taylor et al. 1996). By the mid to late
Miocene the depositional environment had changed to intermediate depths as a
marine regression was underway, and limestone was deposited in the southern
part of the Otway basin within the Corangamite region.
The Late Miocene regression coincided with a change in tectonic stress for the
Australian Plate, as it collided with the Pacific Plate (Edwards et al. 1996). In the
Otway Basin, extensional faulting ceased as the north-south tensional system was

Salinity Risk in the Corangamite Region, Australia
Peter Dahlhaus 27
replaced by compressional forces along a northwest - southeast axis. The
compressional tectonics formed broad folds in the Otway Group, reactivated older
faults and activated new ones. The Otway Ranges began uplift, as the some of the
north dipping normal faults became south dipping reverse faults. The majority of
the Miocene structures trend northeast, perpendicular to the axis of compression
(Edwards et al. 1996).
By the early Pliocene, the Otway Ranges had reached their current elevation and
the majority of the Corangamite region was subjected to aerial erosion (Joyce et
al. 2003). Thin fluvial outwash from the northern uplands, the emerging Otway
Ranges and surrounding sediments covered the western parts of the Corangamite
region with a veneer of sands. A marine transgression, commencing in the
southeast, formed shallow seas which eventually covered much of the region
during the Pliocene (Wallace et al. 2005). In the valleys of the northern
highlands, sands and gravels were locally deposited in response to the changes in
stream base level.
Contemporaneous with the marine transgression was the commencement of
volcanism (Price et al. 2003). Initially sporadic, the lava flows filled the base of
the valleys in the northern dissected uplands. Compressional activity continued,
gently warping the emergent coastal plain.
As the Pliocene sea retreated a relatively thin but aerially extensive deposit of
sandy sediment covered most of the central and southern Corangamite region.
Uplift is associated with the extensive volcanism which had commenced in
earnest by 2 Ma (Price et al. 2003). Up to 150 m of uplift in the northern part of
the Corangamite region had preserved the littoral deposits of the Pliocene marine
regression from being covered by the volcanic lavas (Carey and Hughes 2002).
The lava filled many of the deeply dissected valleys to the north and extensively
covered the Pliocene sediments to the south. Disruption to the drainage systems
forced the drainage divide further north to its present position and formed large
lakes on the plains.
By the Pleistocene the exposed fluvial and marine sands had been extensively
ferruginised and silicified, and karstic features developed in the limestone in the

Salinity Risk in the Corangamite Region, Australia
Peter Dahlhaus 28
south of the region. The locally raised base levels and temporal blockages to
streamflow caused by the volcanism resulted in localised deposition of lacustrine
and alluvial sediments along the drainage lines. Climatic fluctuations of the
Pleistocene and Holocene formed extensive lunettes on the eastern shores of the
lakes (Edwards et al. 1996). Fluctuations in sea level created stranded and
submerged coastal features (Holdgate et al. 2001; Joyce et al. 2003).
2.2.2 Geological data sources
The sources of geological data used in this thesis are generally those supplied by
GeoScience Victoria (Department of Primary Industries, Victoria) as their
regularly updated Geoscientific Data Packages available in GIS-ready format.
Additional resources utilised include GeoScience Victoria's Geophysical Data
Packages, Open File Mineral Tenement Data Packages, Geological reports and
maps, and the on-line GeoVic website.
Compilations of geophysical data were specifically commissioned for this
research to assist in the interpretation of the regional geology. These included the
most recent Bouger gravity surveys, airborne magnetic surveys and airborne
radiometric surveys. The integration of the individual geophysical surveys was
undertaken by Linderman Geophysics Pty Ltd and supplied as georeferenced
images and grids for the entire Corangamite region (Appendix B).
2.3 Geomorphology
The geomorphology of the Corangamite region reflects the geological history and
subsequent landscape evolution and is therefore a factor in the occurrence and
distribution of salinity. The brief overview in this section provides the regional
context for the more detailed descriptions in later chapters.
The geomorphological framework of Victoria has its origins in the work of
Murray (1887) and Gregory (1903) who used morphology as the main landscape
factor (Jenkin 1989). The seminal geomorphology framework of Hills (1940)
included the influence of structural geology and later work by Jenkin (1982)
emphasised the importance of landscape processes. The availability of high-
resolution terrain models, remote sensing technology (including geophysical

Salinity Risk in the Corangamite Region, Australia
Peter Dahlhaus 29
techniques) and regolith maps (including soil series mapping) have provided
additional insights to the geomorphology of the region in recent years (Joyce et al.
2003).
As a result, the geomorphological framework for the state has been recently
reviewed by the Geomorphology Reference Group of Victoria (of which this
author is a member) and a revised version was published in 2007 (DPI 2007).
This revised hierarchical framework based on a tiered system has been adopted by
the Victorian Government as the basis of soil and land management units and is
the one used in this thesis (Figure 2.6).
2.3.1 Western Uplands
The Victorian Western Uplands form the northern highlands of the Corangamite
region. In general, the landscapes of the Palaeozoic sedimentary rocks (unit 2.1.2)
are characterised by undulating low hills dissected by a dendritic drainage pattern
that forms the upper catchments of the Moorabool River, Leigh River, and Woady
Yaloak River drainage systems. The primary drainage trends follow the strike of
the bedrock strata and the directions of the secondary drainage systems are
controlled by geological boundaries (i.e. lithological boundaries) and rock
structures (i.e. faults, joints).
The larger landscape elements are remnants of the Mesozoic palaeosurface, which
was deeply weathered during the Palaeogene and largely terminated by uplift in
the late Eocene (Carey and Hughes 2002). At Ballarat, the weathering extends up
to 100 m below the surface, with secondary mineral development (e.g. kaolin
clay) producing the typical bleached and pallid regolith profiles in the Palaeozoic
rocks. The oxidation of iron-rich groundwaters has precipitated iron cement into
joints and the upper regolith materials.
The Palaeozoic granites (unit 2.1.4) generally form subdued landforms. In some
areas the metamorphic aureoles around the granites are resistant to weathering and
form prominent wooded to cleared ridges, such as the northern boundary along
the Glenelg Highway.

Salinity Risk in the Corangamite Region, Australia
Peter Dahlhaus 30
(Source: DPI 2007)
Figure 2.6 Geomorphic Units of the Corangamite region.

Salinity Risk in the Corangamite Region, Australia
Peter Dahlhaus 31
(Source: DPI 2007)
Palaeogene and Neogene gravels and sands are the erosional remnants of
extensive sheets of fluvial and regressive marine sediments that once covered
much of the Western Uplands (unit 2.1.5). The coarser-grained Palaeogene
fluvial sediments form a quartz-pebble conglomerate, often ferruginised and
sometimes silicified. Thickness varies from a few metres to a maximum of 30 m.
Landforms include isolated flat-topped mesas overlying Palaeozoic rocks, break-
of-slope deposits between overlying basalts and underlying Palaeozoic rock, and
broad tablelands fringing the overlying basalt. Neogene sands (regressive marine)
generally fringe the Western Uplands as a dissected tableland and are often
ferruginised (ferricrete) and silicified (silcrete).
The recently formed volcanic landscapes in the Western Uplands (unit 2.1.6)
contrast with the older landscapes as the basalts of the Newer Volcanics fill many
of the large ancient valleys. Elongate basalt plains are usually fringed by streams
of the displaced drainage, although occasional basalt gorges have developed
where streams have cut into the basalt flows. The eruption points form prominent
scoria cones, lava cones, composite scoria/lava cones, lava discs and the rare maar
(Rosengren 1994).
Regolith and soils development is directly related to the underlying geology and
subsequent landform evolution (Robinson et al. 2003). In areas where they have
been undisturbed, the Palaeozoic sedimentary rocks generally have gradational to
strongly duplex soils, often with well developed, bleached A2 horizons. However,
the land-use change over the past 150 years has stripped the profile over large
areas, particularly where intensive shallow gold mining has disturbed the original
profile. The regolith on the granites varies from deep (>40 m) saprolite to surface
tors. Soils have generally developed profiles varying from uniform or weakly
gradational sands to strongly duplex ferruginised podsolic soils. The soils on both
the sedimentary rocks and the granites are regarded as agriculturally ‗poor‘
compared to the soils of the Newer Volcanics, which exhibit gradational clayey
soils (kraznozems) on the younger rocks to coarsely structured duplex soils on the
older rocks.

Salinity Risk in the Corangamite Region, Australia
Peter Dahlhaus 32
2.3.2 Southern Uplands
The southern portion of the Corangamite region is dominated by the Victorian
Southern Uplands, which form the deeply dissected Otway Ranges, moderately
dissected Barrabool Hills and low hills of the Bellarine Peninsula. All three
landscapes have formed by the uplift of a structurally controlled block of lithic
sedimentary rocks of the Lower Cretaceous Otway Group.
Significant uplift of the Otway Ranges has occurred in the recent geological past
along two reverse faults: the westerly dipping Torquay Fault to the east and the
easterly dipping Bambra Fault to the west (Sandiford 2003). The continued uplift
of the Otway block is partially responsible for the incision of steep river valleys.
The broad plateaux at the crest of the ranges (unit 3.1.1) forms a drainage divide
which trends north east to Mount Chapple (550 m), then easterly to Mount Sabine
(583 m), and northeast to parallel the coast through the highest point at Mount
Cowley (686 m) towards Anglesea.
On both sides of the divide rugged topography has developed comprising ridges
and spurs separated by deeply dissected steep valleys (unit 3.1.2). The drainage is
strongly controlled by the geological structure. Parallel to the south east coast, the
drainage is generally south east and north west, whereas west of Mount Sabine,
the drainage is generally north and south. The depth of dissection is less along the
ridge, while the south eastern flanks of the ranges have developed the steepest
topography, probably in response to the Quaternary sea level fluctuations,
changing the base level of the rivers and streams that drain the landscapes. The
coastline has been eroded within the past 6000 years, and the recession has been
estimated as 105 m on mudstones and 53 m on sandstones along the Otway coast
(Bird 2000).
North of the Bambra Fault, the landscapes comprise more gently undulating hills
formed on Cainozoic sedimentary rocks (units 3.2.2 & 3.3.2) that have not
experienced the same tectonic uplift as the Otway Ranges. The wide flood plain
of the Barwon River (unit 3.3.4) is associated with the damming of the river by
Newer Volcanic basalt flows to the north (unit 6.1.4).

Salinity Risk in the Corangamite Region, Australia
Peter Dahlhaus 33
The Barrabool Hills and Bellarine Peninsula are smaller fault-bounded uplift
blocks of the Otway Group rocks. These blocks are at lower elevations than the
Otway Ranges and are generally more planar and less deeply dissected. The
Barrabool Hills (unit 3.2.2) block is tilted, with more uplift along the northern
edge (Barrabool Fault) resulting in deeper dissection by tributaries of the Barwon
River on the north and east of the block. The Bellarine Peninsula (unit 3.3.1) has
more variety in rock type with basalts of the Older Volcanics (unit 3.3.3) and
Pliocene marine sands more prevalent than the Otway Group.
The lithologies of the Southern Uplands rocks vary considerably, resulting in a
diversity of regolith and soil profiles. The volcanoclastic Otway Group rocks
west of Cape Otway and in the Barrabool Hills are highly fractured and bleached
compared to the rock exposed in comparable landscape positions east of Cape
Otway. Soils vary from shallow stony loams in the steep and actively eroding
parts of the landscapes to brown and yellow gradational soils and colluvium on
the slopes. Thick deposits of colluvium and landslide debris are common. In the
foothills and on the Bellarine Peninsula, soil profiles vary considerably. As a
generalisation, weakly structured sandy gradational soils are more common on the
Palaeogene sedimentary rocks, and coarse structured duplex soils are more
common the Neogene and Quaternary sedimentary rocks (Robinson et al. 2003).
2.3.3 Western Plains
The central Corangamite region lies within the Victorian Western Plains,
comprising undulating plains formed on both volcanic and sedimentary rocks.
The landscapes of this geomorphic unit are formed on some of the youngest rocks
of the Corangamite region (Gray and McDougall 2009).
The volcanic plains were built up by sporadic volcanic eruptions over a period of
about 4.6 Ma (Price et al. 2003; Gray and McDougall 2009). The eruptions
resulted in lobes of lava flowing from the eruption points, which overlap to form a
variable thickness of basalt, interleaved with sporadic pyroclastic deposits of
scoria and tuff. At times, lengthy breaks between eruptions allowed soils to form
on the upper surface of the basalt which was subsequently covered by later
eruptions, forming buried palaeosol horizons.

Salinity Risk in the Corangamite Region, Australia
Peter Dahlhaus 34
The volcanic eruptions often resulted in blocking the drainage systems (Joyce et
al. 2003) and the palaeogeography of the rivers has been well documented
(Hunter 1909; Rosengren 1973; Coulson 1977; Canavan 1988; Bishop and Li
1997; Cunningham 1998; Hughes and Carey 2002; Taylor and Gentle 2002;
Evans 2006; Holdgate et al. 2006). Drainage across the volcanic plains is
generally poorly developed. The uplift of the Otway Ranges and the disruption of
drainage by the volcanic eruptions resulted in the formation of a shallow basin in
the central Corangamite region, where the majority of lakes, including Lake
Corangamite, are situated. The fluctuating lake levels related to the climate
changes during the Pleistocene resulted in lunette formation, especially prominent
in the area north of Colac and south of Cressy (Edwards et al. 1996).
Eruption points vary in form (scoria cones, lava cones, composite scoria/lava
cones, lava discs, maars) and have been documented by Rosengren (1994). The
stony rises (unit 6.1.2) represent the lava flows associated with the most recent
volcanic activity, the most prominent of which forms the platform from which the
Mount Porndon scoria cones rise. This feature has been dated as 59 ka, placing it
among the youngest landforms in Australia (Stone et al. 1997).
The sedimentary plains (units 6.2.2, 6.2.4, & 6.2.5) mainly comprise the sands
deposited by the retreating Pliocene sea and the exposed underlying Neogene
marls and limestone. In the Heytesbury region the drainage has been strongly
influenced by the deposition of strand lines from the retreating sea, forming
parallel arcuate tributaries perpendicular to rivers draining southwest. The deep
dissection has resulted in numerous landslides in the marl, many of which remain
active (Dahlhaus et al. 1996). Remnants of the undissected plain are preserved
along ridge lines and further north to Colac. Along the coast near Port Campbell,
the limestone plain has developed many karstic features, particularly sinkholes.
Spectacular cliffs and rock stacks formed by the rising sea levels since the last
glacial mark the edge of the plain at the Southern Ocean.
Soils on the Western Plains reflect the underlying lithology and age of the rocks.
The youngest landscapes – the stony rises – have very thin skeletal soils, whereas
the older landscapes on basalts have developed clay-rich soils varying from
gradational kraznozems to coarsely duplex profiles. The finely brown gradational

Salinity Risk in the Corangamite Region, Australia
Peter Dahlhaus 35
soils developed on the scoria cones represent some of the most valuable
agricultural country. The soils developed on the Pliocene sand plains are often
sandy, sometimes ferruginised or podsolic soils. Further south on the marls and
limestones, the soil profiles vary from clay-rich gradational to strongly duplex,
generally comprising heavy clays.
2.3.4 Geomorphic data sources
2.3.4.1 Geomorphology and soil landform units
The geomorphic framework and soil-landform units for the Corangamite region
were published in 2003 (Robinson et al. 2003) and included the delineation of
geomorphic units and descriptions contributed by this author through this project.
The geomorphic and soil-landform mapping, known as the Corangamite Land
Resource Assessment (LRA), provides detailed descriptions of 18 geomorphic
units to the third-tier and 204 soil-landform units (de facto forth-tier units). The
units are available as GIS layers and the final LRA is appended in electronic form
(Appendix B).
2.4 Climate
Climate, especially rainfall and evapotranspiration, impacts on the hydrologic
budget and therefore groundwater and salinity processes (e.g. Cartwright and
Simmons 2008).
Being situated between 37.4o and 38.9
o South latitude, the Corangamite region
experiences a Temperate climate with dominant westerly winds, variable cloud,
moderate precipitation and cool temperatures (Linacre and Hobbs 1977). The
majority of rain falls in winter and spring, with August as the wettest month
across the region. The Bureau of Meteorology (BoM 2009a) records
Weeaproinah at the crest of the Otway Range with the highest mean annual
rainfall (1930.1 mm for the period from 1901 to 2009); and Avalon Airport on the
northern side of Corio Bay with the region‘s lowest mean annual rainfall
(448.4 mm for the period from 1965 to 2009). Rainfall across the region is
closely related to elevation and latitude (Figure 2.7). Based on the rainfall model
(refer to section 2.4.1.1 for details), average annual rainfall (1921 - 1995) varies

Salinity Risk in the Corangamite Region, Australia
Peter Dahlhaus 36
from 469 mm in the low elevation plains west of Geelong to 1892 mm along the
ridge of the Otway Range.
Figure 2.7 Modelled average annual rainfall for the Corangamite region
Evaporation across the region is also closely related to altitude and latitude (solar
radiation) (Figure 2.8). Only four Bureau of Meteorology evaporation stations
(i.e. pan evaporation) are situated in the Corangamite region.
Figure 2.8 Modelled average annual pan evaporation for the Corangamite
region

Salinity Risk in the Corangamite Region, Australia
Peter Dahlhaus 37
2.4.1 Climate data sources
The Bureau of Meteorology SILO is the main source of climatic data for specific
site studies (BoM 2009e), in particular: Patched Point Datasets, which use the
original measurements of a meteorological station with interpolated data to fill
missing values; and Data Drill which is uses splining and kriging interpolation to
derive a dataset for any location in the region.
2.4.1.1 Climate surfaces
For the purpose of this research, sixteen climate variables (Table 2.1) have been
modelled for the Corangamite region using ANUCLIM (v1.8), a software package
containing a suite of programs that enable the user to obtain estimates of mean
monthly climate variables, bioclimatic parameters, and indices relating to crop
growth. The modelling software was developed at the Centre for Resource and
Environmental Studies (CRES) at the Australian National University (ANU),
Canberra (Houlder et al. 2000).
The climate surface coefficients are contained within the program and have been
generated using the ANUSPLIN technique of thin-plate smoothing splines used
for the spatial interpolation of meteorological variables from irregular networks
(Hutchinson 1998aa; 1998bb). The input data are long-term monthly averages of
the climate variables from selected Bureau of Meteorology and other stations.
Most climatic surfaces were constructed using data recorded in the 1920 to 1995
period, with short-term data regressed against long-term data to determine the 75
year means.
The modelling of the climate surfaces for the Corangamite region utilised
ESOCLIM, a program for EStimation Of CLIMate by calculation of the monthly
mean climate surfaces on a regular grid. The individual grids of climate variables
contain data modelled on square 300 m grid cells (model has 576 x 529 cells) and
the methods are detailed further in Appendix B. The climatic variable surfaces
have a horizontal positional accuracy of 100 m and a vertical positional accuracy
of 10 m (Houlder et al. 2000).

Salinity Risk in the Corangamite Region, Australia
Peter Dahlhaus 38
Table 2.1 Climate variables modelled for the Corangamite region
Variable units data source period
Rainfall mm 2161 stations Jan 1921 - Dec 1995
Rain days number of days rain >
0.1mm 2161 stations Jan 1921 - Dec 1995
Pan evaporation mm 287 stations 1920 - 1995
Maximum temperature oC 1123 stations 1920 - 1995
Minimum temperature oC 1119 stations 1920 - 1995
Dry-bulb temperature at 9am oC
not known
Wet-bulb temperature at 9am oC
Dew-point temperature at 9am oC
Dry-bulb temperature at 3pm oC
Wet-bulb temperature at 3pm oC
Dew-point temperature at 3pm oC
Solar radiation MJ/m2/d
modelled from time, geographic
latitude, and altitude Solar radiation related to cloud
cover MJ/m
2/d
Wind speed 9am m/s
modelled from time, geographic
latitude, distance from coast. Wind speed 3pm m/s
Wind run km
2.5 Vegetation and land use
Current government policies (CoAG 2000; DNRE 2000) and previous studies
(Ghassemi et al. 1995) consider changes to native vegetation through historical
and present land uses a major factor in the onset of salinity in Australia. This
section provides a brief overview of the vegetation, land-uses, and their history of
change in the Corangamite region to provide a context for some of the research
and discussion in the following chapters of the thesis.
2.5.1 Vegetation
As expected in a large region with varied geology and climate, there is a broad
range of vegetation types in the Corangamite region. As a generalisation, before
the widespread clearing associated with agricultural settlement and mining over
150 years ago, the native vegetation of the Central Highlands generally comprised
dry sclerophyll forests and grassy woodlands; the Western Plains were largely
grasslands and grassy woodlands; the Coastal Plains were mainly scrublands and
Salinity Risk in the Corangamite Region, Australia
Peter Dahlhaus 39
grassy woodlands; and the Otway Ranges were dense temperate rainforest and
wet sclerophyll forests (CCMA 2003; 2005).
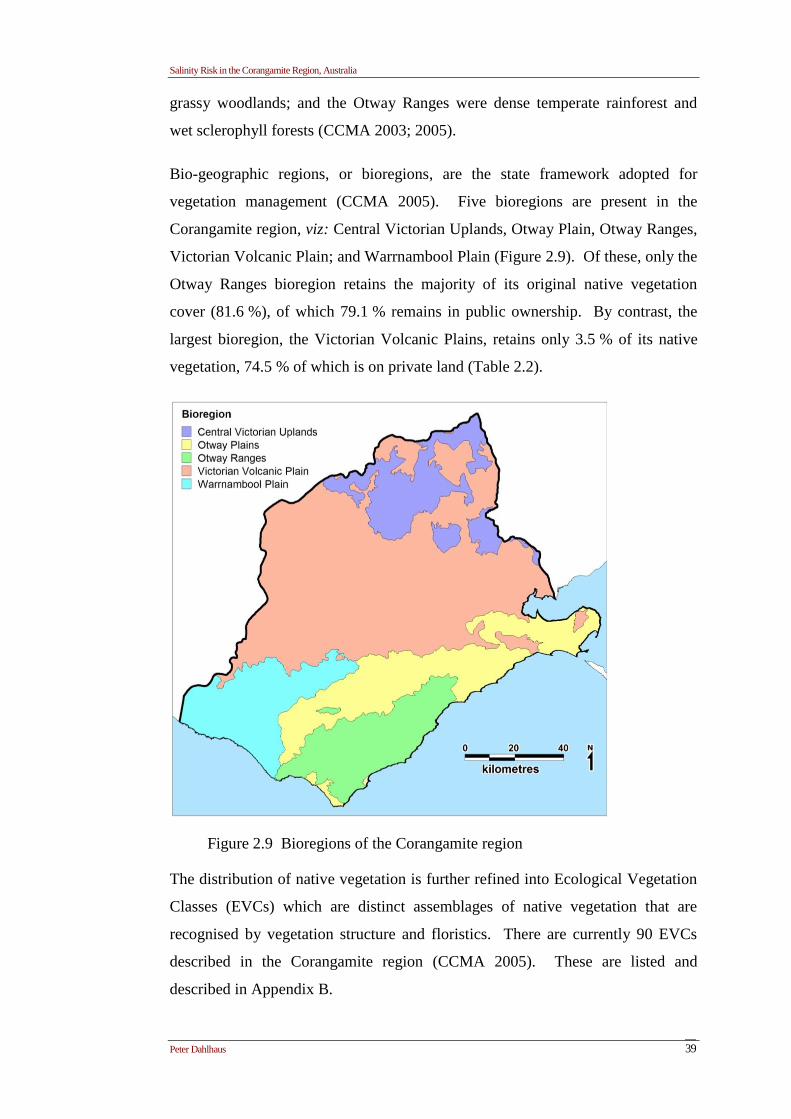
Bio-geographic regions, or bioregions, are the state framework adopted for
vegetation management (CCMA 2005). Five bioregions are present in the
Corangamite region, viz: Central Victorian Uplands, Otway Plain, Otway Ranges,
Victorian Volcanic Plain; and Warrnambool Plain (Figure 2.9). Of these, only the
Otway Ranges bioregion retains the majority of its original native vegetation
cover (81.6 %), of which 79.1 % remains in public ownership. By contrast, the
largest bioregion, the Victorian Volcanic Plains, retains only 3.5 % of its native
vegetation, 74.5 % of which is on private land (Table 2.2).
Figure 2.9 Bioregions of the Corangamite region
The distribution of native vegetation is further refined into Ecological Vegetation
Classes (EVCs) which are distinct assemblages of native vegetation that are
recognised by vegetation structure and floristics. There are currently 90 EVCs
described in the Corangamite region (CCMA 2005). These are listed and
described in Appendix B.

Salinity Risk in the Corangamite Region, Australia
Peter Dahlhaus 40
Table 2.2 Extent of native vegetation within the Corangamite region (2002)
Bioregion Total (including water
bodies)
Remnant vegetation
cleared
Remnant vegetation
remaining
Central Victorian
Uplands 145,694 ha
89,303 ha
(61.4 %)
56,045 ha
(38.6 %)
Otway Plain 222,117 ha 148,915 ha
(67.5 %)
71,745 ha
(32.5 %)
Otway Range 150,067 ha 27,597 ha
(18.4 %)
122,306 ha
(81.6 %)
Victorian Volcanic
Plain 665,062 ha
594,361 ha
(96.5 %)
21,355 ha
(3.5 %)
Warrnambool Plain 150,949 ha 126,993 ha
(84.1 %)
24,009 ha
(15.9 %)
Total 1,333,881 ha 987,169 ha
(77.0 %)
295,460 ha
(23.0 %)
(Source: CCMA 2005)
2.5.2 Land use
In terms of area, the dominant land uses are livestock grazing, dryland agriculture,
forestry and dairying (Figure 2.10; Table 2.3).
(source: modified from DSE 2003)
Figure 2.10 Land use in the Corangamite region (2003)

Salinity Risk in the Corangamite Region, Australia
Peter Dahlhaus 41
Table 2.3 Land use within the Corangamite region (2003)
Land use Area (ha) % of total
Grazing 637,484 49.26
Dairy 170,840 13.20
Forestry 165,594 12.80
Conservation 156,154 12.07
Cropping 94,386 7.29
Urban 26,966 2.08
Peri-urban 21,308 1.65
Infrastructure 6,831 0.53
Mining 5,839 0.45
Horticulture 5,058 0.39
Water supply 2,907 0.22
Animal production 647 0.05
Total 1,294,014 100.00
(source: modified from DSE 2003)
Since the data tabulated above was collected (2003) there has been a significant
shift from grazing to cropping across the Western Plains, due to the drier climate
and increased commodity prices in recent years (ABS 2009c). In a report released
in May 2009, the Australian Bureau of Statistics (ABS) records 3,306 agricultural
businesses covering 976,000 ha of the Corangamite region. Of the land used in
agriculture, 75.7 % is grazed and 18.3 % used in cropping (ABS 2009c). Of the
61.3 % of agricultural businesses who made land use changes in the past 5 years,
9.3 % undertook activities to manage salinity.
2.5.3 History of land use change
Humans have inhabited the Corangamite region for at least 35,000 years
(Mulvaney and Kamminga 1999) although little is known of the early inhabitants.
The ethno-historical observations at the turn of the 19th
Century suggest that the
region's landscapes supported an indigenous population - the Wathaurong,
Gulidjan, Gadubanud, Djargurdwurung and Giraiwurung Aboriginal language
communities - estimated to be between 2500 and 4000 persons (Clark 1990;
Horton 2000). The grassy plains, rivers and wetlands provided an ample supply
and variety of food. In particular, shellfish were gathered from the coast, fish and
eels were hunted and trapped in significant quantities in the rivers, lakes and

Salinity Risk in the Corangamite Region, Australia
Peter Dahlhaus 42
estuaries, land mammals and reptiles were hunted on the plains and birds
(especially water birds) were taken from the lakes and estuaries (Marshall and
Webb 1997; Flannery 2002). The Aboriginal communities used fire as a
vegetation management tool, promoting fresh growth and maintaining open plains
and woodlands in some areas to encourage grazing animals for hunting (CCMA
2005).
Explorers of European origins had mapped the Corangamite coast by the early
19th
century (Fleming 1802; Flinders 1814). The first pastoral settlers ventured
westward from Geelong and Melbourne in 1835 (Rusden 1872), and by 1837 the
Learmonth brothers had explored the upper Moorabool and Leigh rivers (Bride
1898) and in the same year McLeod ‗discovered‘ Lake Corangamite (Hebb 1888).
By 1841 almost all of the available grazing land on the volcanic plains was
occupied by squatters (Bride 1898). The observations and experiences of the
early settlers are important in establishing the extent and rate of land-use change
and the implications for salinity. The significance of these accounts is discussed
further in Chapter 3.
The discovery of gold at Buninyong and Ballarat in 1851 had a significant impact
on settlement and land-use in the northern area of the Corangamite region.
Thousands of immigrants flocked to the region and the native vegetation was
rapidly cleared for mining, agriculture and timber supply (Langtree 1887; Withers
1887). Forests on the basalt plains around Ballarat gave way to grazing and
cropping, as potatoes, wheat, oats and vegetables were produced and dairy herds
established (Nathan 2004).
The cessation of the gold mining towards the end of the 19th
century brought a
demand for closer land settlement. A series of Land Acts throughout the 1860s
changed the distribution of land holdings and the land-use throughout the region
(Powell 1970). Clearing of native vegetation was accelerated as the holdings
decreased in size, and in some areas, clearing of the native vegetation was a
required condition for agricultural settlement (CCMA 2005). The Closer
Settlement and Soldier Settlement Schemes were implemented during the first
half of the 20th
century, further decreasing the size of land holdings (Nathan
2000). The last of the large-scale land use changes in the Corangamite region was

Salinity Risk in the Corangamite Region, Australia
Peter Dahlhaus 43
the Heytesbury Settlement Scheme, when approximately 40,000 hectares of
“unproductive bush” was cleared for agriculture during the period from 1952 to
1971 (Fisher 1997). This region now supports a significant dairying industry
(Figure 2.10).
Following the 2nd
World War (1939-1945), migration schemes and the
mechanisation of agriculture has expanded the populations of the urban centres.
During the past 30 years the major provincial cities of Ballarat and Geelong have
continued to expand (Figure 2.11) (ABS 2009a). As the population of the
Corangamite region rose 20 % from 282,575 to 339,015 between 1986 and 2006,
the peri-urban region has expanded (Mendham and Curtis 2007). Population
growth has been highest in the transport corridors between the major urban
centres and along the coast. Around the cities the size of holdings has steadily
reduced with a growing population acquiring parcels of land at the urban fringe
for lifestyle and recreational pursuits (URS 2003). All municipalities in the
Corangamite region recorded growth during 2007 – 2008 (Table 2.4) (ABS
2009a). It has been predicted that 52 % of the rural properties in the Corangamite
region will change ownership by 2016 (Mendham and Curtis 2007). The salinity
risk implications of this increasing urbanisation of the Corangamite region is
further discussed in Chapter 6.
(Data from ABS 2009a)
Figure 2.11 Population of Ballarat and Geelong
Geelong
Ballarat
Po
pu
latio
n
Year
1920 1940 1960 1980 2000
0
40000
80000
120000
160000
200000

Salinity Risk in the Corangamite Region, Australia
Peter Dahlhaus 44
Table 2.4 Population by municipality in the Corangamite region
Municipality Est. Population
30 June 2008
Growth
2007-2008 Comment
City of Ballarat 91,787 2.0 % small percentage outside of region
Colac Otway Shire 21,448 0.8 % entirely with region
Corangamite Shire 17,270 0.2 % small percentage outside of region
Golden Plains Shire 17,681 2.0 % entirely with region
City of Greater Geelong 211,841 1.4 % small percentage outside of region
Moorabool Shire 27,247 1.1 % large percentage outside of region
Moyne Shire 16,405 1.3 % large percentage outside of region
Borough of Queenscliff 3,256 2.2 % entirely with region
Surf Coast Shire 24,442 3.6 % entirely with region
(Data from ABS 2009a)
2.5.4 Vegetation and land-use data sources
Vegetation data includes the GIS layers supplied by DSE for the Corangamite
region, including: bioregions; predicted EVC cover in the year 1750; current EVC
cover; native vegetation conservation significance; and EVC bioregional
conservation status.
Land use data is taken from a GIS layer derived from remote sensing and aerial
photography dated from 1999 to 2002, with most data relating to the 2000 – 2001
period (DSE 2003). The layer was modified to amalgamate land uses into the
categories listed in Table 2.3 and necessitated the addition dairying as a land use.
Naturally, the spatial cover of various land-uses, especially grazing and cropping,
dramatically changes on an annual basis. Public land distribution and status was
modified and corrected from the 2003 statewide coverage using the cadastre
supplied by DSE (2008b).
Aerial photographs dating from 1934 were used for various components of the
research detailed in the following chapters of the thesis. These included a series
of georectified aerial orthophotomosaics, generally supplied by the Corangamite
CMA, municipalities or the DSE. The latest aerial georectified orthophoto
coverage for the Corangamite region was acquired at the same time as the LIDAR
terrain data (detailed in section 2.1.1.1) and has a pixel resolution of 0.35 m.
Higher resolution photography (0.12 m) is also provided for selected urban areas
including Geelong and Ballarat.

Salinity Risk in the Corangamite Region, Australia
Peter Dahlhaus 45
2.6 Hydrogeology
In the available scientific literature, the hydrogeology of the Corangamite region
is not as well described as many of the other biophysical parameters. There are no
whole of Corangamite region studies known, although a few regional-scale
groundwater models have been undertaken. The vast majority of hydrogeological
studies are confined to localised areas, generally focussed on groundwater
resource management (cf. salinity management), and documented in unpublished
literature (such as consulting reports, university theses, and government reports).
Nevertheless, these studies number in the hundreds and they are a considerable
source of information and data for this thesis.
In the broad hydrogeological framework of Victoria, the Corangamite region
straddles three groundwater provinces, viz: Uplands, Otway Basin and Port Phillip
Basin (Leonard 2003).
Figure 2.12 Groundwater
provinces of the
Corangamite
region
(source: DSE 2007)
The main groundwater resource aquifers of the provinces and their general
properties have been described by Leonard (2003). Since the aquifers have been
delineated on the basis of groundwater as a resource (for human uses) many are
not implicated in the processes that contribute to salinity. A summary of the
groundwater resources of the Corangamite region is illustrated in Figure 2.13.
When considered across the whole of the Corangamite region, the
hydrogeological framework generally reflects the geological framework. The
most recent region-wide classification of aquifers is that by Sinclair Knight Merz

Salinity Risk in the Corangamite Region, Australia
Peter Dahlhaus 46
(SKM) consulting group for the Southern Rural Water (SRW) authority, reported
in Gill (2009). The classification is an initial attempt at a nationally consistent
approach for hydrogeological mapping instigated by the Bureau of Meteorology.
The consolidation of the geology into this framework for the Corangamite region
has been attempted in Table 2.6.
(modified from DSE 2006)
Figure 2.13 The general groundwater resources of the Corangamite region
2.6.1 Groundwater flow systems
Groundwater flow systems (GFS) have been developed in the National Land and
Water Audit (Audit) as a framework for dryland salinity management in Australia
(NLWRA 2001). They “…characterise similar landscapes in which similar
groundwater processes contribute to similar salinity issues, and where similar
salinity management options apply” (Coram et al. 2001). At the continental scale,
twelve GFS have been identified in Australia on the basis of nationally distinctive
geological and geomorphological character.
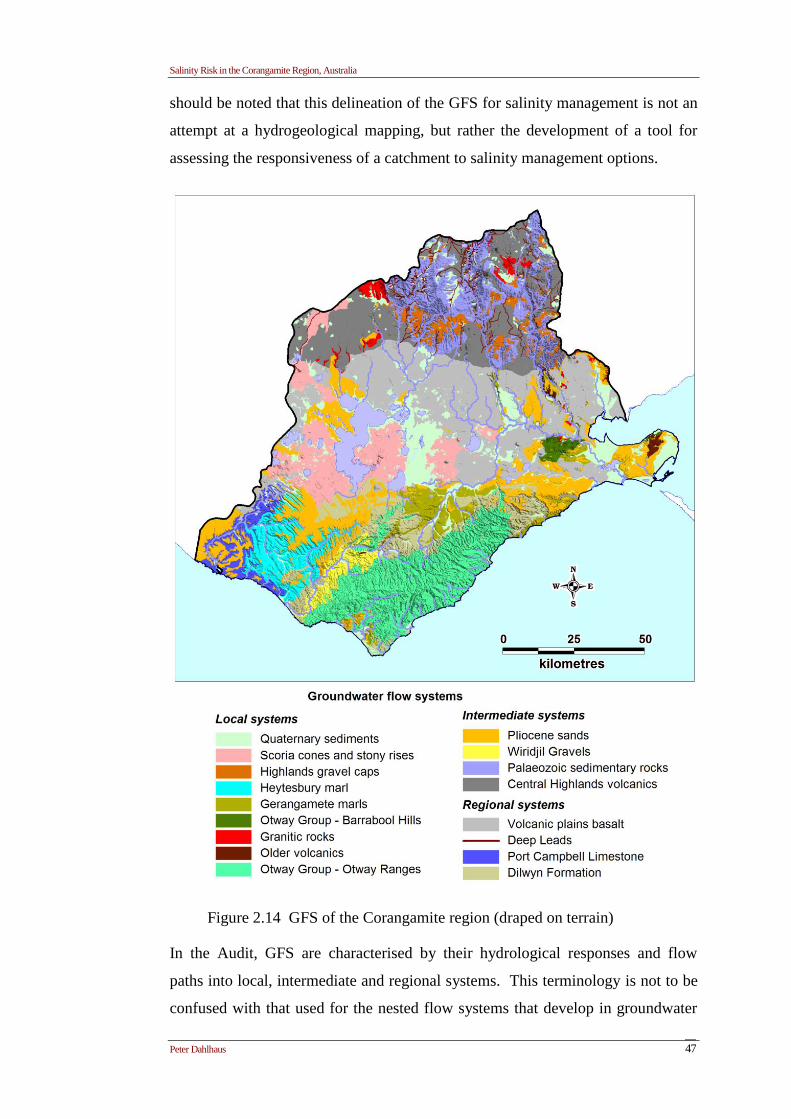
In the Corangamite region 17 GFS are recognised (Dahlhaus et al. 2002a), the
spatial distribution of which are shown in Figure 2.14 in which they are draped
over the DEM to demonstrate the relationship to the underlying landscapes. It
Salinity Risk in the Corangamite Region, Australia
Peter Dahlhaus 47
should be noted that this delineation of the GFS for salinity management is not an
attempt at a hydrogeological mapping, but rather the development of a tool for
assessing the responsiveness of a catchment to salinity management options.
Figure 2.14 GFS of the Corangamite region (draped on terrain)
In the Audit, GFS are characterised by their hydrological responses and flow
paths into local, intermediate and regional systems. This terminology is not to be
confused with that used for the nested flow systems that develop in groundwater

Salinity Risk in the Corangamite Region, Australia
Peter Dahlhaus 48
basins, depending on the basin length to depth ratio and the topographic
undulation, as described by Tóth (1963). The terminology used by the Audit
describes local, intermediate and regional GFS by their flow path length and
corresponding ability to respond to hydrological change caused by alteration to
the natural environment. The underlying assumption is that salinity is caused by
increased recharge leading to rising groundwater tables, which have resulted from
changes in land management over the past 200 years (NLWRA 2001).
The Audit provides definitions of flow systems as tabulated below (Table 2.5).
Table 2.5 GFS definitions in the Audit
Attribute Rating Meaning/Value
Scale
Local Groundwater flows over distances <5 km
Intermediate Groundwater flows over distances 5 – 30 km
Regional Groundwater flows over distances > 50 km
Aquifer
transmissivity
Low Less than 2 m2/day
Moderate 2 m2/day to 100 m
2/day
High Greater than 100 m2/day
Groundwater salinity
Low Less than 2000 mg/l
Moderate 2000 mg/l to 10000 mg/l
High Greater than 10000 mg/l
Catchment size
Small Less than 10 km2
Moderate 10 km2 to 500 km
2
Large Greater than 500 km2
Annual rainfall
Low Less than 400 mm
Moderate 400 mm to 800 mm
High Greater than 800 mm
Salinity rating
S1 Loss of production
S2 Saline land covered with salt-tolerant volunteer species
S3 Barren saline soils, typically eroded with exposed sub-soils
Responsiveness to
land management
Low Salinity benefits accrue over timeframes > 50 years
Moderate Salinity benefits accrue over timeframes from 30 to 50 years
High Salinity benefits accrue over timeframes < 30 years
(source: NLWRA 2001)
The boundaries of the GFS are based on the region‘s surficial geology units
(Figure 2.5) which have been grouped according to their hydrogeological
characteristics, as determined by consensus of opinion reached at a 3 day GFS

Salinity Risk in the Corangamite Region, Australia
Peter Dahlhaus 49
workshop (November 2001) with 55 regional experts who have conducted
numerous investigations over the past decades. Each GFS has been described by
Dahlhaus et al (2002a) according to the attributes listed in the Audit (Table 2.5)
and the suggested description in the national Evaluation Framework (Coram et al.
2001). Additional descriptive information provides historical and landscape
context to each system. This work is appended (Appendix A).
A comparison of the GFS with the initial SRW classification of aquifers (as
reported by Gill 2009) is shown in Table 2.6. The comparison clearly
demonstrates the differences between the GFS and the conventional
hydrogeological mapping for groundwater resource management. For example,
the pre-Cretaceous age rocks are grouped together in the SRW classification as
the basement aquifer (BSE), whereas the same geological units are divided into 7
GFS. The logic for resource management is that all BSE are low yielding
fractured rock aquifers, whereas for salinity management there is a substantial
difference in the quality of the groundwater discharge from each system. Even in
the same geological formation - the Otway Group - the groundwater discharge
from GFS6 (Barrabool Hills) has led to significant land salinisation compared to
none at all in GFS9 (Otway Range).
In accord with the national and state policies, the salinity management actions in
the Corangamite region are based on the response of the GFS implicated in the
salinity process (Dahlhaus 2004). This is mainly achieved through the
establishment of vegetation in areas targeted for recharge or discharge
management (Nicholson et al. 2006).

Salinity Risk in the Corangamite Region, Australia
Peter Dahlhaus 50
Table 2.6 A comparison of regional hydrogeologic frameworks.
Geological unit
(refer to Figure 2.5)
SRW framework
(Gill 2009)
GFS framework
(Dahlhaus et al. 2002)
Qra - Holocene alluvial, colluvial &
paludal deposits QA - Quaternary Aquifer GFS1 - Quaternary sediments
Qrd - Holocene coastal and lunette
deposits QA - Quaternary Aquifer GFS1 - Quaternary sediments
Qpa - Pleistocene alluvial & colluvial
deposits QA - Quaternary Aquifer GFS1 - Quaternary sediments
Qvs - later Newer Volcanics GFS2 - Scoria and stony rises
Qvn - earlier Newer Volcanics
GFS13 - Central Highlands
volcanic rocks
GFS14 - Volcanic Plains basalt
Npb - Pliocene sands UTA - Upper Tertiary
Aquifer
GFS 3 - Highlands gravel caps
GFS10 - Pliocene sands
GFS15 - Subsurface Deep
Leads (subsurface unit)
Nmg - Port Campbell Limestone UMTA - Upper Mid-
Tertiary Aquifer
GFS16 - Port Campbell
Limestone
Nmn - Gellibrand Marl and equivalents UMTD - Upper Mid-
Tertiary Aquitard
GFS4 - Heytesbury Marls
GFS5 - Gerangamete Marls
Clifton Formation (subsurface unit) LMTA - Lower Mid-
Tertiary Aquifer
Pon - Narrawaturk Marl & Jan Juc
Formation
LMTD - Lower Mid-
Tertiary Aquitard GFS4 - Heytesbury Marls
Ped - Demons Bluff Formation LMTD - Lower Mid-
Tertiary Aquitard GFS4 - Heytesbury Marls
Upper Mepunga Formation (subsurface
unit)
LMTD - Lower Mid-
Tertiary Aquitard
Lower Mepunga Formation (subsurface
unit)
LTA - Lower Tertiary
Aquifer
Pe - Werribee Formation LTA - Lower Tertiary
Aquifer GFS 3 - Highlands gravel caps
Pvo - Older Volcanics
LMTD - Lower Mid-
Tertiary Aquitard GFS8 - Older Volcanics
LTA - Lower Tertiary
Aquifer
Pae - Eastern View Formation LTA - Lower Tertiary
Aquifer GFS17 - Dilwyn Formation
Pad - Dilwyn Formation & Pember
Mudstone
LTA - Lower Tertiary
Aquifer GFS17 - Dilwyn Formation
Pan - Moomowroong, Wiridjil & Pebble
Point Formations
LTA - Lower Tertiary
Aquifer
GFS11 - Wiridjil Gravel and
equivalents
Ppw - White Hills Gravel GFS 3 - Highlands gravel caps
Kl - Otway Group BSE - Basement
GFS6 - Otway Group
(Barrabool Hills)
GFS9 - Otway Group rocks
(Otway Range)
P - Wild Duck Formation & equivalents BSE - Basement GFS 3 - Highlands gravel caps
Dg - granitic rocks BSE - Basement GFS7 - Palaeozoic granitic
rocks
Ol - Castlemaine Supergroup BSE - Basement GFS12 - Palaeozoic
sedimentary rocks
Es - St Arnaud Group BSE - Basement GFS12 - Palaeozoic
sedimentary rocks
Ev - Ceres Metagabbro BSE - Basement GFS7 - Palaeozoic granitic
rocks

Salinity Risk in the Corangamite Region, Australia
Peter Dahlhaus 51
2.6.2 Groundwater bore monitoring
Regular groundwater monitoring for resource management commenced in the
early 1970s following the introduction of the Groundwater Act 1969, and today
there are at least 209 state observation bores located in the Corangamite region.
Groundwater monitoring for salinity management commenced with the
introduction of the first state and regional salinity strategies in the late 1980s
(documented in Chapter 3). Approximately 580 salinity monitoring bores were
believed to have been constructed in the Corangamite region during the first
decade (1993 - 2003) of salinity management (Nicholson 2002). Although most
bores were constructed by government drillers, few records of the construction
details and lithological logs were kept.
Initially the monitoring and collation of the data was undertaken by a single state
government department, but became increasingly fragmented following a series of
reorganisations within the government departments and authorities from the late
1980s onwards. At present, the groundwater resource bores are regularly
monitored by commercial contractors for the Department of Sustainability and
Environment (DSE). The groundwater levels and salinities of the salinity bore
monitoring network were initially measured by government monitors, but from
the mid 1990s, the task was partly outsourced to community-based Landcare
groups. The results of the monitoring was reported to the Corangamite CMA (and
precursors) on an intermittent basis (e.g.Heislers 1995; Pillai and Heislers 2000).
By 2003 the majority of the salinity monitoring bores were no longer monitored.
As a component of this research project, the Corangamite CMA funded a review
of the salinity monitoring bore network in 2003 (Dahlhaus et al. 2004b). The
research identified that 519 of the 580 salinity monitoring bores that were
believed to have been constructed were registered on the government databases.
Of these, a field checking program located 409 bores, with the remaining 110
consisting of 42 bores that could not be located with the information available, 62
that apparently did not exist at all in the area of their stated location (based on
landholder information), and 6 that were located but their identity could not be
determined. Of the 409 bores field checked, 75 (19 %) had broken standpipes,
with 52 (13 %) broken at or below ground level and 23 (6 %) broken above
Salinity Risk in the Corangamite Region, Australia
Peter Dahlhaus 52
ground level. The field checking measured 266 bores shallower than recorded
(either due to silting or initially misrecorded) and 81 bores deeper than recorded.
The report detailing the survey methods and results is appended (Appendix A).
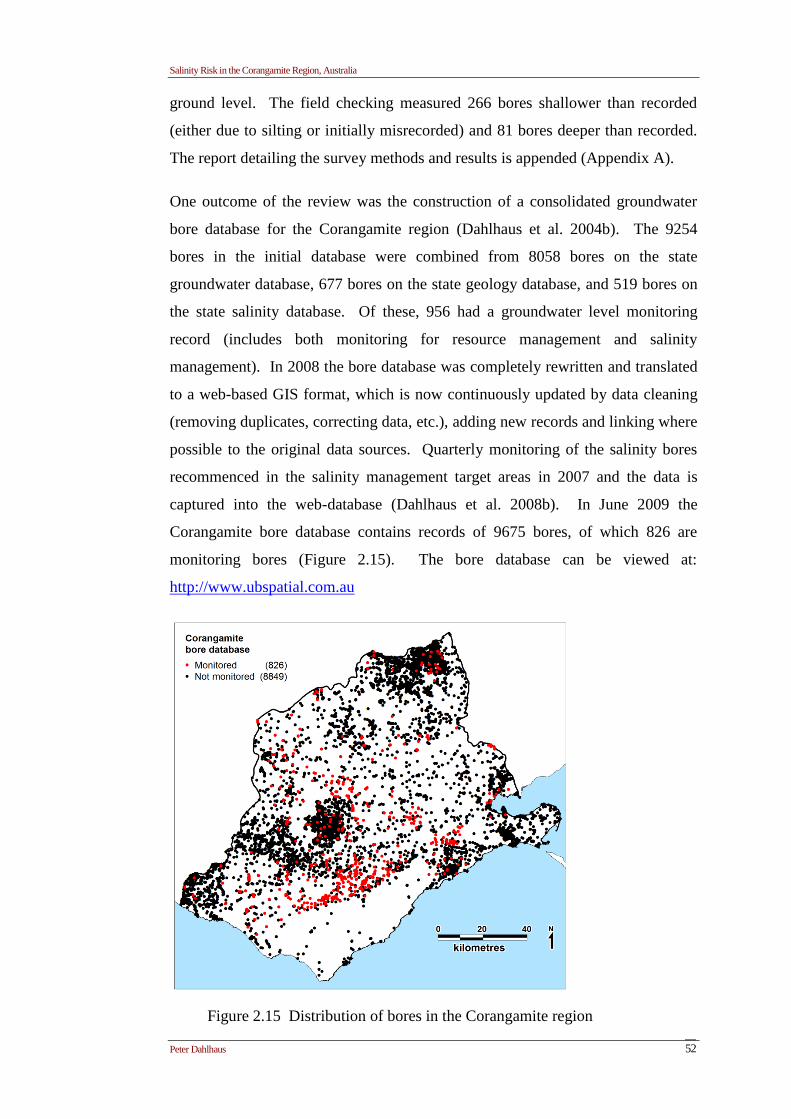
One outcome of the review was the construction of a consolidated groundwater
bore database for the Corangamite region (Dahlhaus et al. 2004b). The 9254
bores in the initial database were combined from 8058 bores on the state
groundwater database, 677 bores on the state geology database, and 519 bores on
the state salinity database. Of these, 956 had a groundwater level monitoring
record (includes both monitoring for resource management and salinity
management). In 2008 the bore database was completely rewritten and translated
to a web-based GIS format, which is now continuously updated by data cleaning
(removing duplicates, correcting data, etc.), adding new records and linking where
possible to the original data sources. Quarterly monitoring of the salinity bores
recommenced in the salinity management target areas in 2007 and the data is
captured into the web-database (Dahlhaus et al. 2008b). In June 2009 the
Corangamite bore database contains records of 9675 bores, of which 826 are
monitoring bores (Figure 2.15). The bore database can be viewed at:
http://www.ubspatial.com.au
Figure 2.15 Distribution of bores in the Corangamite region

Salinity Risk in the Corangamite Region, Australia
Peter Dahlhaus 53
2.6.3 Conceptual and numerical models
In excess of 200 groundwater studies have been undertaken in the Corangamite
region over the past 40 years, the vast majority of which are groundwater resource
investigations at the local scale. In addition numerous hydrogeological models -
both conceptual and numerical - have been constructed for the region, with the
vast majority being numerical models constructed in the past decade. This section
provides a brief summary of the more significant regional studies and models that
provide insights to the hydrogeological systems which are relevant to the salinity
processes.
2.6.3.1 Volcanic plains and lakes
The majority of the previous hydrogeological studies have focused on the
volcanic plains and their shallow saline lakes, since this area combines the
challenge of managing fresh groundwater resources adjacent to internationally
significant saline lakes. The first significant hydrogeology study was that by
Thompson (1971; 1972) who detailed the hydrogeology of the Warrion - Dreeite
region. Thompson concluded that the groundwater evolves from low-salinity Ca-
Mg-HCO3 type at the recharge area (Mt Warrion) to high-salinity Na-Cl type
further along the flow path towards discharge at the lakes. He attributes the
source of the salts to connate oceanic water trapped in the underlying marls which
were incorporated into the aquifer materials during volcanism. Thompson also
recognises that the groundwater is a factor in the transfer of salts to and from the
lakes, maintaining the lake salinities within narrow limits.
Limnology studies of the volcanic plains lakes in the Corangamite region (Bayly
and Williams 1966; Maddocks 1967; Currey 1970; Timms 1976; Williams 1981;
De Deckker 1982; Timms 1983; De Deckker and Williams 1988; Williams 1992;
Gell et al. 1994; Gell 1995; Williams 1995; Gell 1998; Radke et al. 2002; De
Deckker 2003; Tibby and Tiller 2007) have added a great deal of knowledge to
the history of lake salinity throughout the Quaternary. This knowledge has
contributed to the conceptualisation of a generalised temporal hydrogeological
model of groundwater levels responding to climate oscillations throughout the
Quaternary. This model is further supported by the studies of lunettes (Dimmer

Salinity Risk in the Corangamite Region, Australia
Peter Dahlhaus 54
1992; Tickell and King 1992; Edwards et al. 1996) and is discussed in more detail
in Chapter 3.
With the introduction of salinity management plans a series of investigations were
instigated by the water and salinity management authorities to examine the
groundwater and salinity processes with the aim of protecting Lake Corangamite
and the Barwon River from rising salinity (Nicholson et al. 1992b). Investigations
by the Rural Water Commission/Corporation (RWC) in the late 1980s and early
1990s (Gill 1988; RWC 1989; Adams 1990; Nolan et al. 1990; Pamminger 1991)
were enlightening in that they contrasted the salinity of the Western Uplands with
that of the Western Plains, suggesting that the latter was a natural feature, whereas
the former was induced by land use change. Rudimentary salt balance
calculations showed that cyclic salt input over 2900 years could account for the
salinity of Lake Corangamite, suggesting that periodic overflow or leakage are
required to maintain the salinity levels (Gill 1988; RWC 1989).
Research undertaken by Coram (1996b; Coram et al. 1998) focused on the
groundwater-surface water interactions around the shallow lakes using
potentiometric surface analysis and water and salt balances. Coram confirmed
interaction between the lakes and the groundwater system and identified some as
'throughflow lakes' (lakes Murdeduke, Bookar, Colongulac and Gnarpurt) or
'discharge lakes' (Lake Beeac and the other lakes of the Lough Calvert). Her
thesis argues that differences are due to: variations in the local hydrostratigraphy
downgradient of the lakes; differences in the relative proportion of groundwater
discharged from the lakes compared with other inflowing waters; and differences
in the TDS content and relative proportions of major ions in the lakes.
Coram found the chemical characteristics of lake waters to be dominated by Na+
and Cl-. Water budgets indicated that precipitation and evaporation were the
dominant control on lake hydrology, at least an order of magnitude greater than
the contribution of average surface inflows (which vary seasonally) and average
groundwater inflows and outflows (which are relatively constant). Her salt budget
analysis showed that groundwater and surface water contribute substantial
amounts of salt to the lakes with the concentration of these salts dependent on the
extent to which discharge of evaporatively concentrated lake waters occurs.

Salinity Risk in the Corangamite Region, Australia
Peter Dahlhaus 55
Coram proposed a density driven system in which the TDS content determines the
groundwater discharge characteristics of lakes, with throughflow lakes having a
salt mass discharge in the same order of magnitude as salt mass inflow.
The work of Gill (1988) and Coram (1996a) proposed that highly saline
groundwater leaked from Lake Murdeduke into the Barwon River north of
Winchelsea. This theory was tested by a series of investigations (Roderick 1988;
Lamson 1990; SKM 1997a; Blackam 1999; Giles 2004) and found to be correct,
with baseflow discharge occurring along an 8 km reach between Winchelsea and
Inverleigh, causing a 40 % – 50 % increase in river salinity (SKM 1997a).
A series of numerical models using MODFLOW, a modular finite-difference flow
model (McDonald and Harbaugh 1988) have been constructed in the volcanic
plains region. The purpose of these varies from graduate research (Dickinson
1995; Blackam 1999); flow system mapping (Cox et al. 2007); prediction of land
salinisation (Smitt 2007); and farm forestry impacts (Hawkins et al. 2007). The
most informative on hydrogeology was that by Cox et al. (2007) who undertook
an extensive research program to: construct the aquifer geometry in 3-dimensions;
undertake hydrogeochemistry and isotope sampling to map flow paths; investigate
the sources of salt and mobilisation processes; and map groundwater flow
systems. This author contributed to the work by preparing the aquifer structure
surfaces and isopach models based on the geology (section 2.2) and GFS (section
2.6.1) and sampling the groundwater for analysis. The methods and outcomes of
the project are appended (Appendix A).
The steady state numerical model was constructed by Cox et al. (2007) used a
250m regular grid of two layers: the upper layer representing GFS1, 2, 10 & 14
(refer to Table 2.5) which are the unconfined aquifers; and the lower layer
representing the pre-Pliocene aquitards and basement aquifer. Recharge was set
at 1.0e-5 m/d (3.65 mm/yr) on the plains and 1.0e-4 m/d (36.5 mm/yr) on the
scoria and stony rise areas. The hydraulic conductivity of the aquifer was
modelled as 5 m/d based on historic pump tests and the hydraulic conductivity of
the aquitard 1e-3 m/d. The resultant head contours are shown in Figure 2.16.
Groundwater paths were modelled using Modpath (Pollock 1994), as shown in
Figure 2.17 (Cox et al. 2007).

Salinity Risk in the Corangamite Region, Australia
Peter Dahlhaus 56
Figure 2.16 Model of watertable elevation and groundwater divides.
Figure 2.17 Pathlines around lakes and rivers in the model domain.
Source: Cox et al. (2007)
Source: Cox et al. (2007)
Lake
Corangamite
Lake
Corangamite
Lake
Colac
Lake
Colac Barwon River
Barwon River

Salinity Risk in the Corangamite Region, Australia
Peter Dahlhaus 57
The 41 hydrochemistry analyses undertaken in the study by Cox et al. (2007)
showed that groundwater quality in the basalts varied from very fresh (204 mg/L
Total Soluble Salts - TSS) to quite saline (13,249 mg/L TSS). Groundwater in
GFS13 - the Central Highlands volcanic rocks - showed uniformly lower salinity
and higher HCO3-
/Cl- than that observed in GFS14 - the Volcanic Plains Basalts -
suggesting little connection between those two systems. The Pliocene Sands
(GFS10) exhibit intermediate salinities and HCO3-
/Cl- ratios distinct from GFS14,
suggesting limited vertical connectivity. These results when combined with the
more enriched 18
O isotopes in GFS14 suggest that there is little connectivity (i.e.
groundwater fluxes) with the surrounding aquifers, relative to diffuse vertical
recharge and lateral discharge.
Apparent ages of the water based on 14
C (38 samples) and CFC analyses (10
samples) indicated variation from decades to about 20,000 years (Cox et al. 2007).
The youngest ages were associated with the low salinity waters of GFS13 and
GFS2, whereas the oldest ages were associated with GFS14 and GFS15
(Subsurface Deep Leads). Groundwater ages along one west-east transect from
Lake Corangamite to Winchelsea (Barwon River) suggested a horizontal flow rate
of 15m/yr, which is quite rapid given the low hydraulic gradients.
Based on the comparison of Br- and Cl
- ions to seawater, the source of the salt is
clearly marine-derived aerosols (Cox et al. 2007). However the estimated
residence time for the salt (1500 years) suggests that it is removed from the
aquifer system, probably through historic flood events. Such events have not been
recorded since European settlement.
More recent work on the lakes includes the assessment of the impact of irrigation
(Adler 2003; Adler and Lawrence 2004; Barton et al. 2009 (in prep)). Extensive
studies of groundwater - surface water interactions using mainly
hydrogeochemistry and isotopes have been completed (Barton et al. 2006;
Turnbull 2006; Barton et al. 2007; 2008; Herczeg et al. 2008) but are as yet
largely unpublished in the scientific literature. The main outcome has been the
development of tools to determine whether the Corangamite region lakes are
surface water or groundwater dominant, and throughflow or terminal lakes. The
studies use (Ca2+
+ Mg2+
)/(Na+ + K
+) <0.2 and HCO
3-/Cl
- <0.1 as indicators of

Salinity Risk in the Corangamite Region, Australia
Peter Dahlhaus 58
groundwater dominance. The deuterium excess, where dxs =(2H – 8.
18O)
indicates the residence time of water in a wetland, with dxs<0 indicates increasing
groundwater dominance (Herczeg et al. 2008). More detailed reports on this work
are appended (Appendix A).
2.6.3.2 Uplands
By comparison to the volcanic plains, the hydrogeology of the Uplands is much
less studied, with most of the previous investigations focused on groundwater
resource management than salinity management.
The hydrogeology of the volcanic and deep lead aquifers in the Upper Moorabool
and Leigh rivers has been the most documented (Laing 1976; Nolan-ITU 1988;
HydroTechnology 1994; SKM 1998b; URS 2002; SKM 2003; GHD 2004; Evans
2006), although mainly for resource assessment. The most comprehensive
research related to salinity is that of Evans (2006), which is discussed in detail in
Chapter 5.
The hydrogeology of the Palaeozoic basement aquifers is arguably the least
known, since they are not widely utilised as a groundwater resource, except where
mineral waters are found (Shugg 2004). Importantly to salinity management they
are the source of much of the saline groundwater discharge (refer to Section 2.7
for confirmation). For that reason, some studies were undertaken in the
Corangamite region that document conceptual models of groundwater flows and
their implication in salinity processes (Kevin 1993; Mann 1993; MacEwan and
Dahlhaus 1996; Dahlhaus and MacEwan 1997; SKM 1997b; Heislers and Pillai
2000; Smith 2001; Dahlhaus 2003; Church 2004; Horgan 2006; Mockunas 2007).
Apart from the earlier conceptualisations that were borrowed from outside of the
region (e.g. Kevin 1993), the models were developed to understand the salinity
processes in specific landscapes. Taken as a whole, they confirm that the
hydrogeology and salinity processes are uniquely dependent on the geology,
geomorphology, climate and environmental history of each area studied.
As an example, the research undertaken by this author (Dahlhaus 2003 -
Appendix A) included conceptual models for each of the salinity management
target areas in the Uplands groundwater province (i.e. West Moorabool River

Salinity Risk in the Corangamite Region, Australia
Peter Dahlhaus 59
catchment (Chapter 5); Morrisons - Sheoaks; Illabarook; and Pittong (Chapter 4)).
The initial conceptual models of the Morrisons - Sheoaks and Illabarook areas
were based solely on field observations of the geology, geomorphology and saline
groundwater discharge. Both models proposed that the majority of the saline
groundwater was discharged from the base of the erosional remnants - the
Highlands gravel caps (GFS3) - overlying the Palaeozoic sedimentary rocks
(GFS12). These theories were tested by Horgan (2006) in the Morrisons -
Sheoaks region and Mockunas (2007) in the Illabarook - Mt Mercer area. Both
studies used drilling, aquifer testing and hydrochemistry to formulate new
conceptual models of the hydrogeology and salinity processes. Horgan concluded
that the majority of the salinity was probably contributed from the Palaeozoic
sedimentary rocks (GFS12), since the gravel caps (GFS3) were not as extensive as
previously mapped. Mockunas concluded that the majority of the salinity was
contributed by discharge from the Palaeozoic sedimentary rocks (GFS12) at
Illabarook, whereas at Mt Mercer it was sourced from the Palaeozoic sedimentary
rocks (GFS12), Deep Leads (GFS15) and Central Highlands volcanic rocks
(GFS13).
The GFS in the Otway Group rocks are divided into the Otway Ranges (GFS9)
and the Barrabool Hills (GFS6) on the basis of mapped salinity (Dahlhaus et al.
2002a). Saline groundwater discharge is known in the Barrabool Hills, but not in
the Otway Range. The hydrogeology of the fractured aquifers of the Southern
Uplands is largely unknown (Leonard 2002; 2003), especially the aquifer
characteristics or groundwater flow regime in the Otway Group rocks. However,
the Early Cretaceous Otway Group rocks are currently being actively explored for
their geothermal potential (Greenearth Energy Ltd. 2009; Hot Rock Ltd. 2009),
and the Late Cretaceous Sherbrook Group rocks (which do not occur in outcrop)
are being explored for the potential to sequester carbon (CO2 CRC 2009).
Leonard (2002) reports that the groundwater from the Otway Group (Eumeralla
Formation) sampled in a number of petroleum exploration wells shows salinity
(TDS) ranging from 1,000 mg/L and approaching seawater (35,000 mg/L) at
depths over 1.5 km.

Salinity Risk in the Corangamite Region, Australia
Peter Dahlhaus 60
2.6.3.3 Otway basin
By contrast the Tertiary aquifers of the Otway Basin have been investigated for
their groundwater resource (Blake 1978; 1980; Lakey and Leonard 1982; Leonard
1983; Lakey and Leonard 1984; Leonard 1985; Johnston 1992; CMPS&F 1997;
Shugg and Jayatilaka 1998; Leonard 2002; 2003; Petrides and Cartwright 2006)
almost all of which has been focused on the Lower Tertiary confined aquifers in
the Barwon Downs Graben, used to supplement the urban water supply for
Geelong.
Hydrogeological studies focussed on salinity have investigated the surface units,
regarded as aquitards (Table 2.6). These have been delineated into two GFS on
the basis of their hydraulic characteristics and response (Dahlhaus et al. 2002a) -
the Heytesbury Marls (GFS4) and Gerangamete Marls (GFS5). Investigation of
salinised land at selected sites in the Heytesbury (GFS4) has associated the
salinity with the discharge of saline groundwater along preferred pathways
associated with dramatic increase in landsliding since clearing (Dahlhaus et al.
1996; MacEwan et al. 1996; Dahlhaus and MacEwan 1997; Heislers and Pillai
2000; MacEwan et al. 2008). In the Gerangamete area (GFS5) extensive research
at one site (Heislers 1998; Heislers and Pillai 2000; SKM 2002) has concluded
that the salinity is due to the presence of shallow groundwater almost uniformly
distributed across the undulating landscape (i.e. the watertable reflects the
topography). In both areas, the waterlevels have remained relatively constant over
the past 15 years, suggesting that the watertable in the aquitards may be
influenced by the potentiometric head of the underlying confined aquifers
(Dahlhaus 2003).
2.6.3.4 Port Phillip Basin
The hydrogeology of the Port Phillip Basin is relatively complex and has been
extensively documented (e.g. Leonard 1981; 1988; 2003; Dahlhaus et al. 2004a).
Within the boundaries of the Corangamite region (Figure 2.12), investigations of
the hydrogeology have largely been confined to groundwater resources in the
Eastern View Formation of the Torquay Embayment at Anglesea, used for power
generation at the Anglesea coal mine (Hancock 1967; Stanley 1993; SKM 1998a;
Alcoa 2002; Beattie 2003) and proposed to supplement the urban water supply for

Salinity Risk in the Corangamite Region, Australia
Peter Dahlhaus 61
Geelong (GHD 2008). On the Bellarine Peninsula exploration for groundwater
resources (Esplan 1956; Medwell 1957; 1958; Esplan 1962) was unsuccessful.
Mineral springs along the northern edge of the Bellarine block were used by the
early settlers (Shugg 2004), the source of which is believed to be the Older
Volcanics (GFS8) and the Fyansford Formation (GFS5) (Shugg 2001; SKM 2005;
Miner and Dahlhaus 2008).
Hydrogeological investigations for salinity management are scarce. Limited
research for this thesis (Dahlhaus 2003) and recent investigations of the
groundwater - surface water interactions of the lower Barwon River, wetlands and
estuary (Mockunas 2006; Dahlhaus et al. 2007; Keogh 2009) confirm the
complexity of these systems, which are known to be critical for sustaining the
biodiversity values (Ecological Associates 2006).
2.6.4 Groundwater data sources
Many of the unpublished groundwater studies have been made available through
the Corangamite Knowledge Base, which was established to make available the
'grey literature', related to all aspects of catchment management. The database is
available at: http://www.ccmaknowledgebase.vic.gov.au/ccma/page/search.htm.
2.6.4.1 Corangamite groundwater monitoring and research database
As described in section 2.6.1, the Corangamite groundwater bore and monitoring
database is available at: http://www.ubspatial.com.au/. The groundwater database
is an outcome of this PhD project and managed by this author. An on-going
project is adding value to the data by: linking to the original data sources where
possible; checking and cleaning each bore record; adding enhanced import and
export tools; adding red-lining and wiki capability; and establishing interoperative
GIS links to other bore databases managed by others.
2.6.4.2 Groundwater flow systems
The Corangamite GFS are provided with the full list of attributes described by
Dahlhaus et al (2002a - Appendix A). In most cases the GFS polygons match
seamlessly to those of the Port Phillip and Westernport GFS to the east (Dahlhaus
et al. 2004a) and Glenelg Hopkins GFS to the west (Dahlhaus et al. 2002b)
(Appendix B).

Salinity Risk in the Corangamite Region, Australia
Peter Dahlhaus 62
2.6.4.3 Depth to watertable mapping
One of the initial factors for the selection of the Corangamite region in the
National Action Plan for Salinity and Water Quality (CoAG 2000) was the depth
to watertable predictions for the region in the National Land and Water Resources
Audit (NLWRA 2001). The initial predictions were based on coarse resolution
data available at the time (Figure 2.18; SKM 2000). In late 2005 statewide re-
evaluation of the depth to groundwater maps and predictions were completed by
Sinclair Knight Merz (SKM) for the Audit. The revised version was based on
finer resolution digital elevation models and a different interpolation algorithm
(Peterson et al. 2003; Peterson and Barnett 2004a; 2004b). The resulting
numerical surfaces show considerably less area predicted to experience shallow
watertables in 2050 than previously predicted. Concerns over the validity of the
models (DPI 2008a) resulted in another version generated in 2008 (SKM 2008) in
which predictive scenarios were no longer made.
The depth to groundwater models were made available as grids as detailed in
Appendix B.
Figure 2.18 Depth to groundwater models predicted for 2050 (worst case).
2.7 Mapped salinity
The area of land salinised in parts of the Corangamite region has been assessed on
numerous occasions over the past 30 years. A brief summary of known surveys is
listed in Table 2.7 and some of these reports are appended (Appendix B). All
areas of the Corangamite region have been mapped by at least one survey,
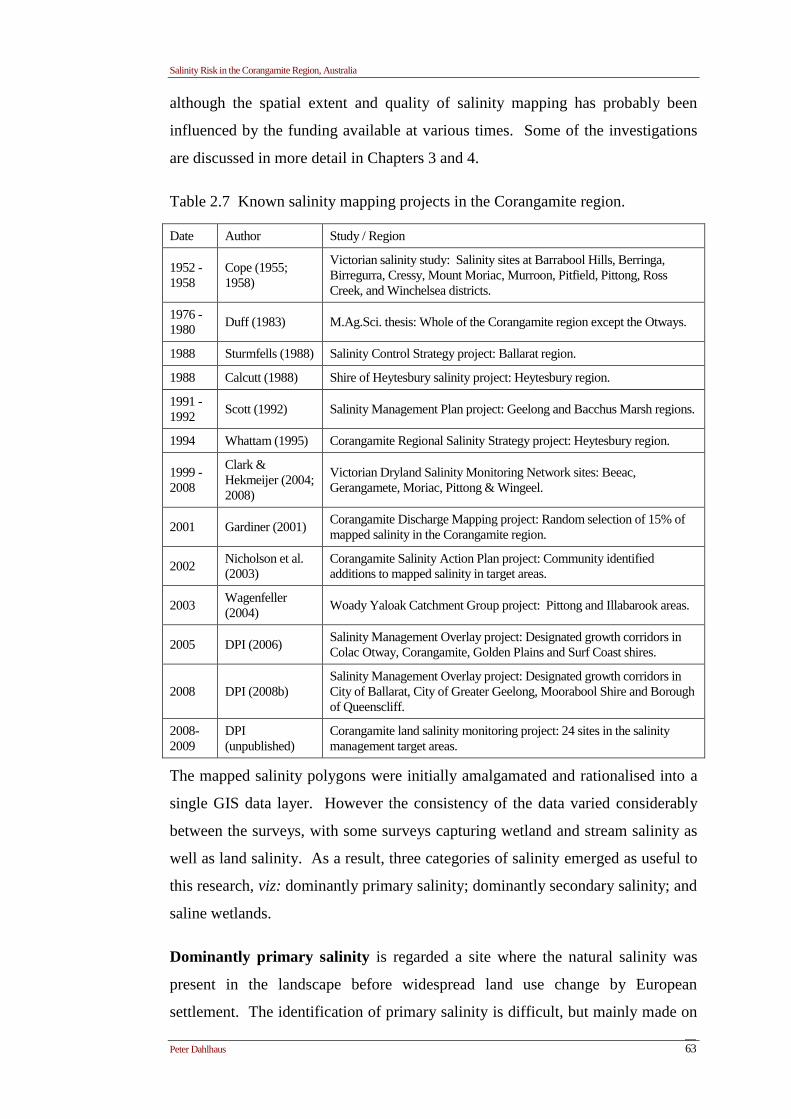
Salinity Risk in the Corangamite Region, Australia
Peter Dahlhaus 63
although the spatial extent and quality of salinity mapping has probably been
influenced by the funding available at various times. Some of the investigations
are discussed in more detail in Chapters 3 and 4.
Table 2.7 Known salinity mapping projects in the Corangamite region.
Date Author Study / Region
1952 -
1958
Cope (1955;
1958)
Victorian salinity study: Salinity sites at Barrabool Hills, Berringa,
Birregurra, Cressy, Mount Moriac, Murroon, Pitfield, Pittong, Ross
Creek, and Winchelsea districts.
1976 -
1980 Duff (1983) M.Ag.Sci. thesis: Whole of the Corangamite region except the Otways.
1988 Sturmfells (1988) Salinity Control Strategy project: Ballarat region.
1988 Calcutt (1988) Shire of Heytesbury salinity project: Heytesbury region.
1991 -
1992 Scott (1992) Salinity Management Plan project: Geelong and Bacchus Marsh regions.
1994 Whattam (1995) Corangamite Regional Salinity Strategy project: Heytesbury region.
1999 -
2008
Clark &
Hekmeijer (2004;
2008)
Victorian Dryland Salinity Monitoring Network sites: Beeac,
Gerangamete, Moriac, Pittong & Wingeel.
2001 Gardiner (2001) Corangamite Discharge Mapping project: Random selection of 15% of
mapped salinity in the Corangamite region.
2002 Nicholson et al.
(2003)
Corangamite Salinity Action Plan project: Community identified
additions to mapped salinity in target areas.
2003 Wagenfeller
(2004) Woady Yaloak Catchment Group project: Pittong and Illabarook areas.
2005 DPI (2006) Salinity Management Overlay project: Designated growth corridors in
Colac Otway, Corangamite, Golden Plains and Surf Coast shires.
2008 DPI (2008b)
Salinity Management Overlay project: Designated growth corridors in
City of Ballarat, City of Greater Geelong, Moorabool Shire and Borough
of Queenscliff.
2008-
2009
DPI
(unpublished)
Corangamite land salinity monitoring project: 24 sites in the salinity
management target areas.
The mapped salinity polygons were initially amalgamated and rationalised into a
single GIS data layer. However the consistency of the data varied considerably
between the surveys, with some surveys capturing wetland and stream salinity as
well as land salinity. As a result, three categories of salinity emerged as useful to
this research, viz: dominantly primary salinity; dominantly secondary salinity; and
saline wetlands.
Dominantly primary salinity is regarded a site where the natural salinity was
present in the landscape before widespread land use change by European
settlement. The identification of primary salinity is difficult, but mainly made on

Salinity Risk in the Corangamite Region, Australia
Peter Dahlhaus 64
the basis of salinity indicator vegetation (DPI 2006; DPI 2008b). By observing
the structure and variety of halophytic plants, an inference can be made about the
likelihood of the site being naturally saline. A site is more likely to be a primary
site if it has a high diversity of native salt tolerant plants that have low capacities
for colonising newly saline sites (Allen 2007). Naturally, if the area of the
primary site has spread as a result of anthropogenic changes (i.e. secondary
salinity), then the assertion is less valid. Similarly, a site with a few slow
colonisers may in fact be a secondary salinity site, or it may be a degraded
primary site.
The likelihood of a site being a primary salinity site was also determined using
historic information, especially by correlating the site to historic aerial
photographs and maps. For example, if a site was in an area indicated as an
ephemeral swamp or 'land subject to inundation' on the early topographic maps
(e.g. the 1:63,360 scale Army Ordinance Maps dating from 1916 onwards) or
geological maps (e.g. the 1:31,680 scale 19th
century Quarter Sheets and early 20th
century Parish Plan series), then it was considered more likely to be a primary
salinity site.
Dominantly secondary salinity is regarded a site where salinity has been induced
by anthropogenic land use change since European settlement. It is also mainly
recognised by vegetation indicators, with abundant halophytic species considered
efficient colonisers, or ruderal species (DPI 2006; Allen 2007; DPI 2008b). It is
acknowledged that degraded primary sites may be misidentified as secondary,
especially where disturbance has decreased the diversity of non-ruderal species;
and increased the diversity of ruderal species. However, where doubt existed as
to the categorisation of the site, it has been nominated as dominantly secondary
salinity by default.
Saline wetlands are those categorised by Corrick (1982) as either 'permanent
saline' or 'semi-permanent saline'. Wetlands are classified as saline if the average
annual salinity of the water exceeds 3,000 mg/L TDS (Corrick and Norman 1980).
A permanent saline wetland includes coastal and intertidal wetlands, as well as
inland salt lakes such as the deeper part of Lake Corangamite and Lake
Murdeduke. A semi-permanent saline wetland may be inundated to a depth of
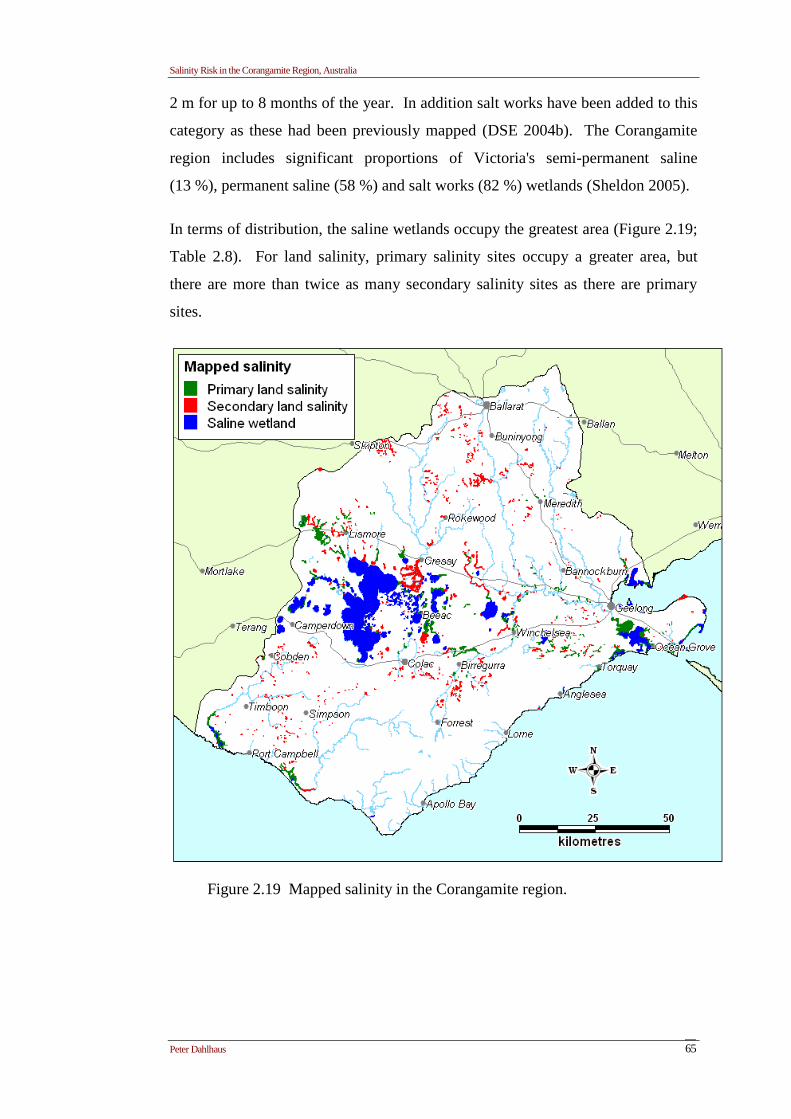
Salinity Risk in the Corangamite Region, Australia
Peter Dahlhaus 65
2 m for up to 8 months of the year. In addition salt works have been added to this
category as these had been previously mapped (DSE 2004b). The Corangamite
region includes significant proportions of Victoria's semi-permanent saline
(13 %), permanent saline (58 %) and salt works (82 %) wetlands (Sheldon 2005).
In terms of distribution, the saline wetlands occupy the greatest area (Figure 2.19;
Table 2.8). For land salinity, primary salinity sites occupy a greater area, but
there are more than twice as many secondary salinity sites as there are primary
sites.
Figure 2.19 Mapped salinity in the Corangamite region.

Salinity Risk in the Corangamite Region, Australia
Peter Dahlhaus 66
Table 2.8 Types of salinity in the Corangamite region
Type of salinity Saline sites
(number)
Total salinity
(hectares)
Dominantly primary 422 9,183
Dominantly secondary 1,075 8,084
Total land salinity 1,497 17,267
Saline wetlands 454 45,731
Total salinity 1,951 62,998
2.7.1 Relationship of salinity to biophysical parameters
To conclude this chapter, the relationship of the various biophysical elements to
the distribution of salinity in the Corangamite region is investigated. A simple
GIS analysis in which the distribution of mapped salinity within each element has
been calculated, as tabulated below (Tables 2.9 & 2.10), is initially informative.
Obvious correlations fall out of this exercise, e.g. there is roughly equal area and
number of sites of primary land salinity in the Barwon and Lake Corangamite
drainage basins; the vast majority of salinity occurs on the Western Plains;
comparatively few primary salinity sites occur in areas receiving over 700 mm
annual rainfall compared to secondary sites; similarly for areas with less than
1050 mm annual pan evaporation; etc. These simple correlations assist in
identifying the landscape elements in the distribution of salinity.
Similarly obvious relationships between salinity and GFS can be seen, e.g. the
vast majority of sites in both number and area occur on GFS1; whereas there is
virtually no salinity mapped in GFS8, GFS9 & GFS11.
However, while these data are informative in identifying some of the landscape
elements correlated with the distribution of salinity, they do not take into account
the temporal variations in the elements and the causal relations between the
variables.
These factors are explored in the following chapters.
Dominantly primary
Dominantly secondary
Saline wetlands

Salinity Risk in the Corangamite Region, Australia
Peter Dahlhaus 67
Table 2.9 Occurrence of salinity in relation to catchment parameters
Dominantly primary
Dominantly
secondary Saline wetland
No. sites Area (ha) No. sites Area (ha) No. sites Area (ha)
Drainage Basin
Barwon 151 3688.9 359 2253.9 110 6671.5
Moorabool 25 176.0 54 232.7 16 937.4
Lake Corangamite 132 3517.2 384 4783.0 287 36352.0
Otway Coast 111 1359.8 279 724.3 40 1408.7
Geomorphic province
Western Uplands 26 51.3 317 1362 0 0
Western Plains 355 8593.3 603 5951.2 447 45616.8
Southern Uplands 52 532.1 166 771.2 14 110.0
Average Annual Rainfall
< 500 mm 3 38.5 7 37.3 3 92.0
500 - 600 mm 156 4055.4 226 3788.3 202 19016.0
600 -700 mm 231 4067.3 415 2876.4 241 24147.9
700 - 800 mm 24 96.9 209 597.5 6 1701.2
800 - 900 mm 10 640.2 139 518.9 23 357.9
900 - 1000 mm 19 189.4 115 239.9 5 16.7
>1000 mm 2 0.6 15 12.4 1 19.2
Average Annual Pan Evaporation
<1050 mm 5 11.3 12 24.7 0 0
1050 - 1100 mm 18 38.6 180 747.5 0 0
1100 - 1150 mm 6 2.1 167 706.4 0 0
1150 - 1200 mm 232 4754.4 549 5612.1 317 37235.9
1200 - 1250 mm 122 1242.6 187 608.0 39 2949.5
>1250 mm 60 3039.4 47 372.2 111 5165.7
Bioregion
Central Victorian Uplands 15 27.2 243 1057.6 0 0
Otway Plain 145 3454.8 225 1138.4 99 4500.3
Otway Range 0 0 1 1.3 0 0
Victorian Volcanic Plain 256 4875.3 430 5433.9 339 40632.6
Warrnambool Plain 24 824.4 211 453.3 23 597.9
Land use (2003)
Grazing 607 5498.3 990 4965.4 493 3654.0
Dairy 79 453.1 314 484.0 38 357.6
Forestry 18 169.5 46 198.5 4 29.3
Conservation 217 2186.3 82 993.8 304 39503.2
Cropping 67 270.1 110 296.8 38 148.3
Urban 64 181.1 38 84.8 44 975.2
Peri-urban 23 25.4 54 95.5 6 1.9
Horticulture 10 15.4 5 6.1 0 0

Salinity Risk in the Corangamite Region, Australia
Peter Dahlhaus 68
Table 2.10 Occurrence of salinity in relation to GFS
Dominantly primary Dominantly secondary Saline wetland
No. sites Area (ha) No. sites Area (ha) No. sites Area (ha)
GFS1
Quaternary sediments 283 6369.0 423 4366.1 456 42704.8
GFS2
Scoria and stony rises 50 418.5 58 266.6 169 1291.9
GFS 3
Highlands gravel caps 8 15.0 70 290.4 0 0
GFS4
Heytesbury Marls 9 79.2 116 148.8 2 2.2
GFS5
Gerangamete Marls 39 126.4 91 455.8 8 49.5
GFS6
Otway Group (Barrabool
Hills)
8 8.1 23 27.6 2 17.3
GFS7
Palaeozoic granitic rocks 11 23.5 54 287.7 0 0
GFS8
Older Volcanics 1 0.04 0 0 0 0
GFS9
Otway Group rocks
(Otway Range)
0 0 6 4.5 0 0
GFS10
Pliocene sands 119 771.5 139 373.7 51 478.5
GFS11
Wiridjil Gravel and
equivalents
0 0 1 17.5 0 0
GFS12
Palaeozoic sedimentary
rocks
11 6.0 157 426.9 0 0
GFS13
Central Highlands volcanic
rocks
30 133.5 75 272.0 0 0
GFS14 - Volcanic Plains
basalt 92 966.5 106 836.2 60 731.0
GFS15
Subsurface Deep Leads
(subsurface unit)
n/a n/a n/a n/a n/a n/a
GFS16
Port Campbell Limestone 8 125.1 37 48.0 4 15.0
GFS17
Dilwyn Formation 7 104.6 61 244.0 1 240.7

Salinity Risk in the Corangamite Region, Australia
Peter Dahlhaus 69
2.8 Development of research questions
The purpose of this chapter is to explore the extent of the available data and
assemble the sources of evidence that can be used to derive the holistic 'big
picture' for salinity processes in the Corangamite region. In undertaking this
collation, the extents, limitations and gaps in information and knowledge have
been clarified. In summary:
The available data on the Corangamite region includes high-resolution and
current datasets for topography, climate, geology, geomorphology, soils,
vegetation, land-use, stream hydrography, groundwater bores, and mapped
salinity. In addition to these scientific data, sufficient qualitative data is
available on the history of environmental change, salinity policy development
and investment, which are relevant when researching the salinity risk using a
systems thinking approach.
The geological framework and evolution of the broad-scale landscapes is well
researched and documented in government reports, scientific literature, and
peer-reviewed scientific papers. The region's geology has been used as the
basis for the broad-scale hydrogeological frameworks developed to date
(Dahlhaus et al. 2002a; Leonard 2003; Gill 2009).
Aspects of the hydrogeology of the Corangamite region have been investigated
in numerous (estimated >200) government surveys and consultancies which are
documented in unpublished reports, government documents and conference
papers (including some by this author). By comparison, there are a small
number (estimated <10) of hydrogeological papers published in peer-reviewed
journals. The majority of previous work has been focused on specific issues,
problems or sites, with the emphasis on groundwater resource management,
rather than salinity management.
Salinity has been well documented as an issue in the Corangamite region.
Since the late 1980s, the extent of salinity and its impacts on economic,
environmental and social assets is recorded in policy documents accepted by
the Federal and State governments. Salinity has been universally regarded as a
threatening process, although there is scant published peer-reviewed science on

Salinity Risk in the Corangamite Region, Australia
Peter Dahlhaus 70
the extents of the threats or the risk to assets. The few peer-reviewed published
scientific papers on salinity processes have largely been in relation to the saline
wetlands, especially their limnology, palaeolimnology, chemistry and ecology.
In the majority of the previous investigations, the causes of salinity in the
Corangamite region have been assumed, with salinity process models adopted
from research in other regions of Australia. Although land use change has
been assumed as the cause of salinity, none of the previous studies have
examined the relationship between the environmental history and salinity
processes. The numerous investigations on the causes of salinity in the region
have adopted reductionist methods at a site scale, with none published in peer-
reviewed scientific journals.
The extent of the available data (both quantitative and qualitative), and the gaps in
the previous research (inside and outside the scientific domain), influence the
research questions of this thesis. The three principal questions that emerge are:
1) Are the assumed causes of salinity valid in the Corangamite region?
The relationship between widespread land-use change and the onset of
salinity has not been tested in the Corangamite region. In particular, that
the clearing of native vegetation has resulted in rising saline groundwater
has been assumed from the research conducted in Western Australia (e.g.
Wood 1924; Peck and Williamson 1987) or the Murray Darling Basin (e.g.
Macumber 1991). The validity of this assumption is tested for the entire
Corangamite region using evidence drawn from a variety of scientific and
non-scientific sources in Chapter 3.
2) Are the assumed processes for secondary salinisation valid?
In policy documents and previous investigations in the Corangamite
region, the assumed cause of the secondary salinity threat to assets is the
hydrologic response of groundwater levels following widespread land-use
change. Government investment is based on this assumption (i.e. the GFS
framework) and therefore remedial actions are based on restoring
hydrologic equilibrium (CoAG 2000). The validity of this assumption is
tested for two areas in the Corangamite region: one where agricultural land

Salinity Risk in the Corangamite Region, Australia
Peter Dahlhaus 71
assets are threatened (the Pittong region, Chapter 4); and the other where
urban water resources are threatened by stream salinity (the West
Moorabool River catchment, Chapter 5).
3) Is the salinity threat and risk to assets valid?
The salinity threat in the Corangamite region has always been assumed,
but it could be argued that some salinity may also be an asset. This is
implicit from the limnological and ecological (peer-reviewed) research on
the wetlands. Williams (1995) argues that it is the rate of change of
salinity in Lake Corangamite that threatens its ecological value, not the
salinity itself. In fact, a certain range of salinity is essential for the health
of the Ramsar wetlands, regarded as the region's foremost assets (CCMA
2003). The question of salinity risk is explored in Chapter 6.