prof. ian giddy new york university estimating and reducing the cost of capital dbs bank
Post on 20-Dec-2015
218 views
TRANSCRIPT

Prof. Ian GiddyNew York University
Estimating and ReducingThe Cost of Capital
DBS Bank

Copyright ©2000 Ian H. Giddy Cost of Capital 2
PT Astra International
?

Copyright ©2000 Ian H. Giddy Cost of Capital 3
New Equity for Astra
What investors?Portfolio investorsFinancial investorsCorporate investors
What returns should they expect?= Risk-free rate+ Corporate risk+ Financial risk (leverage/debt mismatch)+ “Agency cost” premium+ Country risk
What restructuring?

Copyright ©2000 Ian H. Giddy Cost of Capital 4
Measuring the Cost of Capital
Cost of funding equal return that investors expect
Expected returns depend on the risks investors face (risk must be taken in context)
Cost of capitalCost of equityCost of debtWeighted average (WACC)

Copyright ©2000 Ian H. Giddy Cost of Capital 5
A $1 Investment in Different Types of Portfolios: 1926-1996
0.1
1
10
100
1000
10000
1925 1935 1945 1955 1965 1975 1985 1995
Index ($)
$4,495.99
$33.73
$13.54$8.85
$1,370.95
Small Company Stocks
Large Company Stocks
Long-Term Government Bonds
Treasury BillsInflation Year-End

Copyright ©2000 Ian H. Giddy Cost of Capital 6
Equity Risk
The risk (variance) on any individual investment can be broken down into two sources. Some of the risk is specific to the firm, and is called firm-specific, whereas the rest of the risk is market wide and affects all investments.
The risk faced by a firm can be fall into the following categories – (1) Project-specific; an individual project may have higher or lower cash
flows than expected. (2) Competitive Risk, which is that the earnings and cash flows on a project
can be affected by the actions of competitors. (3) Industry-specific Risk, which covers factors that primarily impact the
earnings and cash flows of a specific industry. (4) International Risk, arising from having some cash flows in currencies
other than the one in which the earnings are measured and stock is priced (5) Market risk, which reflects the effect on earnings and cash flows of
macro economic factors that essentially affect all companies

Copyright ©2000 Ian H. Giddy Cost of Capital 7
Equity versus Bond Risk
Uncertain
value
of future
cash flows
Uncertain
value
of future
cash flows
Contractual int. & principal
No upside
Senior claims
Control via restrictions
Contractual int. & principal
No upside
Senior claims
Control via restrictions
Assets Liabilities
Debt
Residual payments
Upside and downside
Residual claims
Voting control rights
Residual payments
Upside and downside
Residual claims
Voting control rights
Equity

Copyright ©2000 Ian H. Giddy Cost of Capital 8
Corporate Cash Flow Valuation: The Steps
Estimate the discount rate or rates to use in the valuation Discount rate can be either a cost of equity (if doing equity
valuation) or a cost of capital (if valuing the firm) Discount rate can be in nominal terms or real terms, depending
upon whether the cash flows are nominal or real Discount rate can vary across time.
Estimate the current earnings and cash flows on the asset, to either equity investors (CF to Equity) or to all claimholders (CF to Firm)
Estimate the future earnings and cash flows on the asset being valued, generally by estimating an expected growth rate in earnings.
Estimate when the firm will reach “stable growth” and what characteristics (risk & cash flow) it will have when it does.
Choose the right DCF model for this asset and value it.

Copyright ©2000 Ian H. Giddy Cost of Capital 9
Cashflow to FirmEBIT (1-t)- (Cap Ex - Depr)- Change in WC= FCFF
Expected GrowthReinvestment Rate* Return on Capital
FCFF1 FCFF2 FCFF3 FCFF4 FCFF5
Forever
Firm is in stable growth:Grows at constant rateforever
Terminal Value= FCFF n+1/(r-gn)
FCFFn.........
Cost of Equity Cost of Debt(Riskfree Rate+ Default Spread) (1-t)
WeightsBased on Market Value
Discount at WACC= Cost of Equity (Equity/(Debt + Equity)) + Cost of Debt (Debt/(Debt+ Equity))
Value of Operating Assets+ Cash & Non-op Assets= Value of Firm- Value of Debt= Value of Equity
Riskfree Rate :- No default risk- No reinvestment risk- In same currency andin same terms (real or nominal as cash flows
+Beta- Measures market risk X
Risk Premium- Premium for averagerisk investment
Type of Business
Operating Leverage
FinancialLeverage
Base EquityPremium
Country RiskPremium
DISCOUNTED CASHFLOW VALUATION

Copyright ©2000 Ian H. Giddy Cost of Capital 10
Let’s Start With the Cost of Debt
The cost of debt is the market interest rate that the firm has to pay on its borrowing. It will depend upon three components-(a) The general level of interest rates(b) The default premium(c) The firm's tax rate

Copyright ©2000 Ian H. Giddy Cost of Capital 11
What the Cost of Debt Is and Is Not…
The cost of debt isthe rate at which the company can borrow
at todaycorrected for the tax benefit it gets for
interest payments.
Cost of debt =k
d = LT Borrowing Rate(1 - Tax rate)
The cost of debt is not the interest rate at which the company
obtained the debt it has on its books.

Copyright ©2000 Ian H. Giddy Cost of Capital 12
Estimating the Cost of Debt
If the firm has bonds outstanding, and the bonds are traded, the yield to maturity on a long-term, straight (no special features) bond can be used as the interest rate.
If the firm is rated, use the rating and a typical default spread on bonds with that rating to estimate the cost of debt.
If the firm is not rated, and it has recently borrowed long term from a bank, use the interest
rate on the borrowing or estimate a synthetic rating for the company, and use the synthetic
rating to arrive at a default spread and a cost of debt The cost of debt has to be estimated in the same currency as
the cost of equity and the cash flows in the valuation.

Copyright ©2000 Ian H. Giddy Cost of Capital 13
Estimating Synthetic Ratings
The rating for a firm can be estimated using the financial characteristics of the firm. In its simplest form, the rating can be estimated from the interest coverage ratio
Interest Coverage Ratio = EBIT/Interest Expenses
For Siderar, for instance Interest Coverage Ratio = 161/48 = 3.33Based upon the relationship between interest coverage
ratios and ratings, we would estimate a rating of A- for Siderar.
Given the rating of A-, default spread is 1.25%

Copyright ©2000 Ian H. Giddy Cost of Capital 14
Interest Coverage Ratios, Ratings and Default Spreads
If Interest Coverage Ratio is Estimated Bond Rating Default Spread
> 8.50 AAA 0.20%6.50 - 8.50 AA 0.50%5.50 - 6.50 A+ 0.80%4.25 - 5.50 A 1.00%3.00 - 4.25 A– 1.25%2.50 - 3.00 BBB 1.50%2.00 - 2.50 BB 2.00%1.75 - 2.00 B+ 2.50%1.50 - 1.75 B 3.25%1.25 - 1.50 B – 4.25%0.80 - 1.25 CCC 5.00%0.65 - 0.80 CC 6.00%0.20 - 0.65 C 7.50%< 0.20 D 10.00%

Copyright ©2000 Ian H. Giddy Cost of Capital 15
Other Factors Affecting RatiosMedians of Key Ratios : 1993-1995
AAA AA A BBB BB B CCCPretax Interest Coverage 13.50 9.67 5.76 3.94 2.14 1.51 0.96
EBITDA Interest Coverage 17.08 12.80 8.18 6.00 3.49 2.45 1.51Funds from Operations / Total Debt
(%) 98.2% 69.1% 45.5% 33.3% 17.7% 11.2% 6.7%
Free Operating Cashflow/ TotalDebt (%) 60.0% 26.8% 20.9% 7.2% 1.4% 1.2% 0.96%
Pretax Return on Permanent Capital(%) 29.3% 21.4% 19.1% 13.9% 12.0% 7.6% 5.2%
Operating Income/Sales (%) 22.6% 17.8% 15.7% 13.5% 13.5% 12.5% 12.2%Long Term Debt/ Capital 13.3% 21.1% 31.6% 42.7% 55.6% 62.2% 69.5%Total Debt/Capitalization 25.9% 33.6% 39.7% 47.8% 59.4% 67.4% 69.1%

Copyright ©2000 Ian H. Giddy Cost of Capital 16
Estimating Siderar’s Cost of Debt (in $)
Riskfree Rate = 6% Country default spread = 5.25% (Argentine
default spread) I am assuming that all Argentine companies have
to pay at least this spread. Rating for Siderar = A- Default spread = 1.25% Pre-tax cost of borrowing for first 5 years= 6%
+ 5.25% + 1.25% = 12.50% Pre-tax cost of borrowing after 5 years = 6%
+ 2.5% + 1.25% = 9.75%
Copyright ©2000 Ian H. Giddy Cost of Capital 17
The Cost of Equity
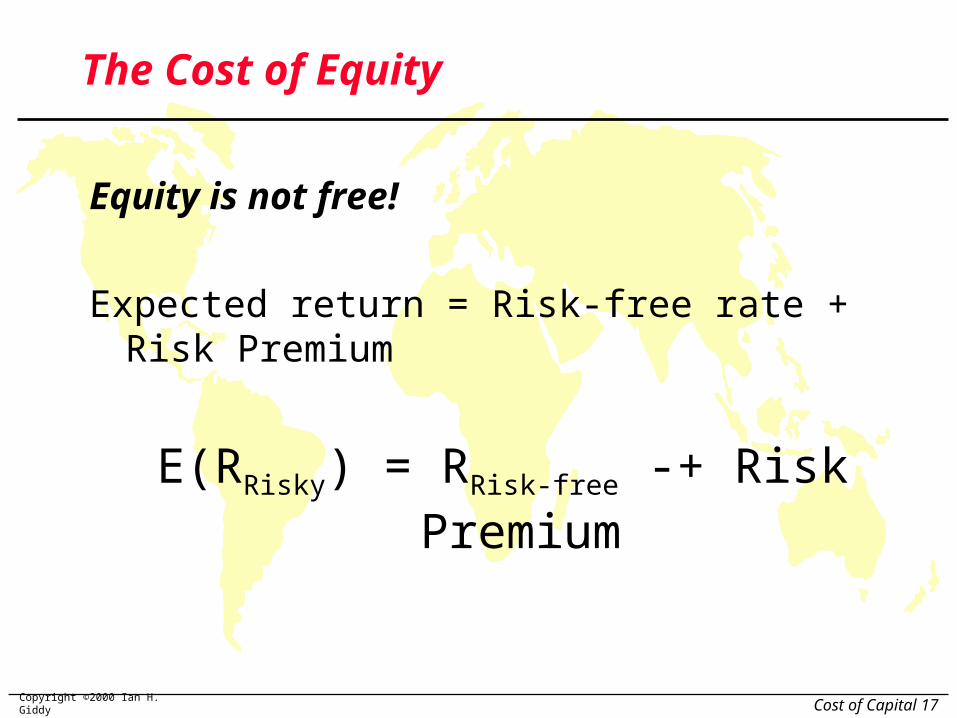
Equity is not free!
Expected return = Risk-free rate + Risk Premium
E(RRisky) = RRisk-free -+ Risk Premium

Copyright ©2000 Ian H. Giddy Cost of Capital 18
The Cost of Equity
Consider the standard approach to estimating cost of equity:
Cost of Equity = Rf + Equity Beta * (E(Rm) - Rf)where,
Rf = Riskfree rate
E(Rm) = Expected Return on the Market Index (Diversified Portfolio)
In practice, Short term government security rates are used as risk free rates Historical risk premiums are used for the risk premium Betas are estimated by regressing stock returns against market
returns

Copyright ©2000 Ian H. Giddy Cost of Capital 19
Private Business: Owner hasall his wealth invested in thebusiness
Venture Capitalist: Haswealth invested in a numberof companies in one sector
Publicly traded companywith investors who are diversified domesticallyorIPO to investors who aredomestically diversified
Publicly traded companywith investors who are diverisified globallyorIPO to global investors
Market Risk
Int’nl Risk
Sector Risk
Competitive Risk
Project Risk
Market Risk
Int’nl Risk
Sector Risk
Competitive Risk
Project Risk
Market Risk
Int’nl Risk
Sector Risk
Competitive Risk
Project Risk
Market Risk
Int’nl Risk
Sector Risk
Competitive Risk
Project Risk
TotalRisk
Risk added to sectorportfolio
Risk added to domestic portfolio
Risk added to global portfolio
StandardDeviation
Beta relative to sector
Beta relative to local index
Beta relative to global index
40%
25%
15%
10%
100/.4=250
100/.25=400
100/.15=667
100/.10=1000
Investor Type Cares about Risk Measure Cost ofEquity
Firm Value
Valuing a Firm from Different Risk PerspectivesFirm is assumed to have a cash flow of 100 each year forever.

Copyright ©2000 Ian H. Giddy Cost of Capital 20
Short Term Governments are Not Risk Free
On a riskfree asset, the actual return is equal to the expected return. Therefore, there is no variance around the expected return.
For an investment to be riskfree, then, it has to have No default risk No reinvestment risk
Match the duration of the analysis (generally long term) to the duration of the riskfree rate (also long term)
In emerging markets, there are two problems: The government might not be viewed as riskfree (Brazil,
Indonesia) There might be no market-based long term government rate
(China)

Copyright ©2000 Ian H. Giddy Cost of Capital 21
Estimating a Riskfree Rate
Estimate a range for the riskfree rate in local terms: Upper limit: Obtain the rate at which the largest, safest firms
in the country borrow at and use as the riskfree rate. Lower limit: Use a local bank deposit rate as the riskfree rate
Do the analysis in real terms (rather than nominal terms) using a real riskfree rate, which can be obtained in one of two ways – from an inflation-indexed government bond, if one exists set equal, approximately, to the long term real growth rate of
the economy in which the valuation is being done.
Do the analysis in another more stable currency, say US dollars.

Copyright ©2000 Ian H. Giddy Cost of Capital 22
Everyone uses historical premiums, but..
The historical premium is the premium that stocks have historically earned over riskless securities.
Practitioners never seem to agree on the premium; it is sensitive to How far back you go in history… Whether you use T.bill rates or T.Bond rates Whether you use geometric or arithmetic averages.
For instance, looking at the US:
Historical period Stocks - T.Bills Stocks - T.Bonds
Arith Geom Arith Geom
1926-1998 8.76% 6.95% 7.57% 5.91%
1962-1998 5.74% 4.63% 5.16% 4.46%
1981-1998 10.34% 9.72% 9.22% 8.02%

Copyright ©2000 Ian H. Giddy Cost of Capital 23
If you choose to use historical premiums….
Go back as far as you can. A risk premium comes with a standard error. Given the annual standard deviation in stock prices is about 25%, the standard error in a historical premium estimated over 25 years is roughly:
Standard Error in Premium = 25%/√25 = 25%/5 = 5% Be consistent in your use of the riskfree rate. Since we argued
for long term bond rates, the premium should be the one over TreasuryBonds
Use the geometric risk premium. It is closer to how investors think about risk premiums over long periods.
Never use historical risk premiums estimated over short periods.
For emerging markets, start with the base historical premium in the US and add a country spread, based upon the country rating and the relative equity market volatility.
Copyright ©2000 Ian H. Giddy Cost of Capital 24
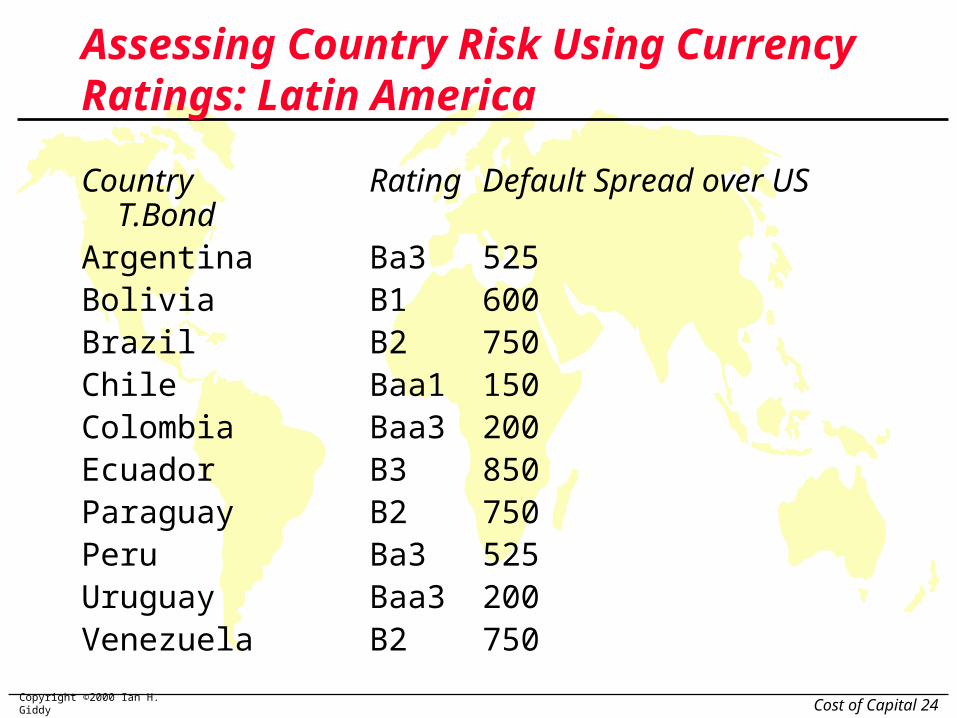
Assessing Country Risk Using Currency Ratings: Latin America
Country Rating Default Spread over US T.Bond
Argentina Ba3 525Bolivia B1 600Brazil B2 750Chile Baa1 150Colombia Baa3 200Ecuador B3 850Paraguay B2 750Peru Ba3 525Uruguay Baa3 200Venezuela B2 750

Copyright ©2000 Ian H. Giddy Cost of Capital 25
Using Country Ratings to Estimate Equity Spreads Country ratings measure default risk. While default
risk premiums and equity risk premiums are highly correlated, one would expect equity spreads to be higher than debt spreads. One way to adjust the country spread upwards is to use
information from the US market. In the US, the equity risk premium has been roughly twice the default spread on junk bonds.
Another is to multiply the bond spread by the relative volatility of stock and bond prices in that market. For example,
Standard Deviation in Merval (Equity) = 42.87% Standard Deviation in Argentine Long Bond = 21.37% Adjusted Equity Spread = 5.25% (42.87/21.37) = 10.53%
Ratings agencies make mistakes. They are often late in recognizing and building in risk.

Copyright ©2000 Ian H. Giddy Cost of Capital 26
Ratings Errors: Ratings for Asia
Country July 1997 Rating January 1998 RatingsChina BBB+ BBB+Indonesia BBB CCC+India BB+ BB+ Japan AAA AAASouth Korea AA- BB+ Malaysia A+ A- Pakistan B+ B-Philippines BB+ BB+Singapore AAA AAATaiwan AA+ AA+Thailand A BBB-

Copyright ©2000 Ian H. Giddy Cost of Capital 27
From Country Spreads to Risk Premiums
Approach 1: Assume that every company in the country is equally exposed to country risk. In this case,
E(Return) = Riskfree Rate + Country Spread + Beta (US premium)Implicitly, this is what you are assuming when you use the local
Government’s dollar borrowing rate as your riskfree rate. Approach 2: Assume that a company’s exposure to country risk
is similar to its exposure to other market risk.
E(Return) = Riskfree Rate + Beta (US premium + Country Spread) Approach 3: Treat country risk as a separate risk factor and
allow firms to have different exposures to country risk (perhaps based upon the proportion of their revenues come from non-domestic sales)
E(Return)=Riskfree Rate+ (US premium) + Country Spread)

Copyright ©2000 Ian H. Giddy Cost of Capital 28
Estimating Exposure to Country Risk
Different companies should be exposed to different degrees to country risk. For instance, an Argentinan firm that generates the bulk of its revenues in North America should be less exposed to country risk in Argentina than one that generates all its business within Argentina.
The factor “” measures the relative exposure of a firm to country risk. One simplistic solution would be to do the following:
% of revenues domesticallyfirm/ % of revenues domesticallyavg
firm
For instance, if a firm gets 35% of its revenues domestically while the average firm in that market gets 70% of its revenues domestically
35%/ 70 % = 0.5 There are two implications
A company’s risk exposure is determined by where it does business and not by where it is located
Firms might be able to actively manage their country risk exposures

Copyright ©2000 Ian H. Giddy Cost of Capital 29
Estimating E(Return) for Siderar
Assume that the beta for Siderar is 0.71, and that the riskfree rate used is 6.00%. (US Long Term Bond rate)
Approach 1: Assume that every company in the country is equally exposed to country risk. In this case,
E(Return) = 6.00% + 10.53% + 0.71 (5.5%) = 20.44% Approach 2: Assume that a company’s exposure to country risk
is similar to its exposure to other market risk.E(Return) = 6.00% + 0.71 (5.5%+ 10.53%) = 17.38% Approach 3: Treat country risk as a separate risk factor and
allow firms to have different exposures to country risk (perhaps based upon the proportion of their revenues come from non-domestic sales)
E(Return)=6.00% + (5.5%) + 10.53%) = 21.49%In 1998, Siderar got 76.3% of its revenues from Argentina. The
average across all Argentinan firms is closer to 70%.

Copyright ©2000 Ian H. Giddy Cost of Capital 30
Estimating Beta
The standard procedure for estimating betas is to regress stock returns (Rj) against market returns (Rm) -
Rj = a + b Rm
where a is the intercept and b is the slope of the regression. The slope of the regression corresponds to the beta
of the stock, and measures the riskiness of the stock. This beta has three problems:
It has high standard error It reflects the firm’s business mix over the period of the
regression, not the current mix It reflects the firm’s average financial leverage over the
period rather than the current leverage.

Copyright ©2000 Ian H. Giddy Cost of Capital 31
Beta Estimation: The Old Fashioned Way

Copyright ©2000 Ian H. Giddy Cost of Capital 32
Determinants of Betas
Product or Service: The beta value for a firm depends upon the sensitivity of the demand for its products and services and of its costs to macroeconomic factors that affect the overall market. Cyclical companies have higher betas than non-cyclical firms Firms which sell more discretionary products will have higher betas
than firms that sell less discretionary products Operating Leverage: The greater the proportion of fixed costs
in the cost structure of a business, the higher the beta will be of that business. This is because higher fixed costs increase your exposure to all risk, including market risk.
Financial Leverage: The more debt a firm takes on, the higher the beta will be of the equity in that business. Debt creates a fixed cost, interest expenses, that increases exposure to market risk.

Copyright ©2000 Ian H. Giddy Cost of Capital 33
•Business Risk
Consider an investment in Tiffany’s. What kind of beta do you think this investment will have?
Much higher than one Close to one Much lower than one

Copyright ©2000 Ian H. Giddy Cost of Capital 34
•Measures of Operating Leverage
Fixed Costs Measure = Fixed Costs / Variable Costs
This measures the relationship between fixed and variable costs. The higher the proportion, the higher the operating leverage.
EBIT Variability Measure = % Change in EBIT / % Change in Revenues
This measures how quickly the earnings before interest and taxes changes as revenue changes. The higher this number, the greater the operating leverage.
Copyright ©2000 Ian H. Giddy Cost of Capital 35
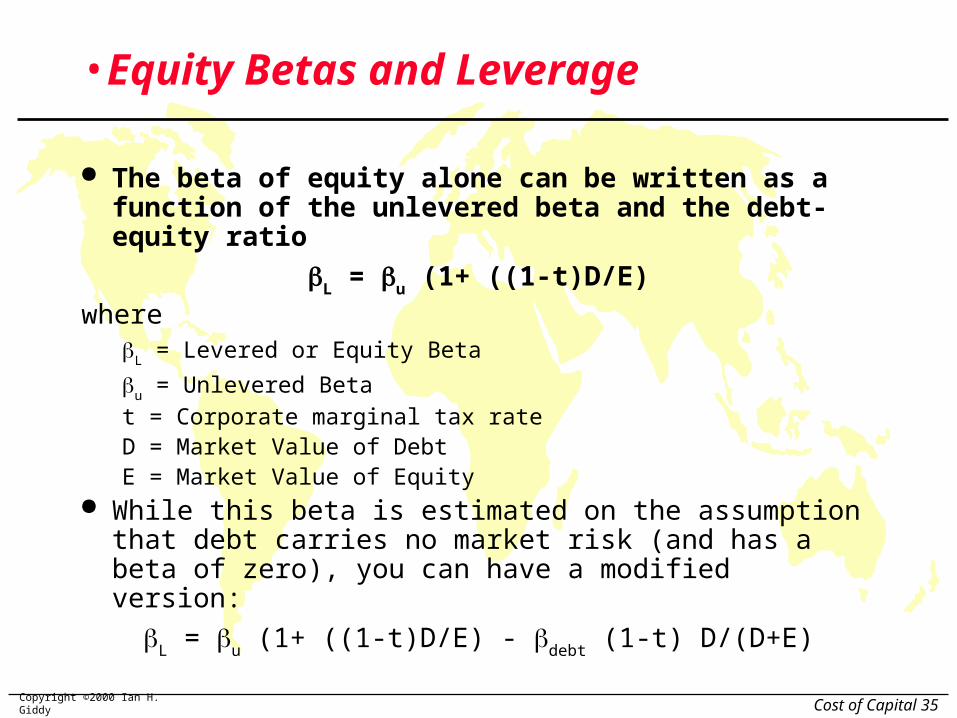
•Equity Betas and Leverage
The beta of equity alone can be written as a function of the unlevered beta and the debt-equity ratio
L =
u (1+ ((1-t)D/E)
where
L = Levered or Equity Beta
u = Unlevered Beta
t = Corporate marginal tax rateD = Market Value of DebtE = Market Value of Equity
While this beta is estimated on the assumption that debt carries no market risk (and has a beta of zero), you can have a modified version:
L =
u (1+ ((1-t)D/E) -
debt (1-t) D/(D+E)

Copyright ©2000 Ian H. Giddy Cost of Capital 36
Solutions to the Regression Beta Problem
Modify the regression beta by changing the index used to estimate the beta adjusting the regression beta estimate, by bringing in information
about the fundamentals of the company Estimate the beta for the firm using
the standard deviation in stock prices instead of a regression against an index.
accounting earnings or revenues, which are less noisy than market prices.
Estimate the beta for the firm from the bottom up without employing the regression technique. This will require understanding the business mix of the firm estimating the financial leverage of the firm
Use an alternative measure of market risk that does not need a regression.

Copyright ©2000 Ian H. Giddy Cost of Capital 37
The Solution: Bottom-up Betas
The bottom up beta can be estimated by : Taking a weighted (by sales or operating income) average of the
unlevered betas of the different businesses a firm is in.
(The unlevered beta of a business can be estimated by looking at other firms in the same business)
Lever up using the firm’s debt/equity ratio
The bottom up beta will give you a better estimate of the true beta when It has lower standard error (SEaverage = SEfirm / √n (n = number of
firms) It reflects the firm’s current business mix and financial leverage It can be estimated for divisions and private firms.
j
j 1
j k
Operating Income j
Operating Income Firm
levered unlevered 1 (1 tax rate) (Current Debt/Equity Ratio)

Copyright ©2000 Ian H. Giddy Cost of Capital 38
Siderar’s Bottom-up Beta
Business Unlevered D/E Ratio Levered Riskfree Risk Cost of
Beta Beta Rate Premium Equity
Steel 0.68 5.97% 0.71 6.00% 16.03% 17.38%
Proportion of operating income from steel = 100%
Levered Beta for Siderar= 0.71
Assume now that Siderar decides to go into the retailing business, and that the unlevered beta for that business is 1.15. Assuming that 25% of Siderar’s business looking forward will come from this business, what will the firm’s beta be?

Copyright ©2000 Ian H. Giddy Cost of Capital 39
The Weighted Average Cost of Capital
The weights used to compute the cost of capital should be the market value weights for debt and equity.
There is an element of circularity that is introduced into every valuation by doing this, since the values that we attach to the firm and equity at the end of the analysis are different from the values we gave them at the beginning.
As a general rule, the debt that you should subtract from firm value to arrive at the value of equity should be the same debt that you used to compute the cost of capital.

Copyright ©2000 Ian H. Giddy Cost of Capital 40
The Cost of Capital
Choice Cost1. Equity Cost of equity
- Retained earnings - depends upon riskiness of the stock
- New stock issues - will be affected by level of interest rates
- Warrants
Cost of equity = riskless rate + beta * risk premium
2. Debt Cost of debt
- Bank borrowing - depends upon default risk of the firm
- Bond issues - will be affected by level of interest rates
- provides a tax advantage because interest is tax-deductible
Cost of debt = Borrowing rate (1 - tax rate)
Debt + equity = Cost of capital = Weighted average of cost of equity and
Capital cost of debt; weights based upon market value.
Cost of capital = kd [D/(D+E)] + ke [E/(D+E)]

Copyright ©2000 Ian H. Giddy Cost of Capital 41
Estimating Cost of Capital: Siderar
EquityCost of Equity = 6.00% + 0.71 (16.03%) = 17.38%Market Value of Equity = 3.20* 310.89 = 995 million
(94.37%) Debt
Cost of debt = 6.00% + 5.25% + 1.25% (default spread) = 12.5%
Market Value of Debt = 59 Mil (5.63%) Cost of CapitalCost of Capital = 17.38%(.9437) + 12.5%(1-.3345)(.0563))
= 17.38%(.9437) + 8.32%(.0563) = 16.87%

Copyright ©2000 Ian H. Giddy Cost of Capital 42
Next, Minimize the Cost of Capital by Changing the Financial Mix
The first step in reducing the cost of capital is to change the mix of debt and equity used to finance the firm.
Debt is always cheaper than equity, partly because it lenders bear less risk and partly because of the tax advantage associated with debt.
But taking on debt increases the risk (and the cost) of both debt (by increasing the probability of bankruptcy) and equity (by making earnings to equity investors more volatile).
The net effect will determine whether the cost of capital will increase or decrease if the firm takes on more or less debt.

Copyright ©2000 Ian H. Giddy Cost of Capital 43
This is What We’re Trying to Do
D/(D+E) ke kd After-tax Cost of Debt WACC
0 10.50% 8% 4.80% 10.50%
10% 11% 8.50% 5.10% 10.41%
20% 11.60% 9.00% 5.40% 10.36%
30% 12.30% 9.00% 5.40% 10.23%
40% 13.10% 9.50% 5.70% 10.14%
50% 14% 10.50% 6.30% 10.15%
60% 15% 12% 7.20% 10.32%
70% 16.10% 13.50% 8.10% 10.50%
80% 17.20% 15% 9.00% 10.64%
90% 18.40% 17% 10.20% 11.02%
100% 19.70% 19% 11.40% 11.40%

Copyright ©2000 Ian H. Giddy Cost of Capital 44
Cost of Capital and Leverage: Method
Estimated Beta
With current leverage
From regression
Unlevered Beta
With no leverage
Bu=Bl/(1+D/E(1-T))
Levered Beta
With different leverage
Bl=Bu(1+D/E(1-T))
Cost of equity
With different leverage
E(R)=Rf+Bl(Rm-Rf)
Equity
Leverage, EBITDA
And interest cost
Interest Coverage
EBITDA/Interest
Rating
(other factors too!)
Cost of debt
With different leverage
Rate=Rf+Spread+?
Debt

Copyright ©2000 Ian H. Giddy Cost of Capital 45
Siderar: Optimal Debt Ratio
Debt Ratio Beta Cost of Equity Bond Rating Interest rate on debt Tax Rate Cost of Debt (after-tax) WACC Firm Value (G)0% 0.68 16.95% AAA 11.55% 33.45% 7.69% 16.95% $1,046
10% 0.73 17.76% AA 11.95% 33.45% 7.95% 16.78% $1,06420% 0.80 18.77% A- 12.75% 33.45% 8.49% 16.71% $1,07130% 0.88 20.07% B+ 14.25% 33.45% 9.48% 16.90% $1,05240% 0.99 21.81% B- 16.25% 33.45% 10.81% 17.41% $1,00150% 1.14 24.24% CCC 17.25% 33.45% 11.48% 17.86% $96160% 1.44 29.16% CC 18.75% 25.67% 13.94% 20.02% $80370% 1.95 37.29% C 20.25% 20.38% 16.12% 22.47% $67480% 2.93 52.94% C 20.25% 17.83% 16.64% 23.90% $61590% 5.86 99.87% C 20.25% 15.85% 17.04% 25.32% $565
Question: If Siderar’s current debt ratio is 60%, what do you recommend?

Copyright ©2000 Ian H. Giddy Cost of Capital 46
Siderar: Optimal Debt Ratio
Debt Ratio Beta Cost of Equity Bond Rating Interest rate on debt Tax Rate Cost of Debt (after-tax) WACC Firm Value (G)0% 0.68 16.95% AAA 11.55% 33.45% 7.69% 16.95% $1,046
10% 0.73 17.76% AA 11.95% 33.45% 7.95% 16.78% $1,06420% 0.80 18.77% A- 12.75% 33.45% 8.49% 16.71% $1,07130% 0.88 20.07% B+ 14.25% 33.45% 9.48% 16.90% $1,05240% 0.99 21.81% B- 16.25% 33.45% 10.81% 17.41% $1,00150% 1.14 24.24% CCC 17.25% 33.45% 11.48% 17.86% $96160% 1.44 29.16% CC 18.75% 25.67% 13.94% 20.02% $80370% 1.95 37.29% C 20.25% 20.38% 16.12% 22.47% $67480% 2.93 52.94% C 20.25% 17.83% 16.64% 23.90% $61590% 5.86 99.87% C 20.25% 15.85% 17.04% 25.32% $565
0
200
400
600
800
1000
1200
0% 20% 40% 60% 80% 100%
Debt Percentage
Va
lue
($
mil
lio
ns
)
0.00%
5.00%
10.00%
15.00%
20.00%
25.00%
30.00%
0% 20% 40% 60% 80% 100%
Debt Percentage
Co
st
of
Ca
pit
al

Copyright ©2000 Ian H. Giddy Cost of Capital 47
Case Study: Nokia 2000

Copyright ©2000 Ian H. Giddy Cost of Capital 48
A Framework for Getting to the Optimal
Is the actual debt ratio greater than or lesser than the optimal debt ratio?
Actual > OptimalOverlevered
Actual < OptimalUnderlevered
Is the firm under bankruptcy threat? Is the firm a takeover target?
Yes No
Reduce Debt quickly1. Equity for Debt swap2. Sell Assets; use cashto pay off debt3. Renegotiate with lenders
Does the firm have good projects?ROE > Cost of EquityROC > Cost of Capital
YesTake good projects withnew equity or with retainedearnings.
No1. Pay off debt with retainedearnings.2. Reduce or eliminate dividends.3. Issue new equity and pay off debt.
Yes No
Does the firm have good projects?ROE > Cost of EquityROC > Cost of Capital
YesTake good projects withdebt.
No
Do your stockholders likedividends?
YesPay Dividends No
Buy back stock
Increase leveragequickly1. Debt/Equity swaps2. Borrow money&buy shares.

Copyright ©2000 Ian H. Giddy Cost of Capital 52
AppendixMinimizing the Cost of Capital: Example
Weighted Average Cost of Capital and Debt Ratios
Debt Ratio
WA
CC
9.40%9.60%9.80%
10.00%10.20%10.40%10.60%10.80%11.00%11.20%11.40%
0
10%
20%
30%
40%
50%
60%
70%
80%
90%
100%

Copyright ©2000 Ian H. Giddy Cost of Capital 53
Optimum Capital Structure and Cost of Capital
If the cash flows to the firm are held constant, and the cost of capital is minimized, the value of the firm will be maximized.

Copyright ©2000 Ian H. Giddy Cost of Capital 54
Applying Approach: The Textbook Example
D/(D+E) ke kd After-tax Cost of Debt WACC
0 10.50% 8% 4.80% 10.50%
10% 11% 8.50% 5.10% 10.41%
20% 11.60% 9.00% 5.40% 10.36%
30% 12.30% 9.00% 5.40% 10.23%
40% 13.10% 9.50% 5.70% 10.14%
50% 14% 10.50% 6.30% 10.15%
60% 15% 12% 7.20% 10.32%
70% 16.10% 13.50% 8.10% 10.50%
80% 17.20% 15% 9.00% 10.64%
90% 18.40% 17% 10.20% 11.02%
100% 19.70% 19% 11.40% 11.40%

Copyright ©2000 Ian H. Giddy Cost of Capital 55
WACC and Debt Ratios
Weighted Average Cost of Capital and Debt Ratios
Debt Ratio
WA
CC
9.40%9.60%9.80%
10.00%10.20%10.40%10.60%10.80%11.00%11.20%11.40%
0
10%
20%
30%
40%
50%
60%
70%
80%
90%
100%

Copyright ©2000 Ian H. Giddy Cost of Capital 56
Current Cost of Capital: Disney
Equity Cost of Equity = 13.85% Market Value of Equity = $50.88 Billion Equity/(Debt+Equity ) = 82%
Debt After-tax Cost of debt = 7.50% (1-.36) = 4.80% Market Value of Debt = $ 11.18 Billion Debt/(Debt +Equity) = 18%
Cost of Capital = 13.85%(.82)+4.80%(.18) = 12.22%

Copyright ©2000 Ian H. Giddy Cost of Capital 57
Mechanics of Cost of Capital Estimation
1. Estimate the Cost of Equity at different levels of debt: Equity will become riskier -> Beta will increase -> Cost of
Equity will increase.
Estimation will use levered beta calculation
2. Estimate the Cost of Debt at different levels of debt: Default risk will go up and bond ratings will go down as debt
goes up -> Cost of Debt will increase.
To estimating bond ratings, we will use the interest coverage ratio (EBIT/Interest expense)
3. Estimate the Cost of Capital at different levels of debt
4. Calculate the effect on Firm Value and Stock Price.
Copyright ©2000 Ian H. Giddy Cost of Capital 58
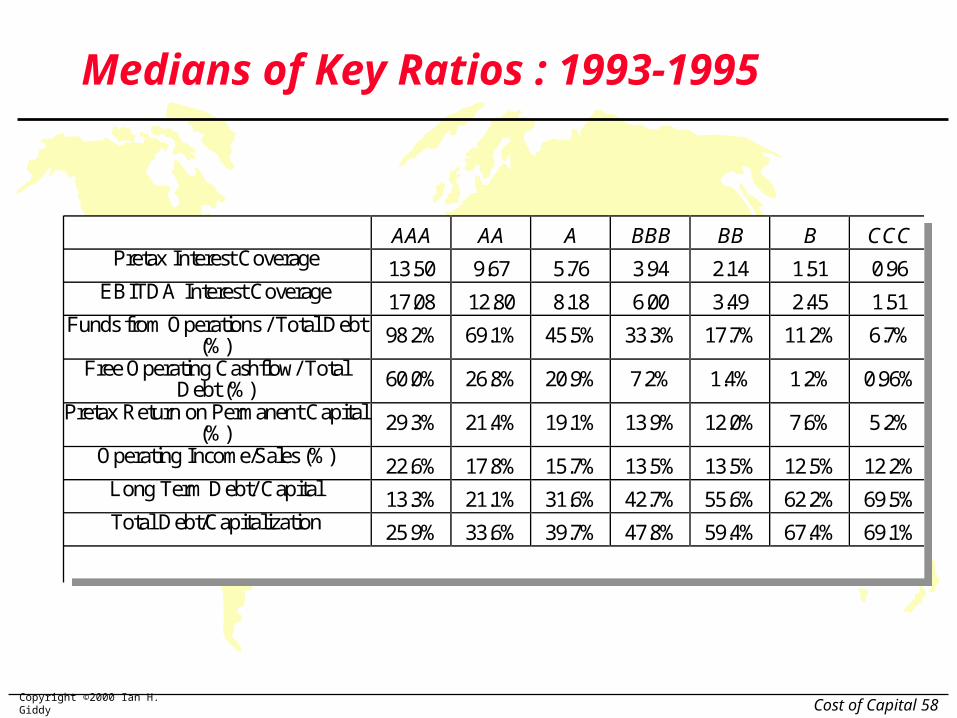
Medians of Key Ratios : 1993-1995
AAA AA A BBB BB B CCCPretax Interest Coverage 13.50 9.67 5.76 3.94 2.14 1.51 0.96
EBITDA Interest Coverage 17.08 12.80 8.18 6.00 3.49 2.45 1.51Funds from Operations / Total Debt
(%) 98.2% 69.1% 45.5% 33.3% 17.7% 11.2% 6.7%
Free Operating Cashflow/ TotalDebt (%) 60.0% 26.8% 20.9% 7.2% 1.4% 1.2% 0.96%
Pretax Return on Permanent Capital(%) 29.3% 21.4% 19.1% 13.9% 12.0% 7.6% 5.2%
Operating Income/Sales (%) 22.6% 17.8% 15.7% 13.5% 13.5% 12.5% 12.2%Long Term Debt/ Capital 13.3% 21.1% 31.6% 42.7% 55.6% 62.2% 69.5%Total Debt/Capitalization 25.9% 33.6% 39.7% 47.8% 59.4% 67.4% 69.1%

Copyright ©2000 Ian H. Giddy Cost of Capital 59
Process of Ratings and Rate Estimation
We use the median interest coverage ratios for large manufacturing firms to develop “interest coverage ratio” ranges for each rating class.
We then estimate a spread over the long term bond rate for each ratings class, based upon yields at which these bonds trade in the market place.

Copyright ©2000 Ian H. Giddy Cost of Capital 60
Interest Coverage Ratios and Bond Ratings
If Interest Coverage Ratio is Estimated Bond Rating> 8.50 AAA6.50 - 8.50 AA5.50 - 6.50 A+4.25 - 5.50 A3.00 - 4.25 A–2.50 - 3.00 BBB2.00 - 2.50 BB1.75 - 2.00 B+1.50 - 1.75 B1.25 - 1.50 B –0.80 - 1.25 CCC0.65 - 0.80 CC0.20 - 0.65 C< 0.20 D

Copyright ©2000 Ian H. Giddy Cost of Capital 61
Spreads Over Long Bond Rate for Ratings Classes
Rating Coverage gtSpreadAAA 0.20%AA 0.50%A+ 0.80%A 1.00%A- 1.25%BBB 1.50%BB 2.00%B+ 2.50%B 3.25%B- 4.25%CCC 5.00%CC 6.00%C 7.50%D 10.00%
Rating Coverage gtSpreadAAA 0.20%AA 0.50%A+ 0.80%A 1.00%A- 1.25%BBB 1.50%BB 2.00%B+ 2.50%B 3.25%B- 4.25%CCC 5.00%CC 6.00%C 7.50%D 10.00%

Copyright ©2000 Ian H. Giddy Cost of Capital 62
Current Income Statement for Disney: 1996
Revenues 18,739
-Operating Expenses 12,046
EBITDA 6,693
-Depreciation 1,134
EBIT 5,559
-Interest Expense 479
Income before taxes 5,080
-Taxes 847
Income after taxes 4,233 Interest coverage ratio= 5,559/479 = 11.61
(Amortization from Capital Cities acquisition not considered)

Copyright ©2000 Ian H. Giddy Cost of Capital 63
Estimating Cost of Equity
Current Beta = 1.25 Unlevered Beta = 1.09
Market premium = 5.5% T.Bond Rate = 7.00% t=36%Debt Ratio D/E Ratio Beta Cost of Equity
0% 0% 1.09 13.00%
10% 11% 1.17 13.43%
20% 25% 1.27 13.96%
30% 43% 1.39 14.65%
40% 67% 1.56 15.56%
50% 100% 1.79 16.85%
60% 150% 2.14 18.77%
70% 233% 2.72 21.97%
80% 400% 3.99 28.95%
90% 900% 8.21 52.14%

Copyright ©2000 Ian H. Giddy Cost of Capital 64
Disney: Beta, Cost of Equity and D/E Ratio
0.00
1.00
2.00
3.00
4.00
5.00
6.00
7.00
8.00
9.00
0% 10% 20% 30% 40% 50% 60% 70% 80% 90%
Debt Ratio
Be
ta
0.00%
10.00%
20.00%
30.00%
40.00%
50.00%
60.00%
Co
st
of
Eq
uit
y
BetaCost of Equity

Copyright ©2000 Ian H. Giddy Cost of Capital 65
Estimating Cost of Debt
D/(D+E) 0.00% 10.00% Calculation Details StepD/E 0.00% 11.11% = [D/(D+E)]/( 1 -[D/(D+E)])$ Debt $0 $6,207 = [D/(D+E)]* Firm Value 1
EBITDA $6,693 $6,693 Kept constant as debt changes.
Depreciation $1,134 $1,134 "EBIT $5,559 $5,559Interest $0 $447 = Interest Rate * $ Debt 2Taxable Income $5,559 $5,112 = OI - Depreciation - InterestTax $2,001 $1,840 = Tax Rate * Taxable IncomeNet Income $3,558 $3,272 = Taxable Income - Tax
Pre-tax Int. cov ∞ 12.44 = (OI - Deprec'n)/Int. Exp 3Likely Rating AAA AAA Based upon interest coverage 4Interest Rate 7.20% 7.20% Interest rate for given rating 5Eff. Tax Rate 36.00% 36.00% See notes on effective tax rate
After-tax kd 4.61% 4.61% =Interest Rate * (1 - Tax Rate)
Firm Value = 50,888+11,180= $62,068

Copyright ©2000 Ian H. Giddy Cost of Capital 66
The Ratings Table
If Interest Coverage Ratio is Estimated Bond Rating> 8.50 AAA
6.50 - 8.50 AA
5.50 - 6.50 A+
4.25 - 5.50 A
3.00 - 4.25 A–
2.50 - 3.00 BBB
2.00 - 2.50 BB
1.75 - 2.00 B+
1.50 - 1.75 B
1.25 - 1.50 B –
0.80 - 1.25 CCC
0.65 - 0.80 CC
0.20 - 0.65 C
< 0.20 D

Copyright ©2000 Ian H. Giddy Cost of Capital 67
Bond Ratings, Cost of Debt and Debt Ratios
WORKSHEET FOR ESTIMATING RATINGS/INTEREST RATESD/(D+E) 0.00% 10.00% 20.00% 30.00% 40.00% 50.00% 60.00% 70.00% 80.00% 90.00%D/E 0.00% 11.11% 25.00% 42.86% 66.67% 100.00% 150.00% 233.33% 400.00% 900.00%$ Debt $0 $6,207 $12,414 $18,621 $24,827 $31,034 $37,241 $43,448 $49,655 $55,862Operating Inc. $6,693 $6,693 $6,693 $6,693 $6,693 $6,693 $6,693 $6,693 $6,693 $6,693Depreciation $1,134 $1,134 $1,134 $1,134 $1,134 $1,134 $1,134 $1,134 $1,134 $1,134Interest $0 $447 $968 $1,536 $2,234 $3,181 $4,469 $5,214 $5,959 $7,262Taxable Income $5,559 $5,112 $4,591 $4,023 $3,325 $2,378 $1,090 $345 ($400) ($1,703)Tax $2,001 $1,840 $1,653 $1,448 $1,197 $856 $392 $124 ($144) ($613)Net Income $3,558 $3,272 $2,938 $2,575 $2,128 $1,522 $698 $221 ($256) ($1,090)Pre-tax Int. cov 12.44 5.74 3.62 2.49 1.75 1.24 1.07 0.93 0.77Likely Rating AAA AAA A+ A- BB B CCC CCC CCC CCInterest Rate 7.20% 7.20% 7.80% 8.25% 9.00% 10.25% 12.00% 12.00% 12.00% 13.00%Eff. Tax Rate 36.00% 36.00% 36.00% 36.00% 36.00% 36.00% 36.00% 36.00% 33.59% 27.56%Cost of debt 4.61% 4.61% 4.99% 5.28% 5.76% 6.56% 7.68% 7.68% 7.97% 9.42%
WORKSHEET FOR ESTIMATING RATINGS/INTEREST RATESD/(D+E) 0.00% 10.00% 20.00% 30.00% 40.00% 50.00% 60.00% 70.00% 80.00% 90.00%D/E 0.00% 11.11% 25.00% 42.86% 66.67% 100.00% 150.00% 233.33% 400.00% 900.00%$ Debt $0 $6,207 $12,414 $18,621 $24,827 $31,034 $37,241 $43,448 $49,655 $55,862Operating Inc. $6,693 $6,693 $6,693 $6,693 $6,693 $6,693 $6,693 $6,693 $6,693 $6,693Depreciation $1,134 $1,134 $1,134 $1,134 $1,134 $1,134 $1,134 $1,134 $1,134 $1,134Interest $0 $447 $968 $1,536 $2,234 $3,181 $4,469 $5,214 $5,959 $7,262Taxable Income $5,559 $5,112 $4,591 $4,023 $3,325 $2,378 $1,090 $345 ($400) ($1,703)Tax $2,001 $1,840 $1,653 $1,448 $1,197 $856 $392 $124 ($144) ($613)Net Income $3,558 $3,272 $2,938 $2,575 $2,128 $1,522 $698 $221 ($256) ($1,090)Pre-tax Int. cov 12.44 5.74 3.62 2.49 1.75 1.24 1.07 0.93 0.77Likely Rating AAA AAA A+ A- BB B CCC CCC CCC CCInterest Rate 7.20% 7.20% 7.80% 8.25% 9.00% 10.25% 12.00% 12.00% 12.00% 13.00%Eff. Tax Rate 36.00% 36.00% 36.00% 36.00% 36.00% 36.00% 36.00% 36.00% 33.59% 27.56%Cost of debt 4.61% 4.61% 4.99% 5.28% 5.76% 6.56% 7.68% 7.68% 7.97% 9.42%

Copyright ©2000 Ian H. Giddy Cost of Capital 68
Stated versus Effective Tax Rates
You need taxable income for interest to provide a tax savings In the Disney case, consider the interest expense at 70% and
80%70% Debt Ratio 80% Debt Ratio
EBIT $ 5,559 m $ 5,559 m
Interest Expense $ 5,214 m $ 5,959 m
Tax Savings $ 1,866 m $ 2,001m
Effective Tax Rate 36.00% 2001/5959 = 33.59%
Pre-tax interest rate 12.00% 12.00%
After-tax Interest Rate 7.68% 7.97% You can deduct only $5,559million of the $5,959 million of the
interest expense at 80%. Therefore, only 36% of $ 5,559 is considered as the tax savings.

Copyright ©2000 Ian H. Giddy Cost of Capital 69
Cost of Debt
0.00%
2.00%
4.00%
6.00%
8.00%
10.00%
12.00%
14.00%
0% 10% 20% 30% 40% 50% 60% 70% 80% 90%
Debt Ratio
Cos
t of D
ebt
Interest RateAT Cost of Debt

Copyright ©2000 Ian H. Giddy Cost of Capital 70
Disney’s Cost of Capital Schedule
Debt Ratio Cost of Equity AT Cost of Debt Cost of Capital
0.00% 13.00% 4.61% 13.00%
10.00% 13.43% 4.61% 12.55%
20.00% 13.96% 4.99% 12.17%
30.00% 14.65% 5.28% 11.84%
40.00% 15.56% 5.76% 11.64%
50.00% 16.85% 6.56% 11.70%
60.00% 18.77% 7.68% 12.11%
70.00% 21.97% 7.68% 11.97%
80.00% 28.95% 7.97% 12.17%
90.00% 52.14% 9.42% 13.69%

Copyright ©2000 Ian H. Giddy Cost of Capital 71
Disney: Cost of Capital Chart
10.50%
11.00%
11.50%
12.00%
12.50%
13.00%
13.50%
14.00%
0.00
%
10.00%
20.00%
30.00%
40.00%
50.00%
60.00%
70.00%
80.00%
90.00%
Debt Ratio
Cos
t of C
apita
l
Cost of Capital

Copyright ©2000 Ian H. Giddy Cost of Capital 72
Effect on Firm Value
Firm Value before the change = 50,888+11,180= $ 62,068WACCb = 12.22% Annual Cost = $62,068 *12.22%= $7,583 million
WACCa = 11.64% Annual Cost = $62,068 *11.64% = $7,226 million
WACC = 0.58% Change in Annual Cost = $ 357 million If there is no growth in the firm value, (Conservative Estimate)
Increase in firm value = $357 / .1164 = $3,065 million Change in Stock Price = $3,065/675.13= $4.54 per share
If there is growth (of 7.13%) in firm value over time, Increase in firm value = $357 * 1.0713 /(.1164-.0713) = $ 8,474 Change in Stock Price = $8,474/675.13 = $12.55 per share
Implied Growth Rate obtained by
Firm value Today =FCFF(1+g)/(WACC-g): Perpetual growth formula
$62,068 = $3,222(1+g)/(.1222-g): Solve for g

Copyright ©2000 Ian H. Giddy Cost of Capital 73
www.giddy.org
Ian Giddy
NYU Stern School of Business
Tel 212-998-0332; Fax 212-995-4233
http://www.giddy.org