productivity growth in bulgaria: trends and...
TRANSCRIPT

PRODUCTIVITY GROWTH
IN BULGARIA:
TRENDS AND OPTIONS
Doerte Doemeland - The World Bank
Washington, DC – February 8, 2016

THE RATIONALE FOR
BOOSTING
PRODUCTIVITY GROWTH
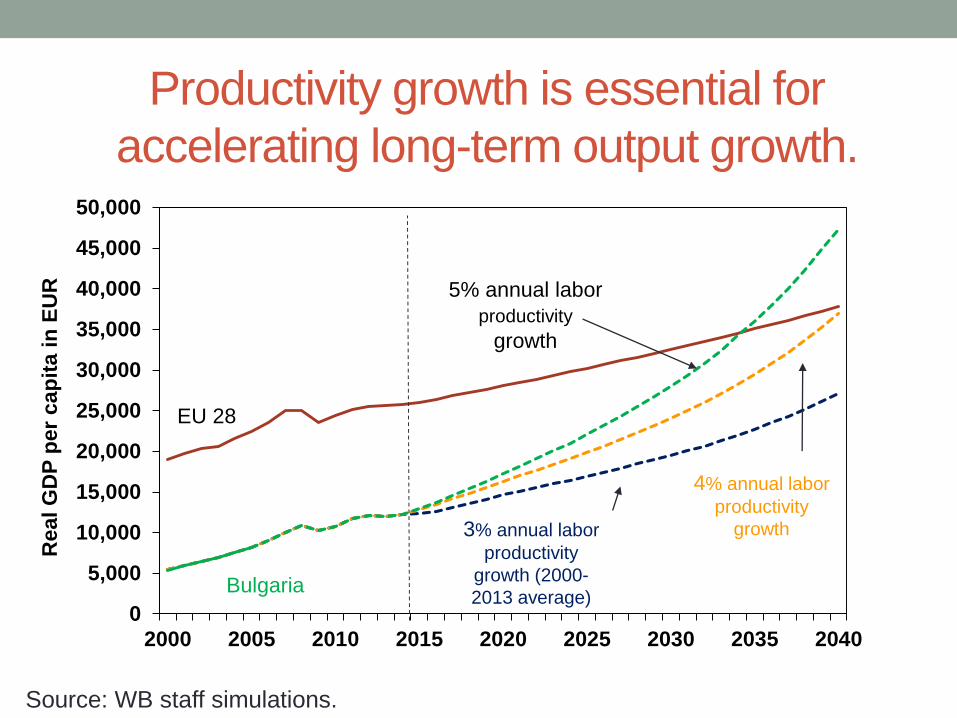
Productivity growth is essential for
accelerating long-term output growth.
0
5,000
10,000
15,000
20,000
25,000
30,000
35,000
40,000
45,000
50,000
2000 2005 2010 2015 2020 2025 2030 2035 2040
Re
al
GD
P p
er
ca
pit
a i
n E
UR 5% annual labor
productivity
growth
4% annual labor
productivity
growth
EU 28
Bulgaria
3% annual labor
productivity
growth (2000-
2013 average)
Source: WB staff simulations.
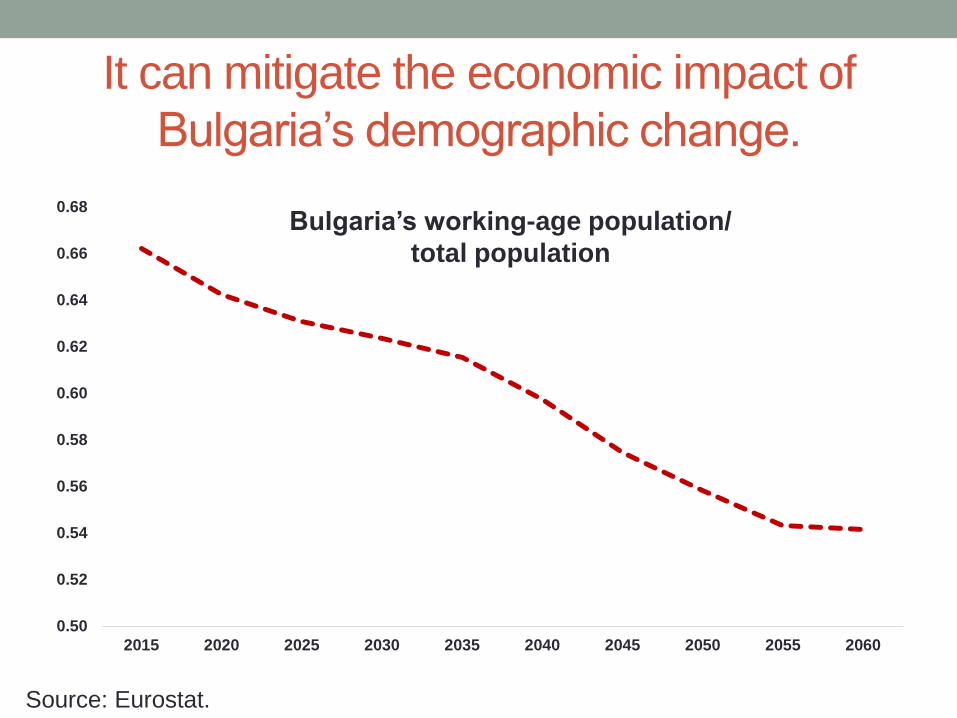
It can mitigate the economic impact of
Bulgaria’s demographic change.
Source: Eurostat.
0.50
0.52
0.54
0.56
0.58
0.60
0.62
0.64
0.66
0.68
2015 2020 2025 2030 2035 2040 2045 2050 2055 2060
Bulgaria’s working-age population/
total population

Source: NSI data; WB staff simulations.
Productivity growth can help boost
employment and wages.
-0.2
-0.1
0.0
0.1
0.2
0.3
0.4
Young/Small Young/Large Medium/Small Medium/Large Old/Small Old/Large
An
nu
al
Gro
wth
TFP growth Employment growth
Total Factor Productivity and Employment Growth
2009-2012

TRENDS AND
PATTERNS
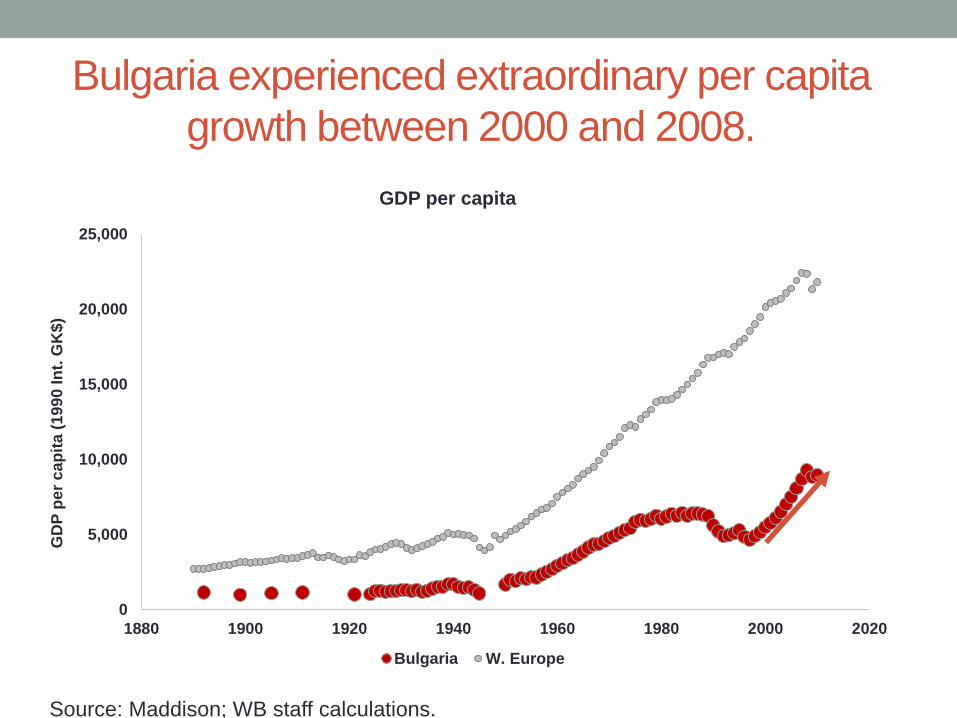
Bulgaria experienced extraordinary per capita
growth between 2000 and 2008.
0
5,000
10,000
15,000
20,000
25,000
1880 1900 1920 1940 1960 1980 2000 2020
GD
P p
er
ca
pit
a (
19
90
In
t. G
K$
)
GDP per capita
Bulgaria W. Europe
Source: Maddison; WB staff calculations.
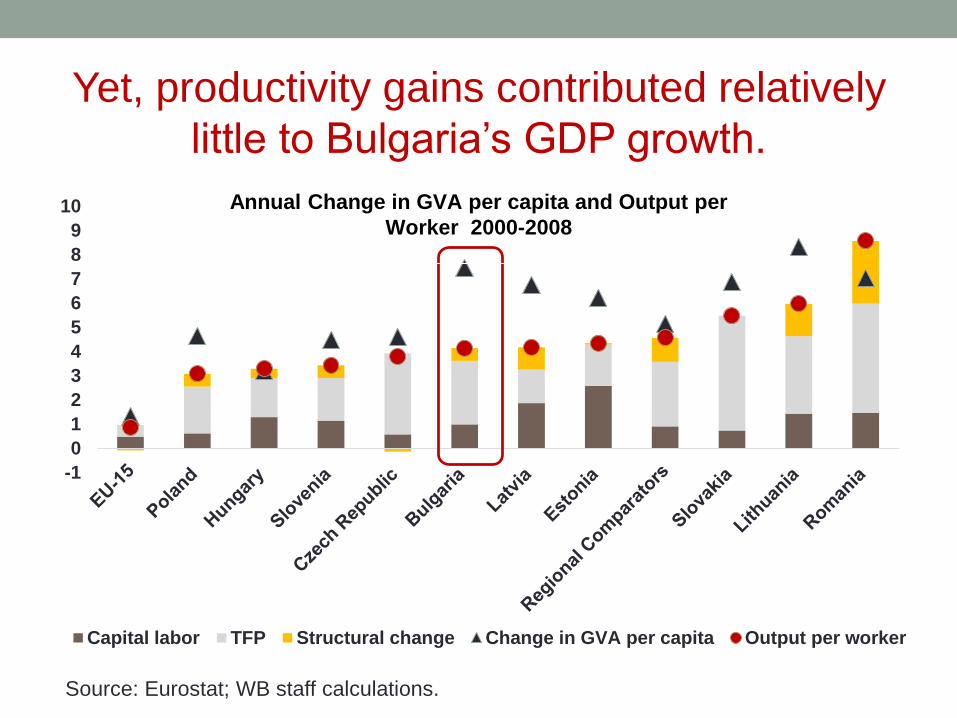
Yet, productivity gains contributed relatively
little to Bulgaria’s GDP growth.
Source: Eurostat; WB staff calculations.
-1
0
1
2
3
4
5
6
7
8
9
10
Capital labor TFP Structural change Change in GVA per capita Output per worker
Annual Change in GVA per capita and Output per
Worker 2000-2008

Large inefficiencies continue to exist in the
Bulgarian economy.
At the macro-economic level, inefficiencies in
the allocation of labor across sectors persist.
Had Bulgaria’s allocation of labor similarly efficient
than in Romania between 2000 and 2008 - annual
GDP per capita growth would have been 2
percentage points higher.
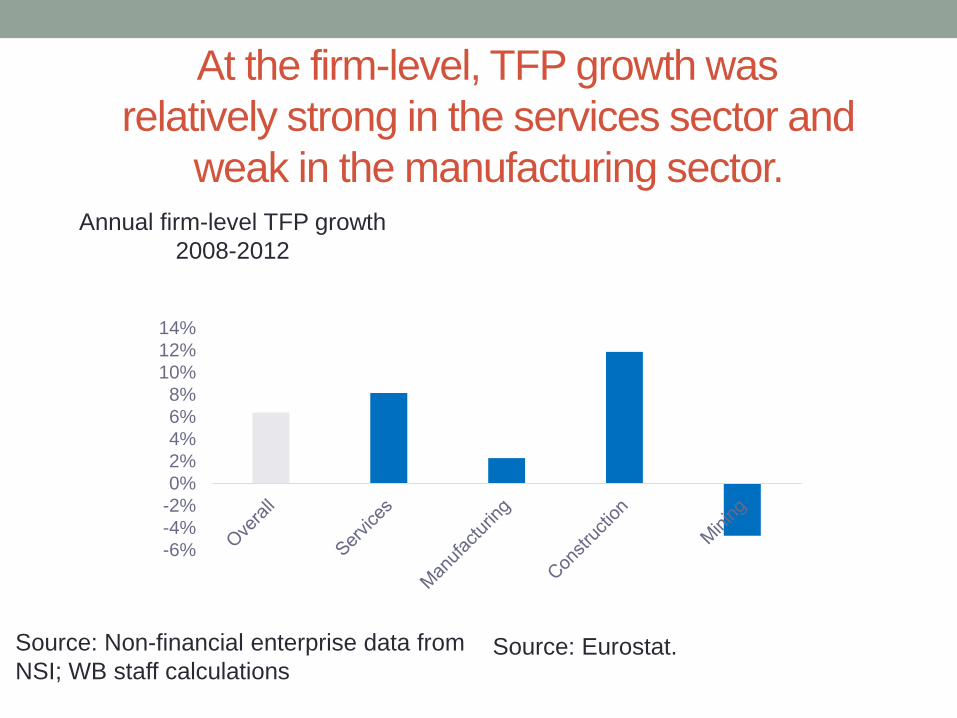
At the firm-level, TFP growth was
relatively strong in the services sector and
weak in the manufacturing sector.
Source: Non-financial enterprise data from
NSI; WB staff calculationsSource: Eurostat.
Annual firm-level TFP growth
2008-2012
-6%
-4%
-2%
0%
2%
4%
6%
8%
10%
12%
14%
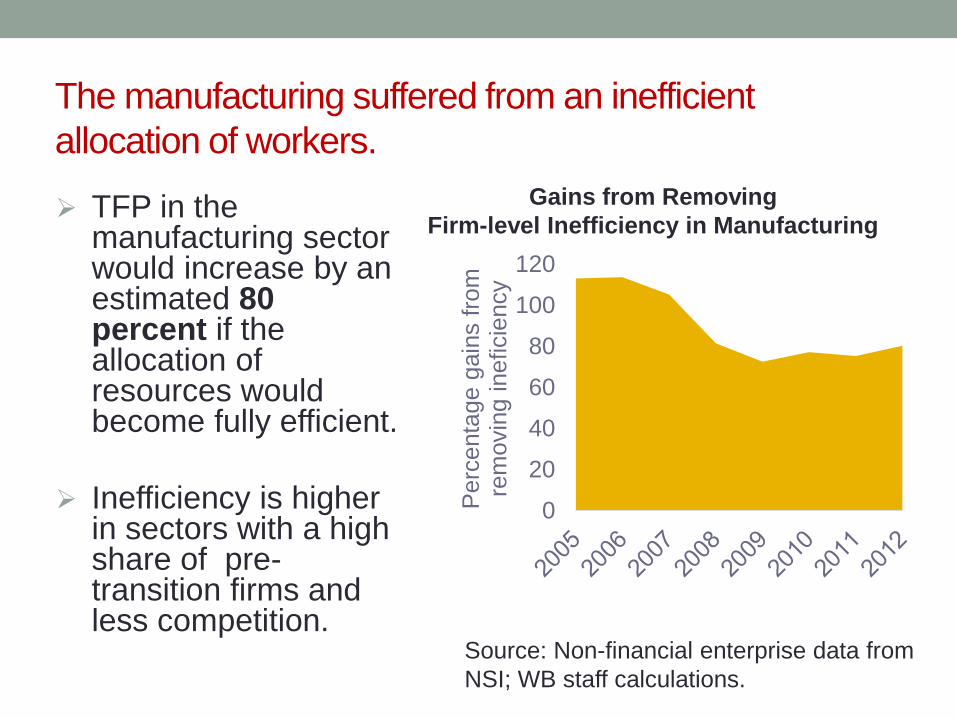
The manufacturing suffered from an inefficient
allocation of workers.
Distance from production
possibility frontier
Source: Non-financial enterprise data from
NSI; WB staff calculations.
Gains from Removing
Firm-level Inefficiency in Manufacturing TFP in the
manufacturing sector would increase by an estimated 80 percent if the allocation of resources would become fully efficient.
Inefficiency is higher in sectors with a high share of pre-transition firms and less competition.
0
20
40
60
80
100
120
Perc
enta
ge g
ain
s f
rom
re
movin
g ineficie
ncy

Though Bulgaria experienced rapid export growth, the
income potential of its export basket has stagnated.
0 2000 4000
Hungary
Croatia
Estonia
Romania
Poland
Slovak Republic
Slovenia
Czech Republic
Latvia
Bulgaria
Change in export basket
income potential 1996-2012
Source: WITS WB staff calculations.
Export basket income potential

HOW CAN BULGARIA
BOOST
PRODUCTIVITY
GROWTH?

POLICIES?
Distance from production
possibility frontier
Benchmarking and policy diagnostics: Which are the area that
are important for productivity growth and where Bulgaria is
lagging?
Macro: Run cross-country regression of structural change or TFP
growth on policy variables of interest –
Firm-level data: Which firms have the highest productivity
growth? How did changes in the regulatory environment affect
firm-level productivity growth?
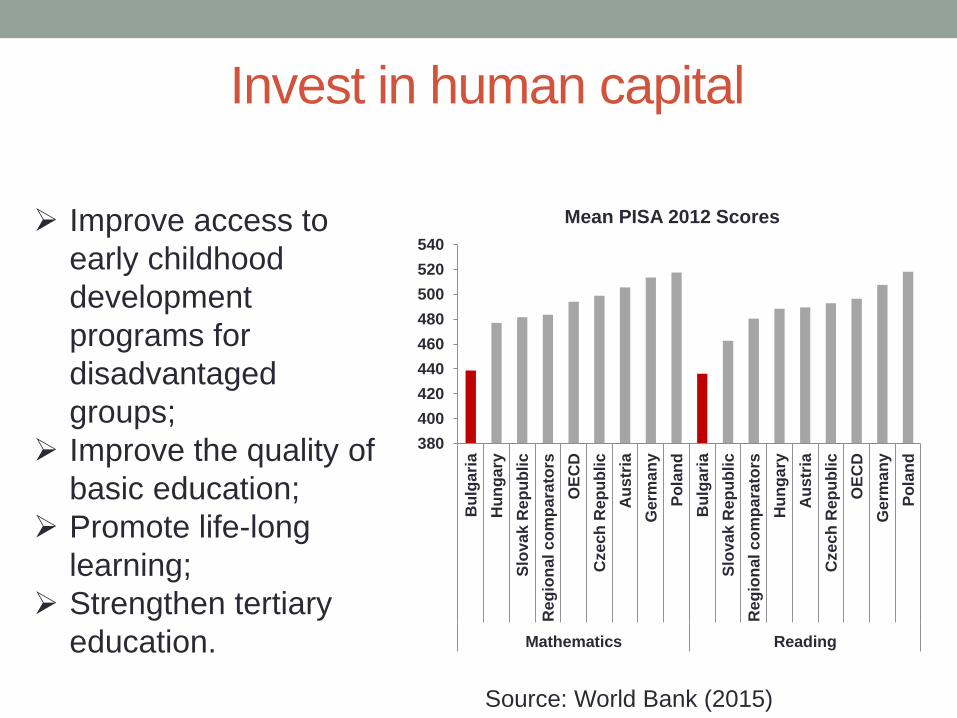
Invest in human capital
380
400
420
440
460
480
500
520
540
Bu
lga
ria
Hu
ng
ary
Slo
va
k R
ep
ub
lic
Reg
ion
al c
om
para
tors
OE
CD
Czech
Rep
ub
lic
Au
str
ia
Germ
an
y
Po
lan
d
Bu
lga
ria
Slo
va
k R
ep
ub
lic
Reg
ion
al c
om
para
tors
Hu
ng
ary
Au
str
ia
Czech
Rep
ub
lic
OE
CD
Germ
an
y
Po
lan
d
Mathematics Reading
Mean PISA 2012 Scores Improve access to
early childhood
development
programs for
disadvantaged
groups;
Improve the quality of
basic education;
Promote life-long
learning;
Strengthen tertiary
education.
Source: World Bank (2015)
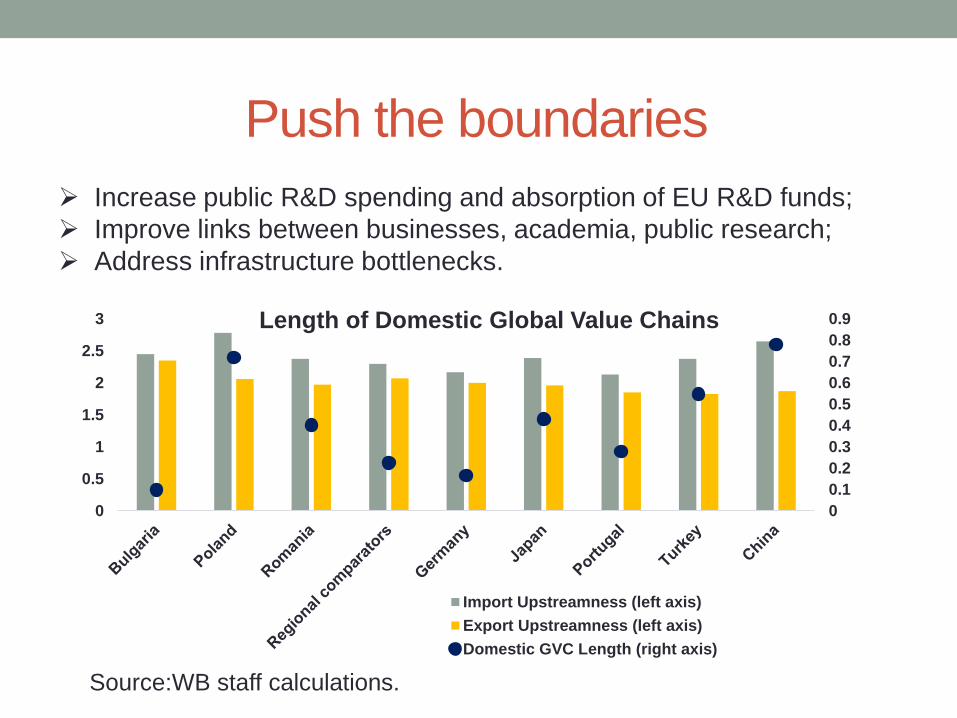
Push the boundaries
Distance from production
possibility frontier
Source:WB staff calculations.
0
0.1
0.2
0.3
0.4
0.5
0.6
0.7
0.8
0.9
0
0.5
1
1.5
2
2.5
3
Import Upstreamness (left axis)
Export Upstreamness (left axis)
Domestic GVC Length (right axis)
Length of Domestic Global Value Chains
Increase public R&D spending and absorption of EU R&D funds;
Improve links between businesses, academia, public research;
Address infrastructure bottlenecks.
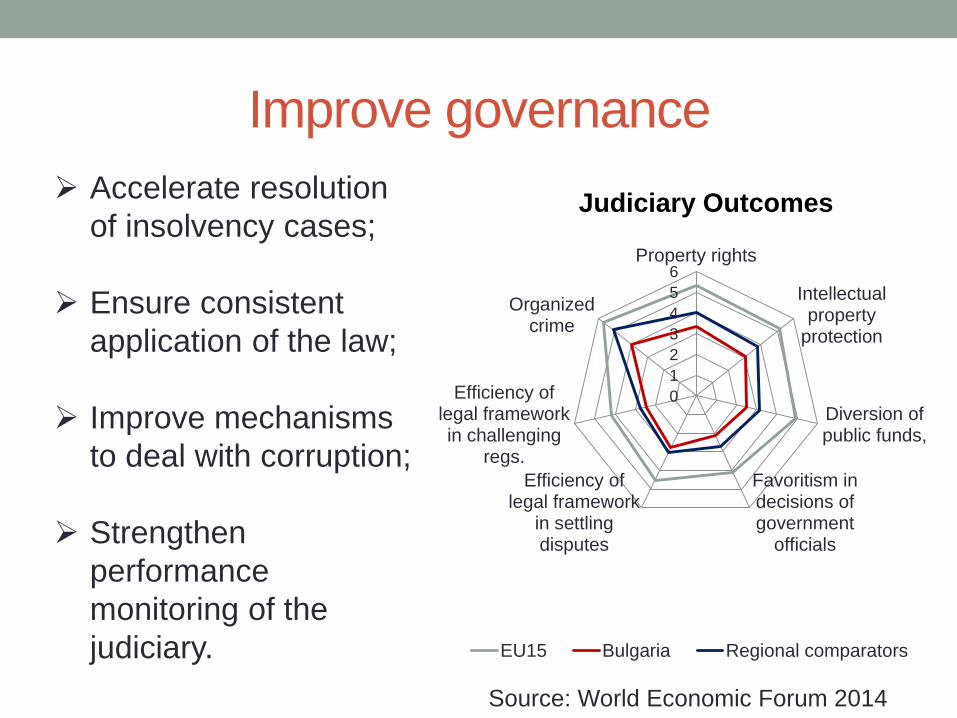
Improve governance
Accelerate resolution
of insolvency cases;
Ensure consistent
application of the law;
Improve mechanisms
to deal with corruption;
Strengthen
performance
monitoring of the
judiciary.
0
1
2
3
4
5
6Property rights
Intellectualproperty
protection
Diversion ofpublic funds,
Favoritism indecisions ofgovernment
officials
Efficiency oflegal framework
in settlingdisputes
Efficiency oflegal frameworkin challenging
regs.
Organizedcrime
EU15 Bulgaria Regional comparators
Judiciary Outcomes
Source: World Economic Forum 2014
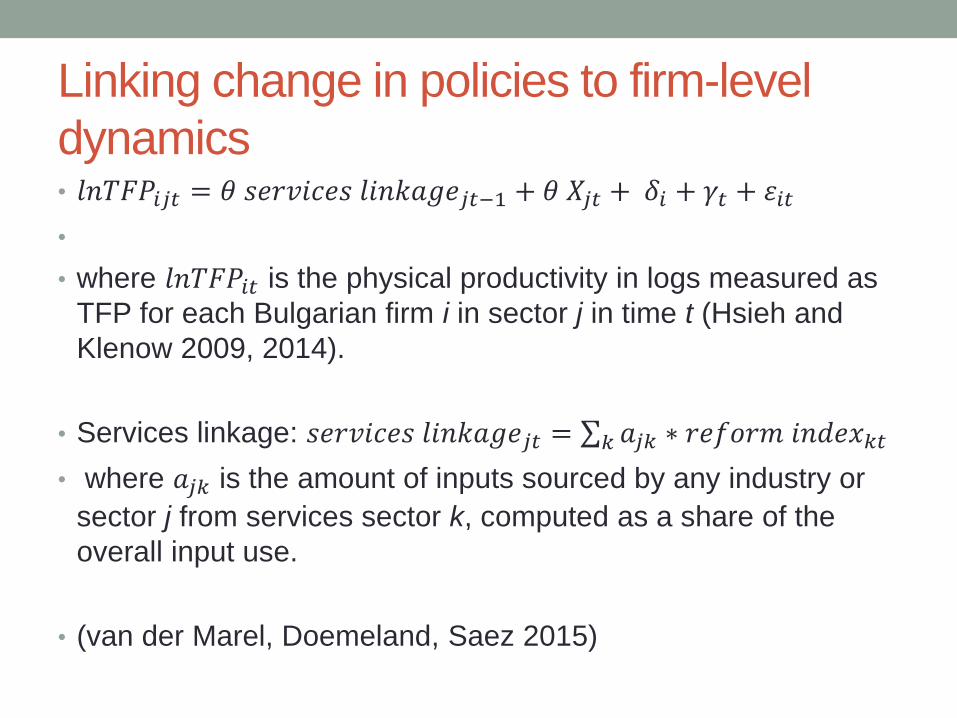
Linking change in policies to firm-level
dynamics• 𝑙𝑛𝑇𝐹𝑃𝑖𝑗𝑡 = 𝜃 𝑠𝑒𝑟𝑣𝑖𝑐𝑒𝑠 𝑙𝑖𝑛𝑘𝑎𝑔𝑒𝑗𝑡−1 + 𝜃 𝑋𝑗𝑡 + 𝛿𝑖 + 𝛾𝑡 + 휀𝑖𝑡
•
• where 𝑙𝑛𝑇𝐹𝑃𝑖𝑡 is the physical productivity in logs measured as
TFP for each Bulgarian firm i in sector j in time t (Hsieh and
Klenow 2009, 2014).
• Services linkage: 𝑠𝑒𝑟𝑣𝑖𝑐𝑒𝑠 𝑙𝑖𝑛𝑘𝑎𝑔𝑒𝑗𝑡 = 𝑘 𝑎𝑗𝑘 ∗ 𝑟𝑒𝑓𝑜𝑟𝑚 𝑖𝑛𝑑𝑒𝑥𝑘𝑡
• where 𝑎𝑗𝑘 is the amount of inputs sourced by any industry or
sector j from services sector k, computed as a share of the
overall input use.
• (van der Marel, Doemeland, Saez 2015)
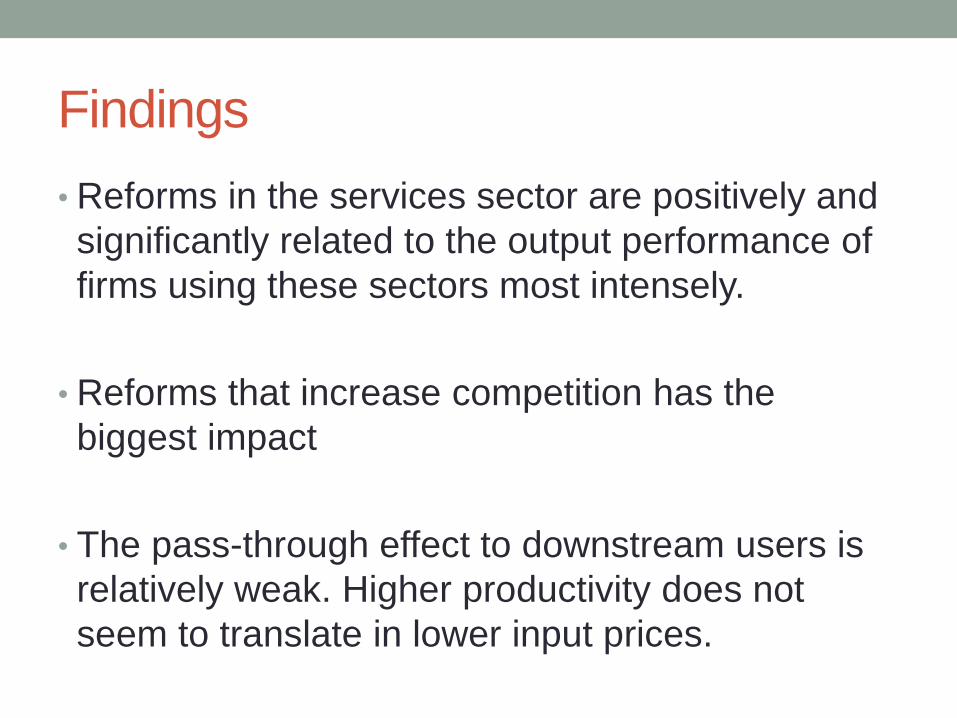
Findings
• Reforms in the services sector are positively and
significantly related to the output performance of
firms using these sectors most intensely.
• Reforms that increase competition has the
biggest impact
• The pass-through effect to downstream users is
relatively weak. Higher productivity does not
seem to translate in lower input prices.

HOW DOES
PRODUCTIVITY GROWTH
AFFECT POVERTY AND
SHARED PROSPERITY?

Approach
• MAMS
• Open economy
• SAM for 2012
• Baseline assumptions in line with ageing report
• Technology (slightly labor augmenting), decline of labor
force and strong GDP growth lead to solid wage growth,
decline in unemployment and increase in real
consumption per-capita and a decline in poverty.
• Urban households with secondary and tertiary education
gain most.
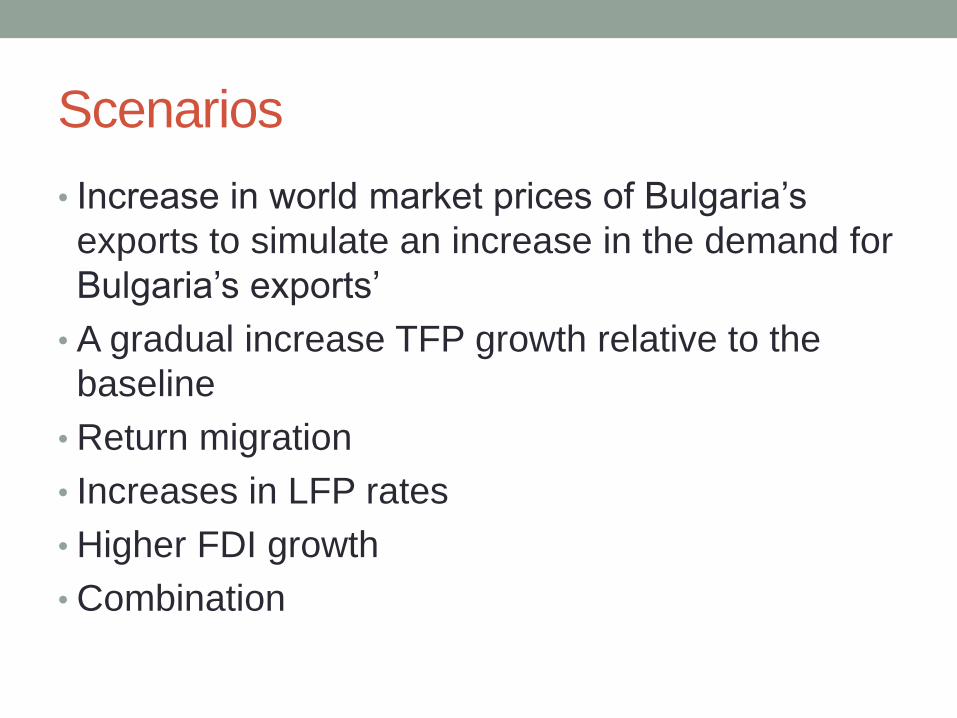
Scenarios
• Increase in world market prices of Bulgaria’s
exports to simulate an increase in the demand for
Bulgaria’s exports’
• A gradual increase TFP growth relative to the
baseline
• Return migration
• Increases in LFP rates
• Higher FDI growth
• Combination
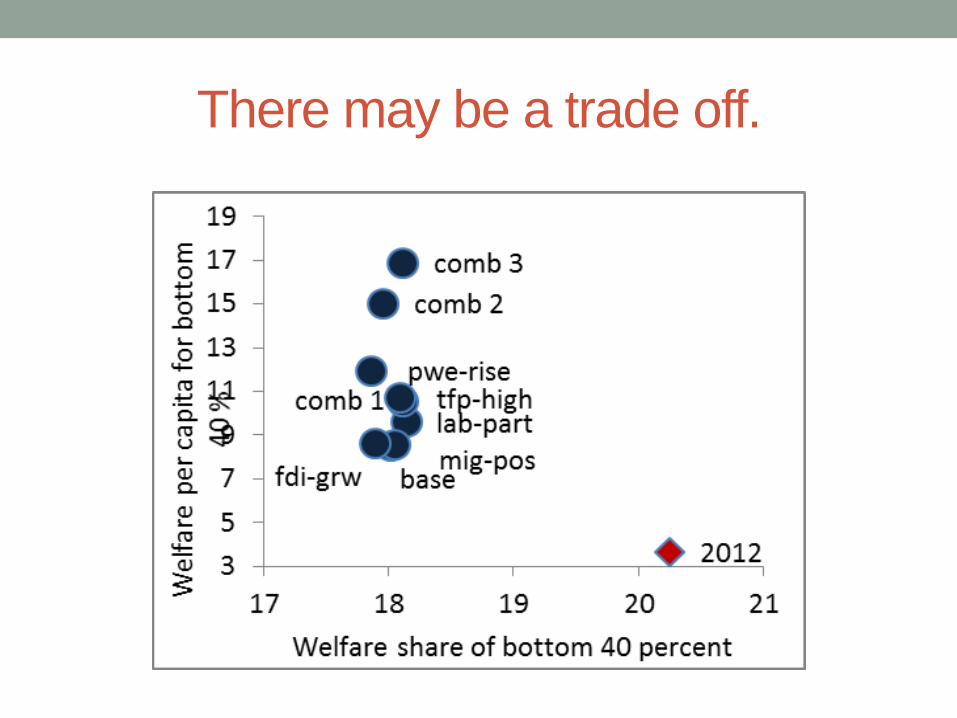
There may be a trade off.
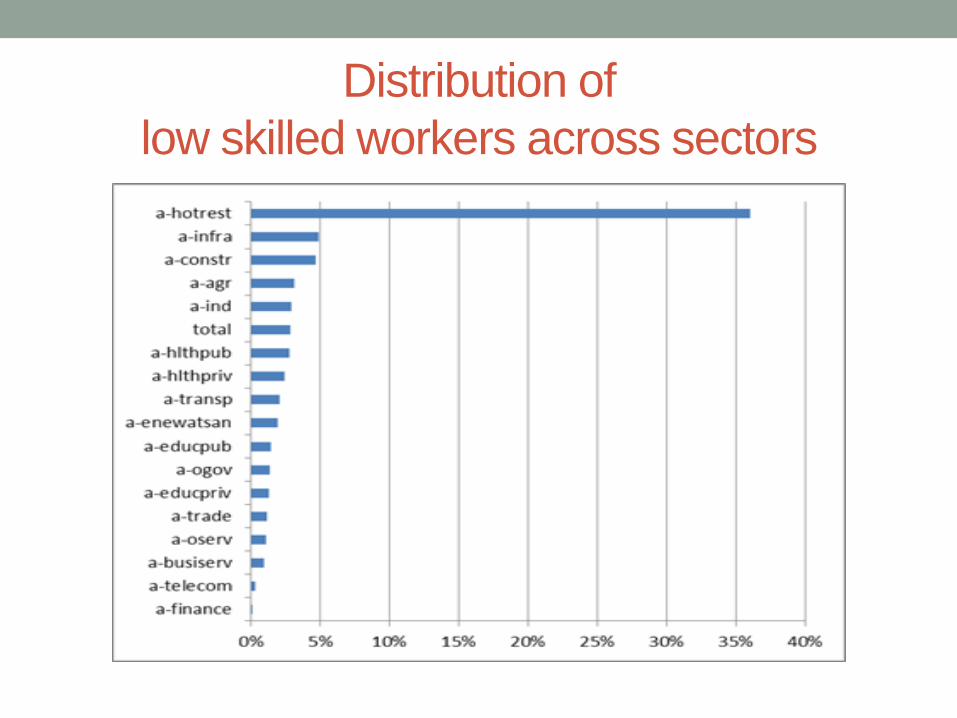
Distribution of
low skilled workers across sectors

Source: WB staff CGE simulations.
Productivity growth would improve
welfare and reduce poverty.
0.0
1.0
2.0
3.0
4.0
5.0
6.0
Total Less thansecondary
Tertiary eduction
Baseline TFP High Combination
Annual increase
in real household consumption 2012-
2050
02468
101214161820
Change in FGT Poverty Indicators
2015 - 2030
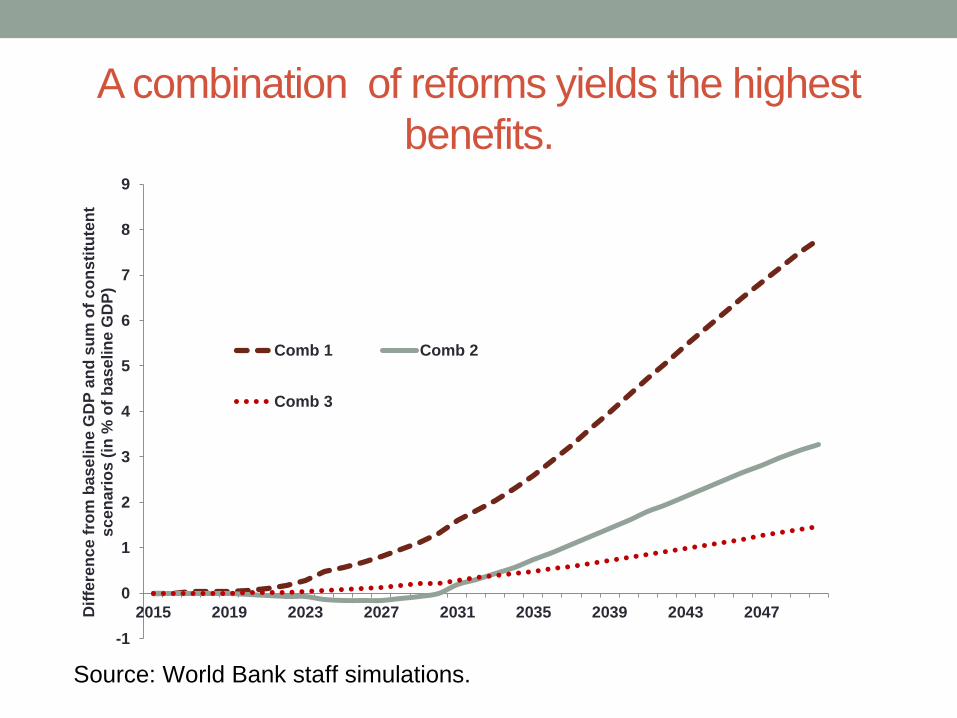
A combination of reforms yields the highest
benefits.
-1
0
1
2
3
4
5
6
7
8
9
2015 2019 2023 2027 2031 2035 2039 2043 2047Dif
fere
nc
e f
rom
ba
se
lin
e G
DP
an
d s
um
of
co
nsti
tute
nt
sc
en
ari
os
(in
% o
f b
as
eli
ne
GD
P)
Comb 1 Comb 2
Comb 3
Source: World Bank staff simulations.
Conclusion
Bulgaria’s productivity growth would need to accelerate to
mitigate the economic impact of its demographic change
and to converge to the EU28 income level.
Bulgaria’s economy suffers from significant inefficiencies
– reducing them could yield large productivity gains.
Investing in education, boosting integration into global
value chains and innovation and reforming Bulgaria’s
judiciary are key reforms for accelerating productivity
growth.