productivity and linkages of the food web of the … ballerini_2013_prog_ocean... · of the western...
TRANSCRIPT

Progress in Oceanography xxx (2013) xxx–xxx
Contents lists available at ScienceDirect
Progress in Oceanography
journal homepage: www.elsevier .com/ locate /pocean
Productivity and linkages of the food web of the southern regionof the western Antarctic Peninsula continental shelf
0079-6611/$ - see front matter � 2013 Elsevier Ltd. All rights reserved.http://dx.doi.org/10.1016/j.pocean.2013.11.007
⇑ Corresponding author. Present addresses: Aix-Marseille Université, Universitéde Toulon, CNRS/INSU, IRD, MIO, UM 110, 13288, Marseille, Cedex 09, France.Université de Toulon, Aix-Marseille Université, CNRS/INSU, IRD, MIO, UM 110,83957, La Garde Cedex, France. Tel.: + 33 4 91 82 93 37.
E-mail addresses: [email protected], [email protected](T. Ballerini).
1 Present address: Departamento de Oceanografia, Servicio de Hidrografia Naval,Av. Montes de Oca 2124, Buenos Aires, Argentina.
2 Deceased.
Please cite this article in press as: Ballerini, T., et al. Productivity and linkages of the food web of the southern region of the western Antarctic Pecontinental shelf. Prog. Oceanogr. (2013), http://dx.doi.org/10.1016/j.pocean.2013.11.007
Tosca Ballerini a,⇑, Eileen E. Hofmann a, David G. Ainley b, Kendra Daly c, Marina Marrari c,1,Christine A. Ribic d, Walker O. Smith Jr. e, John H. Steele f,2
a Center for Coastal Physical Oceanography, Old Dominion University, Norfolk, VA 23528, United Statesb H.T. Harvey & Associates, 983 University Avenue, Los Gatos, CA 95032, United Statesc University of South Florida, College of Marine Science, 140 7th Avenue South, St. Petersburg, FL 33701, United Statesd U.S. Geological Survey, Wisconsin, Cooperative Wildlife Research Unit, University of Wisconsin, Madison, WI 53706, United Statese Virginia Institute of Marine Science, The College of William and Mary, Gloucester Point, VA 23062, United Statesf Woods Hole Oceanographic Institution, Woods Hole, MA 02543, United States
a r t i c l e i n f o a b s t r a c t
Article history:Received 31 October 2012Received in revised form 22 November 2013Accepted 22 November 2013Available online xxxx
The productivity and linkages in the food web of the southern region of the west Antarctic Peninsula con-tinental shelf were investigated using a multi-trophic level mass balance model. Data collected during theSouthern Ocean Global Ocean Ecosystem Dynamics field program were combined with data from the lit-erature on the abundance and diet composition of zooplankton, fish, seabirds and marine mammals tocalculate energy flows in the food web and to infer the overall food web structure at the annual level.Sensitivity analyses investigated the effects of variability in growth and biomass of Antarctic krill (Eup-hausia superba) and in the biomass of Antarctic krill predators on the structure and energy fluxes inthe food web. Scenario simulations provided insights into the potential responses of the food web to areduced contribution of large phytoplankton (diatom) production to total primary production, and toreduced consumption of primary production by Antarctic krill and mesozooplankton coincident withincreased consumption by microzooplankton and salps. Model-derived estimates of primary productionwere 187–207 g C m�2 y�1, which are consistent with observed values (47–351 g C m�2 y�1). Simulationsshowed that Antarctic krill provide the majority of energy needed to sustain seabird and marine mammalproduction, thereby exerting a bottom-up control on higher trophic level predators. Energy transfer totop predators via mesozooplanton was a less efficient pathway, and salps were a production loss pathwaybecause little of the primary production they consumed was passed to higher trophic levels. Increasedpredominance of small phytoplankton (nanoflagellates and cryptophytes) reduced the production of Ant-arctic krill and of its predators, including seabirds and seals.
� 2013 Elsevier Ltd. All rights reserved.
1. Introduction
The traditional view of Southern Ocean food webs is that of asimple system dominated by Antarctic krill (Euphausia superba)that links diatom-based primary production with higher trophiclevels in short efficient food chains (Everson, 1977; Laws, 1984;Murphy et al., 2012). However, this conceptual food web is notthe dominant structure for many regions of the Southern Ocean
where other zooplankton, such as copepods and crystal krill (Eup-hausia crystallorophias), as well as Antarctic silverfish (Pleuragram-ma antarcticum), provide the linkage between primary producersand higher trophic levels (Murphy et al., 2007, 2012; Ducklowet al., 2007; Smith et al., 2007, 2012). Even within the same region,the food web structure can vary in response to physical (circula-tion, sea ice) and chemical (micro and macro-nutrient supply) pro-cesses, which alter primary production, phytoplanktoncomposition, the relative abundance of zooplankton species, andpredator foraging dynamics (Murphy et al., 2007; Smith et al.,2007, 2012; Atkinson et al., 2008). Superimposed on regional andseasonal variability are the effects of climate-induced changesand harvesting of resources, which also produce perturbations tofood web structure (e.g., Pakhomov et al., 2002; Atkinson et al.,2004; Smetacek and Nicol, 2005; Ballance et al., 2006; Ainley andBlight, 2009; Murphy et al., 2012).
ninsula

2 T. Ballerini et al. / Progress in Oceanography xxx (2013) xxx–xxx
Descriptions of Southern Ocean food webs initially focused onqualitative descriptions of linkages in particular areas, such asthe open ocean, sea ice, or coastal regions (Everson, 1977; Laws,1984). Studies done during the past three decades provide the ba-sis for quantification of food web models. Detailed analysis of foodwebs that are based on mass balance constraints, which requirethat predator consumption of a prey group does not exceed preyproduction, have been developed for the Ross Sea (Pinkertonet al., 2010), the Antarctic Peninsula-Scotia Sea (Cornejo-Donosoand Antezana, 2008) and the South Georgia shelf in the ScotiaSea (Hill et al., 2012). These modeling studies compiled and ana-lyzed extensive and disparate data sets, which allowed identifica-tion and analysis of important trophic groups and interactions.The analysis of the Ross Sea food web was focused on the produc-tion of Antarctic toothfish (Dissostichus mawsoni) and the conse-quences of harvesting this species for its predators. The AntarcticPeninsula-Scotia Sea and South Georgia food webs showed thatAntarctic krill was the primary link between low and high trophiclevels, and also showed that alternative trophic pathways throughother zooplankton species, benthic organisms, and fish providedsupport for the upper trophic levels.
Fig. 1. Map of the Antarctic Peninsula (A) showing the SO GLOBEC study region and the pblack lines). Regions of enhanced concentrations of pelagic fish (green), seabirds (light bthe SO GLOBEC survey cruises (Costa et al., 2007) are indicated. The location of Adélie pidentified as: Adelaide Island-AdI, Alexander Island-AxI, Anvers Island-AnI, Elephant IslWilkins Ice Shelf-WIS. Bathymetric contours are in meters. (For interpretation of the refearticle.)
Please cite this article in press as: Ballerini, T., et al. Productivity and linkagescontinental shelf. Prog. Oceanogr. (2013), http://dx.doi.org/10.1016/j.pocean.20
The Antarctic Peninsula (Fig. 1a) is warming faster than mostother regions on Earth, and is undergoing a transition from a mar-itime-Antarctic climate to a warmer sub-Antarctic-type climate(Montes-Hugo et al., 2009). Since the 1950s the western AntarcticPeninsula shelf has experienced significant increases in average airand sea water temperature (Turner et al., 2005; Meredith and King,2005; review in Ducklow et al., 2007) associated with increasedheat transport and glacial meltwater input and decreased sea iceextent and duration (Stammerjohn et al., 2008; Meredith et al.,2013).
In the northern part of the western Antarctic Peninsula, thesechanges in the physical environment have affected various compo-nents of the food web (Ducklow et al., 2007; Schofield et al., 2010).In particular, reductions in sea ice extent have been linked to ob-served changes in the composition of phytoplankton assemblages(Moline et al., 2004; Montes-Hugo et al., 2009), to reduced recruit-ment of intermediate trophic levels such as Antarctic krill and Ant-arctic silverfish that use the under ice habitat as a nursery(Atkinson et al., 2004; Ducklow et al., 2007; Chapman et al.,2011), and to reduced populations of vertebrate predators suchas the Adélie penguin (Pygoscelis adeliae) that use the sea ice
artitioning of this region used for calculating inputs to the food web model (B, heavylue), crabeater seals (purple) and baleen whales (yellow) that were observed duringenguin colonies (Ainley, 2002) is also indicated (triangles). Geographic features areand-EI, George VI Ice Shelf-GVIIS, Marguerite Bay-MB, Marguerite Trough-MT, andrences to color in this figure legend, the reader is referred to the web version of this
of the food web of the southern region of the western Antarctic Peninsula13.11.007

T. Ballerini et al. / Progress in Oceanography xxx (2013) xxx–xxx 3
habitat (Ainley, 2002). Changes in the hydrography and reductionof sea ice cover have also been associated with the increased occur-rence of the tunicate Salpa thompsoni, which may compete withAntarctic krill for food (Loeb et al., 1997). Unusually high abun-dances of salps have been observed in the northern part the wes-tern Antarctic Peninsula, and were associated with intrusions ofoceanic water masses close to the Antarctic shelf (Pakhomovet al., 2002; Pakhomov, 2004).
As the warming trend along the western Antarctic Peninsulacontinues, changes in the ecosystem are expected to occur in thesouthern portion of the western Antarctic Peninsula in responseto reduction of winter sea ice extent and duration (Dinnimanet al., 2012), increased glacial meltwater and changes in hydrogra-phy (Clarke and Tyler, 2008; Meredith et al., 2013). These changesmay result in ecosystem trends for the southern region that aresimilar to those now occurring along the northern part of the wes-tern Antarctic Peninsula, such as an increased presence of salps(Pakhomov et al., 2002; Pakhomov, 2004). Currently, however,the ecosystems of the southern and northern portions of the Ant-arctic Peninsula are behaving differently. For example, Adélie pen-guin colonies are increasing in size in the south (Lynch et al., 2012),as the reduction in sea ice concentration and sea ice cover is facil-itating penguin travel and foraging, and Antarctic silverfish are stillpresent in the south although they have already largely disap-peared from the northern areas (Schofield et al., 2010).
The U.S. Southern Ocean Global Ocean Ecosystems Dynamics(SO GLOBEC) Program, which was focused around MargueriteBay in the southwestern Antarctic Peninsula (sWAP) continentalshelf (Fig. 1), was designed to investigate the physical and biolog-ical factors that influence growth, reproduction, recruitment, andoverwintering survival of Antarctic krill (Hofmann et al., 2004).Important target species from all trophic levels, including otherzooplankton, fish, seabirds, and marine mammals, were the focusof extensive ecological and physiological studies that were coinci-dent with studies of habitat structure. As a result, quantitativemeasures of species abundance, distribution, and vital rates arenow available for many components of the food web of this region.The SO GLOBEC data, collected during the austral fall and winter of2001 and 2002, combined with data sets from the austral fall andspring (e.g. Palmer Station Long-term Ecological Research (LTER)program), provide the basis for development of a food web modelfor the sWAP continental shelf.
The three objectives of this study are to: (1) develop a mass bal-ance food web model to quantify the energy flows and identify thedominant trophic pathways from primary producers to top preda-tors in the sWAP food web; (2) perform sensitivity analyses toinvestigate the role of Antarctic krill in energy transfer in the sWAPfood web; (3) and investigate potential changes in the productivityof seabirds and marine mammals in response to changes in the rel-ative abundance of plankton groups that might occur in the futureas a response to climate change in the sWAP region.
2. Methods
2.1. Southwestern Antarctic Peninsula food web model
The food web model for the sWAP continental shelf consists of24 trophic groups that represent the pelagic, benthic and microbialcomponents (Fig. 2, Table 1). The species represented within thetrophic groups correspond to those observed during SO GLOBECand to species reported from previous studies in the sWAP. Sometrophic groups are composed of a single species (e.g., Antarctic krilland Adélie penguin), while other trophic groups are composed ofmore than one species (Table A.1). Primary producers arerepresented by three microbial groups, small phytoplankton
Please cite this article in press as: Ballerini, T., et al. Productivity and linkagescontinental shelf. Prog. Oceanogr. (2013), http://dx.doi.org/10.1016/j.pocean.20
(nanoflagellates and cryptophytes, <20 lm), large phytoplankton(diatoms, >20 lm) and ice algae. The intermediate trophic groupsconsist of micro-, meso- and macrozooplankton, Antarctic krill,and benthic invertebrates. The pelagic fish assemblage along thesWAP is dominated by two species, Antarctic silverfish and lanternfish (Electrona antarctica) (Donnelly and Torres, 2008). Cephalo-pods and benthic fish are consumers of intermediate trophic levelproduction and also are prey for top predators (e.g. Kock, 1987;Barrera-Oro, 2002). The top predators are the Adélie penguin, agroup of several species of flying seabirds, seals, and cetaceans.These predators constitute the majority of upper trophic levelbiomass along the sWAP (Chapman et al., 2004; Thiele et al.,2004; Ribic et al., 2008, 2011).
In the mass balance food web model (ECOPATH-type, based onChristensen and Walters, 2004) developed for the sWAP region,production of prey species is determined by predator consumption(i.e., top down control). The average annual energy flux budget(g C m�2 y�1) through the food web was obtained using:
Pp ¼ M2pBp þM0pBp ð1Þ
where the production, Pp, of each producer group, p, is calculated asthe sum of removal of its biomass, Bp, by predation mortality, M2p,and by non-predation mortality, M0p. The model assumes no loss tofisheries and a steady state food web so that biomass accumulationand emigration/immigration are zero.
Predation mortality is given by
M2p ¼Xn
c¼1
Q cDCpc
Bp; ð2Þ
which is the sum of consumption by all consumer groups, c, feedingon the producer group, p. For each consumer group, Qc is the totalconsumption rate and DCp is the fraction of the consumer group’sdiet that is composed of the producer group. The non-predationmortality is given by
M0p ¼ ð1� EEpÞðPp=BpÞ ð3Þ
where EEp is the ecotrophic efficiency, which indicates the fraction ofthe total production of a trophic group, p, that is consumed by its pre-dators, c, and Pp/Bp is the ratio of production (Pp) of a species/group toits biomass (Bp). The system of linear equations (Eq. (1)) allows calcu-lation of the food web mass balance based on specified diet interac-tions (Eq. (2)), and the EEp of each group (from Eq. (3)). The foodweb model is balanced if EEp is <1 for each trophic group.
Because the above food web model assumes top-down control,assessing the effect of a reduction in prey production and biomasson predator production and biomass is difficult (Steele, 2009).Thus, the second part of the modeling study was to use the ap-proach of Steele (2009) and Steele and Ruzicka (2011) that allowsthe linear equations in the above model to be transposed into a setof equations in which the production of a predator (Pc) is controlledby the production of its prey (Pp) (i.e. bottom-up control):
Pc ¼ Pp=Qp
Xp
AcpEEpPp ð4Þ
where Pp/Qp is the predator production to consumption ratio(equivalent to gross growth efficiency) and Acp is the partitioningof the production of each prey (Pp) among their predators (Pc)(Steele, 2009; Steele and Ruzicka, 2011). The production matrixAcp is calculated from the system of equations:
Qpc ¼ DCpcQ c DCpc P 0 ðtop-down approachÞ ð5Þ
Qpc ¼ AcpPp Acp P 0 ðbottom up approachÞ ð6Þ
where Qpc is the rate at which the prey biomass, Bp, is consumed bythe predator biomass, Bc. The terms DCpc, Qpc, and Pp are obtained
of the food web of the southern region of the western Antarctic Peninsula13.11.007

Fig. 2. Summary of the energy flows in the southwestern Antarctic Peninsula (sWAP) food web model. The 24 food web model groups are grouped into 7 compartments thatcorrespond to primary producers, detritus, zooplankton, microzooplankton, benthic invertebrates, fish and cephalopods (intermediate predators), seabirds and marinemammals (top predators). Arrows indicate the transfer of energy between compartments (g C m�2 y�1); the percentage contribution of model groups to these energy fluxes isindicated (bottom part of each box). For each model group, the overall proportion of annual production consumed in the food web (ecotrophic efficiency, first number, upperpart of box) and the fraction of this proportion that is consumed outside the compartment (number in parentheses, upper part of box) is given. The species/groups are definedin Table 1.
4 T. Ballerini et al. / Progress in Oceanography xxx (2013) xxx–xxx
from the top-down model and used to calculate the production ma-trix, Acp.
The top-down (Eq. (1)) and bottom-up (Eq. (4)) models both re-quire estimates of spatially-averaged biomass, estimates of pro-duction and consumption, as well as specification of dietcomposition for each trophic group. Details of how these were ob-tained follow.
Please cite this article in press as: Ballerini, T., et al. Productivity and linkagescontinental shelf. Prog. Oceanogr. (2013), http://dx.doi.org/10.1016/j.pocean.20
2.2. Specification of model parameters
2.2.1. Carbon biomass estimatesThe initial biomass values used for each trophic group in the
sWAP food web model (Table 1) did not include a biomass estimatefor the primary producer group. The biomass for this group corre-sponds to the direct demand for primary production by consumer
of the food web of the southern region of the western Antarctic Peninsula13.11.007
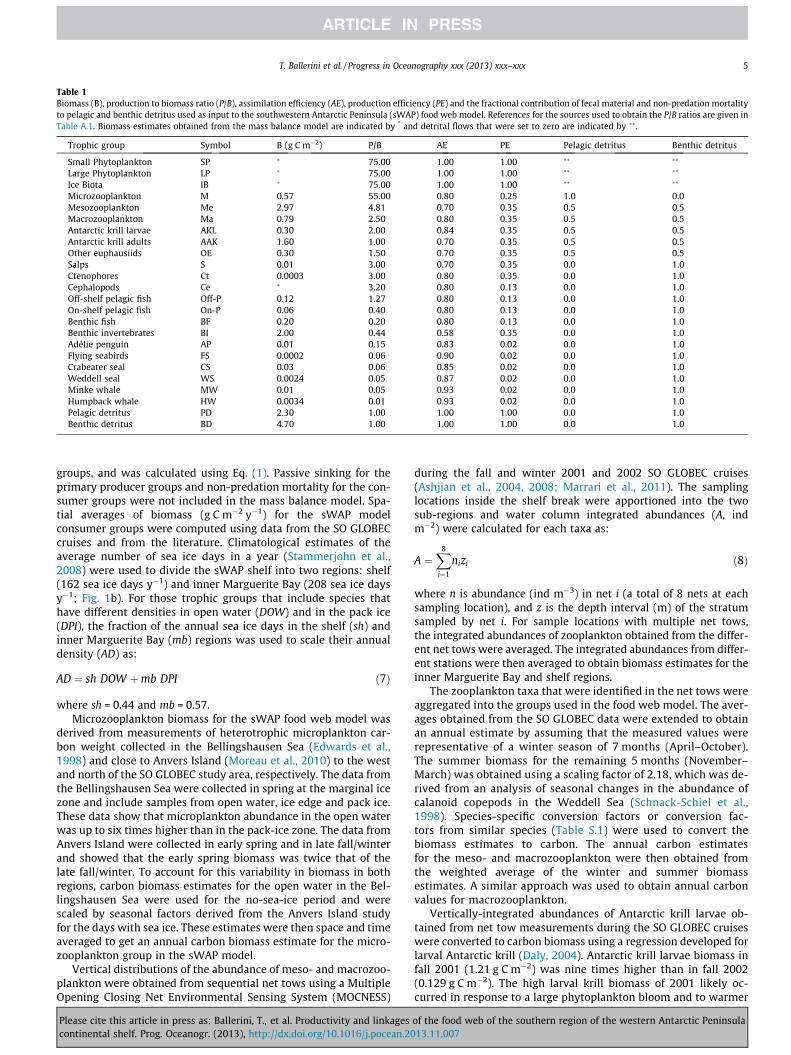
Table 1Biomass (B), production to biomass ratio (P/B), assimilation efficiency (AE), production efficiency (PE) and the fractional contribution of fecal material and non-predation mortalityto pelagic and benthic detritus used as input to the southwestern Antarctic Peninsula (sWAP) food web model. References for the sources used to obtain the P/B ratios are given inTable A.1. Biomass estimates obtained from the mass balance model are indicated by * and detrital flows that were set to zero are indicated by ��.
Trophic group Symbol B (g C m�2) P/B AE PE Pelagic detritus Benthic detritus
Small Phytoplankton SP � 75.00 1.00 1.00 �� ��
Large Phytoplankton LP � 75.00 1.00 1.00 �� ��
Ice Biota IB � 75.00 1.00 1.00 �� ��
Microzooplankton M 0.57 55.00 0.80 0.25 1.0 0.0Mesozooplankton Me 2.97 4.81 0.70 0.35 0.5 0.5Macrozooplankton Ma 0.79 2.50 0.80 0.35 0.5 0.5Antarctic krill larvae AKL 0.30 2.00 0.84 0.35 0.5 0.5Antarctic krill adults AAK 1.60 1.00 0.70 0.35 0.5 0.5Other euphausiids OE 0.30 1.50 0.70 0.35 0.5 0.5Salps S 0.01 3.00 0.70 0.35 0.0 1.0Ctenophores Ct 0.0003 3.00 0.80 0.35 0.0 1.0Cephalopods Ce � 3.20 0.80 0.13 0.0 1.0Off-shelf pelagic fish Off-P 0.12 1.27 0.80 0.13 0.0 1.0On-shelf pelagic fish On-P 0.06 0.40 0.80 0.13 0.0 1.0Benthic fish BF 0.20 0.20 0.80 0.13 0.0 1.0Benthic invertebrates BI 2.00 0.44 0.58 0.35 0.0 1.0Adélie penguin AP 0.01 0.15 0.83 0.02 0.0 1.0Flying seabirds FS 0.0002 0.06 0.90 0.02 0.0 1.0Crabeater seal CS 0.03 0.06 0.85 0.02 0.0 1.0Weddell seal WS 0.0024 0.05 0.87 0.02 0.0 1.0Minke whale MW 0.01 0.05 0.93 0.02 0.0 1.0Humpback whale HW 0.0034 0.01 0.93 0.02 0.0 1.0Pelagic detritus PD 2.30 1.00 1.00 1.00 0.0 1.0Benthic detritus BD 4.70 1.00 1.00 1.00 0.0 1.0
T. Ballerini et al. / Progress in Oceanography xxx (2013) xxx–xxx 5
groups, and was calculated using Eq. (1). Passive sinking for theprimary producer groups and non-predation mortality for the con-sumer groups were not included in the mass balance model. Spa-tial averages of biomass (g C m�2 y�1) for the sWAP modelconsumer groups were computed using data from the SO GLOBECcruises and from the literature. Climatological estimates of theaverage number of sea ice days in a year (Stammerjohn et al.,2008) were used to divide the sWAP shelf into two regions: shelf(162 sea ice days y�1) and inner Marguerite Bay (208 sea ice daysy�1; Fig. 1b). For those trophic groups that include species thathave different densities in open water (DOW) and in the pack ice(DPI), the fraction of the annual sea ice days in the shelf (sh) andinner Marguerite Bay (mb) regions was used to scale their annualdensity (AD) as:
AD ¼ sh DOW þmb DPI ð7Þ
where sh = 0.44 and mb = 0.57.Microzooplankton biomass for the sWAP food web model was
derived from measurements of heterotrophic microplankton car-bon weight collected in the Bellingshausen Sea (Edwards et al.,1998) and close to Anvers Island (Moreau et al., 2010) to the westand north of the SO GLOBEC study area, respectively. The data fromthe Bellingshausen Sea were collected in spring at the marginal icezone and include samples from open water, ice edge and pack ice.These data show that microplankton abundance in the open waterwas up to six times higher than in the pack-ice zone. The data fromAnvers Island were collected in early spring and in late fall/winterand showed that the early spring biomass was twice that of thelate fall/winter. To account for this variability in biomass in bothregions, carbon biomass estimates for the open water in the Bel-lingshausen Sea were used for the no-sea-ice period and werescaled by seasonal factors derived from the Anvers Island studyfor the days with sea ice. These estimates were then space and timeaveraged to get an annual carbon biomass estimate for the micro-zooplankton group in the sWAP model.
Vertical distributions of the abundance of meso- and macrozoo-plankton were obtained from sequential net tows using a MultipleOpening Closing Net Environmental Sensing System (MOCNESS)
Please cite this article in press as: Ballerini, T., et al. Productivity and linkagescontinental shelf. Prog. Oceanogr. (2013), http://dx.doi.org/10.1016/j.pocean.20
during the fall and winter 2001 and 2002 SO GLOBEC cruises(Ashjian et al., 2004, 2008; Marrari et al., 2011). The samplinglocations inside the shelf break were apportioned into the twosub-regions and water column integrated abundances (A, indm�2) were calculated for each taxa as:
A ¼X8
i¼1
nizi ð8Þ
where n is abundance (ind m�3) in net i (a total of 8 nets at eachsampling location), and z is the depth interval (m) of the stratumsampled by net i. For sample locations with multiple net tows,the integrated abundances of zooplankton obtained from the differ-ent net tows were averaged. The integrated abundances from differ-ent stations were then averaged to obtain biomass estimates for theinner Marguerite Bay and shelf regions.
The zooplankton taxa that were identified in the net tows wereaggregated into the groups used in the food web model. The aver-ages obtained from the SO GLOBEC data were extended to obtainan annual estimate by assuming that the measured values wererepresentative of a winter season of 7 months (April–October).The summer biomass for the remaining 5 months (November–March) was obtained using a scaling factor of 2.18, which was de-rived from an analysis of seasonal changes in the abundance ofcalanoid copepods in the Weddell Sea (Schnack-Schiel et al.,1998). Species-specific conversion factors or conversion fac-tors from similar species (Table S.1) were used to convert thebiomass estimates to carbon. The annual carbon estimatesfor the meso- and macrozooplankton were then obtained fromthe weighted average of the winter and summer biomassestimates. A similar approach was used to obtain annual carbonvalues for macrozooplankton.
Vertically-integrated abundances of Antarctic krill larvae ob-tained from net tow measurements during the SO GLOBEC cruiseswere converted to carbon biomass using a regression developed forlarval Antarctic krill (Daly, 2004). Antarctic krill larvae biomass infall 2001 (1.21 g C m�2) was nine times higher than in fall 2002(0.129 g C m�2). The high larval krill biomass of 2001 likely oc-curred in response to a large phytoplankton bloom and to warmer
of the food web of the southern region of the western Antarctic Peninsula13.11.007

6 T. Ballerini et al. / Progress in Oceanography xxx (2013) xxx–xxx
than average water temperature that year (Marrari et al., 2008).High larval krill recruitment is thought to occur about once every7 years (i.e. with a probability of 1/7 = 0.143; Daly, unpublisheddata). To account for this variability, the larval Antarctic krill bio-mass estimate for the sWAP food web model was calculated asthe weighted average between the unusual high biomass of 2001(with a weight of 0.143) and the more normal biomass of 2002(with a weight equal to 1–0.143 = 0.857). This yielded an estimatedaverage biomass of 0.284 g C m�2 y�1.
The combined juvenile and adult Antarctic krill net-derivedabundances from 2001 and 2002 were vertically and spatially-averaged and converted to carbon biomass to obtain the annualbiomass estimate for the adult Antarctic krill group in the sWAPfood web model. A similar approach was used to obtain annualbiomass for the other euphausiids group. The density and bio-mass of salps in a part of the Antarctic shelf partially overlap-ping with the SO GLOBEC study area was measured in earlyfall 2001 as part of the German SO GLOBEC field program(Pakhomov et al., 2006). The earlier timing of the German cruiseplaced it before sea ice developed and salps were still present.The measured biomass value of 0.0173 g C m�2 was applied tothe shelf sub-region and the spatially averaged biomass is0.009 g C m�2. However, the salps observed on the AntarcticPeninsula shelf in fall 2001 were likely the result of an advectiveevent, which can provide considerable variability in their meandensity and distribution (Pakhomov et al., 2006). Thus, the val-ues used in the food web model, while representative of ob-served conditions for one season, may not reflect conditions atother times. The density and biomass in the inner MargueriteBay sub-region was set to zero as suggested by observations(Marrari et al., 2011).
Ctenophore abundance was measured during the SO GLOBECcruises (Scolardi et al., 2006) and was converted to carbon biomassusing the conversion relationships given in Scolardi et al. (2006).These observations were assumed to apply over a year.
No data on cephalopods are available for the SO GLOBEC region;therefore, their biomass was estimated with the top-down massbalance model (Eq. (1)). Antarctic silverfish and lantern fish bio-mass measured during the SO GLOBEC cruises (Donnelly and Tor-res, 2008) provided the estimates for the on-shelf and off-shelfpelagic fish groups, respectively. Other pelagic fish species wereapportioned into the two pelagic fish groups based on their relativeabundances in the shelf and inner Marguerite Bay regions. Carbonbiomass was obtained assuming a carbon-to-wet-weight ratio of0.1. No data are available for the sWAP benthic fish community.Therefore, data presented in Donnelly et al. (2004) for the RossSea benthic fish community were used to obtain carbon biomassfor a representative benthic fish community. Benthic invertebratebiomass was not measured during SO GLOBEC; therefore, the bio-mass of this group was taken from an earlier study (Smith et al.,2006) and converted to carbon biomass using a carbon-to-dry-weight ratio of 0.4.
Adélie penguin biomass was estimated using summer densityvalues from breeding colonies in the Marguerite Bay region and thendoubled to account for non-breeders (Ainley, 2002). The summerdensity was spatially-averaged using the model domain area(83,670 km2) to obtain a density of 2.38 ind km�2. Telemetry datafrom Adélie penguins tagged in Marguerite Bay during SO GLOBEC(Erdmann et al., 2011) showed that the flux of penguins into/outof this region was relatively balanced. Individual body weight forpenguins in the month of October was set at 8 kg for breeding and6 kg for non-breeding birds (Penney, 1967). Penguin body mass usedfor the other months was 4.5 kg (Ribic et al., 2011). The mean annualwet weight biomass was obtained by averaging the monthly valuesand was converted to carbon biomass using a carbon-to-wet-weightconversion of 0.2 (Burger and Schreiber, 2001).
Please cite this article in press as: Ballerini, T., et al. Productivity and linkagescontinental shelf. Prog. Oceanogr. (2013), http://dx.doi.org/10.1016/j.pocean.20
Densities of several species of flying seabirds were measuredduring the SO GLOBEC cruises (Ribic et al., 2011) and these werecombined with data from the literature to obtain average densi-ties for the sWAP region (Ribic et al., 2011). The annual densitiesin the shelf and inner Marguerite Bay regions were calculatedbased on the number of sea ice days in each region. Average bodymass of individual species (Table S.2) was used to obtain a totalseabird biomass, which was then converted to carbon biomassusing a carbon-to-wet-weight conversion of 0.2 (Burger andSchreiber, 2001).
The average density of crabeater seals in ice-covered(1.31 ind km�2) and open water (0.16 ind km�2) areas in the Mar-guerite Bay region was obtained from SO GLOBEC surveys (Chap-man et al., 2004; Ribic et al., 2008). An annual density for theshelf and inner Marguerite Bay regions was calculated for the timethat the two regions have sea ice. The density for the overall region(0.74 ind km�2) was obtained as a spatially-weighted average be-tween the shelf and inner Marguerite Bay. Wet biomass was ob-tained using an average individual mass (250 kg ind�1: Nørdoyet al., 1995; McDonald et al., 2008) and converted to carbon bio-mass assuming conversions of 0.35 and 0.5 for wet weight to dryweight and dry weight to carbon, respectively.
Weddell seals (Leptonychotes weddellii) prefer fast ice and densepack ice (Siniff et al., 2008) and the SO GLOBEC cruises did not ex-tend into these regions. As a result, the winter encounter rates forWeddell seals were so low that density estimates were unreliable(Chapman et al., 2004). Thus, an indirect estimate of their abun-dance was obtained by scaling their number with respect to thenumber of crabeater seals. A study of seal relative abundance(Erickson and Hanson, 1990) showed that Weddell seal abundanceis about 3% of crabeater seal abundance. This percent was used toscale crabeater seal abundance to Weddell Sea abundance. This im-plies a Weddell Sea density of 0.03 ind km�1. An individual averageweight of 450 kg (Proffitt et al., 2007) gave an annual wet biomassof 12.3 kg km�2, which was converted to carbon biomass (Table 1)using the wet and dry weight ratios used for crabeater seals.
Minke whale (Balaenoptera bonaerensis) abundance along thesWAP for December to February has been estimated to be0.014 ind km�2 (Branch, 2006). Seasonal variation in minke whaledensity was estimated from cetacean observations made duringthe SO GLOBEC fall and winter cruises as well as during SO GLOBECmooring deployment cruises in late summer (Thiele et al., 2004).The maximum abundance value observed during each SO GLOBECcruise was used to calculate minke whale abundance for March–May, June–August, and December–February. These values wereused to calculate abundance ratios for the fall and winter and theratios were used to scale the summer density values from Branch(2006) to obtain an annual density estimate of 0.008 ind km�2. An-nual wet weight biomass was calculated assuming a demographicstructure (female:male, mature:immature) and the correspondingaverage individual body mass as reported in Konishi et al. (2008)and Tamura and Konishi (2009). The wet biomass (0.0517 t km�2)was converted to carbon biomass (Table 1) using a wet weight todry weight ratio of 0.35 and a dry weight to carbon weight ratioof 0.5. Similarly, the abundance of humpback whales (Megapteranovaeangliae) along the sWAP from December to February wasestimated as 0.0014 ind km�2 (Branch, 2007). Seasonal variabilityin humpback whale density was determined from the SO GLOBECcetacean sightings data (Thiele et al., 2004) and the abundance ra-tios were used to scale the abundance estimates from Branch(2006) to obtain seasonal density estimates, which were averagedto obtain an annual density estimate of 0.0007 ind km�2. The aver-age individual body mass for a humpback whale (26,924 kg, Reillyet al., 2004) was used to estimate wet biomass (0.0517 t km�2),which was converted to carbon biomass using the same conver-sions as used for minke whales.
of the food web of the southern region of the western Antarctic Peninsula13.11.007
T. Ballerini et al. / Progress in Oceanography xxx (2013) xxx–xxx 7
2.2.2. Production/biomass ratiosThe rate at which a species or trophic group replaces itself, the
turnover rate, can be expressed by its production per unit biomass.In the mass balance model the production to biomass ratio (P/B)provides an estimate of the annual growth for each of the foodweb components (Table 1).
The P/B ratio for the primary producer groups was derived fromsatellite estimates of primary production and chlorophyll a con-centration in the study area during the period 1998–2007. Themicrozooplankton P/B ratio is consistent with values that can becalculated from data given in Hansen et al. (1997). For the zoo-plankton groups included in the sWAP food web model, P/B ratioswere taken from previous studies (Table A.1). For the fish groups,the P/B ratios were obtained from the regression given in Banseand Mosher (1980), which relates the P/B ratio to mass at maturity(Mm) as:
logPB
� �¼ aþ b logðMmÞ ð8Þ
where a is 0.44 and b is �0.23. The values of the coefficients in Eq.(8) were derived from a meta-analysis of fish species in temperateand tropical regions and did not include organisms that inhabit coldenvironments. Therefore, the P/B values obtained from Eq. (8) werereduced by 20% for the off-shelf pelagic fish and by 25% for the on-shelf pelagic fish (Greely et al., 1999; J. Torres, pers. comm.) to ac-count for the slower turnover rate in colder waters.
For top predators, the P/B ratio was assumed to be the valuethat balanced annual adult mortality (Banse and Mosher, 1980).For Adélie penguins the annual adult survival is estimated to be0.85 (Ballerini et al., 2009), which gives a P/B ratio of 0.15. Annualadult survival rates have been estimated for several Antarctic sea-birds (e.g., 0.94 for snow petrel Pagodroma nivea, Jenouvrier et al.,2005b; 0.92 for Antarctic fulmar Fulmarus glacialoides, Jenouvrieret al., 2005a; 0.96 for south polar skua Stercorarius maccormicki,Ratcliffe et al., 2002), and these were averaged to obtain a bio-mass-weighted survival of 0.94 and a P/B ratio of 0.06 for the sea-bird group.
For crabeater seals, annual adult survival (s) was calculatedfrom mean life expectancy (le) using the relationship:
le ¼ 1� log s
ð9Þ
where le was 34.5 years (Bengston and Siniff, 1981; Efran and Pitch-er, 2005). This gives an annual survival of 0.935 and a P/B ratio of0.065. Average annual survival for Weddell seals is estimated tobe 0.92 (Rotella et al., 2009), which gives a P/B ratio of 0.08. The an-nual survival for minke whales and humpback whales was calcu-lated using Eq. (9) with average life expectancies of 50 and75 years, respectively (Ohsumi, 1979a,b), and used to obtain P/B ra-tios (Table 1).
2.2.3. Gross growth efficiency and consumption ratesThe mass balance food web model (Eqs. (1) and (2)) requires
estimates of the consumption (Q) of each trophic group per unitbiomass (Q/B). This ratio can be estimated from daily feeding rates(expressed as kg of meal per kg of body weight) or can be calcu-lated as:
Q=B ¼ P=BP=Q
ð10Þ
where the P/Q ratio corresponds to the gross growth efficiency,which is the product of the assimilation efficiency (AE) and produc-tion efficiency (PE). Using the gross growth efficiency to obtain theP/Q ratio allows explicit calculation of unassimilated ingestion(1-AE) that goes to the detrital pool and of energy lost to metabolic
Please cite this article in press as: Ballerini, T., et al. Productivity and linkagescontinental shelf. Prog. Oceanogr. (2013), http://dx.doi.org/10.1016/j.pocean.20
processes (e.g., respiration, 1-PE), and thus ensures consistency be-tween the assumed consumption and production rates for each tro-phic group in the food web model (Link, 2010). The assimilation andproduction efficiency values used to calculate the gross growth effi-ciency for the sWAP trophic groups (Table 1) were obtained fromTownsend et al. (2003), with the exception of the assimilation effi-ciency value for larval Antarctic krill that was taken from Meyeret al. (2003). The reconstructed gross growth efficiency values areconsistent with values used in other Southern Ocean food webmodels (Banse, 1995; Priddle et al., 1998). These values and theP/B ratios given above were used to calculate the Q/B ratio for eachtrophic group.
2.2.4. Diet compositionEach trophic group in the sWAP food web has an associated
diet, which determines the transfer of energy in the food web(Table 2). The percent composition of prey in the diets of manyof the sWAP trophic groups was based on observations(Table A.1); for some groups (mesozooplankton, macrozooplank-ton, larval and adult Antarctic krill and other euphausiids) suffi-cient data were available to construct monthly or seasonal diets(Tables S.3-S.11), which were averaged to obtain an annual diet.Allowing cannibalism can result in an unstable set of linear equa-tions (Steele and Ruzicka, 2011); therefore, the specified diet com-position of the microzooplankton and benthic invertebrate groupsincluded only primary producers or detritus (Table 2) and the in-tra-guild predation (i.e., consumption of heterotrophic material)in these groups was taken into account by reducing their assumedgross growth efficiency by 50% (Table 1). The result is that themicrozooplankton diet is composed only of autotrophic material(Table 2). The microzooplankton community during the fall SOGLOBEC cruises was dominated by phaeodarian radiolariansand the ciliate, Mesodinium sp., (Daly, 2004), both of which eat arange of particle sizes that are consistent with the specified diet(Froneman and Perissinotto, 1996).
Salps feed efficiently on a wide range of particles (1–1000 lm)(Pakhomov et al., 2006) and the diet for this group accounts forthis, with most of the consumption focused on smaller particles(Table 2). The ctenophore diet was based on observations thatshow that ctenophores feed on calanoid copepods, amphipods,and larval Antarctic krill (Ju et al., 2004; Scolardi et al., 2006).
Cephalopods are opportunistic feeders (Rodhouse and Nigma-tullin, 1996) and feed on crustaceans and fish (Collins and Rod-house, 2006). The diet specified for this group was equallydivided between fish and zooplankton, with most of the zooplank-ton being Antarctic krill (Table 2).
The diets of the off-shelf and on-shelf pelagic fish groups werebased on the diets of lantern fish and of Antarctic silverfish, respec-tively, which feed on meso- and macrozooplankton, Antarctic krill,and other euphausiids (Kock, 1987). The relative abundance ofeach of the zooplankton groups in the diets was used to specifythe annual diets of the off- and on-shelf pelagic fish groups, withmost of the consumption being mesozooplankton and adult Ant-arctic krill (Table 2). Observations show that the diet of benthic fishconsists of benthic invertebrates, Antarctic silverfish, and Antarctickrill, with smaller contributions from other zooplankton, lanternfish, and cephalopods. The diet constructed for benthic fish wasapportioned across these prey items (Table 2).
Adélie penguins consume primarily Antarctic krill and fish,including lantern fish (in winter, Ainley et al., 1992) and Antarcticsilverfish, with some consumption of other euphausiids and ceph-alopods (Volkman et al., 1980; Ainley, 2002; Ainley et al., 2003;Fraser and Hofmann, 2003). The annual diet constructed for Adéliepenguins accounted for variations in the relative abundance ofthese prey in the diet between summer, when Antarctic krill dom-inate, and winter, when the diet is more varied. Adult Antarctic
of the food web of the southern region of the western Antarctic Peninsula13.11.007

Table 2Diet composition (%) specified for the trophic groups included in the southwestern Antarctic Peninsula (sWAP) food web model. The values represent the percent contribution ofeach producer group (rows) to the diet of each consumer group (columns). References for the diet composition used for each model group are given in Table A.1. The symbols usedto identify the species/groups are defined in Table 1.
Producers Consumers
4 5 6 7 8 9 10 11 12 13 14 15 16 17 18 19 20 21 22
1 SP 60 23 1 23 0 0 40 0 0 0 0 0 0 0 0 0 0 0 02 LP 25 65 10 46 53 60 20 0 0 0 0 0 0 0 0 0 0 0 03 IB 0 0 0 9 0 0 0 0 0 0 0 0 0 0 0 0 0 0 04 M 0 5 1 15 6 0 30 0 0 0 0 0 0 0 0 0 0 0 05 Me 0 0 72 0 24 24 5 88 0 41 28 5 0 0 2 0 0 0 56 Ma 0 0 0 0 0 0 0 0 9 18 12 5 0 0 0 0 0 0 07 AKL 0 0 2 0 0 0 5 12 0 7 5 0 0 0 0 0 0 0 08 AAK 0 0 2 0 0 0 0 0 37 27 50 15 0 52 10 94 0 94 709 OE 0 0 1 0 0 0 0 0 4 7 5 2 0 7 0 1 0 6 0
10 S 0 0 0 0 0 0 0 0 0 0 0 0 0 0 0 0 0 0 011 Ct 0 0 1 0 0 0 0 0 0 0 0 0 0 0 0 0 0 0 012 Ce 0 0 0 0 0 0 0 0 0 0 0 8 0 30 30 2 50 0 513 Off-P 0 0 0 0 0 0 0 0 25 0 0 10 0 8 32 1 18 0 1014 On-P 0 0 0 0 0 0 0 0 25 0 0 15 0 3 20 2 16 0 1015 BF 0 0 0 0 0 0 0 0 0 0 0 0 0 0 6 0 16 0 016 BI 0 0 0 0 0 0 0 0 0 0 0 40 0 0 0 0 0 0 017 AP 0 0 0 0 0 0 0 0 0 0 0 0 0 0 0 0 0 0 018 FS 0 0 0 0 0 0 0 0 0 0 0 0 0 0 0 0 0 0 019 CS 0 0 0 0 0 0 0 0 0 0 0 0 0 0 0 0 0 0 020 WS 0 0 0 0 0 0 0 0 0 0 0 0 0 0 0 0 0 0 021 MW 0 0 0 0 0 0 0 0 0 0 0 0 0 0 0 0 0 0 022 HW 0 0 0 0 0 0 0 0 0 0 0 0 0 0 0 0 0 0 023 PD 15 7 0 7 1 0 0 0 0 0 0 0 0 0 0 0 0 0 024 BD 0 0 10 0 16 16 0 0 0 0 0 0 100 0 0 0 0 0 0
Table 3Biomass (B), annual production (P), annual consumption (Q), trophic level (TL) andecotrophic efficiency (EE) for each trophic group in the southwestern AntarcticPeninsula (sWAP) food web model after the model was mass balanced.
Species/group B (g C m�2) P (g C m�2) Q (g C m�2) TL EE
Small Phytoplankton 1.43 107.39 – 1.00 1.00Large Phytoplankton 1.11 83.35 – 1.00 1.00Ice Biota 0.003 0.185 – 1.00 1.00Microzooplankton 0.57 31.13 155.65 2.00 0.12Mesozooplankton 2.97 14.29 58.30 2.05 0.60Macrozooplankton 0.79 1.98 7.06 2.85 0.27Antarctic krill larvae 0.30 0.60 2.05 2.15 0.61Antarctic krill adults 1.74 1.74 7.11 2.31 1.00Other euphausiids 0.30 0.45 1.84 2.25 0.65Salps 0.009 0.027 0.110 2.41 0.00Ctenophores 0.024 0.071 0.252 3.06 1.00Cephalopods 0.014 0.044 0.435 3.85 1.00Off-shelf pelagic fish 0.12 0.15 1.53 3.29 1.00On-shelf pelagic fish 0.43 0.17 1.73 3.29 1.00Benthic fish 0.20 0.04 0.4 3.57 0.04Benthic
invertebrates2.00 0.88 4.38 2.00 0.18
Adélie penguin 0.002 0.0003 0.0185 3.88 0.00Flying seabirds 0.0002 0.00000 0.00067 4.35 0.00Crabeater seal 0.032 0.0014 0.0720 3.37 0.00Weddell seal 0.0024 0.0002 0.0086 4.61 0.00Minke whale 0.009 0.0005 0.0242 3.31 0.00Humpback whale 0.0034 0.0001 0.0073 3.57 0.00Pelagic detritus 2.30 – – 1.00 0.38Benthic detritus 4.70 – – 1.00 0.35
8 T. Ballerini et al. / Progress in Oceanography xxx (2013) xxx–xxx
krill make up about 50% of the constructed Adélie penguin annualdiet.
The flying seabird diet composition was constructed fromobservations of the diets of snow petrels, Antarctic fulmars andcape petrels (Daption capense) (Ainley et al., 1992), south polarskuas (Ainley et al., 1984), and black-browed albatross (Thalassar-che melanophrys) (Xavier et al., 2003). Snow petrels are associatedwith areas with sea ice, whereas the other species are associatedwith open water, and the diet composition reflects the species dif-ferences in the two regions. The ice- and open-water associateddiets were used to construct an annual average diet for seabirds(Table 2), which is based primarily on cephalopods and pelagic fish.
Crabeater seals eat mostly Antarctic krill (Siniff et al., 2008)with small contributions from cephalopods and fish (Øristland,1977). Thus, the annual diet consists primarily of Antarctic krill(Table 2). The diet for Weddell seals is more varied, consisting ofcephalopods and fish, with the most common fish being Antarcticsilverfish (Green and Burton, 1987; Ponganis and Stockard, 2007;Ainley and Siniff, 2009). The annual diet for Weddell seals was splitevenly between cephalopods and fish, and within the fish it wasevenly apportioned among the three fish groups in the food webmodel (Table 2).
The diet of Antarctic minke whales is primarily Antarctic krill(Ichii and Kato, 1991; Ichii et al., 1998) and this is reflected inthe annual diet specified for this species (Table 2). Humpbackwhales also feed predominately on Antarctic krill (Kawamura,1980), but with some contribution from fish. Thus, the specifieddiet for this trophic group consisted mostly of adult Antarctic krillwith smaller contributions from on-shelf and off-shelf pelagic fish,cephalopods and mesozooplankton.
2.3. Food web balance
The sWAP food web model was implemented using the param-eter values and diet compositions given in Tables 1 and 2. Massbalance is achieved when all of the ecotrophic efficiency values,EEp in Eq. (3), are less than 1. An unbalanced model can be resolved
Please cite this article in press as: Ballerini, T., et al. Productivity and linkagescontinental shelf. Prog. Oceanogr. (2013), http://dx.doi.org/10.1016/j.pocean.20
by modifying predator diets and consumption rates, physiologicalefficiencies, or prey biomass. For the sWAP food web model, theapproach used was to increase the biomass of the prey by settingtheir EE = 1 (similar to Hill et al., 2012). For the initial implementa-tion of the sWAP food web model, three groups (ctenophores, on-shelf pelagic fish and on-shelf pelagic fish) had EE > 1, which indi-cated that the estimated production rate for these groups was toolow to support the estimated consumption by their predators. The
of the food web of the southern region of the western Antarctic Peninsula13.11.007

T. Ballerini et al. / Progress in Oceanography xxx (2013) xxx–xxx 9
biomass for these three groups was increased, but was still withinthe variability of observed biomasses for these groups (Table 3).Increasing the biomass of the pelagic fish groups led to higher con-sumption of adult Antarctic krill, and produced an EE for thisgroup > 1. Therefore, the adult Antarctic krill biomass was alsomass balanced by setting its EE = 1. The revised biomass estimatewas within the variability of biomass estimates for Antarctic krillobtained from acoustic surveys in the study area (Lawson et al.,2008a).
Inputs to the pelagic and benthic detritus groups are from fecesand non-predation mortality of consumer groups (Table 1). Theunbalanced primary producer and consumer groups were balancedusing EE = 1, which does not allow for passive sinking and non-pre-dation mortality losses. Messy feeding by zooplankton is also notincluded in the model. Thus the estimated detrital fluxes fromthe sWAP food web model represent lower bounds.
Results from the sWAP mass balance baseline simulations wereused in Eqs. (5) and (6) to create the bottom-up model (Eq. (4)) andto calculate the production matrix Acp (Table A.3). The productionmatrix was used in simulations that addressed possible outcomesof environmental changes (see Section 2.4.2).
2.4. Model analysis and metrics
The mass balance model implemented with the data summa-rized in Tables 1 and 2 was used to obtain a baseline simulationfor the sWAP food web that provided an estimate of the primaryproduction required by the food web and an estimate of the energyflows between trophic groups. The diet composition of the baselinesimulation was used to calculate the trophic level of the sWAPmodel groups. The baseline simulation also provided a referencefor comparison for the sensitivity analyses and environmentalchange scenario simulations.
2.4.1. Sensitivity analysis – role of Antarctic krill in energy transferThe sWAP food web model is focused on a main target species,
Antarctic krill, with decreasing resolution up and down the trophicscale from this species, i.e. a rhomboid model structure (de Younget al., 2004). Therefore, sensitivity analyses were designed to inves-tigate changes that result from modifications to the inputs and out-puts that affect Antarctic krill and the effect of this species on othertrophic levels.
The first set of simulations focused on estimates of primary pro-duction required to sustain the food web by modifying the bio-mass, P/B ratio, and diet composition of the adult Antarctic krill.The second set of simulations compared the estimates of primaryproduction from the baseline sWAP simulation with three alterna-tive implementations that included modified values of grossgrowth efficiencies for all trophic groups that were derived fromearlier modeling studies of Southern Ocean food webs (Banse,1995; Priddle et al., 1998) and those derived from daily feedingrates (Table A.2). These simulations included the variability inadult Antarctic krill parameters used in the first set of sensitivityanalyses.
The third set of simulations investigated the effects of the as-sumed biomass of fish, seabirds, and marine mammals on the esti-mates of adult Antarctic krill biomass that is consumed in thesWAP baseline model. The estimated proportion of the productionof a prey species that is consumed (i.e. the EE of the prey) dependson the assumed prey parameters and on the assumed consumptionrates of its predators. The predator consumption rates, in turn, arerelated to the assumed predator biomass, which for many of thetrophic groups included in the sWAP food web model is poorlyconstrained (see Hill et al., 2005; Laws, 1977; Woehler and Croxall,1997; Southwell et al., 2008). Therefore, the biomass of the trophicgroups that consume adult Antarctic krill was doubled with
Please cite this article in press as: Ballerini, T., et al. Productivity and linkagescontinental shelf. Prog. Oceanogr. (2013), http://dx.doi.org/10.1016/j.pocean.20
respect to the baseline simulation and the resulting demand onAntarctic krill production (i.e. the adult Antarctic krill EE) was cal-culated. These simulations also compared adult Antarctic krill bio-mass derived from net-tows and acoustic estimates.
2.4.2. Environmental change scenariosFive environmental change scenarios were implemented with
the bottom-up model (Eq. (4)) to simulate the effects of alteredplankton assemblage composition on the production of vertebratepredators in the sWAP food web model. The scenarios were se-lected based on observed or expected changes in the relative abun-dance of phytoplankton and zooplankton groups that may resultfrom changes in hydrographic conditions and/or sea ice extentchanges linked to the warming trend in the western Antarctic Pen-insula. The simulations were done by altering the entries in theproduction matrix, Acp (Table 8), and redirecting 50% of a preysource from one consumer group to another. All simulations wereimplemented with constant primary production and did not allowfor prey switching. The effects of the different perturbations wereexpressed in terms of the fractional change in productivity relativeto the productivity in the bottom-up model derived from the base-line sWAP mass balance model.
The first scenario simulated a 50% decrease in the contributionof large phytoplankton to total primary production with a compen-satory increase in the production of the small phytoplanktongroup. This scenario was based on the observation that in the re-gion to the north of the sWAP study area, in the past 30 years,the phytoplankton composition has undergone a shift to smallerflagellates (Montes-Hugo et al., 2009). A similar shift from largediatoms to smaller cryptophytes has been observed in near shorecoastal waters influenced by glacial meltwater (Moline et al.,2004).
The second scenario tested the consequences of reducing thesecondary production of large zooplankton (mesozooplankton,macrozooplankton, larval and adult Antarctic krill, other euphausi-ids, and salps) by 50% and compensating with an equivalent in-crease in microzooplankton secondary production. This scenariowas based on the prediction that warmer sea water temperaturewill increase the metabolic rates of zooplankton groups. Sincethe microzooplankton have faster turnover rates that the otherzooplankton groups, their biomass is expected to become predom-inant (Richardson, 2008). Scenarios 1 and 2 were implementedwith the bottom-up model derived from the baseline sWAP massbalance model and from a bottom-up model derived from a massbalance model in which the diet of the adult Antarctic krill groupincluded a larger fraction of microzooplankton (45%, same Antarc-tic krill diet used by Hill et al. (2012)).
The third and fourth scenarios tested the effects of a 50% reduc-tion in adult Antarctic krill production that was compensated forby equal increases in mesozooplankton and salp production. Thesescenarios were based on observed correlations between reducedsea ice extent and reduced Antarctic krill recruitment (Fraser andHofmann, 2003) and increased salp abundance (Loeb et al.,1997), and on observations of increased occurrences of salps insome regions of the Antarctic (Atkinson et al., 2004). Antarctic krilllarvae and juveniles use sea ice as an overwintering habitat (Daly,1990; Daly and Macaulay, 1991) and both larval and juvenile Ant-arctic krill feed on the under-ice microbial communities, especiallyin late winter and spring (Hamner et al., 1983; Daly and Macaulay,1988; Marschall, 1988). Reductions in sea ice will, therefore, affectkrill recruitment.
The final scenario considered a 50% reduction in the mesozoo-plankton production that was compensated by the same increasein salp production. This scenario determined if a reduction in themesozooplankton group had the same effect as a reduction in theadult Antarctic krill group.
of the food web of the southern region of the western Antarctic Peninsula13.11.007

10 T. Ballerini et al. / Progress in Oceanography xxx (2013) xxx–xxx
3. Results
3.1. Food web structure and carbon flows in the baseline sWAPsimulation
3.1.1. Trophic levels and trophic pathwaysThe structure of the modeled food web is determined by the
specified diet composition and annual consumption rates for eachmodel group (Tables 1 and 2). The primary producers and the detri-tal groups have trophic level 1, while the trophic level of the con-sumer groups is calculated according to the percentage ofautotrophic and heterotrophic material in their diet (Table 3). Thecalculated trophic level for the microzooplankton and benthic inver-tebrate groups is 2, given the assumptions made about their diet.The trophic level of the other seven zooplankton groups ranges be-tween 2 and 3, while the trophic level of the vertebrate predatorsranges between 3 and 5. Crabeater seals and minke whales havethe lowest trophic level among the top predators because their as-sumed diet is composed mainly of adult Antarctic krill; the flyingseabirds and Weddell seal groups have a higher trophic level be-cause their diets consist primarily of pelagic and benthic fish.
As a result of the diet composition, the sWAP food web modelhas two principal trophic pathways for energy transfer from pri-mary producers to air-breathing predators. The first trophic path-way goes from primary producers to Adélie penguins, crabeaterseals and baleen whales. The diet of these predators has a largecontribution (52–94%) from Antarctic krill (Table 2) and thus, de-spite their large body size, they have a relatively low trophic level(between 3 and 4), which is similar to the trophic level of fish andcephalopods (Table 3). The second trophic pathway goes from pri-mary producers to the flying seabirds and Weddell seals groups.The diets of these two groups are composed principally of fishand cephalopods (Table 2), leading to a trophic level between 4and 5 (Table 3).
Fig. 3. Annual consumption (g C m�2 y�1) of large and small phytoplanktonprimary production by zooplankton groups obtained from the southwesternAntarctic Peninsula (sWAP) mass balance food web model. Phytoplankton groupsare indicated as: small phytoplankton-SP and large phytoplankton-LP. Zooplanktongroups are indicated as: mesozooplankton-Me; larval Antarctic krill-LAK; adultAntarctic krill-AAK; other euphasiids-OE.
Fig. 4. Annual consumption (g C m�2 y�1) of zooplankton and benthic invertebratesby (A) zooplankton predators, (B) intermediate predators and (C) top predatorscalculated from the sWAP food web model. The species/groups are defined inTable 1.
3.1.2. Consumption by food web components and carbon flowsThe direct estimate of annual primary production required to
sustain the food web with the sWAP baseline simulations is191 g C m�2 y�1 (Fig. 2). The majority of this (132 g C m�2 y�1,69%) is consumed by microzooplankton; the other seven zooplank-ton groups consume the remainder. Small phytoplankton produc-tion contributes 71% of the consumption by microzooplankton(Fig. 2), while large phytoplankton production is the largest contri-bution (76%) to the primary production that is grazed by the otherzooplankton groups (Fig. 2).
In the sWAP baseline simulation a relatively small amount ofmicrozooplankton production (EE = 0.12) is consumed by otherzooplankton groups (Fig. 2, Table 3). Mesozooplankton and macro-zooplankton production contributes 32% and 15% of the consump-tion by fish and cephalopods, respectively, but is a minimalcontribution to the consumption by seabirds and marine mammals(Fig. 2). Antarctic krill production contributes 46% of consumptionby fish and cephalopods and 96.3% of consumption by seabirds andmarine mammals. Only small fractions of macrozooplankton(EE = 0.27), benthic invertebrates (EE = 0.18) and benthic fish(EE = 0.036) production are consumed by seabirds and marinemammals (Fig. 2). Salps and ctenophores are not consumed by fishand cephalopods, only infrequently by seabirds (Ainley et al.,1992), and not by marine mammals (Fig. 2).
Consumption of zooplankton by fish and cephalopods is 36 timeshigher than consumption by seabirds and marine mammals(3.6 g C m�1 y�1 and 0.1 g C m�2 y�1, respectively). Seabirds andmarine mammals also consume fish and cephalopods(0.02 g C m�2 y�1), which represent 20% of their total consumption(Fig. 2).
Please cite this article in press as: Ballerini, T., et al. Productivity and linkagescontinental shelf. Prog. Oceanogr. (2013), http://dx.doi.org/10.1016/j.pocean.20
Microzooplankton and mesozooplankton consume155 g C m�2 y�1 and 58 g C m�2 y�1, respectively (Table 3), and ac-count for 89% of the annual carbon consumption by secondary pro-ducers. Most of this carbon is provided by primary production(86%) with the remaining 14% coming from detritus. Microzoo-plankton are the principal grazers of both small (87% of total con-sumption) and large phytoplankton (45% of total consumption)production. Mesozooplankton are the second most important graz-ers of large phytoplankton production (45%, Fig. 3). Consumptionof primary and secondary production by other zooplankton groupsis 1–2 orders of magnitude smaller than that of microzooplanktonand mesozooplankton (Table 3). Adult Antarctic krill consume 88%less primary and secondary production than do mesozooplankton(Fig. 3).
Microzooplankton and mesozooplankton are the most con-sumed diet items by other zooplankton groups, with 78% of micro-zooplankton consumed by mesozooplankton and 59% ofmesozooplankton consumed by macrozooplankton (Fig. 4a). Theconsumption of adult Antarctic krill by fish and cephalopods is lar-ger than the consumption of mesozooplankton (86% and 13%respectively; Fig. 4b).
of the food web of the southern region of the western Antarctic Peninsula13.11.007

Fig. 5. Annual consumption (g C m�2 y�1) of zooplankton and intermediate preda-tors by top predators calculated from the southwestern Antarctic Peninsula (sWAP)food web model. Zooplankton (Z) prey include herbivorous zooplankton, carnivo-rous zooplankton and other euphasiids. Antarctic krill (AK) prey includes larvae andadults. Intermediate predators (F&Ce) include cephalopods, off- and on-shelfpelagic fish, and benthic fish.
T. Ballerini et al. / Progress in Oceanography xxx (2013) xxx–xxx 11
The biomass and consumption rates of seabirds and marinemammals (Table 3) are 16 and 31 times, respectively, lower thanthe biomass of fish and cephalopods (Table 3). Among seabirdsand marine mammals, the crabeater seal has the largest biomass(65% of the total) and the highest annual consumption rate (55%of the total). Despite differences in diets (Table 2), the air-breathingpredators collectively consume more adult Antarctic krill(0.11 g C m�2 y�1) than fish and cephalopods (0.02 g C m�2 y�1)or other zooplankton groups (Fig. 5). Consumption of adult Antarc-tic krill by fish and cephalopods (Fig. 4b) is 14 times higher than byseabirds and marine mammals (Fig. 4c).
Only 0.06% of the primary production reaches the air-breathingpredators (seabirds and marine mammals) (Fig. 6). Overall, Adéliepenguins, crabeater seals and baleen whales receive 0.055% of theannual primary production, 92% of which is provided by consump-tion of Antarctic krill (Fig. 6). The portion of primary productionthat supports flying seabirds and Weddell seals is 10 times smaller(0.005%), and a large part of it is obtained from consumption of fishand cephalopods (Fig. 6).
Fig. 6. Summary of the percent transfer of primary production be
Please cite this article in press as: Ballerini, T., et al. Productivity and linkagescontinental shelf. Prog. Oceanogr. (2013), http://dx.doi.org/10.1016/j.pocean.20
3.2. Sensitivity analyses
3.2.1. Changes in Antarctic krill biomass and estimates of primaryproduction
The primary production required for consumption by the foodweb groups was 187–207 g C m�2 y�1, depending on adult Antarc-tic krill biomass, diet and P/B ratio (simulations 1–6, Table 4).Acoustically-derived estimates of euphausiid biomass (assumedto be primarily Antarctic krill, Lascara et al., 1999) are about doublethat of net-derived biomass estimates (Table 1). Supporting thehigher biomass estimate required an increase between 3% and10% in annual primary production for a 100% herbivorous dietand a 100% carnivorous krill diet, respectively, relative to the pri-mary production estimate from the baseline simulation (Table 4).The annual primary production required for other simulations thatuse a herbivorous diet for adult Antarctic krill is on average 31%lower than that required for a carnivorous diet (Table 4).
3.2.2. Changes in gross growth efficiency values and estimates ofprimary production
The annual primary production estimates using the grossgrowth efficiency values from Banse (1995) were similar to theestimates obtained from the gross growth efficiency used in thebaseline simulation (Table 4, Fig. 7). The gross growth efficienciesused by Priddle et al. (1998) are higher than those used in the base-line simulation because of the assumed higher rates of respirationand feces production (Table 7). As a result, the annual primary pro-duction estimates obtained using the values of Priddle et al. (1998)are on average 1.7 times larger than that obtained with the base-line simulation (Fig. 7). The annual primary production estimatesobtained with the gross growth efficiency values derived from dai-ly feeding rates are higher than all other estimates (Table 4, Fig. 7).
3.2.3. Predator biomass and fate of Antarctic krill productionIn the baseline simulation, annual production of adult Antarctic
krill estimated from net-derived values of biomass (Table 3) is 9%lower than the estimated consumption of adult Antarctic krill byits predators (Table 5). Conversely, annual production of adult Ant-arctic krill obtained using the acoustically-derived biomass resultsin a 46% surplus in krill production (Table 5), which is potentiallyunconsumed or available for export to other areas. The percentageof surplus adult Antarctic krill production decreased in response to
tween the pelagic components of the sWAP food web model.
of the food web of the southern region of the western Antarctic Peninsula13.11.007

Table 4Total net primary production (PP) and total detrital inputs (pelagic and benthic detritus) obtained from simulations that used gross growth efficiency (GGE) values from thebaseline food web model (sWAP), from Banse (1995) (B) and Priddle et al. (1998) (P), and GGE values derived from daily feeding rates (Q/B). The simulations also considereddifferent production biomass ratios (P/B), biomass, and diet composition (H – herbivorous, including 100% large phytoplankton, C – carnivorous, including 100%mesozooplankton) for adult Antarctic krill. The resulting ecotrophic efficiency (EE) of the adult Antarctic krill group is shown for each simulation.
Simulation GGE P/B Biomass (g C m�2) Diet EE PP (g C m�2 y�1) Detritus inputs (g C m�2 y�1)
sWAP 1 1.6 H 1.100 194.3 94sWAP 1 1.6 C 1.100 187.5 87sWAP 1 3.2 H 0.545 200.2 96sWAP 1 3.2 C 0.545 207.4 95sWAP 2.4 1.6 H 0.454 190.1 93sWAP 2.4 1.6 C 0.454 193.7 96sWAP 2.4 3.2 H 0.227 200.2 102sWAP 2.4 3.2 C 0.227 207.4 100B 1 1.6 H 1.100 137.9 73B 1 1.6 C 1.100 197.7 93B 1 3.2 H 0.550 146.4 77B 1 3.2 H 0.550 255.0 113B 2.4 1.6 H 0.458 200.0 100B 2.4 1.6 C 0.458 280.5 122B 2.4 3.2 H 0.229 222.7 111B 2.4 3.2 C 0.229 433.4 176P 1 1.6 H 1.220 202.0 93P 1 1.6 C 1.220 305.3 127P 1 3.2 H 0.612 212.4 96P 1 3.2 C 0.612 381.3 152P 2.4 1.6 H 0.510 217.7 97P 2.4 1.6 C 0.510 420.4 166P 2.4 3.2 H 0.255 294.7 113P 2.4 3.2 C 0.255 655.0 247Q/B 1 1.6 H 1.586 341.2 106Q/B 1 1.6 C 1.586 562.0 202Q/B 1 3.2 H 0.793 361.7 113Q/B 1 3.2 C 0.793 640.1 234Q/B 2.4 1.6 H 0.661 312.3 99Q/B 2.4 1.6 C 0.661 451.5 159Q/B 2.4 3.2 H 0.033 361.7 118Q/B 2.4 3.2 C 0.033 640.1 238
Fig. 7. Simulated estimates of primary production needed to support the south-western Antarctic Peninsula (sWAP) food web obtained using gross growthefficiency values; (1) calculated from production and assimilation efficiencies givenin Table 1, (2) given in Banse (1995), (3) given in Priddle et al. (1998), and (4)derived from daily consumption rates (Table A.2). The boxes represent the range ofthe primary production estimates obtained from all of the simulations that used theindicated gross growth efficiencies. The median (horizontal line) and 25 and 75percentiles (lower and upper vertical lines) are shown. The average (177 g C m�2 -y�1, solid line) and minimum and maximum (47 and 351 g C m�2 y�1, dashed lines)primary production values estimated from field observations made on the sWAPcontinental shelf (Ducklow et al., 2007) are shown for comparison.
Table 5Summary of simulations used to assess the effects of the biomass of fish, cephalopods,seabirds and marine mammals on the amount of adult Antarctic krill production thatis consumed in the sWAP food web. All simulations used an omnivorous diet (Table 2)and a P/B ratio of 1 for adult Antarctic krill. The net-derived annual adult Antarctickrill biomass (1.6 g C m�2) was used for the reference simulation; the annualacoustically-derived biomass (3.2 g C m�2) was used for all other simulations. Thebiomass of the indicated predator groups was doubled from the value used in thereference simulation (Table 1), the food web model was mass balanced, and thepercent (%) surplus (+) or deficit (�) in adult Antarctic krill production werecalculated as (1 � EE)/100, where EE is the ecotrophic efficiency of adult Antarctic krillfor a particular simulation.
Biomass(g C m�2)
Predator group withdoubled biomass
Surplus/deficitproduction (%)
1.6 Initial values in Table 1 �93.2 Initial values in Table 1 +463.2 Cephalopods +143.2 Off-shelf pelagic fish +333.2 On-shelf pelagic fish +193.2 Benthic fish +83.2 All fish and cephalopods �13.2 All seabirds and marine mammals +333.2 All fish, cephalopods, seabirds and
marine mammals�5
12 T. Ballerini et al. / Progress in Oceanography xxx (2013) xxx–xxx
increases in the biomass of cephalopods, off-shelf and on-shelfpelagic fish, and benthic fish groups. Doubling the biomass of thebenthic fish resulted in the largest decrease in surplus krillproduction (Table 5). Doubling the biomass of these four groups
Please cite this article in press as: Ballerini, T., et al. Productivity and linkagescontinental shelf. Prog. Oceanogr. (2013), http://dx.doi.org/10.1016/j.pocean.20
simultaneously resulted in a small deficit (�1%) in adult Antarctickrill production. Doubling the biomass of all seabird and marinemammal groups reduced the krill surplus production by anamount equivalent to that obtained by doubling the biomass ofthe off-shelf pelagic fish group alone (Table 5). Doubling thebiomass of all krill predator groups produced a 5% deficit in adultAntarctic krill production.
of the food web of the southern region of the western Antarctic Peninsula13.11.007
T. Ballerini et al. / Progress in Oceanography xxx (2013) xxx–xxx 13
3.3. Environmental change scenarios
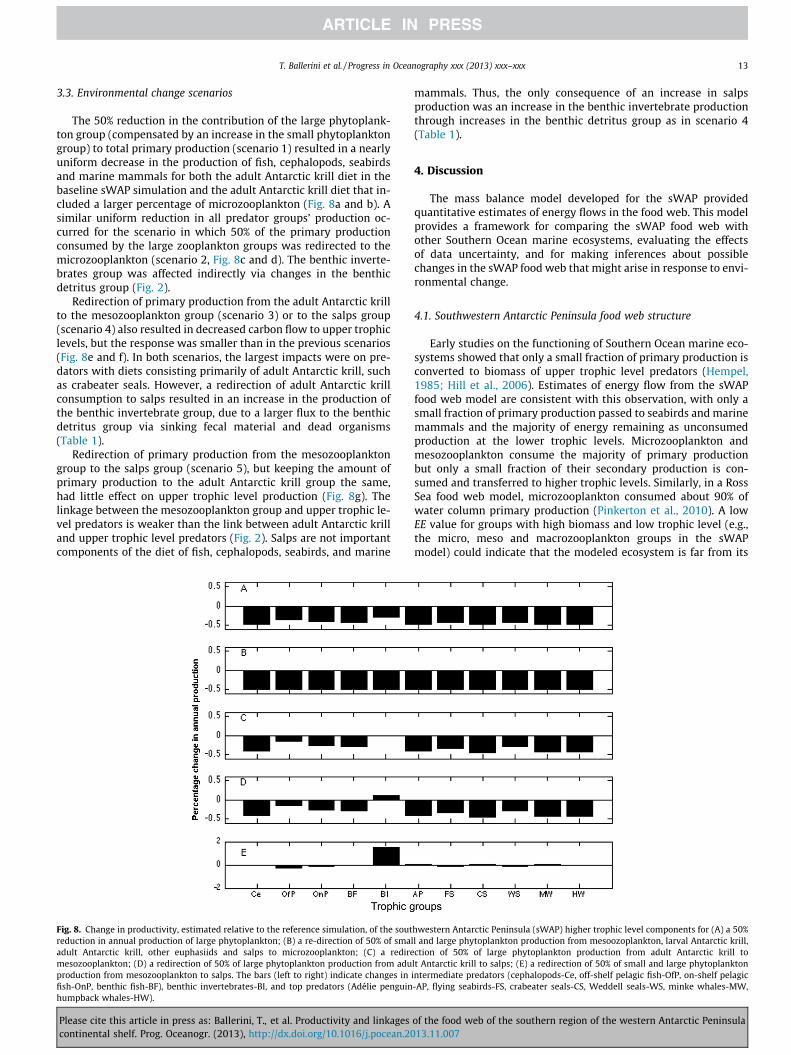
The 50% reduction in the contribution of the large phytoplank-ton group (compensated by an increase in the small phytoplanktongroup) to total primary production (scenario 1) resulted in a nearlyuniform decrease in the production of fish, cephalopods, seabirdsand marine mammals for both the adult Antarctic krill diet in thebaseline sWAP simulation and the adult Antarctic krill diet that in-cluded a larger percentage of microzooplankton (Fig. 8a and b). Asimilar uniform reduction in all predator groups’ production oc-curred for the scenario in which 50% of the primary productionconsumed by the large zooplankton groups was redirected to themicrozooplankton (scenario 2, Fig. 8c and d). The benthic inverte-brates group was affected indirectly via changes in the benthicdetritus group (Fig. 2).
Redirection of primary production from the adult Antarctic krillto the mesozooplankton group (scenario 3) or to the salps group(scenario 4) also resulted in decreased carbon flow to upper trophiclevels, but the response was smaller than in the previous scenarios(Fig. 8e and f). In both scenarios, the largest impacts were on pre-dators with diets consisting primarily of adult Antarctic krill, suchas crabeater seals. However, a redirection of adult Antarctic krillconsumption to salps resulted in an increase in the production ofthe benthic invertebrate group, due to a larger flux to the benthicdetritus group via sinking fecal material and dead organisms(Table 1).
Redirection of primary production from the mesozooplanktongroup to the salps group (scenario 5), but keeping the amount ofprimary production to the adult Antarctic krill group the same,had little effect on upper trophic level production (Fig. 8g). Thelinkage between the mesozooplankton group and upper trophic le-vel predators is weaker than the link between adult Antarctic krilland upper trophic level predators (Fig. 2). Salps are not importantcomponents of the diet of fish, cephalopods, seabirds, and marine
Fig. 8. Change in productivity, estimated relative to the reference simulation, of the soutreduction in annual production of large phytoplankton; (B) a re-direction of 50% of smaladult Antarctic krill, other euphasiids and salps to microzooplankton; (C) a rediremesozooplankton; (D) a redirection of 50% of large phytoplankton production from aduproduction from mesozooplankton to salps. The bars (left to right) indicate changes infish-OnP, benthic fish-BF), benthic invertebrates-BI, and top predators (Adélie penguinhumpback whales-HW).
Please cite this article in press as: Ballerini, T., et al. Productivity and linkagescontinental shelf. Prog. Oceanogr. (2013), http://dx.doi.org/10.1016/j.pocean.20
mammals. Thus, the only consequence of an increase in salpsproduction was an increase in the benthic invertebrate productionthrough increases in the benthic detritus group as in scenario 4(Table 1).
4. Discussion
The mass balance model developed for the sWAP providedquantitative estimates of energy flows in the food web. This modelprovides a framework for comparing the sWAP food web withother Southern Ocean marine ecosystems, evaluating the effectsof data uncertainty, and for making inferences about possiblechanges in the sWAP food web that might arise in response to envi-ronmental change.
4.1. Southwestern Antarctic Peninsula food web structure
Early studies on the functioning of Southern Ocean marine eco-systems showed that only a small fraction of primary production isconverted to biomass of upper trophic level predators (Hempel,1985; Hill et al., 2006). Estimates of energy flow from the sWAPfood web model are consistent with this observation, with only asmall fraction of primary production passed to seabirds and marinemammals and the majority of energy remaining as unconsumedproduction at the lower trophic levels. Microzooplankton andmesozooplankton consume the majority of primary productionbut only a small fraction of their secondary production is con-sumed and transferred to higher trophic levels. Similarly, in a RossSea food web model, microzooplankton consumed about 90% ofwater column primary production (Pinkerton et al., 2010). A lowEE value for groups with high biomass and low trophic level (e.g.,the micro, meso and macrozooplankton groups in the sWAPmodel) could indicate that the modeled ecosystem is far from its
hwestern Antarctic Peninsula (sWAP) higher trophic level components for (A) a 50%l and large phytoplankton production from mesoozoplankton, larval Antarctic krill,ction of 50% of large phytoplankton production from adult Antarctic krill to
lt Antarctic krill to salps; (E) a redirection of 50% of small and large phytoplanktonintermediate predators (cephalopods-Ce, off-shelf pelagic fish-OfP, on-shelf pelagic-AP, flying seabirds-FS, crabeater seals-CS, Weddell seals-WS, minke whales-MW,
of the food web of the southern region of the western Antarctic Peninsula13.11.007

14 T. Ballerini et al. / Progress in Oceanography xxx (2013) xxx–xxx
carrying capacity. Mesozooplankton and macrozooplankton groupsalso had high biomass but low EE values in a model for the SouthGeorgia food web (Hill et al., 2012).
In the sWAP region mesozooplankton can account for themajority of the herbivorous grazer biomass (not considering themicrozooplankton) at various times and locations (Ashjian et al.,2004; Marrari et al., 2011). The sWAP mass balance model showsthat the mean annual production by the mesozooplankton (andfish groups) is potentially sufficient to replace the estimated con-sumption of adult Antarctic krill by its predators. However, thespatial distribution of food web groups and timing of occurrencein peaks of primary and secondary production may alter this result.
Consumption of primary and secondary production by the adultAntarctic krill in the sWAP model is small in comparison to theother zooplankton groups. However, most of the energy flow tohigher trophic levels is through adult Antarctic krill, which there-fore exert a bottom-up control on the most abundant seabirdsand marine mammals. The model-derived estimates of the con-sumption of Antarctic krill production by pelagic fish, benthic fishand cephalopods indicate the potential importance of these littlestudied species/groups, similar to the results of other modelingstudies of Antarctic food webs (Pinkerton et al., 2010; Hill et al.,2012). Antarctic krill control production of upper trophic level pre-dators at South Georgia (Hill et al., 2012) and in the open ocean re-gions of the Southern Ocean (Smetacek and Nicol, 2005). In theRoss Sea shelf ecosystem, crystal krill and Antarctic silverfish pro-vide the transfer of energy from primary producers to top preda-tors (Pinkerton et al., 2010). The structure of these SouthernOcean food webs is similar to the ‘wasp-waist’ ecosystem structurethat has been hypothesized for marine ecosystems characterizedby low taxonomic diversity in the mid-trophic levels where fewspecies of small planktivorous fish control the transfer of energyto higher trophic levels (Rice, 1995; Bakun, 2006). As in the classicwasp-waist ecosystem structure, the dependence on only one ortwo species at the intermediate trophic levels, makes the sWAPfood web and the other Southern Ocean food webs vulnerable tochanges in the biomass of these species.
4.2. Implications of model assumptions and data uncertainty
A challenge for food web models is assessing the effect of uncer-tainty in the data on the representation and parameterization ofecological processes. For models with many potential sources ofuncertainty, sensitivity analyses are typically done in terms ofkey parameters or processes. For this study, parameters and pro-cesses that affect biomass and production of the target species,Antarctic krill, were the focus of the sensitivity analyses. This pro-vides a tractable assessment of model sensitivity, allows identifica-tion of processes that require further study, and highlights dataneeds for model development and evaluation (de Young et al.,2004).
Some comparisons between model results and observationaldata can be made that allow evaluations of the sWAP food webmodel. Primary production places a system-wide constraint onthe sWAP food web and hence provides an indirect evaluation ofthe values chosen for model parameters. Primary production esti-mates have been made for the western Antarctic Peninsula regionfor almost 50 years and in all seasons (see Table 2 in Smith et al.,1996; Prézelin et al., 2004; Ducklow et al., 2007) and thus providea consistent metric for assessing the sWAP food web model. Theestimates of annual primary production derived from the sWAPmodel (187–207 g C m�2 y�1) fall within the range of observed val-ues of primary production measured on the northern part of thewestern Antarctic Peninsula in summer (47–351 g C m�2 fromOctober to March/April; Ducklow et al., 2007). In addition, Westonet al. (2013) reported a mean summer primary productivity value
Please cite this article in press as: Ballerini, T., et al. Productivity and linkagescontinental shelf. Prog. Oceanogr. (2013), http://dx.doi.org/10.1016/j.pocean.20
of 239 g C m�2 y�1 for the northern Marguerite Bay for 2005–2007.The annual average obtained from the food web model(191 g C m�2 y�1) is about 80% lower than the observed meanvalue for the northern Marguerite Bay (Weston et al., 2013) and43% lower than the maximum observed value (351 g C m�2 y�1;Ducklow et al., 2007) in the northern part of the west AntarcticPeninsula shelf. However, it is about 10% higher than the averageobserved value (177 g C m�2 y�1) from the northern part of thewest Antarctic Peninsula shelf. Differences between the observedvalues and the model-estimated values may be explained by thedifferent time periods included in the estimates. For example, thesWAP food web model estimate is based on annual consumptionneeds; whereas, the observed primary production values are pri-marily from the summer. Differences in observed and simulatedprimary production estimates may also arise because the spatialvariability in actual primary production and passive sinking ofphytoplankton, which can be important at particular times andlocations on the western Antarctic Peninsula shelf (Smith et al.,2006), are not included in the model.
The magnitude of the reconstructed flows through the food webresults from the choices made for parameter values such as grossgrowth efficiency and P/B ratios. The gross growth efficiencies cho-sen for the sWAP food web model produced annual primary pro-duction estimates that were similar to those obtained usinglower values of gross growth efficiency from other Southern Oceanfood web modeling studies (e.g. Banse, 1995; Priddle et al., 1998),but all were within the range of observed values. The gross growthefficiency values derived from daily feeding rates produced pri-mary production estimates that exceeded measured values, whichhighlights the need for consistent measurements for food webprocesses.
The EE values of the zooplankton groups calculated with thesWAP model are poorly constrained because of large uncertaintiesin the biomass/consumption rates of zooplankton predators andbecause zooplankton migration inside/outside the study area wasnot taken into account. Data are not usually available on non-pre-dation mortality rates in natural populations and these parametersare usually estimated by models. The low EE values of the zoo-plankton groups indicate of the uncertainty of the data for theseimportant food web groups. This uncertainty affects the accuracyof the reconstructed energy flows in the sWAP food web. Low EEvalues for the zooplankton groups were also calculated in the massbalance model for the South Georgia shelf (Hill et al., 2012), high-lighting a similar uncertainty in the magnitude of these trophicflows. The sensitivity of the food web models to the choices madefor the zooplankton groups highlights the need for process studiesto investigate the space and time variability of their populationdynamics, predator–prey interactions, and to assess their ecologi-cal roles in energy flows. Non-predation mortality is also poten-tially an important input to the detrital pools. The use of thefood web model to estimate direct demand for primary productionresults in underestimates of flows via the detrital pools, which ispotentially important for coupling the benthic and pelagic systemsof the west Antarctic Peninsula continental shelf (Smith et al.,2012a,b).
Similarly, the food web model results are sensitive to biomassestimates. The net-based estimates of Antarctic krill biomass wereinsufficient to support the consumption needs of top predators;whereas, the acoustically-derived biomass estimates provided asurplus of Antarctic krill after the consumption demands by preda-tors were satisfied. The accurate estimation of krill biomassdepends on estimates of density and on correct specification ofthe Antarctic krill spatial range (Nicol et al., 2000). The krilldensities used to convert acoustic backscatter measurements tobiomass were based on estimates made specifically for the regionincluded in the sWAP food web model and an analysis of the error
of the food web of the southern region of the western Antarctic Peninsula13.11.007
T. Ballerini et al. / Progress in Oceanography xxx (2013) xxx–xxx 15
introduced by uncertainties showed that the values were withinthe range of other reported biomass values (Lawson et al.,2008b). These biomass estimates average over krill aggregationsbecause Antarctic krill were assumed to be present throughoutthe model region. Acoustic surveys in the region around Margue-rite Bay showed that Antarctic krill biomass tended to be concen-trated along the shelf break and the inner shelf regions (consistentwith Atkinson et al., 2008), and that a few large swarms accountedfor a disproportionate amount of the total biomass (Lascara et al.,1999; Lawson et al., 2008a). Therefore, the effective spatial rangefor Antarctic krill is likely less than the model region. Accurate bio-mass estimates, especially for species or groups that exert a pri-mary control on system productivity, are a priority for food webmodels such as the one used in this study.
The type of uncertainty associated with the sWAP model iscommon to other ECOPATH-type implementations (e.g. Paulyet al., 2000; Fulton, 2010; Steele and Ruzicka, 2011). However,the sWAP model does allow understanding of the direction ofchange that might occur in the food web for changes in specifiedmodel parameters (as in the case of the sensitivity analyses) andinvestigating the indirect effects in the food web (such as in thescenario simulations). The simulation results reveal somethingabout the current processes in the ecosystem and about processesthat might occur with changes in the relative abundance of foodweb components.
4.3. Possible future changes in food web structure – model implications
The western Antarctic Peninsula region is undergoing rapid cli-mate change, the manifestations of which are warming ocean tem-peratures (Meredith and King, 2005), reduction in sea ice extent(Smith and Stammerjohn, 2001; Stammerjohn et al., 2008), andshortening of sea ice duration (Stammerjohn et al., 2008). The rel-ative abundance of salps and Antarctic krill has been correlatedwith winter sea ice extent, with salps replacing krill during timesof reduced sea ice (Loeb et al., 1997). The increase in the abundanceof chinstrap penguins (Pygoscelis antarcticus) relative to Adélie pen-guins along the northern portion of the western Antarctic Peninsulahas been linked to changes in the availability of their primary preyspecies, Antarctic krill and Antarctic silverfish (Schofield et al.,2010; Trivelpiece et al., 2011). However, Lynch et al. (2012) showthat the changes are more complex and in fact Adélie penguin num-bers have been growing in the sWAP, seemingly in response to loos-ening of the pack ice and increased availability of suitable nestinghabitat as glaciers retreat, a prediction of Ainley et al. (2010).
The sWAP food web model provides insights into the potentialconsequences of modified abundances of particular species/groupsand changes in consumption. The simulations showed that areduction in Antarctic krill biomass reduces the overall energy fluxto top predators. A potentially significant change suggested by thesWAP food web simulations comes from a reduction in the averagecell size of phytoplankton, which reduces Antarctic krill productionand hence production of the top trophic levels. Although the diet oftop predators such as Adélie penguins and crabeater seals poten-tially comprises important contributions of alternate prey likethe Antarctic silverfish (Volkman et al., 1980; Lowry et al., 1987;Klages and Cockcroft, 1990; Chapman et al., 2010, 2011), the sWAPmodel suggests that there may be limited scope for Antarctic sil-verfish to support the consumption of these top predators. In fact,a significant part of the diet of the fish groups is also composed ofAntarctic krill, and if Antarctic krill is reduced or disappears, main-taining or increasing the biomass of the fish groups will require anincrease in the availability and biomass of other zooplanktongroups. In addition, the declining trend in Antarctic silverfish abun-dance observed in the northern portions of the western AntarcticPeninsula (Ducklow et al., 2007; Schofield et al., 2010) may occur
Please cite this article in press as: Ballerini, T., et al. Productivity and linkagescontinental shelf. Prog. Oceanogr. (2013), http://dx.doi.org/10.1016/j.pocean.20
in the future also in the sWAP region if sea ice continues todecrease.
In simulations that reduced the production of Antarctic krill byredirecting primary production to microzooplankton and salps(which are not consumed by top predators) a proportionate de-crease in the production of fish, cephalopods, seabirds and marinemammals occurred, indicating that this trophic pathway is noteffective in channeling energy to upper trophic levels. Thus, areduction in Antarctic krill biomass and/or changes in the relativeabundance of phytoplankton may result in a reorganization of thesWAP food web that favors top predators that can take advantageof open water, such as chinstrap penguins (Trivelpiece et al., 2011)and southern elephant seals (Mirounga leonine) (Costa et al., 2010).
5. Summary and conclusions
The mass balance model developed for the sWAP region repre-sented general patterns of the overall food web structure and pro-vided a basis for qualitative (Murphy et al., 2013) and quantitativecomparisons with other Southern Ocean ecosystems. The strengthof this modeling approach is that it quantified energy flow path-ways through the food web while highlighting uncertainties indata, which are potentially useful for indicating where measure-ments are needed. The modeling approach also allowed investiga-tion of possible changes in the structure of the sWAP food web thatmight arise in response to changes in the relative abundance ofplankton components that may occur as a result of climate-in-duced changes.
The simulated sWAP food web sustains the top predator bio-mass primarily by consumption of a single prey species, Antarctickrill. Trophic pathways through alternative zooplankton groupsand through fish provide a significantly smaller contribution tothe production of seabirds and marine mammals. The dependenceof the upper trophic level predators on a single prey makes the cur-rent sWAP food web vulnerable to changes in this food source. Ant-arctic krill are long-lived (4–7 years, Ikeda and Thomas, 1987) and,as a result, respond to environmental cycles with scales beyondseasonal (Smetacek and Nicol, 2005). The cumulative effects oflonger-term environmental changes, particularly decreasing seaice, exert controls on the distribution and availability of this impor-tant prey and predator in the sWAP food web. For this system, theadditive effects of bottom-up resource control through changes inphytoplankton assemblages (Antarctic krill prey) and the top downeffects of consumers of Antarctic krill may amplify the effects ofclimate change on the sWAP food web. Thus, end-to-end modelsthat include food web interactions, biogeochemical cycling, andenvironmental controls are the next step in developing scenariosfor projections of the future state of the sWAP ecosystem.
Acknowledgments
Support for T. Ballerini and E. Hofmann was provided by NSFGrant OCE-0814584, for D. Ainley by ANT-0944411 and OCE-0814406, for C. Ribic by OCE-0814406. K. Daly and M. Marrari weresupported by NSF Grant OCE-0814405. This study is a contributionto the US GLOBEC synthesis and integration effort. We thank S.Strom for expertise on microzooplankton and J. Ruzicka for com-ments on an earlier draft of the manuscript. Three anonymous ref-erees made useful and constructive suggestions that greatlyimproved the manuscript. Mention of trade names or commercialproducts does not constitute endorsement for use by the U.S.Government.
Appendix A
See Tables A.1–A.3.
of the food web of the southern region of the western Antarctic Peninsula13.11.007
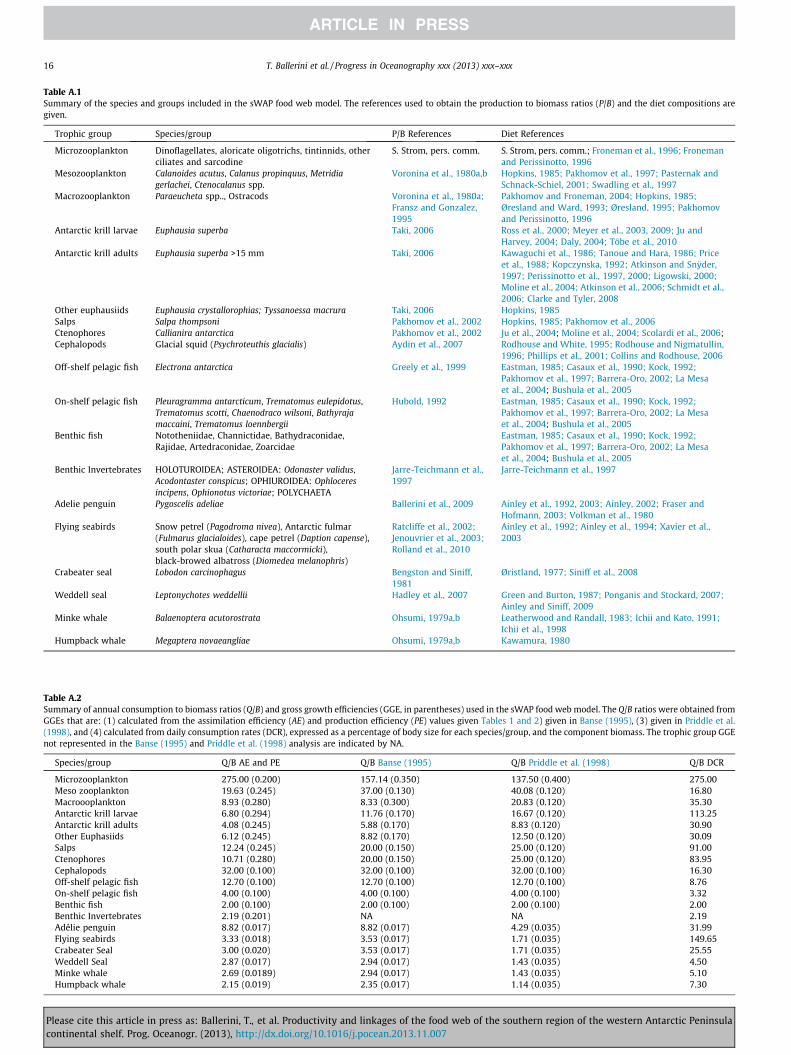
Table A.1Summary of the species and groups included in the sWAP food web model. The references used to obtain the production to biomass ratios (P/B) and the diet compositions aregiven.
Trophic group Species/group P/B References Diet References
Microzooplankton Dinoflagellates, aloricate oligotrichs, tintinnids, otherciliates and sarcodine
S. Strom, pers. comm. S. Strom, pers. comm.; Froneman et al., 1996; Fronemanand Perissinotto, 1996
Mesozooplankton Calanoides acutus, Calanus propinquus, Metridiagerlachei, Ctenocalanus spp.
Voronina et al., 1980a,b Hopkins, 1985; Pakhomov et al., 1997; Pasternak andSchnack-Schiel, 2001; Swadling et al., 1997
Macrozooplankton Paraeucheta spp.., Ostracods Voronina et al., 1980a;Fransz and Gonzalez,1995
Pakhomov and Froneman, 2004; Hopkins, 1985;Øresland and Ward, 1993; Øresland, 1995; Pakhomovand Perissinotto, 1996
Antarctic krill larvae Euphausia superba Taki, 2006 Ross et al., 2000; Meyer et al., 2003, 2009; Ju andHarvey, 2004; Daly, 2004; Töbe et al., 2010
Antarctic krill adults Euphausia superba >15 mm Taki, 2006 Kawaguchi et al., 1986; Tanoue and Hara, 1986; Priceet al., 1988; Kopczynska, 1992; Atkinson and Snÿder,1997; Perissinotto et al., 1997, 2000; Ligowski, 2000;Moline et al., 2004; Atkinson et al., 2006; Schmidt et al.,2006; Clarke and Tyler, 2008
Other euphausiids Euphausia crystallorophias; Tyssanoessa macrura Taki, 2006 Hopkins, 1985Salps Salpa thompsoni Pakhomov et al., 2002 Hopkins, 1985; Pakhomov et al., 2006Ctenophores Callianira antarctica Pakhomov et al., 2002 Ju et al., 2004; Moline et al., 2004; Scolardi et al., 2006;Cephalopods Glacial squid (Psychroteuthis glacialis) Aydin et al., 2007 Rodhouse and White, 1995; Rodhouse and Nigmatullin,
1996; Phillips et al., 2001; Collins and Rodhouse, 2006Off-shelf pelagic fish Electrona antarctica Greely et al., 1999 Eastman, 1985; Casaux et al., 1990; Kock, 1992;
Pakhomov et al., 1997; Barrera-Oro, 2002; La Mesaet al., 2004; Bushula et al., 2005
On-shelf pelagic fish Pleuragramma antarcticum, Trematomus eulepidotus,Trematomus scotti, Chaenodraco wilsoni, Bathyrajamaccaini, Trematomus loennbergii
Hubold, 1992 Eastman, 1985; Casaux et al., 1990; Kock, 1992;Pakhomov et al., 1997; Barrera-Oro, 2002; La Mesaet al., 2004; Bushula et al., 2005
Benthic fish Nototheniidae, Channictidae, Bathydraconidae,Rajidae, Artedraconidae, Zoarcidae
Eastman, 1985; Casaux et al., 1990; Kock, 1992;Pakhomov et al., 1997; Barrera-Oro, 2002; La Mesaet al., 2004; Bushula et al., 2005
Benthic Invertebrates HOLOTUROIDEA; ASTEROIDEA: Odonaster validus,Acodontaster conspicus; OPHIUROIDEA: Ophloceresincipens, Ophionotus victoriae; POLYCHAETA
Jarre-Teichmann et al.,1997
Jarre-Teichmann et al., 1997
Adelie penguin Pygoscelis adeliae Ballerini et al., 2009 Ainley et al., 1992, 2003; Ainley, 2002; Fraser andHofmann, 2003; Volkman et al., 1980
Flying seabirds Snow petrel (Pagodroma nivea), Antarctic fulmar(Fulmarus glacialoides), cape petrel (Daption capense),south polar skua (Catharacta maccormicki),black-browed albatross (Diomedea melanophris)
Ratcliffe et al., 2002;Jenouvrier et al., 2003;Rolland et al., 2010
Ainley et al., 1992; Ainley et al., 1994; Xavier et al.,2003
Crabeater seal Lobodon carcinophagus Bengston and Siniff,1981
Øristland, 1977; Siniff et al., 2008
Weddell seal Leptonychotes weddellii Hadley et al., 2007 Green and Burton, 1987; Ponganis and Stockard, 2007;Ainley and Siniff, 2009
Minke whale Balaenoptera acutorostrata Ohsumi, 1979a,b Leatherwood and Randall, 1983; Ichii and Kato, 1991;Ichii et al., 1998
Humpback whale Megaptera novaeangliae Ohsumi, 1979a,b Kawamura, 1980
Table A.2Summary of annual consumption to biomass ratios (Q/B) and gross growth efficiencies (GGE, in parentheses) used in the sWAP food web model. The Q/B ratios were obtained fromGGEs that are: (1) calculated from the assimilation efficiency (AE) and production efficiency (PE) values given Tables 1 and 2) given in Banse (1995), (3) given in Priddle et al.(1998), and (4) calculated from daily consumption rates (DCR), expressed as a percentage of body size for each species/group, and the component biomass. The trophic group GGEnot represented in the Banse (1995) and Priddle et al. (1998) analysis are indicated by NA.
Species/group Q/B AE and PE Q/B Banse (1995) Q/B Priddle et al. (1998) Q/B DCR
Microzooplankton 275.00 (0.200) 157.14 (0.350) 137.50 (0.400) 275.00Meso zooplankton 19.63 (0.245) 37.00 (0.130) 40.08 (0.120) 16.80Macroooplankton 8.93 (0.280) 8.33 (0.300) 20.83 (0.120) 35.30Antarctic krill larvae 6.80 (0.294) 11.76 (0.170) 16.67 (0.120) 113.25Antarctic krill adults 4.08 (0.245) 5.88 (0.170) 8.83 (0.120) 30.90Other Euphasiids 6.12 (0.245) 8.82 (0.170) 12.50 (0.120) 30.09Salps 12.24 (0.245) 20.00 (0.150) 25.00 (0.120) 91.00Ctenophores 10.71 (0.280) 20.00 (0.150) 25.00 (0.120) 83.95Cephalopods 32.00 (0.100) 32.00 (0.100) 32.00 (0.100) 16.30Off-shelf pelagic fish 12.70 (0.100) 12.70 (0.100) 12.70 (0.100) 8.76On-shelf pelagic fish 4.00 (0.100) 4.00 (0.100) 4.00 (0.100) 3.32Benthic fish 2.00 (0.100) 2.00 (0.100) 2.00 (0.100) 2.00Benthic Invertebrates 2.19 (0.201) NA NA 2.19Adélie penguin 8.82 (0.017) 8.82 (0.017) 4.29 (0.035) 31.99Flying seabirds 3.33 (0.018) 3.53 (0.017) 1.71 (0.035) 149.65Crabeater Seal 3.00 (0.020) 3.53 (0.017) 1.71 (0.035) 25.55Weddell Seal 2.87 (0.017) 2.94 (0.017) 1.43 (0.035) 4.50Minke whale 2.69 (0.0189) 2.94 (0.017) 1.43 (0.035) 5.10Humpback whale 2.15 (0.019) 2.35 (0.017) 1.14 (0.035) 7.30
16 T. Ballerini et al. / Progress in Oceanography xxx (2013) xxx–xxx
Please cite this article in press as: Ballerini, T., et al. Productivity and linkages of the food web of the southern region of the western Antarctic Peninsulacontinental shelf. Prog. Oceanogr. (2013), http://dx.doi.org/10.1016/j.pocean.2013.11.007

Table A.3Production matrix, Acp, for the baseline bottom-up model obtained by transposing the mass balance model that used the adult Antarctic krill diet given in Table 2. Thecontribution (%) of each producer (columns) to each consumer (rows) is shown for each group in the southwestern Antarctic Peninsula (sWAP) model.
Consumers Producers
4 5 6 7 8 9 10 11 12 13 14 15 16 17 18 19 20 21 22
1 SP 60 23 1 23 0 0 40 0 0 0 0 0 0 0 0 0 0 0 02 LP 25 65 10 46 53 60 20 0 0 0 0 0 0 0 0 0 0 0 03 IB 0 0 0 9 0 0 0 0 0 0 0 0 0 0 0 0 0 0 04 M 0 5 1 15 6 0 30 0 0 0 0 0 0 0 0 0 0 0 05 Me 0 0 72 0 24 24 5 88 0 41 28 5 0 0 2 0 0 0 56 Ma 0 0 0 0 0 0 0 0 9 18 12 5 0 0 0 0 0 0 07 AKL 0 0 2 0 0 0 5 12 0 7 5 0 0 0 0 0 0 0 08 AAK 0 0 2 0 0 0 0 0 37 27 50 15 0 52 10 94 0 94 709 OE 0 0 1 0 0 0 0 0 4 7 5 2 0 7 0 1 0 6 0
10 S 0 0 0 0 0 0 0 0 0 0 0 0 0 0 0 0 0 0 011 Ct 0 0 1 0 0 0 0 0 0 0 0 0 0 0 0 0 0 0 012 Ce 0 0 0 0 0 0 0 0 0 0 0 8 0 30 30 2 50 0 513 Off-P 0 0 0 0 0 0 0 0 25 0 0 10 0 8 32 1 18 0 1014 On-P 0 0 0 0 0 0 0 0 25 0 0 15 0 3 20 2 16 0 1015 BF 0 0 0 0 0 0 0 0 0 0 0 0 0 0 6 0 16 0 016 BI 0 0 0 0 0 0 0 0 0 0 0 40 0 0 0 0 0 0 017 AP 0 0 0 0 0 0 0 0 0 0 0 0 0 0 0 0 0 0 018 FS 0 0 0 0 0 0 0 0 0 0 0 0 0 0 0 0 0 0 019 CS 0 0 0 0 0 0 0 0 0 0 0 0 0 0 0 0 0 0 020 WS 0 0 0 0 0 0 0 0 0 0 0 0 0 0 0 0 0 0 021 MW 0 0 0 0 0 0 0 0 0 0 0 0 0 0 0 0 0 0 022 HW 0 0 0 0 0 0 0 0 0 0 0 0 0 0 0 0 0 0 023 PD 15 7 0 7 1 0 0 0 0 0 0 0 0 0 0 0 0 0 024 BD 0 0 10 0 16 16 0 0 0 0 0 0 100 0 0 0 0 0 0
T. Ballerini et al. / Progress in Oceanography xxx (2013) xxx–xxx 17
Appendix B. Supplementary material
Supplementary data associated with this article can be found, inthe online version, at http://dx.doi.org/10.1016/j.pocean.2013.11.007.
References
Ainley, D.G., 2002. The Adélie Penguin: Bellwether of Climate Change. ColumbiaUniversity Press.
Ainley, D.G., Blight, L.K., 2009. Ecological repercussions of historical fish extractionfrom the Southern Ocean. Fish and Fisheries 10, 13–38.
Ainley, D.G., Ribic, C.A., Fraser, W.R., 1994. Ecological structure among migrant andresident seabirds of the Scotia-Weddell Confluence region. Journal AnimalEcology 63, 347–364.
Ainley, D.G., Ballard, G., Barton, K.J., Karl, B.J., Rau, G.H., Ribic, C.A., Wilson, P.R.,2003. Spatial and temporal variation of diet within a presumed metapopulationof Adélie penguins. Condor 105, 95–106.
Ainley, D.G., O’Connor, E.F., Boekelheide, R.J., 1984. The marine ecology of birds inthe Ross Sea, Antarctica. Ornithological Monographs 32, iii-97.
Ainley, D.G., Ribic, C.A., Fraser, W.R., 1992. Does prey preference affect habitatchoice in Antarctic seabirds? Marine Ecology Progress Series 90, 207–221.
Ainley, D.G., Russell, J., Jenouvrier, S., Woehler, E., Lyver, P.O.’B., Fraser, W.R.,Kooyman, G.L., 2010. Antarctic penguin response to habitat change as earth’stroposphere reaches 2�C above preindustrial levels. Ecological Monographs 80,49–66.
Ainley, D.G., Siniff, D.B., 2009. The importance of Antarctic toothfish as prey ofWeddell seals in the Ross Sea. Antarctic Science 21 (04), 317–327.
Ashjian, C.J., Rosenwaks, G.A., Wiebe, P.H., Davis, C.S., Gallager, S.M., Copley, N.J.,Lawson, G.L., Alatalo, P., 2004. Distribution of zooplankton on the continentalshelf off Marguerite Bay, Antarctic Peninsula, during Austral Fall and Winter,2001. Deep-Sea Research II 51, 2073–2098.
Ashjian, C.J., Davis, C.S., Gallager, S.M., Wiebe, P.H., Lawson, G.L., 2008. Distributionof larval krill and zooplankton in association with hydrography in MargueriteBay, Antarctic Peninsula, in austral fall and winter 2001 described using theVideo Plankton Recorder. Deep-Sea Research II 55, 455–471.
Atkinson, A., Snÿder, R., 1997. Krill-copepod interactions at South Georgia,Antarctica, I. Omnivory by Euphausia superba. Marine Ecology Progress Series160, 63–76.
Atkinson, A., Siegel, V., Pakhomov, E., Rothery, P., 2004. Long-term decline in krillstock and increase in salps within the Southern Ocean. Nature 432, 100–103.
Atkinson, A., Siegel, V., Pakhomov, E.A., Rothery, P., Loeb, V., Ross, R.M., Quetin, L.B.,Schiidt, K., Fretwell, P., Murphy, E.J., Tarling, G.A., Fleming, A.H., 2008. Oceaniccircumpolar habitats of Antarctic krill. Marine Ecology Progress Series 362, 1–23.
Atkinson, A., Shreeve, R.S., Hirst, A.G., Rothery, P., Tarling, G.A., Pond, D.W., Korb,R.E., Murphy, E.J., Watkins, J.L., 2006. Natural growth rates in Antarctic krill
Please cite this article in press as: Ballerini, T., et al. Productivity and linkagescontinental shelf. Prog. Oceanogr. (2013), http://dx.doi.org/10.1016/j.pocean.20
(Euphausia superba): II. Predictive models based on food, temperature, bodylength, sex, and maturity stage. Limnology and Oceanography 51, 973–987.
Aydin, K., Gaichas, S., Ortiz, I., Kinzey, D., Friday, N., 2007. A comparison of theBering Sea, Gulf of Alaska, and Aleutian Islands Large Marine Ecosystemsthrough Food Web Modeling. NOAA Technical, Memorandum NMFS-AFSC-178.
Bakun, A., 2006. Wasp-waist populations and marine ecosystem dynamics:navigating the ‘‘predator pit’’ topographies. Progress in Oceanography 68,271–288.
Ballance, L., Pitman, R.L., Hewitt, R.P., Siniff, D.B., Trivelpiece, W.Z., Clapham, P.J.,Brownell Jr., R.L., 2006. The removal of large whales from the Southern Ocean:evidence for long-term ecosystem effects? In: Estes, J.A., Demaster, D.P., Doak,D.F., Williams, T.E., Brownell, Jr. (Eds.), Whales, Whaling and Ocean Ecosystems.University of California Press, Berkeley, CA, pp. 15–230.
Ballerini, T., Tavecchia, G., Olmastroni, S., Pezzo, F., Focardi, S., 2009. Nonlinear effectof winter sea ice on the survival probabilities of Adélie penguins. Oecologia 161,253–265.
Banse, K., 1995. Antarctic marine top predators revisited: homeotherms do not leakmuch CO2 to the air. Polar Biology 15 (2), 93–104.
Banse, K., Mosher, S., 1980. Adult body mass and annual production/biomassrelationships of field populations. Ecological Monographs 50 (3), 355–379.
Barrera-Oro, E., 2002. The role of fish in the Antarctic marine food web: differencesbetween inshore and offshore waters in the southern Scotia Arc and westAntarctic Peninsula. Antarctic Science 14, 293–309.
Bengston, J., Siniff, D.B., 1981. Reproductive aspects of female crabeater seals(Lobodon carcinophagus) along the Antarctic Peninsula. Canadian Journal ofZoology 59 (1), 92–102.
Branch, T.A., 2006. Abundance estimates for Antarctic minke whales from threecompleted circumpolar sets of surveys, 178/79 to 2003/04. SC/58/IA18,International Whaling Commission, Cambridge, UK.
Branch, T.A., 2007. Humpback Whale Abundance South of 60�S from ThreeComplete Circumpolar Sets of Surveys. SC/59/SH9, International WhalingCommission, Cambridge, U.K.
Burger, J., Schreiber, E.A. (Eds.), 2001. Biology of Marine Birds. CRC Press.Bushula, T., Pakhomov, E.A., Kaehler, S., Davis, S., Kalin, R.M., 2005. Diet and daily
ration of two nototheniid fish on the shelf of the sub-Antarctic Prince EdwardIslands. Polar Biology 28 (8), 585–593.
Casaux, R.J., Mazzotta, A.S., Barrea-Oro, E.R., 1990. Seasonal aspects of the biologyand diet of nearshore nototheniid fish at Potter Cove, South Shetland Islands,Antarctica. Polar Biology 11, 63–72.
Chapman, E.W., Hofmann, E.E., Patterson, D.L., Fraser, W.R., 2010. The effects ofvariability in Antarctic krill (Euphausia superba) spawning behavior and sex/maturity stage distribution on Adélie penguin (Pygoscelis adeliae) chick growth:a modeling study. Deep Sea Research, Part II: Topical Studies in Oceanography57, 543–558.
Chapman, E.W., Hofmann, E.E., Patterson, D.L., Ribic, C.A., Fraser, W.R., 2011. Marineand terrestrial factors affecting Adélie penguin Pygoscelis adeliae chick growthand recruitment off the western Antarctic Peninsula. Marine Ecology ProgressSeries 436, 273–289.
Chapman, E.W., Ribic, C.A., Fraser, W.R., 2004. The distribution of seabirds andpinnipeds in Marguerite Bay and their relationship to physical features during
of the food web of the southern region of the western Antarctic Peninsula13.11.007

18 T. Ballerini et al. / Progress in Oceanography xxx (2013) xxx–xxx
austral winter 2001. Deep-Sea Research Part II: Topical Studies inOceanography 51 (17–19), 2261–2278.
Christensen, V., Walters, C.J., 2004. Ecopath with Ecosim: methods, capabilities andlimitations. Ecological Modeling 172 (2), 109–139.
Clarke, A., Tyler, P.A., 2008. Adult Antarctic krill feeding at abyssal depths. CurrentBiology 18, 282–285.
Collins, M.A., Rodhouse, P.G.K., 2006. Southern Ocean cephalopods. In: Alan, C.M.Y.,Southward, J., Lee, A.F. (Eds.), Advances in Marine Biology, vol. 50. AcademicPress, pp. 191–265.
Cornejo-Donoso, J., Antezana, T., 2008. Preliminary trophic model of the AntarcticPeninsula Ecosystem (Sub-area CCAMLR 48.1). Ecological Modelling 218, 1–17.
Costa, D.P., Burns, J.M., Chapman, E., Hildebrand, J., Torres, J.J., Fraser, W.,Friedlander, A., Ribic, C., Halpin, P., 2007. US SO GLOBEC predator programme.GLOBEC International Newsletter 13 (1), 62–66.
Costa, D.P., Hückstädt, L.A., Crocker, D.E., McDonald, B.I., Goebel, M.E., Fedak, M.A.,2010. Approaches to studying climatic change and its role on the habitatselection of Antarctic pinnipeds. Integrative and Comparative Biology 50, 1018–1030.
Daly, K.L., 1990. Overwintering development, growth, and feeding of larvalEuphausia superba in the Antarctic marginal ice zone. Limnology andOceanography 35, 1564–1576.
Daly, K.L., 2004. Overwintering growth and development of larval Euphausiasuperba: an interannual comparison under varying environmental conditionswest of the Antarctic Peninsula. Deep-Sea Research Part II: Topical Studies inOceanography 51 (17–19), 2139–2168.
Daly, K.L., Macaulay, M.C., 1988. Abundance and distribution of krill in the ice edgezone of the Weddell Sea, austral spring 1983. Deep-Sea Research 35, 21–41.
Daly, K.L., Macaulay, M.C., 1991. The influence of physical and biological mesoscaledynamics on the seasonal distribution and behavior of Euphausia superba in theAntarctic marginal ice zone. Marine Ecology Progress Series 79, 37–66.
de Young, B., Heath, M., Werner, F., Chai, F., Megrey, B., Monfray, P., 2004.Challenges of modeling ocean basin ecosystems. Science 4, 1463–1466.
Dinniman, M.S., Klinck, J.M., Hofmann, E.E., 2012. Sensitivity of Circumpolar DeepWater transport and ice shelf basal melt along the west Antarctic Peninsula tochanges in the winds. Journal of Climate 25 (14), 4799–4816.
Donnelly, J., Torres, J.J., Sutton, T.T., Simoniello, C., 2004. Fishes of the eastern RossSea, Antarctica. Polar Biology 27, 637–650.
Donnelly, J., Torres, J.J., 2008. Pelagic fishes in the Marguerite Bay region of the WestAntarctic Peninsula continental shelf. Deep-Sea Research Part II: Topical Studiesin Oceanography 55 (3–4), 523–539.
Ducklow, H.W., Baker, K., Martinson, D.G., Quetin, L.B., Ross, R.M., Smith, R.C.,Stammerjohn, S.E., Vernet, M., Fraser, W., 2007. Marine pelagic ecosystems: theWest Antarctic Peninsula. Philosophical Transactions Royal Society B 362, 67–94.
Eastman, J.T., 1985. Pleuragramma antarcticum (Pisces, Nototheniidae) as food for otherfishes in McMurdo Sound, Antarctica. Antarctica. Polar Biology 4 (3), 155–160.
Edwards, E.S., Burkill, P.H., Sleigh, M.A., 1998. Microbial community structure in themarginal ice zone of the Bellingshausen Sea. Journal of Marine Systems 17, 87–96.
Efran A., Pitcher, T.J., 2005. An ecosystem simulation model of the AntarcticPeninsula. In: Palomares, M.L.D., Pruvost, P., Pitcher, T.J., Pauly, D. (Eds.),Modeling Antarctic Marine Ecosystems, Fisheries Centre Research Reports13(7). The Fishery Centre, Univ. British Colombia, Vancouver, Canada.
Erdmann, E.S., Ribic, C.A., Patterson-Fraser, D.L., Fraser, W.R., 2011. Characterizationof winter foraging location of Adélie penguins along the Western AntarcticPeninsula, 2001–2002. Deep-Sea Research Part II: Topical Studies inOceanography 58 (13–16), 1710–1718.
Erickson, A.W., Hanson, M.B., 1990. Continental estimates and population trends ofAntarctic ice seals. In: Kerry, K.R., Hempel, G. (Eds.), Antarctic Ecosystems:Ecological Change and Conservation. Springer, Berlin, pp. 253–264.
Everson, I., 1977. The Living Resources of the Southern Ocean. FAO, Rome.Fraser, W.R., Hofmann, E.E., 2003. A predator’s perspective on causal links between
climate change, physical forcing and ecosystem response. Marine EcologyProgress Series 265, 1–15.
Fransz, H.G., Gonzalez, S.R., 1995. The production of Oithona similis (Copepoda:Cyclopoida) in the Southern Ocean. ICES Journal of Marine Science: Journal duConseil 52, 549–555.
Froneman, P.W., Pakhomov, E.A., Perissinotto, R., McQuaid, C.D., 1996. Role ofmicroplankton in the diet and daily ration of Antarctic zooplankton speciesduring austral summer. Marine Ecology Progress Series 143, 15–23.
Froneman, P., Perissinotto, R., 1996. Microzooplankton grazing in the SouthernOcean: implications for the carbon cycle. Marine Ecology 17, 99–115.
Fulton, E.A., 2010. Approaches to end-to-end ecosystem models. Journal of MarineSystems 81 (1), 171–183.
Greely, T.M., Gartner Jr, J.V., Torres, J.J., 1999. Age and growth of Electrona antarctica(Pisces: Myctophidae), the dominant mesopelagic fish of the Southern Ocean.Marine Biology 133 (1), 145–158.
Green, K., Burton, H.R., 1987. Seasonal and geographical variation in the food ofWeddell Seals, Leptonycotes weddelii, in Antarctica. Australian Wildlife Research14 (4), 475–489.
Hadley, G.L., Rotella, J.J., Garrott, R.A., 2007. Influence of maternal characteristicsand oceanographic conditions on survival and recruitment probabilities ofWeddell seals. Oikos 116 (4), 601–613.
Hamner, W.M., Hamner, P.P., Strand, S.W., Gilmer, R.W., 1983. Behavior of Antarctickrill, Euphausia superba: chemoreception, feeding, schooling and molting.Science 220, 433–435.
Please cite this article in press as: Ballerini, T., et al. Productivity and linkagescontinental shelf. Prog. Oceanogr. (2013), http://dx.doi.org/10.1016/j.pocean.20
Hansen, P.J., Bjørnsen, P.K., Hansen, B.W., 1997. Zooplankton grazing and growth:scaling within the 2–2,000 lm body size range. Limnology and Oceanography42, 687–704.
Hempel, G., 1985. In: Siegfried, W.R., Condy, P.R., Laws, R.M. (Eds.), Antarctic MarineFood Webs, Antarctic Nutrient Cycles and Food Web. Springer, Berlin.
Hill, S.L., Murphy, E.J., Reid, K., Trathan, P.N., Constable, A.J., 2006. ModellingSouthern Ocean ecosystems: krill, the food-web, and the impacts of fishing.Biological Reviews 81, 581–608.
Hill, S.L., Reid, K., North, A.W., 2005. Recruitment of mackerel icefish(Champsocephalus gunnari) at South Georgia indicated by predator diets andits relationship with sea surface temperature. Canadian Journal of Fisheries andAquatic Sciences 62 (11), 2530–2537.
Hill, S.L., Keeble, K., Atkinson, A., Murphy, E.J., 2012. A foodweb model to exploreuncertainties in the South Georgia shelf pelagic ecosystem. Deep-Sea ResearchPart II: Topical Studies in Oceanography 59–60, 237–259.
Hofmann, E.E., Wiebe, P.H., Costa, D.P., Torres, J.J., 2004. An overview of theSouthern Ocean Global Ocean Ecosystems Dynamics Program. Deep-SeaResearch II 51, 1921–1924.
Hopkins, T.L., 1985. Food web of an Antarctic mid water ecosystem. Marine Biology89 (2), 197–212.
Hubold, G., 1992. Zur Ökologi der Fische im Weddellmeer. Ber. Polarforsch. 103.Ichii, T., Kato, H., 1991. Food and daily food consumption of southern minke whales
in the Antarctic. Polar Biology 11 (7), 479–487.Ichii, T., Shinohara, N., Fujise, Y., Nishiwaki, S., Matsuoka, K., 1998. Interannual
changes in body fat condition index of minke whales in the Antarctic. MarineEcology Progress Series 175, 1–12.
Ikeda, T., Thomas, P.G., 1987. Longevity of the Antarctic krill (Euphausia superbaDana) based on a laboratory experiment. Proceedings National Institute of PolarResearch Symposium on Polar Biology 1, 56–62.
Jarre-Teichmann, A., Brey, T., Bathmann, U., Dahm, C., Dieckmann, G., Gorny, M.,Klages, M., Pagès, F., Plötz, J., Schiel, S., Stiller, M., Arntz, W., 1997. Trophic flowsin the shelf benthic community of the eastern Weddell Sea, Antarctica. In:Battaglia, B., Valencia, J., Walton, D.W.H. (Eds.), Antarctic Communities: Species,Structure and Survival. Cambridge Univ. Press, Cambridge, UK.
Jenouvrier, S., Barbraud, C., Weimerskirch, H., 2003. Effects of climate variability onthe temporal population dynamics of southern fulmars. Journal of AnimalEcology 72 (4), 576–587.
Jenouvrier, S., Barbraud, C., Cazelles, B., Weimerskirch, H., 2005a. Modellingpopulation dynamics of seabirds: importance of the effects of climatefluctuations on breeding proportions. Oikos 108, 511–522.
Jenouvrier, S., Barbraud, C., Weimerskirch, H., 2005b. Long-term contrastedresponses to climate of two Antarctic seabird species. Ecology 86 (11), 2889–2903.
Ju, S.-J., Harvey, H.R., 2004. Lipids as markers of nutritional condition and diet in theAntarctic krill Euphausia superba and Euphausia crystallorophias during australwinter. Deep-Sea Research II 51, 2199–2214.
Ju, S.-J., Scolardi, K., Daly, K.L., Harvey, H.R., 2004. Understanding the trophic role ofthe Antarctic ctenophore, Callianira antarctica, using lipid biomarkers. PolarBiology 27 (12), 782–792.
Kawaguchi, K., Matsuda, O., Naito Ishikawa, S., 1986. A light trap to collect krill andother micronektonic and planktonic animals under the Antarctic coastal fast-ice. Polar Biology 6 (1), 37–42, Y..
Kawamura, A., 1980. A review of food of Balaenopterid Whales. Scientific Reports ofthe Whales Research Institute 32, 155–197.
Klages, N.T.W., Cockcroft, V.G., 1990. Feeding behavior of a captive crabeater seal.Polar Biology 10, 403–404.
Kock, K.-H., 1987. Marine consumers: fish and squid. Environment International 13,37–45.
Kock, K.H., 1992. Antarctic Fish and Fisheries. Cambridge University Press.Konishi, K., Tamura, T., Zenitani, R., Bando, T., Kato, H., Walløe, L., 2008. Decline in
energy storage in the Antarctic minke whale (Balaenoptera bonaerensis) in theSouthern Ocean. Polar Biology 31, 1509–1520.
Kopczynska, E.E., 1992. Dominance of microflagellates over diatoms in the Antarcticareas of deep vertical mixing and krill concentration. Journal Plankton Research14 (8), 1031–1054.
La Mesa, M., Eastman, J.T., Vacchi, M., 2004. The role of notothenioid fish in the foodweb of the Ross Sea shelf waters: a review. Polar Biology 27 (6), 321–338.
Lascara, C.M., Hofmann, E.E., Ross, R.M., Quetin, L.B., 1999. Seasonal variability inthe distribution of Antarctic krill, Euphausia superba, west of the AntarcticPeninsula. Deep-Sea Research, Part I. Oceanographic Research Papers 46 (6),951–984.
Leatherwood, S.R., Randall, R., 1983. The Sierra Club Handbook of Whales andDolphins. Sierra Club Books, San Francisco.
Ligowski, R., 2000. Benthic feeding by krill, Euphausia superba Dana, in coastalwaters off West Antarctica and in Admiralty Bay, South Shetland Islands. PolarBiology 23 (9), 619–625.
Laws, R.M., 1977. Seals and whales of the Southern Ocean. PhilosophicalTransactions of the Royal Society of London B, Biological Sciences 279 (963),81–96.
Laws, R.M., 1984. Antarctic Ecology. Academic Press, London, UK.Lawson, G.L., Wiebe, P.H., Ashjian, C.J., Stanton, T.K., 2008a. Euphausiid distribution
along the Western Antarctic Peninsula – Part B: distribution of euphausiidaggregations and biomass, and associations with environmental features. Deep-Sea Research II 55, 432–454.
Lawson, G.L., Wiebe, P.H., Stanton, T.K., Ashjian, C.J., 2008b. Euphausiid distributionalong the Western Antarctic Peninsula – Part A: development of robust multi-
of the food web of the southern region of the western Antarctic Peninsula13.11.007

T. Ballerini et al. / Progress in Oceanography xxx (2013) xxx–xxx 19
frequency acoustic techniques to identify euphausiid aggregations and quantifyeuphausiid size, abundance, and biomass. Deep-Sea Research II 55, 412–431.
Link, S.J., 2010. Adding rigor to ecological network models by evaluating a set ofpre-balance diagnostics: a plea for PREBAL. Ecological Modeling 221 (12), 1580–1591.
Loeb, V., Siegel, V., Holm-Hansen, O., Hewitt, R., Fraser, W., Trivelpiece, W.,Trivelpiece, S., 1997. Effects of sea-ice extent and krill or salp dominance on theAntarctic food web. Nature 387, 897–900.
Lowry, L.F., Testa, J.W., Calvert, W., 1987. Notes on winter feeding of crabeater andleopard seals near the Antarctic Peninsula. Polar Biology 8, 475–478.
Lynch, H.J., Naveen, R., Trathan, P.N., Fagan, W.F., 2012. Spatially integratedassessment reveals widespread changes in penguin populations on theAntarctic Peninsula. Ecology 93, 1367–1377.
McDonald, B.I., Crocker, D.E., Burns, J.M., Costa, D.P., 2008. Body condition as anindex of winter foraging success in crabeater seals (Lobodon carcinophagus).Deep-Sea Research II 55, 515–522.
Marrari, M., Daly, K.L., Hu, C., 2008. Spatial and temporal variability of SeaWiFSderived chlorophyll distributions west of the Antarctic Peninsula: implicationsfor krill production. Deep Sea Research II 55, 377–392.
Marrari, M., Daly, K.L., Timonin, A., Semenova, T., 2011. The zooplankton ofMarguerite Bay, Western Antarctic Peninsula-Part I: abundance, distribution,and population response to variability in environmental conditions. Deep-SeaResearch Part II: Topical Studies in Oceanography 58 (13–16), 1599–1613.
Marschall, H.-P., 1988. The overwintering strategy of Antarctic krill under the pack-ice of the Weddell Sea. Polar Biology 9, 129–135.
Meredith, M.P., King, J.C., 2005. Rapid climate change in the ocean west of theAntarctic Peninsula during the second half of the 20th century. GeophysicalResearch Letters 32, L19604.
Meredith, M.P., Venables, H.J., Clarke, A., Ducklow, H.W., Erickson, M., Leng, M.J.,Lenaerts, J.T.M., van den Broeke, M.R., 2013. The freshwater system west of theAntarctic Peninsula: spatial and temporal changes. Journal of Climate 26, 1669–1684.
Meyer, B., Atkinson, A., Blume, B., Bathmann, U.V., 2003. Feeding and energybudgets of larval Antarctic krill Euphausia superba in summer. Marine EcologyProgress Series 257, 167–177.
Meyer, B., Fuentes, V., Guerra, C., Schmidt, K., Atkinson, A., Spahic, S., Cisewski, B.,Freier, U., Olariaga, A., Bathmann, U., 2009. Physiology, growth, anddevelopment of larval krill Euphausia superba in autumn and winter in theLazarev Sea, Antarctica. Limnology and Oceanography 54 (5), 1595–1614.
Moline, M., Claustre, H., Frazer, T.K., Schofield, O., Vernet, M., 2004. Alteration of thefood web along the Antarctic Peninsula in response to a regional warmingtrend. Global Change Biology 10 (12), 1973–1980.
Montes-Hugo, M., Doney, S.C., Ducklow, H.W., Fraser, W., Martinson, D.,Stammerjohn, S.E., Schofield, O., 2009. Recent changes in phytoplanktoncommunities associated with rapid regional climate change along the westernAntarctic Peninsula. Science 323, 1470–1473.
Moreau, S., Ferreyra, G.A., Mercier, B., Lemarchand, K., Lionard, M., Roy, S., Mostajir,B., Roy, S., van Hardenberg, B., Demers, S., 2010. Variability of the microbialcommunity in the western Antarctic Peninsula from late fall to spring during alow ice cover year. Polar Biology 33, 1599–1614.
Murphy, E.J., Cavanagh, R.D., Hofmann, E.E., Hill, S.L., Constable, A.J., Costa, D.P.,Pinkerton, M.H., Johnston, N.M., Trathan, P.N., Klinck, J.M., Wolf-Gladrow,D.A., Daly, K.L., Maury, O., Doney, S.C., 2012. Developing integrated models ofSouthern Ocean food webs: Including ecological complexity, accountingfor uncertainty and the importance of scale. Progress in Oceanography 102,74–92.
Murphy, E.J., Hofmann, E.E., Watkins, J.L., Johnston, N.M., Piñones, A., Ballerini, T.,Hill, S.L., Trathan, P.N., Tarling, G.A., Cavanagh, R.A., Young, E.F., Thorpe, S.E.,Fretwell, P., 2013. Comparison of the structure and function of Southern Oceanregional ecosystems: the Antarctic Peninsula and South Georgia. Journal ofMarine Systems 109–110, 22–42.
Murphy, E.J., Watkins, J.L., Trathan, P.N., Reid, K., Meredith, M.P., Thorpe, S.E.,Johnston, N.M., Clarke, A., Tarling, G.A., Collins, M.A., Forcada, J., Shreeve, R.S.,Atkinson, A., Korb, R., Whitehouse, M.J., Ward, P., Rodhouse, P.G., Enderlein, P.,Hirst, A.G., Martin, A.R., Hill, S.L., Staniland, I.J., Pond, D.W., Briggs, D.R.,Cunningham, N.J., Fleming, A.H., 2007. Spatial and temporal operation of theScotia Sea ecosystem: a review of large-scale links in a krill centred food web.Philosophical Transactions of the Royal Society B-Biological Sciences 362, 113–148.
Nicol, S., Constable, A.J., Pauly, T., 2000. Estimates of circumpolar abundance ofAntarctic krill based on recent acoustic density measurements. CCAMLR Science7, 87–99.
Nørdoy, E.S., Folkow, L.P., Blix, A.S., 1995. Distribution and diving behaviour ofcrabeater seals (Lobodon carcinophagus) off Queen Maud Land. Polar Biology 15,261–268.
Ohsumi, S., 1979a. Feeding Habits of the Minke Whale in the Antarctic. Report of theInternational Whaling Commission 29, 473–476.
Ohsumi, S., 1979b. Interspecies relationships among some biological parameters incetaceans and estimation of the natural mortality coefficients of the southernhemisphere minke whale. Report of the International Whaling Commission 29,397–406.
Øresland, V., 1995. Winter population structure and feeding of the chaetognathEukrohnia hamata and the copepod Euchaeta antarctica in Gerlache Strait,Antarctic Peninsula. Marine Ecology Progress Series 119, 77–86.
Øresland, V., Ward, P., 1993. Summer and winter diet of four carnivorous copepodspecies around South Georgia. Marine Ecology Progress Series 98 (1–2), 73–78.
Please cite this article in press as: Ballerini, T., et al. Productivity and linkagescontinental shelf. Prog. Oceanogr. (2013), http://dx.doi.org/10.1016/j.pocean.20
Øristland, T., 1977. Food consumption of seals in the Antarctic pack ice. In: Llano,G.A. (Ed.), Adaptations within Antarctic Ecosystems. Smithsonian Institution,Washington, DC.
Pakhomov, E.A., 2004. Salps/krill interactions in the eastern Atlantic sector of theSouthern Ocean. Deep-Sea Research II 51, 2645–2660.
Pakhomov, E.A., Dubischar, C.D., Strass, V., Brichta, M., Bathmann, U.V., 2006. Thetunicate Salpa thompsoni ecology in the Southern Ocean. Distribution, biomass,demography and feeding ecophysiology. Marine Biology 149, 609–623.
Pakhomov, E.A., Froneman, P.W., 2004. Zooplankton dynamics in the easternAtlantic sector of the Southern Ocean during the austral summer 1997/1998—Part 2: Grazing impact. Deep-Sea Research II 51, 2617–2631.
Pakhomov, E.A., Froneman, P.W., Perissinotto, R., 2002. Salp/krill interactions in theSouthern Ocean: spatial segregation and implications for the carbon flux. Deep-Sea Research II: Topical Studies in Oceanography 49 (9), 1881–1907.
Pakhomov, E.A., Perissinotto, R., 1996. Trophodynamics of the hyperiid amphipodThemisto gaudichaudi in the South Georgia region during the late australsummer. Marine Ecology Progress Series 134, 91–100.
Pakhomov, E.A., Perissinotto, R., McQuaid, C.D., 1997. Prey composition and dailyrations of myctophid fishes in the Southern Ocean. Marine Ecology ProgressSeries 134, 1–14.
Pasternak, A.F., Schnack-Schiel, S.B., 2001. Seasonal feeding patterns of thedominant Antarctic copepods Calanus propinquus and Calanoides acutus in theWeddell Sea. Polar Biology 24 (10), 771–774.
Pauly, D., Christensen, V., Walters, C., 2000. Ecopath, Ecosim, and Ecospace as toolsfor evaluating ecosystem impact of fisheries. ICES Journal of Marine Science:Journal du Conseil 57 (3), 697–706.
Penney, R.L., 1967. Molt in the Adélie penguin. The Auk 84, 61–71.Perissinotto, R., Pakhomov, E.A., McQuaid, C.D., Froneman, P.W., 1997. In situ
grazing rates and daily ration of Antarctic krill Euphausia superba feeding onphytoplankton at the Antarctic Polar Front and the Marginal Ice Zone. MarineEcology Progress Series 160, 77–91.
Perissinotto, R., Gurney, L., Pakhomov, E.A., 2000. Contribution of heterotrophicmaterial to diet and energy budget of Antarctic krill Euphausia superba. MarineBiology 136 (1), 129–135.
Phillips, K., Jackson, G.D., Nichols, P.D., 2001. Predation on myctophids by the squidMoroteuthis ingens around Macquarie and Heard Islands: stomach contents andfatty acid analyses. Marine Ecology Progress Series 215, 179–189.
Pinkerton, M.H., Bradford-Grieve, J.M., Hanchet, S.M., 2010. A balanced model of thefood web of the Ross Sea Antarctica. CCAMLR Science 17, 1–31.
Ponganis, P.J., Stockard, T.K., 2007. The Antarctic toothfish: how common a prey forWeddell seals? Antarctic Science 19 (4), 441–442.
Price, H.J., Boyd, K.R., Boyd, C.M., 1988. Omnivorous feeding behavior of theAntarctic krill Euphausia superba. Marine Biology 97, 67–77.
Priddle, J., Boyd, I.L., Whitehouse, M.J., Murphy, E.J., Croxall, J.P., 1998. Estimates ofSouthern Ocean primary production–constraints from predator carbon demandand nutrient drawdown. Journal of Marine Systems 17 (1–4), 275–288.
Prézelin, B.B., Hofmann, E.E., Moline, M., Klinck, J.M., 2004. Physical forcing ofphytoplankton community structure and primary production in continentalshelf waters of the Western Antarctic Peninsula. Journal of Marine Research 62(3), 419–460.
Proffitt, K.M., Garrott, R.A., Rotella, J.J., Wheatley, K.E., 2007. Environmental andsenescent related variations in Weddell seal body mass: implications for age-specific reproductive performance. Oikos 116, 1683–1690.
Ratcliffe, N., Catry, P., Hamer, K.C., Klomp, N.I., Furness, R.W., 2002. The effect of ageand year on the survival of breeding adult Great Skuas Catharacta skua inShetland. Ibis 144, 384–392.
Reilly, S., Hedley, S., Borberg, J., Hewitt, R., Thiele, D., Watkins, J., Naganobu, M.,2004. Biomass and energy transfer to baleen whales in the South Atlantic sectorof the Southern Ocean. Deep-Sea Research II 51, 1397–1409.
Ribic, C.A., Chapman, Erik., Fraser, W.R., Lawson, G.L., Wiebe, P.H., 2008. Toppredators in relation to bathymetry, ice and krill during austral winter inMarguerite Bay, Antarctica. Deep Sea Research, Part II: Topical Studies inOceanography 55, 485–499.
Ribic, C.A., Ainley, D.G., Ford, R.G., Fraser, W.R., Tynan, C.T., Woehler, E.J., 2011.Water masses, ocean fronts, and the structure of Antarctic seabirdcommunities: Putting the eastern Bellingshausen Sea in perspective. Deep-SeaResearch Part II: Topical Studies in Oceanography 58 (13–16), 1695–1709.
Rice, J., 1995. Food web theory, marine food webs, and what climate change may doto northern marine fish populations. In: Beamish, R.J. (Ed.), Climate Change andNorthern Fish Populations, vol. 121. Canadian Special Publication of Fisheriesand Aquatic Sciences, pp. 561–568.
Richardson, A.J., 2008. In hot water: zooplankton and climate change. ICES Journalof Marine Science 65 (3), 279–295.
Rodhouse, P.G., Nigmatullin, C.M., 1996. Cephalopods: their role as consumers.Philosophical Transactions: Biological Sciences 351 (1343), 1003–1022.
Rodhouse, P.G., White, M.G., 1995. Cephalopods occupy the ecological niche ofepipelagic fish in the Antarctic Polar Frontal Zone. The Biological Bulletin 189,77–80.
Rolland, V., Weimerskirch, H., Barbraud, C., 2010. Relative influence of fisheries andclimate on the demographic of four albatross species. Global Change Biology 16(7), 1920–1922.
Ross, R.M., Quetin, L.B., et al., 2000. Growth limitation on young Euphausia superbaunder field conditions. Limnology and Oceanography 45 (1), 31–43.
Rotella, J.J., Link, W.A., Nichols, J.D., Hadley, G.L., Garrott, R.A., Proffitt, K.M., 2009. Anevaluation of density-dependent and density-independent influences onpopulation growth rates in Weddell seals. Ecology 90, 975–984.
of the food web of the southern region of the western Antarctic Peninsula13.11.007

20 T. Ballerini et al. / Progress in Oceanography xxx (2013) xxx–xxx
Schnack-Schiel, S.B., Hagen, W., Mizdalski, E., 1998. Seasonal carbon distribution ofcopepods in the eastern Weddell Sea, Antarctica. Journal of Marine Systems 17,305–311.
Schmidt, K., Atkinson, A., Petzke, K.-J., Voss, M., Pond, D.W., 2006. Protozoans as afood source for Antarctic krill Euphausia superba: Complementary insights fromstomach content, fatty acids, and stable isotops. Limnology and Oceanography51 (5), 2409–2427.
Schofield, O., Ducklow, H.W., Martinson, D.G., Meredith, M.P., Moline, M.A., Fraser,W.R., 2010. How do polar marine ecosystems respond to rapid climate change?Science 328 (5985), 1520–1523.
Scolardi, K., Daly, K.L., Pakhomov, E.A., Torres, J.J., 2006. Feeding ecology andmetabolism of the Antarctic cydippid ctenophore Callianira antarctica. MarineEcology Progress Series 317, 111–126.
Siniff, D.B., Garrott, R.A., Rotella, J.J., Fraser, W.R., Ainley, D.G., 2008. Opinion:projecting the effects of environmental change on Antarctic seals. AntarcticScience 20 (05), 425–435.
Smetacek, V., Nicol, S., 2005. Polar ocean ecosystems in a changing world. Nature437, 362–368.
Smith, C.R., DeMaster, D.J., Thomas, C., Srsen, P., Grange, L., Evrard, V., Deleo, F.,2012a. Pelagic-benthic coupling, food banks, and climate change. Oceanography25, 188–201.
Smith, C.R., Mincks, S., DeMaster, D.J., 2006. A synthesis of bentho-pelagic coupling onthe Antarctic shelf: food banks, ecosystem inertia and global climate change.Deep Sea Research, Part II: Topical Studies in Oceanography 53 (8–10), 875–894.
Smith, R.C., Dierssen, H.M., Vernet, M., 1996. Phytoplankton biomass andproductivity in the western Antarctic Peninsula region. In: Ross, R.M.,Hofmann, E.E., Quetin, L.B. (Eds.), Foundations for Ecological Research West ofthe Antarctic Peninsula. Antarctic Research Series 70, American GeophysicalUnion, Washington, DC, pp. 333–356.
Smith, R.C., Stammerjohn, S.E., 2001. Variations of surface air temperature and sea-ice extent in the western Antarctic Peninsula region. Annals of Glaciology 33,493–500.
Smith, W.O., Ainley, D.G., Cattaneo-Vietti, R., 2007. Trophic interactions within theRoss Sea continental shelf ecosystem. Philosophical Transactions of the RoyalSociety B-Biological Sciences 362, 95–111.
Smith, W.O., Ainley, D.G., Cattaneo-Vietti, R., Hofmann, E.E., 2012b. The Ross Seacontinental shelf: Regional biogeochemical cycles, trophic interactions, andpotential future changes. In: Rogers, A.D., Johnston, N.M., Murphy, E.J., Clarke, A.(Eds.), Antarctic Ecosystems: An Extreme Environment in a Changing World.Blackwell Publishing, London, pp. 213–242, Chapter 7.
Southwell, C., Paxton, C.G.M., Borchers, D., Boveng, P., De La Mare, W., 2008. Takingaccount of dependent species in management of the Southern Ocean krillfishery: estimating crabeater seal abundance off east Antarctica. Journal ofApplied Ecology 45, 622–631.
Stammerjohn, S.E., Martinson, D.G., Smith, R.C., Iannuzzi, R.A., 2008. Sea ice in thewestern Antarctic Peninsula region: spatio-temporal variability from ecologicaland climate change perspectives. Deep-Sea Research Part II: Topical Studies inOceanography 55 (18–19), 2041–2058.
Steele, J.H., 2009. Assessment of some linear food web methods. Journal of MarineSystems 76 (1–2), 186–194.
Please cite this article in press as: Ballerini, T., et al. Productivity and linkagescontinental shelf. Prog. Oceanogr. (2013), http://dx.doi.org/10.1016/j.pocean.20
Steele, J.H., Ruzicka, J.J., 2011. Constructing end-to-end models using ECOPATH data.Journal of Marine Systems 87, 227–238.
Swadling, K.M., Gisbon, J.A.E., Ritz, D.A., Nichols, P.D., Hughes, D.E., 1997. Grazing ofphytoplankton by copepods in eastern Antarctic coastal water. Marine Biology128 (1), 39–48.
Taki, K., 2006. Biomass and production of the euphausiid Euphausia pacifica alongthe coastal waters off north-eastern Japan. Fisheries Science 72 (2), 221–232.
Tamura, T., Konishi, K., 2009. Feeding habits and prey consumption of Antarcticminke whale (Balaenoptera bonaerensis) in the Southern Ocean. Journal ofNorthwest Atlantic Fishery Science 42, 13–15.
Tanoue, E., Hara, S., 1986. Ecological implications of fecal pellets produced by theAntarctic krill Euphausia superba in the Antarctic Ocean. Marine Biology 91 (3),359–369.
Thiele, D., Chester, E.T., Moore, S.E., Širovic, A., Hildebrand, J.A., Friedlaender, A.S.,2004. Seasonal variability in whale encounters in the Western AntarcticPeninsula. Deep-Sea Research Part II: Topical Studies in Oceanography 51(17–19), 2311–2325.
Töbe, K., Meyer, B., Fuentes, V., 2010. Detection of zooplankton items in the stomachand gut content of larval krill, Euphausia superba, using a molecular approach.Polar Biology 33 (3), 407–414.
Townsend, C.R., Begon, M., Harper, J.L., 2003. Essentials of Ecology, second ed.Blackwell Publishing, Oxford, UK.
Trivelpiece, W.Z., Hinke, J.T., Miller, A.K., Reiss, C.S., Trivelpiece, S.G., Watters, G.M.,2011. Variability in krill biomass links harvesting and climate warming topenguin population changes in Antarctica. Proceedings of the NationalAcademy of Sciences 108 (18), 7625–7628.
Turner, J., Colwell, S.R., Marshall, G.J., Lachlan-Cope, T.A., Carleton, A.M., Jones, P.D.,Lagun, V., Reid, P.A., Iagovkina, S., 2005. Antarctic climate change during the last50 years. International Journal of Climatology 3, 279–294.
Volkman, N.J., Presler, P., Trivelpiece, W.Z., 1980. Diets of pygoscelid penguins atKing George Island, Antarctica. Condor 82, 372–378.
Voronina, N.M., Menshutkin, V.V., Tseitlin, V.B., 1980a. The secondarymesozoplankton production of the Antarctic. In: Production primaire etsecondaire. Colloque franco-sovietique. Actes Colloq.-Cent. natn. Exploit.Oceans, 10: 77–89, figs. 1–3 (French summary).
Voronina, N.M., Menshutkin, V.V., Tseitlin, V.B., 1980b. Model investigations of anannual cycle of the population of the mass copepod species Rhincalanus gigasand estimates of its production in the Antarctic. Okeanologiya 20 (6), 1079–1086, L, figs. 11-4 (Russian with English summary).
Weston, K., Jickells, T.D., Carson, D.S., Clarke, A., Meredith, M.P., Brandon, M.A.,Wallace, M.I., Ussher, S.J., Hendry, K.R., 2013. Primary production export flux inMarguerite Bay (western Antarctic Peninsula shelf): linking upper water-column production to sediment trap derived flux. Deep-Sea Research Part I 75,52–66.
Woehler, E.J., Croxall, J.P., 1997. The status and trends of Antarctic and Sub-Antarctic seabirds. Marine Ornithology 25, 43–66.
Xavier, J.C., Croxall, J.P., Reid, K., 2003. Interannual variation in the diets of twoalbatross species breeding at South Georgia: implications for breedingperformance. Ibis 145 (4), 593–610.
of the food web of the southern region of the western Antarctic Peninsula13.11.007