production of synthetic natural gas (sng) from biomass · pdf fileecn-e--06-018 production of...
TRANSCRIPT

ECN-E--06-018
Production of Synthetic Natural Gas(SNG) from Biomass
Development and operation of an integratedbio-SNG system
Non-confidential version
R.W.R. ZwartH. Boerrigter
E.P. DeurwaarderC.M. van der Meijden
S.V.B. van Paasen
The development and operation of an integrated bio-SNG system was partly financed bySenterNovem within the framework of the DEN-programme

2 ECN-E--06-018
Preface The work described in this report was carried out within the framework of the project “Milena-SNG; Development and operation of an integral bench-scale system for the production of Synthetic Natural Gas” that was partly financed by SenterNovem (formerly: Novem) within the framework of the DEN-programme under project number 2020-03-11-14-011. Partners in the project were the Energy research Centre of the Netherlands (ECN), GasTerra, and Gasunie Transport Services. Applicable ECN project number was 7.5259. Justification Within the project work plan it was foreseen that an Industrial Soundary Board would be installed. The project partners decided to form a Soundary Board in the second phase of the project when first results were available. In the same period, however, a Working Group ‘Green Gas’ was installed as part of the Energy Transition Platform ‘New Gas’. In this working group all relevant parties were represented. Therefore, the project partners decided to use the working group as Soundary Board for the project. The general section in Chapter 1 of this report is primarily based on a paper from this Working Group. Abstract The substitution of natural gas by a renewable equivalent is an interesting option to reduce the use of fossil fuels and the accompanying greenhouse gas emissions, as well as from the point of view of security of supply. The renewable alternative for natural gas is the so-called green natural gas, i.e. gaseous energy carriers produced from biomass comprising both biogas and Synthetic Natural Gas (SNG). Via this route can be benefited from all the advantages of natural gas, like the existing dense infrastructure, trade and supply network, and natural gas applications. To implement green natural gas in the Dutch energy infrastructure a phased approach is suggested. On the short term is started with the route of upgraded biogas produced by biological digestion of biomass materials like manure. The main source of green natural gas on the long term, however, will be synthetic natural gas (SNG) that is produced via gasification of biomass and subsequent methanation of the product gas. The potential for natural gas substitution by SNG is in fact 100%, a potential limitation might be set by the requirement for large amounts of biomass. In order to demonstrate that this bio-SNG can comply (at least after blending) with these specifications, an experimental bench-scale line-up for SNG production from biomass has been developed and implemented, consisting of a biomass gasifier and several gas cleaning and conditioning steps. Keywords Biomass, Gas cleaning, Gas conditioning, Gas treatment, Indirect gasification, Methanation, MILENA, OLGA, Oxygen-blown gasification, SNG, SNG upgrading, Synthetic natural gas, Tar removal Acknowledgements The authors acknowledge the following ECN co-workers for their contributions to work described in this report: F.A.C.W. Arts, A.R. Boersma, H.A.J. van Dijk, A. van der Drift, and L.P.L.M. Rabou. Contact For more information, please contact: Ir. Robin Zwart Energy research Centre of the Netherlands (ECN) Unit Biomass, Coal, and Environmental Research E-mail: [email protected] Phone: +31-224-564574 Web: www.ecn.nl/bkm (non-confidential ECN reports can be downloaded from this site)
ECN-E--06-018 3
Contents
List of tables 5 List of figures 6 Executive summary 7 1. Introduction 17
1.1 Role of natural gas 17 1.2 SNG ambitions and implementation 18 1.3 Biomass availability and logistics 19 1.4 SNG production technology 20 1.5 SNG development trajectory 21 1.6 This report 22
2. SNG in existing natural gas infrastructure 23 2.1 Main infrastructure 23 2.2 Gas trading system 25 2.3 SNG specifications for grid injection 25 2.4 The European natural gas infrastructure 26
3. Development of experimental line-up 27 3.1 General concept 27 3.2 Gasification technology 28
3.2.1 Technology selection 28 3.2.2 MILENA technology 29
3.3 Indirect gasification results 30 3.3.1 Biomass fuel 31 3.3.2 Gasification temperature 31 3.3.3 Recycle of tar to the combustor 33 3.3.4 Alternative bed materials 34 3.3.5 Nitrogen dilution in product gas 35
3.4 Oxygen-blown gasification results 35 3.5 Gas treatment 36
3.5.1 OLGA tar removal 36 3.5.2 Gas cleaning 37
3.6 Gas conditioning 37 3.6.1 Carbon formation 37 3.6.2 Water-gas shift 38 3.6.3 Conversion of hydrocarbons 40
3.7 Methanation 40 3.7.1 Methanation system 40 3.7.2 Experimental 42
3.8 Demonstration of technical feasibility 43 3.8.1 Pressurised system 43 3.8.2 Atmospheric system 45
4. Pre-design bio-SNG demonstration plant 49 4.1 Gasifier 50 4.2 Product gas cooler 51 4.3 Cyclone 51 4.4 OLGA tar removal 51 4.5 Gas Cleaning 52 4.6 Gas conditioning 52 4.7 Methanation 52 4.8 SNG upgrading 52

4 ECN-E--06-018
5. Full-scale commercial bio-SNG plant 55 5.1 Optimum system concept 55 5.2 Integrated system analysis 55 5.3 Market analysis 57
6. Conclusions & Continuation 59 6.1 Conclusions 59 6.2 Continuation 60
References 61

ECN-E--06-018 5
List of tables
Table 1.1 Primary energy consumption in the Netherlands 17 Table 1.2 Definition of gases 18 Table 1.3 Transshipment (import plus export) of selected materials in some Dutch
harbours 20 Table 2.1 Green gas specifications 26 Table 3.1 Composition of tested biomass fuels 31 Table 3.2 MILENA product gas compositions as function of the gasification temperature
with dry beech wood as feed 32 Table 3.3 Effect on flue gas composition of tar recycle to the combustor 34 Table 3.4 Effect of bed material on product gas composition. 34 Table 3.5 Effect of nitrogen and CO2 purge on product gas composition 35 Table 3.6 Experimental results of oxygen-blown fluidised bed gasification 35 Table 3.7 Typical MILENA product gas composition for wood with 25% moisture 37 Table 3.8 Experimental conditions and results of water-gas shift experiments 39 Table 3.9 Feed gas composition for catalyst screening tests 42 Table 3.10 Measured gas compositions (normalised, dry basis) during integrated test with
system of oxygen/steam gasification in WOB, OLGA tar removal, water scrubber, compression and gas polishing, and methanation 44
Table 3.11 Product gas composition on different locations in the installation 46 Table 4.1 MILENA product gas compositions (wet basis) of the raw product gas after the
gas cooler and after the gas cleaning 50 Table 5.1 Composition of the SNG product 56 Table 5.2 Power consumption and generation 57 Table 5.3 Overall yields 57 Table 5.4 Total capital costs for four different SNG production systems. 57 Table 5.5 SNG production costs 58 Table 5.6 Necessary support for production of SNG 58

6 ECN-E--06-018
List of figures
Figure 1.1 Impression of the Green gas ambitions and implementation in time 19 Figure 1.2 Schematic line-up of the integrated bio-SNG system 21 Figure 1.3 Schematic presentation of the installation for phase 1 slipstream demonstration 22 Figure 2.1 Blending stations and entry points of the Dutch gas infrastructure 23 Figure 3.1 Simplified system line-up of pressurised integrated biomass gasification SNG
synthesis system 27 Figure 3.2 Simplified system line-up of integrated bio-SNG synthesis system without
intermediate water condensation and pressurisation 28 Figure 3.3 SNG production efficiencies for different gasification technologies 29 Figure 3.4 Schematic plot of the lab-scale MILENA gasifier 30 Figure 3.5 Lab-scale 5 kg/h MILENA gasifier at ECN 30 Figure 3.6 Carbon formation at thermodynamic equilibrium 38 Figure 3.7 Carbon formation at thermodynamic equilibrium for different steam contents 38 Figure 3.8 Methanation system based on four adiabatic reactors with intermediate cooling 40 Figure 3.9 Variation of CH4 flow and (adiabatic) reactor temperature in the methanation
system as shown in figure 3.8 operated at 1 bar. Feed flow is 100 mol/h with 8.9 mol/h of initial CH4 41
Figure 3.10 Variation of CH4 flow and (adiabatic) reactor temperature in the methanation system as shown in figure 3.8 operated at 10 bar. Feed flow is 100 mol/h with 8.9 mol/h of initial CH4 42
Figure 3.11 Activity plots (temperature dependent reaction speed) for selected methanation catalysts 43
Figure 3.12 System line-up of integrated lab-scale bio-SNG system operated for the demonstration of the technical feasibility. Upgrading of the raw product SNG was not included (i.e. water and CO2 removal) 45
Figure 4.1 Basic process flow diagram of 150 MWth integrated biomass gasification SNG production plant. 49
Figure 5.1 Schematic presentation of the optimum SNG production system 55

ECN-E--06-018 7
Executive summary
Introduction In the Netherlands annually almost 3,300 PJ of primary energy is consumed for the production of electricity, heat, transportation fuels, and chemicals and other products. Natural gas consumption represents almost 50% of this Dutch (primary) energy consumption. The main applications of natural gas are chemistry, power production, and – by far the largest – the production of heat for both households and industry. The substitution of natural gas by a renewable equivalent is an interesting option to reduce the use of fossil fuels and the accompanying greenhouse gas emissions, as well as from the point of view of security of supply. The renewable alternative for natural gas is the so-called green natural gas, i.e. gaseous energy carriers produced from biomass comprising both biogas and Synthetic Natural Gas (SNG). Via this route can be benefited from all the advantages of natural gas, like the existing dense infrastructure, trade and supply network, and natural gas applications. Within the Energy Transition activity of the Dutch Ministry of Economic Affairs, five Platforms are formed that concentrate on different sectors of the energy infrastructure. One of the transition platforms is dedicated to new gas options. This transition “Platform New Gas” has defined the ambition to replace 20% of the natural gas by green gas by 2030, with a substitution target of 50% being suggested for 2050, corresponding to approximately 300 PJ in 2030 and 750 PJ in 2050. The potential of (upgraded) biogas and landfill gas in the Netherlands is maximum 60 PJ due to limited availability of suitable digestible feedstock materials. To reach the ambition of 20% substitution in 2030, hence, an additional SNG production capacity is required of at least 240 PJ. Whereas digestion is an available and commercially proven technology with widespread implementation on farm scale, the technology for SNG production, however, is still under development and realisation of the first semi-commercial biomass plant is not expected before 2010. Underlying report describes the results of a project aimed at the demonstration of the technical feasibility of integrated bio-SNG production. To implement green natural gas in the Dutch energy infrastructure a phased approach is suggested. On the short term is started with the route of upgraded biogas produced by biological digestion of biomass materials like manure. The main source of green natural gas on the long term, however, will be synthetic natural gas (SNG) that is produced via gasification of biomass and subsequent methanation of the product gas. The potential for natural gas substitution by SNG is in fact 100%. A potential limitation might be set by the requirement for large amounts of biomass. The large amounts of SNG would typically be injected to the high or medium pressure national gas grid. Adding Synthetic Natural Gas (SNG) to the existing natural gas infrastructure Natural gas is supplied by the producers at a pressure of around 66 bar. Sand, water, condensate and other contaminants are removed from the gas at the wellhead. The main transmission system comprises approximately 11,000 km of natural gas pipelines at different pressures plus plants and equipment for compressing, blending, metering, and regulating the different gas flows. The High-pressure Transmission Lines (HTL) network carries gas at pressures in the range 43 to 66 bar, and occasionally as high as 80 bar. The gas enters the system at either producer's gas conditioning stations on the gas fields, or at import stations on the border. HTL end points are the metering and regulating stations (M&R), which form the link between the HTL and the Regional Transmission Lines (RTL) networks, and the export stations. As from M&R stations on no blending facilities are available, the HTL network from metering and regulating point of view seems to be more attractive for SNG injection than the RTL network. Furthermore, from gas trading point of view, injection in the HTL network also seems more attractive.
8 ECN-E--06-018
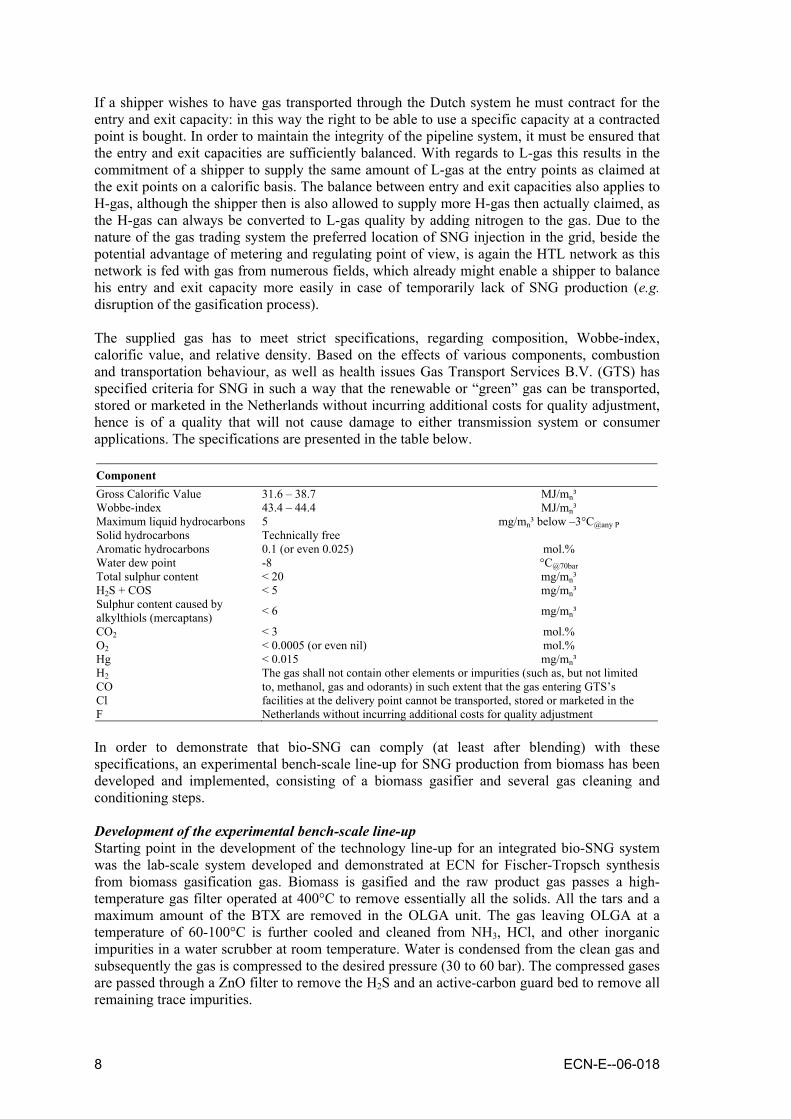
If a shipper wishes to have gas transported through the Dutch system he must contract for the entry and exit capacity: in this way the right to be able to use a specific capacity at a contracted point is bought. In order to maintain the integrity of the pipeline system, it must be ensured that the entry and exit capacities are sufficiently balanced. With regards to L-gas this results in the commitment of a shipper to supply the same amount of L-gas at the entry points as claimed at the exit points on a calorific basis. The balance between entry and exit capacities also applies to H-gas, although the shipper then is also allowed to supply more H-gas then actually claimed, as the H-gas can always be converted to L-gas quality by adding nitrogen to the gas. Due to the nature of the gas trading system the preferred location of SNG injection in the grid, beside the potential advantage of metering and regulating point of view, is again the HTL network as this network is fed with gas from numerous fields, which already might enable a shipper to balance his entry and exit capacity more easily in case of temporarily lack of SNG production (e.g. disruption of the gasification process). The supplied gas has to meet strict specifications, regarding composition, Wobbe-index, calorific value, and relative density. Based on the effects of various components, combustion and transportation behaviour, as well as health issues Gas Transport Services B.V. (GTS) has specified criteria for SNG in such a way that the renewable or “green” gas can be transported, stored or marketed in the Netherlands without incurring additional costs for quality adjustment, hence is of a quality that will not cause damage to either transmission system or consumer applications. The specifications are presented in the table below. Component Gross Calorific Value 31.6 – 38.7 MJ/mn³ Wobbe-index 43.4 – 44.4 MJ/mn³ Maximum liquid hydrocarbons 5 mg/mn³ below –3°C@any P Solid hydrocarbons Technically free Aromatic hydrocarbons 0.1 (or even 0.025) mol.% Water dew point -8 °C@70bar Total sulphur content < 20 mg/mn³ H2S + COS < 5 mg/mn³ Sulphur content caused by alkylthiols (mercaptans) < 6 mg/mn³
CO2 < 3 mol.% O2 < 0.0005 (or even nil) mol.% Hg < 0.015 mg/mn³ H2 The gas shall not contain other elements or impurities (such as, but not limited CO to, methanol, gas and odorants) in such extent that the gas entering GTS’s Cl facilities at the delivery point cannot be transported, stored or marketed in the F Netherlands without incurring additional costs for quality adjustment In order to demonstrate that bio-SNG can comply (at least after blending) with these specifications, an experimental bench-scale line-up for SNG production from biomass has been developed and implemented, consisting of a biomass gasifier and several gas cleaning and conditioning steps. Development of the experimental bench-scale line-up Starting point in the development of the technology line-up for an integrated bio-SNG system was the lab-scale system developed and demonstrated at ECN for Fischer-Tropsch synthesis from biomass gasification gas. Biomass is gasified and the raw product gas passes a high-temperature gas filter operated at 400°C to remove essentially all the solids. All the tars and a maximum amount of the BTX are removed in the OLGA unit. The gas leaving OLGA at a temperature of 60-100°C is further cooled and cleaned from NH3, HCl, and other inorganic impurities in a water scrubber at room temperature. Water is condensed from the clean gas and subsequently the gas is compressed to the desired pressure (30 to 60 bar). The compressed gases are passed through a ZnO filter to remove the H2S and an active-carbon guard bed to remove all remaining trace impurities.

ECN-E--06-018 9
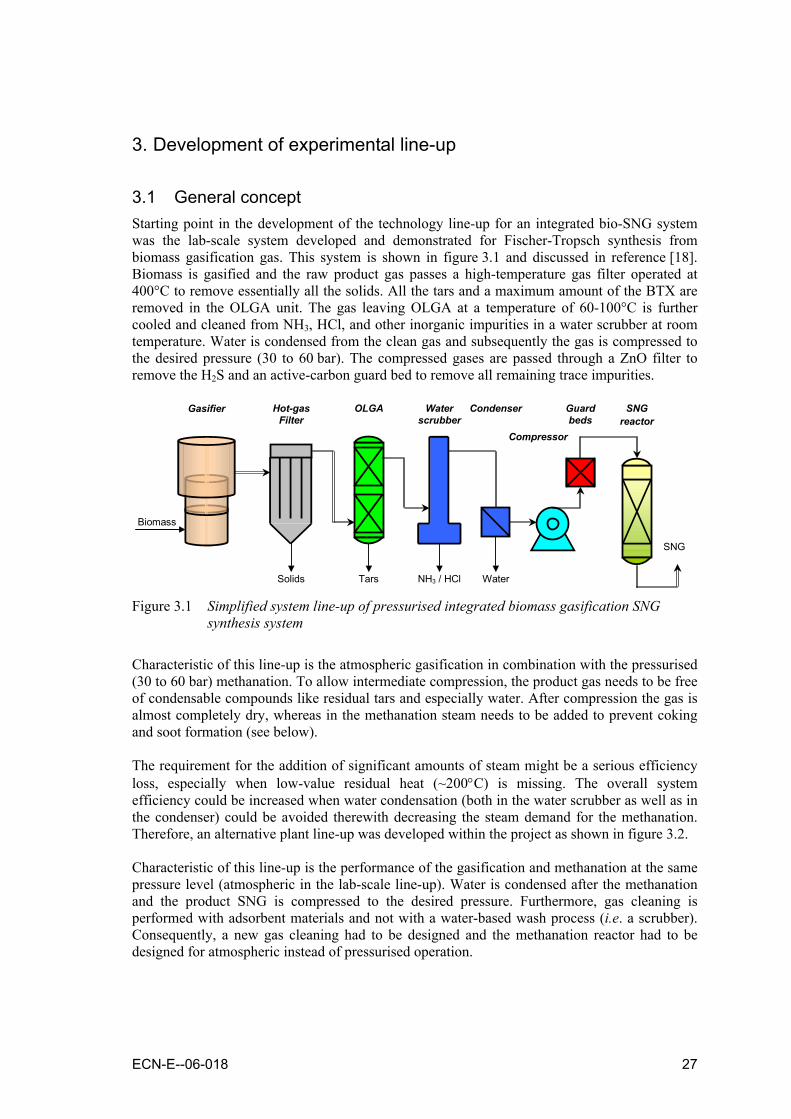
Characteristic of this initial line-up is the atmospheric gasification in combination with the pressurised (30 to 60 bar) methanation. To allow intermediate compression, the product gas needs to be free of condensable compounds like residual tars and especially water. After compression the gas is almost completely dry, whereas in the methanation steam needs to be added to prevent coking and soot formation. The requirement for the addition of large amounts of steam is a serious efficiency loss. Therefore, an alternative plant line-up was developed within the project as shown in the figure below.
Biomass
Solids Tars
SNG
Hot-gas Filter
OLGA Compressor Gasifier SNG reactor
Absorbents Condenser
Characteristic of this new line-up is the performance of the gasification and methanation at the same pressure level (atmospheric in the lab-scale line-up). Water is condensed after the methanation and the product SNG is compressed to the desired pressure. Furthermore, gas cleaning is performed with adsorbent materials and not with a water-based wash process (i.e. a scrubber). In an optimum bio-SNG system already a high concentration of methane is produced in the gasification step. Different biomass gasification technologies are available. These can be divided into two categories: high-temperature and low-temperature gasification. High-temperature gasification (typically above 1200°C) results in a gas, which merely contains H2 and CO as combustible components. At low-temperature however (typically below 1000°C), also hydrocarbons are present in the gas. A circulating fluidised bed (CFB) gasifier operated on biomass operated at 900°C typically produces a gas containing 50% hydrocarbons (mainly methane, ethylene, and benzene) on energy basis. A high initial yield of CH4 (“instant SNG”) is attractive, since the alternative conversion of H2 and CO to CH4 (methanation) involves approximately 20% efficiency loss (heat production). The envisaged high overall efficiency of biomass to SNG of low-temperature indirect gasification processes has been the reason for ECN to start the development and implementation of an indirect gasification technology, called MILENA. Indirect gasifiers generally produce two gases: a medium calorific product gas with little or no nitrogen and a flue gas. The production of an N2-free gas without the need of air-separation is one of the advantages over direct gasification processes like a CFB. Another important advantage is the complete conversion. The ashes that remain contain little or no residual carbon since this is the product of a combustion process. Indirect gasifiers also have the option to deal with residues from e.g. gas cleaning such as tars. These can be added to the combustor and contribute to the overall efficiency rather than impose a waste problem. The gas treatment in the integrated bio-SNG line-up comprises tar removal with the OLGA technology and sulphur and HCl removal with adsorbents. The OLGA process is based on applying an organic scrubbing liquid (i.e. “OLGA” is the Dutch acronym for oil-based gas washer). The OLGA is operated downstream a high-efficient solids removal step (e.g. a hot gas filter). The OLGA gas inlet temperature has to be kept higher than the tar dewpoint (typically > 400°C), similarly the gas outlet temperature must be higher than the water dewpoint (typically 60-80°C).
10 ECN-E--06-018
In the first OLGA column (‘Collector’) the product gas is cooled, upon which the liquid tars are collected. Also dust particles that were not removed by the upstream cyclone are collected. In the second column (‘Absorber’) gaseous tars are absorbed in the scrubbing liquid at the resulting temperature. The liquid tars are separated from the scrubbing liquid and returned to the gasifier; also a small amount of the scrubbing liquid is bleed and recycled to the gasifier. For the absorption step, scrubbing columns were selected that are interacting with each other in a classical absorption-regeneration mode. The scrubbing oil from the Absorber with the dissolved tars is regenerated in the ‘Stripper’. Air is used to strip the tars from the scrubbing oil and the tar-loaded air is used in the combustor of the MILENA. The loss of scrubbing liquid in the Stripper by volatilisation is minimised by use of a condenser. The cleaned product gas leaving the Absorber is “tar-free” (i.e. free of tar related problems) and can be treated further in the water-based gas cleaning, fired in a gas engine, or used for more advanced catalytic applications. Absorbent materials perform further gas cleaning. After the gas treatment, the MILENA product gas requires additional conditioning before it is suitable for catalytic methanation. Conditioning comprises steam addition to avoid carbon formation and help adjust the H2/CO ratio, and conversion of the remaining (unsaturated) hydrocarbons. The formation of carbon is undesired, because it results in loss of conversion efficiency, but also in deactivation of the catalyst by carbon deposition. Thermodynamics show that at low temperatures large amounts of steam are necessary in the gas to prevent carbon formation based on thermodynamic equilibrium. At higher temperatures less steam is necessary, with the exact amount depending on the pressure. Although the steam content of the raw MILENA product gas is already high, according to the thermodynamic equilibrium it is not even enough to suppress carbon formation at low temperatures (200-500°C). In the methanation reaction three molecules of H2 are consumed for each CO molecule. The H2/CO ratio in the MILENA product gas is typically in the range of 1:1. Typical methanation catalysts are nickel-based. Although these catalysts exhibit some water gas-shift activity that will produce in-situ additional H2 with the steam in the gas, it is preferred to add a water-gas shift step upstream of the methanation reactor. As steam is added for the shift, also the H/C ratio of the gas is improved with respect to prevention of soot formation. Due to the high exothermic character of the methanation reactions the temperature will increase significantly in adiabatic systems. Resultantly, the thermodynamic equilibrium is readily reached but with only limited conversion. To achieve high conversions the temperature must be decreased, i.e. the reaction heat has to be removed. Typically, this is achieved by internally cooled reactors or by gas recycles. The simplest system, however, comprises a series of (adiabatic) methanation reactors with intermediate heat exchangers. The application of such a system is limited to processes at lower pressures – e.g. the final experimental bench-scale line-up – as at higher pressures the equilibrium shifts towards CH4 and adiabatic temperature increase in the reactors will result in too high temperatures and thermal damage of the catalysts. Demonstration of the initial experimental lab-scale line-up The technical feasibility of the production of SNG from biomass is demonstrated by tests with integrated biomass gasification, gas cleaning, and methanation experiments. In the experiments upgrading of the raw product SNG, i.e. water and CO2 removal, was not included for practical considerations. Furthermore, water and CO2 removal are well-known and commercially available technologies. The initially demonstrated integrated system line-up is based on atmospheric gasification in combination with pressurised methanation. Biomass is gasified in the ECN lab-scale atmospheric bubbling fluidised bed gasifier “WOB”. Oxygen is used as gasifying medium to produce an essentially nitrogen-free product gas and steam is added to moderate the temperature in the bed of the gasifier. The gasifier is typically operated at 850°C. The raw product gas passes a high-temperature gas filter operated at 350°C to remove essentially all the solids.

ECN-E--06-018 11
The product gas contained approximately 23 g/mn3 of tars, almost 1.5 vol% of benzene, toluene
and xylene (BTX), and more than 10 vol% of CH4 and C2-hydrocarbons. The lab-scale OLGA unit is operated to remove all the tars, while benzene and toluene were removed for approx. 25 and 50%, respectively. In a larger installation the OLGA unit will bed designed to remove BTX to lower levels. The gas leaving OLGA at a temperature of 80°C is further cooled and cleaned from NH3, HCl, and other inorganic impurities in a water scrubber at room temperature. Both the OLGA and the water scrubber are equipped with a stripper to regenerate the washing oil and water, respectively. In the lab-scale line-up these stripper gases are flared, whereas in full-scale installations the stripper tars and NH3 would be recycled to the gasifier. Water is condensed from the clean gas and subsequently the gas is compressed to 60 bar. The compressed gases are passed through a ZnO filter to remove the H2S and an active-carbon guard bed to remove all remaining trace impurities. Most of the sulphur is present as H2S with only a few percent COS. H2S is removed by the ZnO filters, COS (and CS2) by the active-carbon guard beds. Methanation was carried out in micro-flow fixed bed reactor with a Ruthenium catalyst. The test was successful and the first biomass-based SNG was produced. However, loss of catalyst productivity was observed within several hours of testing, which was due to significant soot formation as was confirmed by post-mortem analysis. Optimisation of this line-up not continued as other system line-up without water condensation and pressurisation was selected (see next section). Demonstration of the final experimental lab-scale line-up The final experimental bench-scale line-up is based on atmospheric gasification in combination with atmospheric methanation as shown in the figure below. The methanation section was constructed and operated on full capacity of the cleaned product gas (1.5 mn
3/h). Water condensation was avoided by operating the gas cleaning and gas conditioning section above the water dew point.
Biomass
Solids Tars
SNG
Hot-gas Filter
OLGA
Booster
Gasifier SNG reactor
Absorbents
Gas conditioning
Oxygen / Steam
The bubbling fluidized bed gasifier (WOB) is operated at 850°C. A mixture of oxygen and steam was added as gasification agent to avoid N2 dilution of the product gas. A Hot Gas Filter (HGF) downstream the gasifier reduces the dust concentration in the product gas. Subsequently, OLGA removes heavy and partly the light tars in two separate columns. SACHA was installed for the removal of chlorine (HCl) and sulphur compounds (H2S, COS, CS2, mercaptanes). Unsaturated hydrocarbons were catalytically converted in the gas conditioning section to avoid soot formation in the methanation section. Three functional tests were performed with the final system line up. In the 1st functional test the gas cleaning was tested for the removal of tar, sulphur and chlorine compounds. The 2nd test was performed to investigate the removal of unsaturated hydrocarbons in the gas conditioning section. The 3rd test was done with the integrated installation to obtain the performance of the methanation section. In the last test the integrated system has run for approximately 2 hours.
12 ECN-E--06-018
The 1st and 3rd functional tests were successful. During the 2nd test the catalyst in the gas conditioning section lost activity within 15 minutes. The deactivation was caused by soot formation. In the 3rd functional test, the conditions of the gas conditioning section were changed, which solved the problem of deactivation. The gas conditioning section removed the bulk of the unsaturated hydrocarbons, and therewith, protects the catalyst in the methanation section against deactivation with soot. The concentration of C2H4 was reduced below the detection limit and benzene and toluene were removed for 89% and 95% respectively. It is expected that the gas conditioning section also further reduced the tar concentration. Methanation reactions resulted in an increasing CH4 concentration and the CO and H2O content decreased due to the water gas shift reaction. To meet the specification of SNG gas, additional upgrading downstream the methanation section will be necessary. The upgrading concerns the removal of CO2, and H2O and the reduction in N2 concentration. The bulk of the CO2 can be removed with a CO2 separation unit. The N2 in the SNG gas can be reduced by the replacement of the N2 purge on the biomass feeding system with a CO2 purge. The CO2 is available from the separation unit. Finally, the gas must be dehydrated. The upgrading can be done with available technology and was therefore not included in the experimental installation. As a conclusion, the integrated atmospheric gasification installation with atmospheric methanation has run properly. The impurities like dust, sulphur and chlorine have been removed sufficiently and the gas conditioning section removed the bulk of the unsaturated hydrocarbons. To meet the SNG specification, the system (OLGA and methanation section) must be optimised in tar, H2 and CO removal. Pre-design of a bio-SNG demonstration plant Based on the experimental results, a pre-design is made for a 150 MWth bio-SNG plant based on pressurised indirect MILENA gasification of the 15% wet biomass. Due to sand circulation issues the operating pressure of the gasifier is restricted to 7 bar. The line-up of the bio-SNG plant is shown in the figure below. Cooling of product gas is not a standard operation and in most biomass plants cooler fouling is a major source of reduced availability. There are very few examples of functioning gas coolers. Conventional water-tube coolers will foul very rapidly (within several hours) resulting in reduction of the cool capacity of up to 80%. The only approach with positive references to prevent significant cooler fouling is to use a dedicated fire tube cooler upstream of the dust removal cyclone and to keep the cooler surfaces at high temperature. The coarse solids in the gas will continuously clean the inner pipe wall, i.e. erode the surface to prevent the build-up of deposit layers. The purpose of the catalytic gas conditioning is to convert all the unsaturated hydrocarbons in the clean product gas to useable CO, H2, and methane. The converted compounds comprise the alkenes and alkynes (ethylene and acetylene), as well as remaining traces of aromatic compounds (e.g. benzene, toluene, and naphthalene). Destruction of the alkenes and alkynes, i.e. ethylene and especially acetylene, is necessary to prevent soot formation on, and deactivation of, the downstream typically nickel-based methanation catalyst. Thermal or catalytic reforming options to remove these compounds would result in significant destruction of the desired product methane. Steam is added to the feed gas to ensure a sufficient H/C ratio to prevent (thermodynamic) soot formation.

ECN-E--06-018 13
OLGA tar removal
Methanation
Gas cleaning S & HCl removal
Gas ConditioningCxHy removal
Biomass 15% moisture
SNG on specification
make-up oil liquid tar to gasifier
fresh adsorbent spent adsorbent
steam
CO2
MILENA Gasifier (Indirect, 7 bar)
air
steam flue gas filter ash
flue gas
stripper air loaded air to gasifier
Cyclone dust removal cyclone ash to combustor
Gas Cooler to 375°C
Compression to 30 bar
SNG upgrading CO2 & H2O removal
condensate
In the methanation section the cleaned and conditioned product gas has to be converted into SNG that meets the specifications after downstream water and CO2 removal. For methanation of CO and H2 containing gases, commercial processes and catalysts are available; both Lurgi and Haldor-Topsøe can deliver methanation systems. Typically, these methanation processes are carried out at higher pressures than foreseen in the bio-SNG plant, i.e. 20 to 30 bar compared to 7 bar. These systems are typically also designed with gas recycles or quenches or internally cooled reactors to control the temperatures to prevent thermal degradation of the catalysts. When the methanation is carried out at lower pressures, the adiabatic temperature increase is correspondingly lower. Resultantly, the methanation can be operated adiabatically without gas recycles and in simple vessels without internal cooling. SNG upgrading to grid specifications comprise removal of water and CO2. By cooling the gas to 40°C most of the water is condensed. The remaining water is removed in the CO2 removal step. CO2 has to be removed from the raw SNG to meet the SNG specifications. The final CO2 concentration in the SNG is determined by the specification of the Wobbe Index (LHV) to be 44 MJ/mn
3. A large number processes is available for CO2 removal. Relevant aspects for process selection are the partial pressure of the CO2 and size of the installation. Several alternatives are possible for the scale of a 150 MWth plant. Considering the high partial pressure of CO2 both membranes and physical solvents can be chosen, where membranes are at their maximum scale and physical solvents are at their minimum scale. From the perspective of an outlook to possible future larger commercial bio-SNG production plants, a physical solvent system is most suitable. For the basic design, Selexol was selected.

14 ECN-E--06-018
System assessment of commercial bio-SNG plants The optimum system concept is based on a gasifier that produces a (almost) nitrogen-free syngas (i.e. indirect gasifier) with preferably high amount of methane (i.e. low-temperature gasifier). The Milena gasifier can be operated at indirect gasification conditions and at a temperature of about 850°C producing such a syngas. Due to the (relatively) low temperature the syngas will contain tars as well. These tars can be removed with the OLGA tar removal technology developed by ECN. The tars are recycled to the gasifier in order to increase efficiency, whereas the tar free syngas is cleaned from other contaminants (e.g. sulphur and chlorine). The clean syngas can than be fed to a combined shift and methanation process, converting the syngas into SNG. After methanation, further upgrading (e.g. CO2 and H2O removal) is required in order to comply with the desired SNG specifications. All (main) process steps are schematically presented in the figure below.
indirect gasifier MILENA
OLGA tar reduction
CH4 synthesis
gas upgrading
100% biomass
approx. 70% SNG
approx. 80% product gas
850°C
methanation: 3 H2 + CO CH4 + H2O shift: CO + H2O CO2 + H2
further gas cleaning
tar recycle
As the SNG is injected in the HTL network, compression has to take place somewhere along the production line. This can either be done by (front-end) pressurised gasification or (back-end) syngas compression. In case of syngas compression, the compression will preferably take place after cleaning (i.e. compression of tar free syngas) but before methanation (i.e. smaller methanation and CO2 removal at elevated pressure to allow pressure swing absorption). In both cases the SNG product will become available at the desired 66 bar. The overall SNG yield of integrated systems for SNG production based on either atmospheric or pressurised gasification (7 bar) is almost equal for both cases, i.e. 68.5%. The yield of power however is higher for the 7 bar case than for the atmospheric system (8.0% versus 5.6%) due to the fact that the additional power required in the pressurized system for compressing the gasifier air is not very high (low temperature) and because the additional power output from flue gas expansion. Furthermore, the compression energy of the raw SNG before CO2 removal is avoided in the pressurized system. Taking into consideration a natural gas price of 6 €/GJ, the economic assessment reveals that for both atmospheric and pressurised production systems in a realistic range of 10 to 1000 MWth, bio-SNG is more expensive than natural gas. The necessary support for SNG to be competitive with natural gas vary from over 400 €/t CO2 carbon abatement costs on a small scale (10 MWth) to below 60 €/t CO2 on large scale (1000 MWth). These costs are very high compared to the current trading price of CO2 (EU allowance) of 20-25 €/t CO2. However, current support schemes in Europe for biofuels given subsidies in the order of several hundreds of euros per tonne CO2. The required subsidy for bio-SNG in €ct/kWh of SNG, varying from 9 €ct/kWh on a small scale (10 MWth) and almost 1 €ct/kWh on a large scale (1000 MWth), can de compared with Dutch MEP subsidies for renewable electricity production. Although these MEP subsidies are subject to political choice the current range for electricity from biomass is 6.0-9.7 €ct/kWh, the exact figure depending on the type of biomass used and the size of the installation. These are,

ECN-E--06-018 15
however, subsidies per kWh electrical power and not SNG, but still the required support for SNG produced at medium (100 MWth) or large (1000 MWth) scale does not seem totally unrealistic, hence a subsidy on SNG similar to the MEP subsidy on renewable electricity production might well lead to implementation of SNG production facilities. With such a financial incentive required for SNG this also means that SNG, like renewable electricity, will mainly focus on application within the domestic natural gas market and not the industrial market. Assuming, however, that similar to renewable electricity approximately one third of the domestic consumers would switch from “grey” natural gas to “green” natural gas (i.e. without having to pay more) the potential market for SNG in the Netherlands would be approximately 110 PJ a year. This market might even be bigger considering the fact that also numerous (small) companies are willing to buy renewable electricity, hence SNG as well. Conclusions 1. With the natural gas consumption representing almost 50% of the Dutch (primary) energy
consumption, substituting natural gas by a renewable equivalent is an interesting option to significantly reduce the use of fossil fuels and the accompanying greenhouse gas emissions.
2. Renewable equivalents to natural gas include (upgraded) biogas and landfill gas. Due to the
limited availability of suitable feedstock / fuel however, and the defined ambition to replace a significant part of the natural gas consumption in (near) future, synthetic natural gas (SNG) produced via biomass gasification should be included.
3. Large quantities of SNG will, from metering and regulating as well as trading point of
view, most likely be injected in the High-pressure Transmission Lines (HTL) of the existing natural gas infrastructure.
4. The supplied gas has to meet strict specifications, regarding composition, Wobbe-index,
calorific value, and relative density, in order to be transported, stored or marketed in the Netherlands without causing damage to either transmission system or consumer applications.
5. In order to demonstrate that bio-SNG can comply (at least after blending) with these
specifications, an experimental lab-scale line-up for SNG production from biomass has been successfully developed and implemented.
6. The technical feasibility of the production of SNG from biomass is demonstrated by tests
with integrated biomass gasification, gas cleaning, and methanation experiments. 7. Three functional tests were performed with the final system line up; in the 1st functional
test the gas cleaning was tested for the removal of tar, sulphur and chlorine compounds, the 2nd test was performed to investigate the removal of unsaturated hydrocarbons in the gas conditioning section, and the 3rd test was done with the integrated installation to obtain the performance of the methanation section.
8. The 1st and 3rd functional tests were successful; during the 2nd test the catalyst in the gas
conditioning section lost activity within 15 minutes due to soot formation. In the 3rd functional test, the conditions of the gas conditioning section were changed, which solved the problem of deactivation.
9. The integrated atmospheric gasification installation with atmospheric methanation has run
properly; the impurities like dust, sulphur and chlorine has been removed sufficiently and the gas conditioning section removed the bulk of the unsaturated hydrocarbons.
16 ECN-E--06-018
10. To meet the SNG specification, the system (OLGA and methanation section) must be optimised in tar, H2 and CO removal; there is enough room for optimisation.
11. The optimum SNG system concept is based on a gasifier that produced a (almost) nitrogen-
free gas (i.e. indirect gasifier) with preferably high amount of methane (i.e. low-temperature gasifier).
12. As the SNG is injected in the HTL network, compression has to take place either by (front-
end) pressurised gasification or (back-end) syngas compression; although the overall SNG yield is almost equal for both cases, the additional yield of power is higher in case of pressurised gasification.
13. Although bio-SNG will be more expensive than natural gas now, the necessary support for
future SNG to be competitive with present natural gas might even be below 60 €/t CO2 carbon abatement costs or almost 1 €ct/kWhSNG; a subsidy on SNG similar to the MEP subsidy on renewable electricity production (6.0-9.7 €ct/kWh) might well lead to implementation of SNG production facilities.
14. Assuming similarity between the market for green electricity and green natural gas, and
approximately one third of the domestic consumers would switch from “grey” natural gas to “green” natural gas (i.e. without having to pay more). This corresponds to approximately 110 PJ a year or almost 7.5% of the annual natural gas consumption in the Netherlands.
Continuation In the Dutch energy research strategy EOS long-term biomass gasification program a specific target on SNG production is listed. SNG is specifically for the Netherlands a sensible option to sustain part of both the heat and power production as well as of the transportation fuels because of the existing infrastructure and harbours. The Proof-of-Principle phase has successfully finished and a pilot plant of 800 kWth has been developed and the engineering for such a pilot is almost finished, and a go-no-go decision will be made in 2006, mainly depending on the availability for investment. The production of SNG from biomass is expected to become much more efficient compared to options that might be realised on short term with “available” technologies. For high-efficient SNG-systems to become available, R&D should focus on pressurised indirect gasification, self-gasification, high-temperature tar reduction, OLGA, dry sulphur and chlorine removal, and SNG synthesis. The main activities with regards to this SNG related R&D comprise: • Develop MILENA indirect gasification technology (i.e. perform tests with lab-scale
MILENA to determine “window of operation”, supporting tests with cold-flow facility, construct and test 800 kWth pilot-scale MILENA indirect gasifier with connections with existing gas cooler and cleaning units, and perform study on the effects of increasing pressure of MILENA indirect gasification technology.
• Prepare 10 MWth MILENA demonstration plant together with industry and ultimately realise large-scale pressurised plants with MILENA gasifier for high-efficient SNG production.
• Develop filter/OLGA for operation in pressurised system with indirect gasifier for future biomass-to-SNG systems.
• Develop SNG catalytic reactor concepts including material selection, operating conditions, etc. fully integrated with indirect gasifier and (dry) gas cleaning.
• Develop pressurised self-gasification technology for high-efficient biomass-to-SNG systems.
• Develop high-temperature tar reduction (catalytic, partial oxidation, corona) for future biomass-to-SNG systems, avoiding tar-related cooler problems.

ECN-E--06-018 17
1. Introduction
1.1 Role of natural gas In the Netherlands annually almost 3,300 PJ of primary energy is consumed for the production of electricity, heat, transportation fuels, and chemicals and other products. The distribution and utilisation of the different primary energy sources is shown in table 1.1 [1]. Natural gas consumption represents 46% of the Dutch (primary) energy consumption. The main applications of natural gas are chemistry (7%), power production (23%), and – by far the largest application – the production of heat (70%), of which 40% is consumed by households (more than 400 PJ). Outside industry essentially all heat is produced from natural gas (i.e. 96%).
Table 1.1 Primary energy consumption in the Netherlands
Consumption [PJ] Coal Oil Natural gas Electricity Other Total
Electricity 200 10 350 70 1 230 860
Transport (fuels) 0 480 0 10 0 490 Products & Chemicals 70 370 100 30 0 570 Heat 40 240 1,060 0 20 1,360
Total 310 1,100 1,510 110 250 3,280 In the World Energy Outlook 2004 [2] of the IEA it is predicted that the consumption of natural gas will increase (in absolute numbers) over any other energy source. The global consumption of natural gas will be doubled in 2030. In the period till 2020, the European demand for natural gas will increase with annually 2-3%, as a result of changing feedstocks in the electricity sector. Major drivers for the increases utilisation of natural gas for energy production are the climate change issue, as well as economic considerations. Gas-fired power stations are cheaper than coal-fired plants. Within the Kyoto protocol the EU countries are committed to reduce the emission of green house gases (with CO2 as the main component). Natural gas has by far the smallest impact on the environment compared to coal or oil, e.g. natural gas yields half of the amount of CO2 per produced kWh of coal and even less for other green house gases. Another reason for increased popularity of natural gas is the policy of many countries to decrease the dependency on crude oil import by substituting 10% of the crude oil import by natural gas. The global reserves are large enough to accommodate the growing demand in natural gas. Currently, the EU covers approximately 60% of its own consumption, mainly from the production in the Netherlands and the United Kingdom (approximately 50%). Although the dependency on fuel import in the EU is considered as a problem, the situation for natural gas is much more positive compared to coal and oil. The production of natural gas in the Netherlands, however, has reached its maximum and it will gradually decrease. Due to the increasing demand for natural gas and the decreasing resources, the import dependency in the EU will increase to approximately 70% in 2020. Increasing amounts of gas will have to be imported from outside the EU, i.e. Russia, Africa and the Middle East. Furthermore, a part of the required gas will be imported, in liquid form (i.e. Liquefied Natural Gas or LNG), from more distant locations. Both higher costs and risks are associated with these developments and the dependency on politically less stable countries. The latter was clearly demonstrated early 2006 when Russia decreased the gas delivery to the Ukraine. 1 Electricity from electricity concerns import.

18 ECN-E--06-018
1.2 SNG ambitions and implementation The substitution of natural gas by a renewable equivalent is an interesting option to reduce the use of fossil fuels and the accompanying greenhouse gas emissions, as well as from the point of view of security of supply. The renewable alternative for natural gas is the so-called green natural gas, i.e. gaseous energy carriers produced from biomass comprising both biogas and Synthetic Natural Gas (SNG). For definitions of the gases see table 1.2. Via this route can be benefited from all the advantages of natural gas, like the existing dense infrastructure, trade and supply network, and natural gas applications.
Table 1.2 Definition of gases
Type of gas Description
Natural gas - produced from gas fields; contains mainly CH4 - composition variable, depending on gas field
Biogas - produced by digestion, contains mainly CH4 and CO2
Landfill gas - product of landfills, composition similar to biogas
SNG - “Synthetic Natural Gas”, contains mainly CH4 - produced via gasification and methanation - main source: coal (or biomass)
Bio-SNG - SNG from biomass
“Green natural gas” - general term for both bio-SNG and upgraded biogas or landfill gas - suitable and on specification for utilisation as natural gas substitute
Syngas - synthesis gas: H2 and CO (and CO2 and H2O) from fossil origin - produced via gasification or reforming of coal, oil residues, or natural gas
Biosyngas - biomass origin, chemically similar to syngas - produced via high temperature (>1200°C) or catalytic gasification
Product gas - produced via medium temperature (<1000°C) gasification - contains H2, CO, CH4, CxHy incl. tar (and CO2 and H2O)
The Netherlands has an excellent position to play an important role in the implementation of Green Natural Gas in Europe because of its logistic infrastructure (harbours for biomass import), biomass and natural gas knowledge positions, already widespread application of biomass in the power sector, and the most dense natural gas network in the world. Within the Energy Transition activity of the Dutch Ministry of Economic Affairs, five Platforms are formed that concentrate on different sectors of the energy infrastructure. One of the transition platforms is dedicated to new gas options. This transition “Platform New Gas” has defined the ambition to replace 20% of the natural gas by green gas by 2030 [3]. A substitution target of 50% has been suggested for 2050. With a current annual (2004) consumption of natural gas in the Netherlands being approximately 1,500 PJ (which corresponds to 50 billion mn
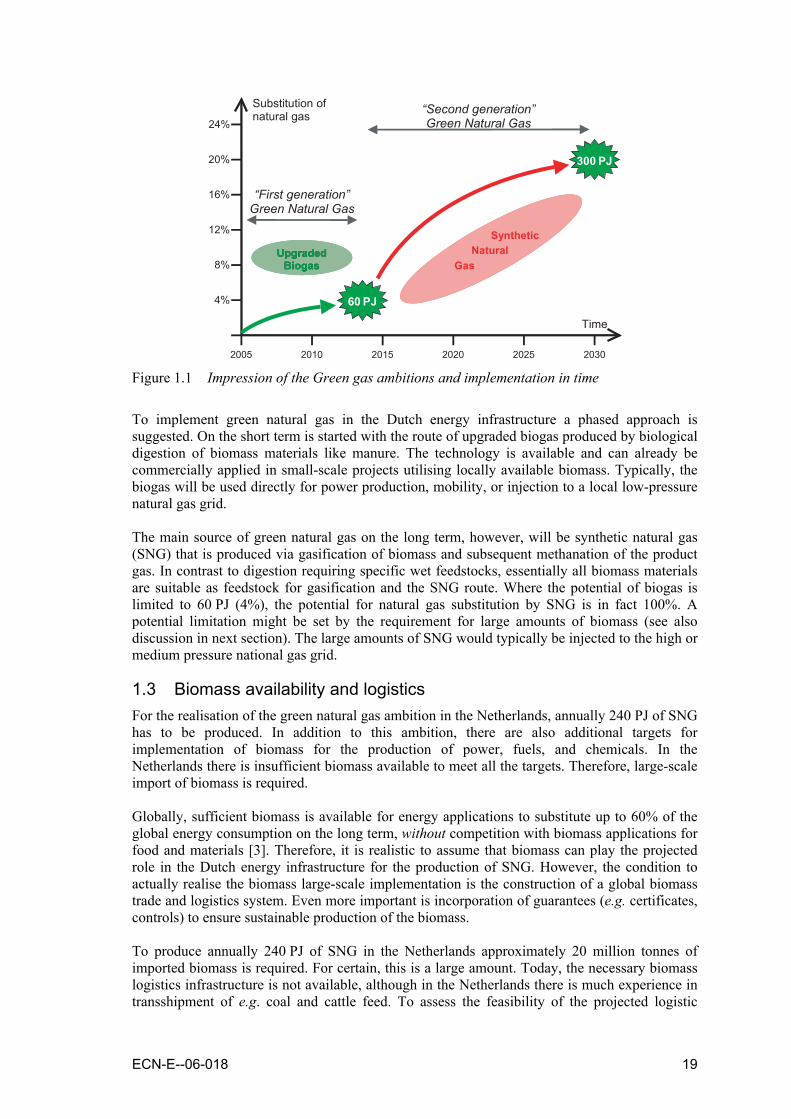
3), cf. table 1.1, a 20% substitution would hence correspond to 300 PJ. The potential of (upgraded) biogas and landfill gas in the Netherlands is maximum 60 PJ (i.e. 4% substitution) due to limited availability of suitable digestible feedstock materials. To reach the ambition of 20% substitution in 2030 a SNG production capacity is required of at least 240 PJ. Whereas digestion is an available and commercially proven technology with widespread implementation on farm scale, the technology for SNG production, however, is still under development and realisation of the first semi-commercial plant is not expected before 2010. In figure 1.1 the green gas ambitions and implementation-in-time are schematically shown with both contributions of biogas and SNG. Due to the different time scales and complexity of the technologies, biogas can be considered as a “1st Generation” green natural gas, while SNG is the “2nd Generation” gas with an implementation in a later phase, but with a much higher potential.
ECN-E--06-018 19
“First generation” Green Natural Gas
“Second generation” Green Natural Gas
4%
8%
12%
16%
20%
24%
2005 2010 2015 2020 2025 2030
300 PJ
60 PJ
Upgraded Biogas
Upgraded Biogas
Synthetic Natural Gas
Time
Substitution of natural gas
Figure 1.1 Impression of the Green gas ambitions and implementation in time
To implement green natural gas in the Dutch energy infrastructure a phased approach is suggested. On the short term is started with the route of upgraded biogas produced by biological digestion of biomass materials like manure. The technology is available and can already be commercially applied in small-scale projects utilising locally available biomass. Typically, the biogas will be used directly for power production, mobility, or injection to a local low-pressure natural gas grid. The main source of green natural gas on the long term, however, will be synthetic natural gas (SNG) that is produced via gasification of biomass and subsequent methanation of the product gas. In contrast to digestion requiring specific wet feedstocks, essentially all biomass materials are suitable as feedstock for gasification and the SNG route. Where the potential of biogas is limited to 60 PJ (4%), the potential for natural gas substitution by SNG is in fact 100%. A potential limitation might be set by the requirement for large amounts of biomass (see also discussion in next section). The large amounts of SNG would typically be injected to the high or medium pressure national gas grid.
1.3 Biomass availability and logistics For the realisation of the green natural gas ambition in the Netherlands, annually 240 PJ of SNG has to be produced. In addition to this ambition, there are also additional targets for implementation of biomass for the production of power, fuels, and chemicals. In the Netherlands there is insufficient biomass available to meet all the targets. Therefore, large-scale import of biomass is required. Globally, sufficient biomass is available for energy applications to substitute up to 60% of the global energy consumption on the long term, without competition with biomass applications for food and materials [3]. Therefore, it is realistic to assume that biomass can play the projected role in the Dutch energy infrastructure for the production of SNG. However, the condition to actually realise the biomass large-scale implementation is the construction of a global biomass trade and logistics system. Even more important is incorporation of guarantees (e.g. certificates, controls) to ensure sustainable production of the biomass. To produce annually 240 PJ of SNG in the Netherlands approximately 20 million tonnes of imported biomass is required. For certain, this is a large amount. Today, the necessary biomass logistics infrastructure is not available, although in the Netherlands there is much experience in transshipment of e.g. coal and cattle feed. To assess the feasibility of the projected logistic
20 ECN-E--06-018
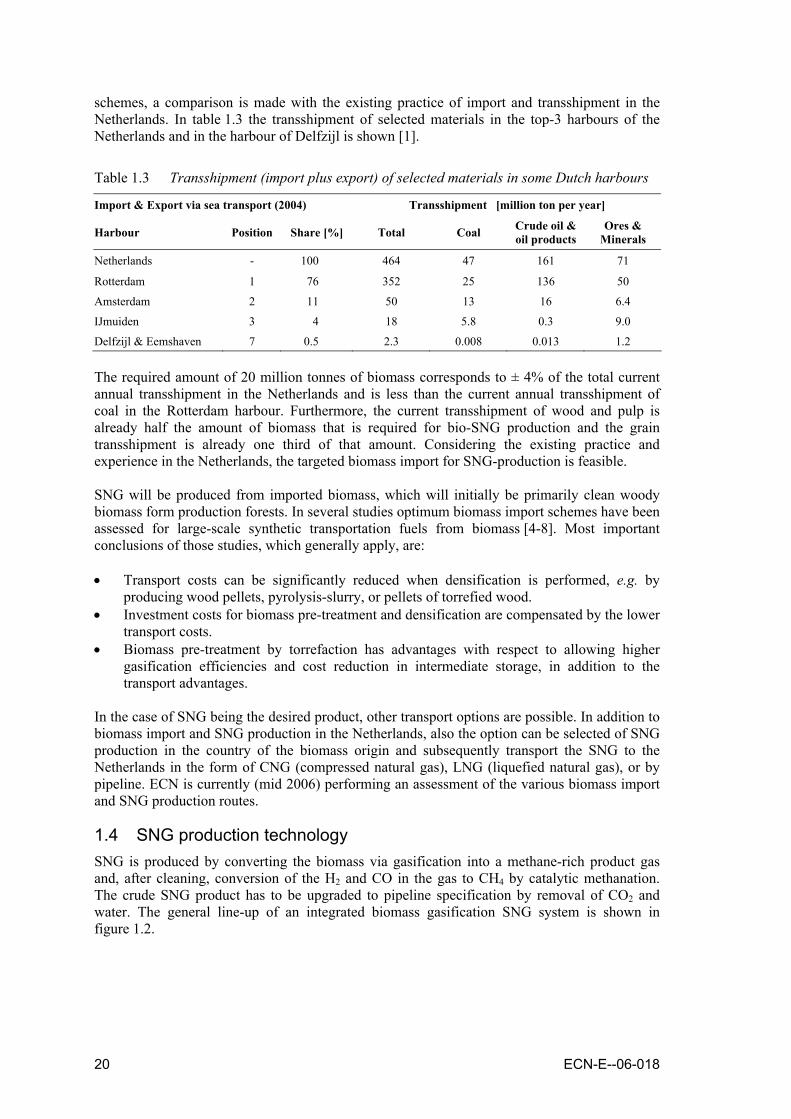
schemes, a comparison is made with the existing practice of import and transshipment in the Netherlands. In table 1.3 the transshipment of selected materials in the top-3 harbours of the Netherlands and in the harbour of Delfzijl is shown [1].
Table 1.3 Transshipment (import plus export) of selected materials in some Dutch harbours
Import & Export via sea transport (2004) Transshipment [million ton per year]
Harbour Position Share [%] Total Coal Crude oil & oil products
Ores & Minerals
Netherlands - 100 464 47 161 71
Rotterdam 1 76 352 25 136 50
Amsterdam 2 11 50 13 16 6.4
IJmuiden 3 4 18 5.8 0.3 9.0
Delfzijl & Eemshaven 7 0.5 2.3 0.008 0.013 1.2 The required amount of 20 million tonnes of biomass corresponds to ± 4% of the total current annual transshipment in the Netherlands and is less than the current annual transshipment of coal in the Rotterdam harbour. Furthermore, the current transshipment of wood and pulp is already half the amount of biomass that is required for bio-SNG production and the grain transshipment is already one third of that amount. Considering the existing practice and experience in the Netherlands, the targeted biomass import for SNG-production is feasible. SNG will be produced from imported biomass, which will initially be primarily clean woody biomass form production forests. In several studies optimum biomass import schemes have been assessed for large-scale synthetic transportation fuels from biomass [4-8]. Most important conclusions of those studies, which generally apply, are: • Transport costs can be significantly reduced when densification is performed, e.g. by
producing wood pellets, pyrolysis-slurry, or pellets of torrefied wood. • Investment costs for biomass pre-treatment and densification are compensated by the lower
transport costs. • Biomass pre-treatment by torrefaction has advantages with respect to allowing higher
gasification efficiencies and cost reduction in intermediate storage, in addition to the transport advantages.
In the case of SNG being the desired product, other transport options are possible. In addition to biomass import and SNG production in the Netherlands, also the option can be selected of SNG production in the country of the biomass origin and subsequently transport the SNG to the Netherlands in the form of CNG (compressed natural gas), LNG (liquefied natural gas), or by pipeline. ECN is currently (mid 2006) performing an assessment of the various biomass import and SNG production routes.
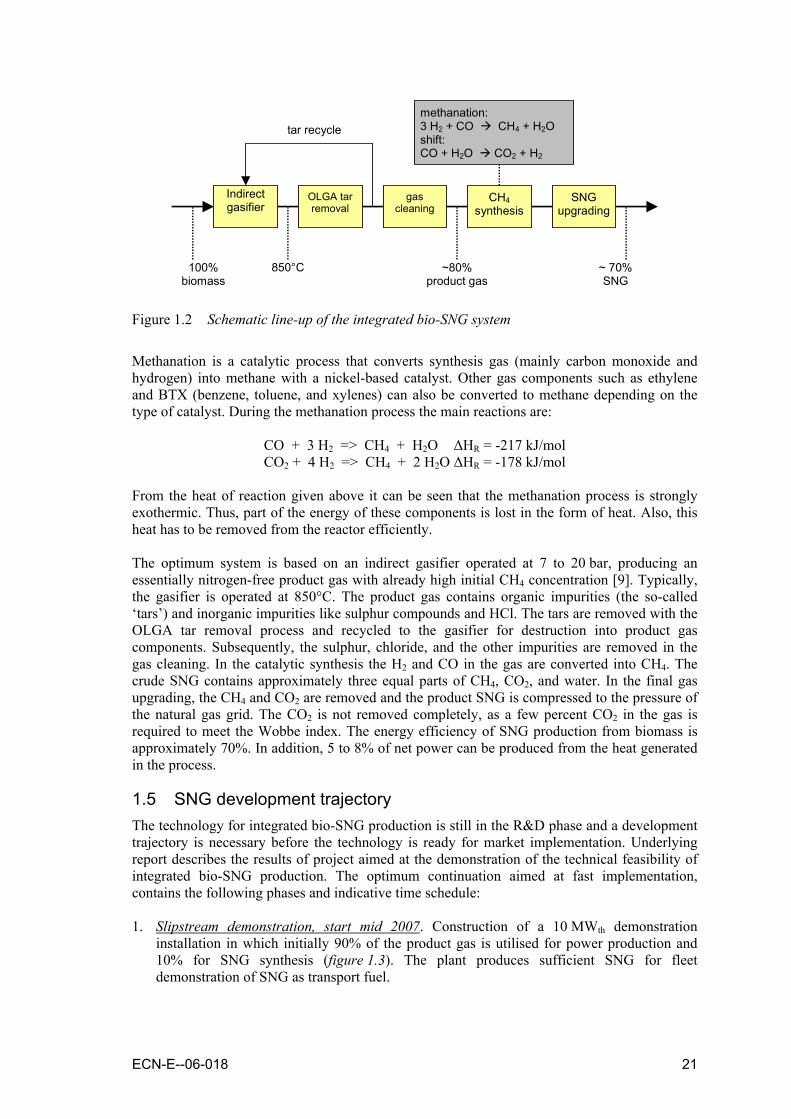
1.4 SNG production technology SNG is produced by converting the biomass via gasification into a methane-rich product gas and, after cleaning, conversion of the H2 and CO in the gas to CH4 by catalytic methanation. The crude SNG product has to be upgraded to pipeline specification by removal of CO2 and water. The general line-up of an integrated biomass gasification SNG system is shown in figure 1.2.
ECN-E--06-018 21
Indirect gasifier
OLGA tar removal
CH4 synthesis
SNG upgrading
100% biomass
~ 70% SNG
~80% product gas
850°C
methanation: 3 H2 + CO CH4 + H2O shift: CO + H2O CO2 + H2
gas cleaning
tar recycle
Figure 1.2 Schematic line-up of the integrated bio-SNG system
Methanation is a catalytic process that converts synthesis gas (mainly carbon monoxide and hydrogen) into methane with a nickel-based catalyst. Other gas components such as ethylene and BTX (benzene, toluene, and xylenes) can also be converted to methane depending on the type of catalyst. During the methanation process the main reactions are:
CO + 3 H2 => CH4 + H2O ΔHR = -217 kJ/mol CO2 + 4 H2 => CH4 + 2 H2O ΔHR = -178 kJ/mol
From the heat of reaction given above it can be seen that the methanation process is strongly exothermic. Thus, part of the energy of these components is lost in the form of heat. Also, this heat has to be removed from the reactor efficiently. The optimum system is based on an indirect gasifier operated at 7 to 20 bar, producing an essentially nitrogen-free product gas with already high initial CH4 concentration [9]. Typically, the gasifier is operated at 850°C. The product gas contains organic impurities (the so-called ‘tars’) and inorganic impurities like sulphur compounds and HCl. The tars are removed with the OLGA tar removal process and recycled to the gasifier for destruction into product gas components. Subsequently, the sulphur, chloride, and the other impurities are removed in the gas cleaning. In the catalytic synthesis the H2 and CO in the gas are converted into CH4. The crude SNG contains approximately three equal parts of CH4, CO2, and water. In the final gas upgrading, the CH4 and CO2 are removed and the product SNG is compressed to the pressure of the natural gas grid. The CO2 is not removed completely, as a few percent CO2 in the gas is required to meet the Wobbe index. The energy efficiency of SNG production from biomass is approximately 70%. In addition, 5 to 8% of net power can be produced from the heat generated in the process.
1.5 SNG development trajectory The technology for integrated bio-SNG production is still in the R&D phase and a development trajectory is necessary before the technology is ready for market implementation. Underlying report describes the results of project aimed at the demonstration of the technical feasibility of integrated bio-SNG production. The optimum continuation aimed at fast implementation, contains the following phases and indicative time schedule: 1. Slipstream demonstration, start mid 2007. Construction of a 10 MWth demonstration
installation in which initially 90% of the product gas is utilised for power production and 10% for SNG synthesis (figure 1.3). The plant produces sufficient SNG for fleet demonstration of SNG as transport fuel.

22 ECN-E--06-018
2. Pilot plant, start mid 2007. Construction of an integrated bio-SNG pilot plant at ECN and the performance of a test programme to support the slipstream demonstration (Phase 1) and design of a full-stream demonstration (Phase 3).
3. Full stream demonstration, start around 2009. The complete gas stream of the existing 10 MWth plant is utilised for SNG production.
4. Large-scale demonstration, start around 2012. Construction of up-scaled unit of 50 to 200 MWth capacity.
5. Commercial implementation, start around 2015. Construction of large-scale commercial installations of 500 to 1,000 MWth capacity.
biomass
green electricity
& heat
Gasification to product gas product gas firing on boiler
SNG on grid
specification
product gas cleaning methanation & upgrading Figure 1.3 Schematic presentation of the installation for phase 1 slipstream demonstration
1.6 This report This report describes the results of a project aimed at the demonstration of the technical feasibility of integrated bio-SNG production. These results form the basis for the phased SNG development and implementation trajectory as described in the previous section. Furthermore, it will illustrate the potential of SNG production being economic competitive with renewable alternatives. In this introduction chapter the potential of SNG in the Dutch energy infrastructure is discussed. In Chapter 2 the existing natural gas infrastructure is presented and the possibilities and limitations for SNG injection are assessed. Chapter 3 addresses the development of the experimental line-up including the specific problems that were encountered and overcome. The integrated test is discussed in which technical feasibility of the bio-SNG system is proven. Chapter 4 is dedicated to the basic design for a bio-SNG demonstration plant as projected in Phase 4 of the implementation trajectory. In Chapter 5 the system assessment is described including the evaluation of the economic potential of bio-SNG. Conclusions and recommendations are discussed in Chapter 6.

ECN-E--06-018 23
2. SNG in existing natural gas infrastructure
In the Netherlands the transmission system operator Gas Transport Services B.V. (GTS) from July 2004 is responsible for operating the transport system [10]. The previous operator Gasunie [11] passed legal tasks of the national transmission system operator to GTS, however retained ownership of the main transport network. The Gasunie business unit Technology & Assets (GTA) will perform works on the system, is responsible for the technical maintenance including construction. Gasunie also offers engineering and consultancy services (Gasunie Engineering, GE), takes part in research and development activities (Gasunie Research, GR). GasTerra buys, sells and exports natural gas. Gasunie is since July 2005 fully state owned, GasTerra is a joint venture with state, Shell and Exxon. The main supplier is NAM (Nederlandse Aardolie Maatschappij), the company that operates the well clusters on the Groningen field. Additionally, a small volume of gas is imported from Norway and Russia.
2.1 Main infrastructure Natural gas is supplied by the producers, via feeding stations to GTS, at a pressure of around 66 bar. Sand, water, condensate and other contaminants are removed from the gas at the wellhead. GTS transports the gas to the gas customers, viz., the Dutch gas supply companies, large industrial consumers, and as export to some European countries (Germany, Belgium, France, Italy, Switzerland and England). The main transmission system comprises approximately 11,000 km of natural gas pipelines at different pressures plus plants and equipment for compressing, blending, metering, and regulating the different gas flows (figure 2.1 [12]).
Infrastructure
Diameter
I II
V
III
VI
IV
VII
VIII
XI
1
2
3 4
5
6
7
8
12
13
A
B
C D
E
F
9
11
10
Figure 2.1 Blending stations and entry points of the Dutch gas infrastructure

24 ECN-E--06-018
High-pressure Transmission Lines The High-pressure Transmission Lines (HTL) network has a length of 5,000 km. It carries gas at pressures in the range 43 to 66 bar, and occasionally as high as 80 bar. The gas enters the system at either producer's gas conditioning stations on the gas fields, or at import stations on the border. Nine compressor stations maintain the pipeline pressure at every 80-100 km in the HTL network. It is occasionally necessary to compress gases prior to blending, or to bring them up to transmission pressure. HTL end points are the metering and regulating stations (M&R), which form the link between the HTL and the Regional Transmission Lines (RTL) networks, and the export stations. From M&R stations on no blending facilities are available, therefore the HTL network from metering and regulating point of view seems to be more attractive for SNG injection than the RTL network. Furthermore, from gas trading point of view, injection in the HTL network also seems more attractive (as discussed in Section 2.2). Regional Transmission Lines The RTL network has a total length of 6,000 km. The operating pressure generally ranges from 16 to 40 bar. The RTL network is supplied from the HTL network via the M&R stations. At M&R stations, the pressure in the HTL system is reduced to an operating pressure of not more than 40 bar. Another function performed at the M&R stations is to give the gas its characteristic smell. Natural gas as it comes out of the ground is virtually odour-free. Odourisation alerts people to leaks. The smell of gas is actually the chemical tetrahydrothiophene (THT). The odourisation process is mainly for the benefit of the domestic consumer. Heavier business and institutional users will often have their own gas detection systems. M&R stations also supply measurement data relating to pressure and flow, which are vital for the control of the gas flows in the network. Transfer stations The regional transmission lines carry gas to the transfer stations, which are the feed points for the gas main pipes of the local energy utilities and industries, and the end of the line as far as GTS is concerned. There are a total of about 1,100 transfer stations, with two functions; reducing the pipeline pressure and metering the volume of gas supplied. The gas networks of the gas supply companies operate at pressures of 8 bar or lower. As the pressure drop of over 30 bar (RTL stations), and as much as 60 bar (HTL stations) is accompanied by a substantial drop in temperature the gas is preheated. By the time the gas enters domestic gas pipes, the relative pressure is down to 25 millibar, the standard appliance pressure in the Netherlands. Export stations Roughly half of GasTerra sales are destined for export. Like transfer stations, export stations mark the end of the line as far as GTS is concerned. There are 17 export stations, supplying gas to Belgium, France, Germany, Italy, England and Switzerland. Export gas quality ranges from straight Groningen to high calorific value through enriched Groningen gas. Local gas distribution grid In contrast with the main transmission system, owned by the Gasunie and operated by GTS, the local network (which was laid to link individual consumers to the main network) is owned mainly by local distribution companies. The local companies acquire the gas on spec through the main transmission system from the gas seller, which is in most cases despite the liberalized market still GasTerra. The grid supervisor DTE regulates both the main transmission system and the local grids. Currently the local gas distribution grids are owned by fifteen companies, of which Continuon, ENECO and Essent2 cover the main part.
2 On 29th of June 2004 ENECO, Essent and NUON, together with Gasunie and NAM, signed a manifest, in which they announce their plans for sustainability of gas usage in the Netherlands. These plans focus on the increase in efficiency of gas supply and utilization, the utilization of natural gas as transportation fuel, the development of "virtual power plants" and experimental applications of hydrogen and "green gas" (or SNG).

ECN-E--06-018 25
2.2 Gas trading system Until 31 December 2001 Gasunie employed a transport system in which the tariff was determined on the basis of the distance between the entry point and the exit point, the Commodity Service System (CSS). In consequence of a binding instruction from the DTE3, Gas Transport Services promised that it would change to an entry/exit system. The entry-exit system is such that transport through the pipeline system is not directly related to distance. If a shipper wishes to have gas transported through the Dutch system he must contract for the entry and exit capacity: in this way the right to be able to use a specific capacity at a contracted point is bought. The gas transport service amounts to the following: an agreed amount of gas at the entry point is provided according to agreed quality specifications, and then at the same moment GTS delivers gas at the contracted exit point, also being the agreed amount and according to agreed quality specifications [10]. In order to maintain the integrity of the pipeline system, it must be ensured that the entry and exit capacities are sufficiently balanced. With regards to L-gas this results in the commitment of a shipper to supply the same amount of L-gas at the entry points as claimed at the exit points on a calorific basis. The balance between entry and exit capacities also applies to H-gas, although the shipper then is also allowed to supply more H-gas then actually claimed, as the H-gas can always be converted to L-gas quality by adding nitrogen to the gas. Due to the nature of the gas trading system the preferred location of SNG injection in the grid, beside the potential advantage of metering and regulating point of view (discussed in section 2.1), is again the HTL network as this network is fed with gas from numerous fields, which already might enable a shipper to balance his entry and exit capacity more easily in case of temporarily lack of SNG production (e.g. disruption of the gasification process). In case of SNG injection in the RTL network this balancing might be more difficult. The advantages of metering and regulating, trading as well as economy of scale (i.e. injection in the HTL network allows large scale SNG production facilities) cause the disadvantage of SNG injection in the HTL grid, i.e. the gas quality commitment to multiple consumers, to be of less concern as long as SNG is produced at a constant specification, suitable for grid injection. The projected scale of a SNG production facility will preferably be consistent with current gas fields, hence approximately 500-1000 MWth (synthetic) natural gas [13].
2.3 SNG specifications for grid injection The supplied gas has to meet strict specifications, regarding composition, Wobbe-index, calorific value, and relative density. In order to produce the desired qualities of natural gas, gas streams from different sources are mixed at the various blending stations of the Dutch natural gas infrastructure. Not all natural gas is the same as Groningen gas (G-gas). In the North Sea large amounts of high-calorific gas are released during the extraction of mineral oil, as associated gas, with high concentration of high hydrocarbons. Also many of the small fields contain gas of high calorific value (H-gas), while others contain gas of low calorific value (L-gas), rich in carbon dioxide [14]. Since the gas appliances of nearly all Dutch consumers at the time when the small fields came on stream were designed for G-gas, there was not a ready market for H-gas and L-gas as such. To serve large industrial users, whose installations could be converted to H-gas, an extra system of main transmission pipelines was built. H-gas and L-gas were mixed to produce a gas of Groningen quality, which could be introduced into the main transmission system for G-gas. Furthermore H-gas was diluted with nitrogen to achieve Groningen quality before introduction into the G-gas pipelines4. As SNG will (mainly) be introduced as a renewable natural gas for domestic consumers it’s specifications should match with those of G-gas.
3 Dutch abbreviation of "Dienst uitvoering en Toezicht Energie", the office of energy regulation. 4 Groningen gas itself contains no less then 14 vol.% nitrogen.

26 ECN-E--06-018
Based on the effects of various components, combustion and transportation behaviour, as well as health issues GTS has specified criteria [13] for SNG in such a way that the renewable or “green” gas can be transported, stored or marketed in the Netherlands without incurring additional costs for quality adjustment, hence is of a quality that will not cause damage to either transmission system or consumer applications. GTS also took into account components that according to ECN might be present in the SNG and formulated the specifications as presented in table 2.1. In order to be transported through the existing gas grid and utilised in existing natural gas fired apparatuses the SNG should (at least after blending) have a Wobbe-index that is conform the Wobbe-index of natural gas.
Table 2.1 Green gas specifications
Component Gross Calorific Value 31.6 – 38.7 MJ/mn³ Wobbe-index 43.4 – 44.4 MJ/mn³ Maximum liquid hydrocarbons 5 mg/mn³ below –3°C@any P Solid hydrocarbons Technically free Aromatic hydrocarbons 0.1 (or even 0.025) mol.% Water dew point -8 °C@70bar Total sulphur content < 20 mg/mn³ H2S + COS < 5 mg/mn³ Sulphur content caused by alkylthiols (mercaptans) < 6 mg/mn³
CO2 < 3 mol.% O2 < 0.0005 (or even nil) mol.% Hg < 0.015 mg/mn³ H2 The gas shall not contain other elements or impurities (such as, but not limited CO to, methanol, gas and odorants) in such extent that the gas entering GTS’s. Cl facilities at the delivery point cannot be transported, stored or marketed in the F Netherlands without incurring additional costs for quality adjustment These specifications, with regards to some specific components, are still vague. Gasunie, however, is planning a European research work that will focus on detailed specifications of biogas within both the Dutch and the European natural gas grid. SNG, as a biogas, will form a part of this specific study. This European study will also reveal differences in specifications, depending on where SNG will be injected in the grid. With regards to the specifications presented in table 2.1, the specification for, e.g., CO2 in G-gas depends on the area where the gas is distributed: in the western part of the Netherlands it might even be 8 mol%. As the distributed gas might end up in both parts the gas should (at least after blending) be able to comply with both specifications.
2.4 The European natural gas infrastructure The European gas market is being supplied by a series of different gas sources. On the European market, two main gas categories are supplied i.e. the low calorific (Slochteren) and the high calorific gas categories or, more formally, the group L and the group H of the second family of gases which are described under the European standard 437 [15]. Where H gas is common throughout Europe, L gas is distributed in only four countries: the Netherlands, France, Belgium and a small area in Germany. In these countries L gas and H gas are distributed in separate networks. In France, Belgium and Germany the L network is a regional network. In the Netherlands, the L network serves domestic, commercial and small industrial customers while H gas is distributed to larger industrial customers [16]. Within each main gas category, the differences in gas quality specifications can lead to restrictions in interoperability. The gas specifications can be divided in three categories: (1) the combustion properties, (2) Gross Calorific Value (GCV) and (3) additional components. Especially with regards to combustion properties and gross calorific value blending of different gas streams might lighten the regulation of the gas composition in order to comply with the natural gas specifications [17].
ECN-E--06-018 27
3. Development of experimental line-up
3.1 General concept Starting point in the development of the technology line-up for an integrated bio-SNG system was the lab-scale system developed and demonstrated for Fischer-Tropsch synthesis from biomass gasification gas. This system is shown in figure 3.1 and discussed in reference [18]. Biomass is gasified and the raw product gas passes a high-temperature gas filter operated at 400°C to remove essentially all the solids. All the tars and a maximum amount of the BTX are removed in the OLGA unit. The gas leaving OLGA at a temperature of 60-100°C is further cooled and cleaned from NH3, HCl, and other inorganic impurities in a water scrubber at room temperature. Water is condensed from the clean gas and subsequently the gas is compressed to the desired pressure (30 to 60 bar). The compressed gases are passed through a ZnO filter to remove the H2S and an active-carbon guard bed to remove all remaining trace impurities.
Biomass
Solids Tars NH3 / HCl
SNG
Water
Hot-gas Filter
OLGA Water scrubber
Compressor
Gasifier SNG reactor
Guard beds
Condenser
Figure 3.1 Simplified system line-up of pressurised integrated biomass gasification SNG
synthesis system
Characteristic of this line-up is the atmospheric gasification in combination with the pressurised (30 to 60 bar) methanation. To allow intermediate compression, the product gas needs to be free of condensable compounds like residual tars and especially water. After compression the gas is almost completely dry, whereas in the methanation steam needs to be added to prevent coking and soot formation (see below). The requirement for the addition of significant amounts of steam might be a serious efficiency loss, especially when low-value residual heat (~200°C) is missing. The overall system efficiency could be increased when water condensation (both in the water scrubber as well as in the condenser) could be avoided therewith decreasing the steam demand for the methanation. Therefore, an alternative plant line-up was developed within the project as shown in figure 3.2. Characteristic of this line-up is the performance of the gasification and methanation at the same pressure level (atmospheric in the lab-scale line-up). Water is condensed after the methanation and the product SNG is compressed to the desired pressure. Furthermore, gas cleaning is performed with adsorbent materials and not with a water-based wash process (i.e. a scrubber). Consequently, a new gas cleaning had to be designed and the methanation reactor had to be designed for atmospheric instead of pressurised operation.

28 ECN-E--06-018
Biomass
Solids Tars
SNG
Hot-gas Filter
OLGA Compressor Gasifier SNG reactor
Absorbents Condenser
Figure 3.2 Simplified system line-up of integrated bio-SNG synthesis system without
intermediate water condensation and pressurisation
In the project both line-ups were built and demonstrated, however, the technology development was focussed on the line-up without intermediate water condensation and pressurisation.
3.2 Gasification technology
3.2.1 Technology selection In an optimum bio-SNG system already a high concentration of methane is produced in the gasification step. Different biomass gasification technologies are available. These can be divided into two categories: high-temperature and low-temperature gasification. High-temperature gasification (typically above 1200°C) results in a gas, which merely contains H2 and CO as combustible components. At low-temperature however (typically below 1000°C), also hydrocarbons are present in the gas. A circulating fluidised bed (CFB) gasifier operated on biomass operated at 900°C typically produces a gas containing 50% hydrocarbons (mainly methane, ethylene, and benzene) on energy basis. A high initial yield of CH4 (“instant SNG”) is attractive, since the alternative conversion of H2 and CO to CH4 (methanation) involves approximately 20% efficiency loss (heat production). figure 3.3 schematically shows possible cases for overall biomass-to-SNG processes with typical efficiencies for three different gasification technologies: high-temperature entrained flow (EF, typically 1400°C), circulating fluidised bed (CFB, typically 900°C), and indirect or allothermal gasifier. The envisaged high overall efficiency of biomass to SNG of the latter option has been the reason for ECN to start the development of an indirect gasification technology, called MILENA. Indirect (or allothermal) gasification is characterized by the separation of the processes of heat production and heat consumption. It therefore generally consists of two reactors, connected by an energy flow. The biomass is gasified in the first reactor and the remaining solid residue (char) is combusted in the second reactor to produce the heat for the first process. Hot sand is circulated to transport the heat from the combustor to the gasifier. These Indirect gasifiers theoretically are operated at an equilibrium based on the temperature dependence of the char yield in the gasifier. This means that at a low temperature, much char is remaining from the gasifier. Since this char is combusted to produce the heat, the temperature will rise until char yield matches the energy demand of the gasification. Examples of this process are the FERCO/SilvaGas-process developed by Battelle and the FICFB-process developed by the University of Vienna. An overview is given in reference [19].

ECN-E--06-018 29
gasifier
wood
“instant SNG”
H2, CO CH4 synthesis80% efficiency
SNG
gas
EF gasifier
O2-blown*
100%
75% CH4 synthesis
60%
0% 60%
75%
CFB gasifier
O2-blown*
Indirect gasifier
air-blown
100%
37% 30%
38% 68%
75%
100%
35% 28%
45% 73%
80%
CH4 synthesis
CH4 synthesis
general process
three cases
CH4
* O2-production requires considerable amounts of electricity (not included in values above )
Figure 3.3 SNG production efficiencies for different gasification technologies
Indirect gasifiers generally produce two gases: a medium calorific product gas with little or no nitrogen and a flue gas. The production of an N2-free gas without the need of air-separation is one of the advantages over direct gasification processes like a CFB. Another important advantage is the complete conversion. The ashes that remain contain little or no residual carbon since this is the product of a combustion process. Indirect gasifiers also have the option to deal with residues from e.g. gas cleaning such as tars. These can be added to the combustor and contribute to the overall efficiency rather than impose a waste problem.
3.2.2 MILENA technology MILENA is the name of a technology developed by ECN to fulfil the demands of a biomass-to-SNG process with a high efficiency. MILENA a is an indirect gasifier operating similarly to the FERCO/Silvagas-concept: biomass is heated and gasified in a circulating flow of hot sand and the less reactive remaining solid char is directed to the combustor where the circulating sand is heated. However, the MILENA design is different, i.e. it has an integrated design, is mechanical more robust, easier scalable, and more suitable for pressurized operation. The gasification takes place in a riser, whereas a bubbling fluidised bed serves as combustor. The two reactors are integrated as schematically shown in figure 3.4. The design is simple and relatively inexpensive. ECN constructed a lab-scale MILENA gasifier in 2004 (figure 3.5) with a capacity of approximately 5 kg/h of biomass. The MILENA facility is integrated in the lab-scale test park at ECN. It therefore can be connected with one or more of the following units: TREC-reactor for high-temperature tar removal and filtering, high temperature ceramic dust filter, gas cooler, OLGA tar removal, water scrubber, dry gas cleaning, compressor, SOFC, Fischer-Tropsch synthesis reactor, or gas engine.
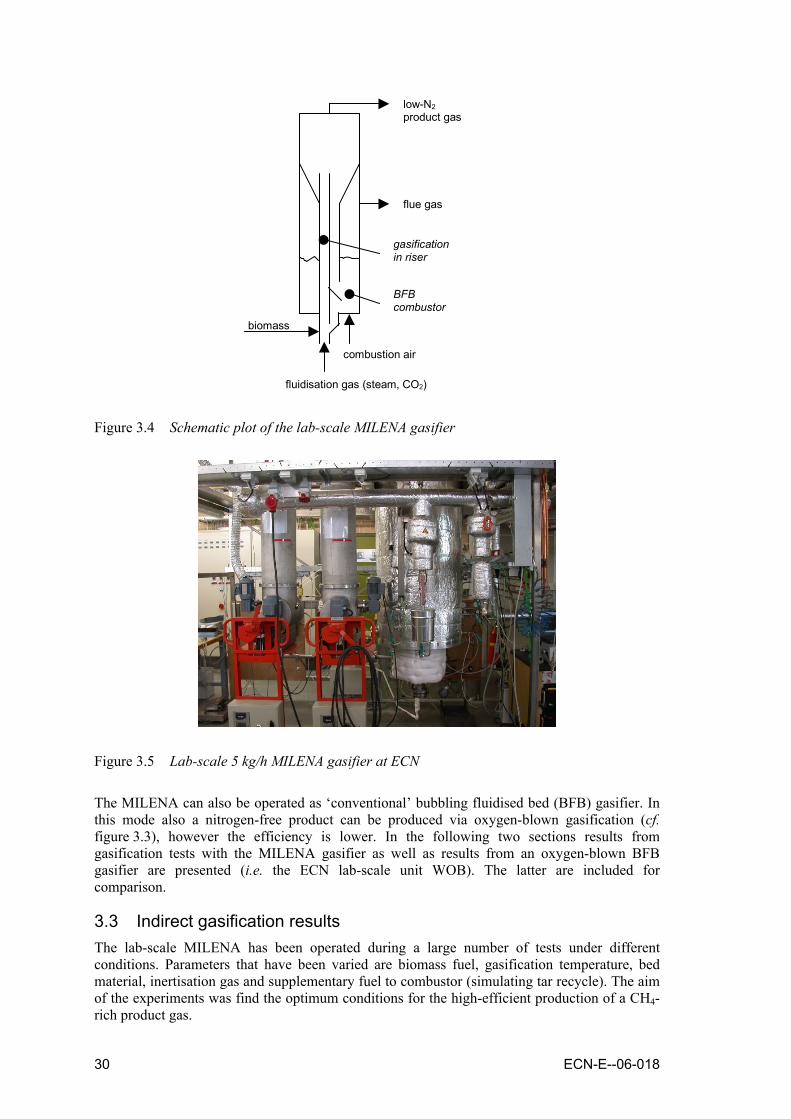
30 ECN-E--06-018
low-N2 product gas
flue gas
combustion air
biomass
gasification in riser
BFB combustor
fluidisation gas (steam, CO2)
Figure 3.4 Schematic plot of the lab-scale MILENA gasifier
Figure 3.5 Lab-scale 5 kg/h MILENA gasifier at ECN
The MILENA can also be operated as ‘conventional’ bubbling fluidised bed (BFB) gasifier. In this mode also a nitrogen-free product can be produced via oxygen-blown gasification (cf. figure 3.3), however the efficiency is lower. In the following two sections results from gasification tests with the MILENA gasifier as well as results from an oxygen-blown BFB gasifier are presented (i.e. the ECN lab-scale unit WOB). The latter are included for comparison.
3.3 Indirect gasification results The lab-scale MILENA has been operated during a large number of tests under different conditions. Parameters that have been varied are biomass fuel, gasification temperature, bed material, inertisation gas and supplementary fuel to combustor (simulating tar recycle). The aim of the experiments was find the optimum conditions for the high-efficient production of a CH4-rich product gas.

ECN-E--06-018 31
3.3.1 Biomass fuel Two different types of fuels were used in the tests: clean beech wood and grass. Beech wood was fed as small particles (source: Rettenmaier Benelux, “Rauchergold”) and grass was fed as milled pellets (source: “Ekogras” form Hartog Grasdrogerij B.V). The fuel compositions are given in table 3.1.
Table 3.1 Composition of tested biomass fuels
Biomass fuel Beech wood Grass C [wt%dry] 48.7 43.7 H [wt%dry] 6.0 5.5 O [wt%dry] 43.8 35.3 N [wt%dry] 0.2 2.5 S [wt%dry] 0.02 0.2 Cl [wt%dry] 0.004 0.6 Ash [wt%dry] 1.0 12.2 H2O [wt%dry] 10 11.4 Higher Heating Value (HHV) [MJ/kgdry] 19.55 18.6 Sieve size [mm-mm] 0.7 - 2.0 -
Grass was selected to investigate the sensitive of the MILENA towards agglomeration of the bed material. Agglomeration of the bed material can happen when a sticky layer on the bed particles is formed and one factor that enhances the formation of this layer is the presence potassium. Grass contains a relatively large quantity of potassium compared to wood. In experiments with wood, agglomeration was never observed. In the experiment with grass, agglomeration occurred within twenty minutes resulting in a shutdown of the gasifier (temperatures in the riser and combustor were 810 and 882°C, respectively). A possible solution to prevent agglomeration is the lowering of the process temperature. However, this was not further investigated within the scope of this project. All further experiments were carried out with beech wood as fuel.
3.3.2 Gasification temperature The gasification temperature influences the product gas composition, the amount and composition of the tar in the gas, and the conversion of the fuel in the gasifier. The gasifier temperature is measured at the outlet of the gasifier. A thermocouple placed in the gas stream is used for this measurement. The heat loss in the upper part of the installation is relatively high. This causes a rapid decrease in gas temperature at the outlet. In previous experiments, the temperature was measured in the settling chamber, were there was a direct contact between thermocouple and circulating sand, this temperature measurements gives an better indication of the gasifier temperature, but the thermocouple broke down. The average difference in measured gas temperature was 26.5°C. The gasification temperature, reported here, is defined as the measured gasifier outlet temperature +26.5°C. By varying the reactor wall temperature (trace-heating) and adding additional fuel to the combustor (both the use of recycled product gas and recycled tar were simulated by oil for practical considerations) the temperature in the reactor was varied. The air to fuel ratio for the combustor was held at a fixed value (typical between 3 and 6 vol% dry of oxygen in the flue gas). In a commercial installation (and the foreseen MILENA pilot plant) the gasifier temperature is not a control parameter but a result of the temperature in the combustor, which is set by the amount of char that is fed to the combustor. Table 3.2 gives the gas composition for the lab-scale MILENA gasifier as a function of temperature. As can be seen from the data, the concentration of methane typically decreases with increasing the temperature.

32 ECN-E--06-018
Table 3.2 MILENA product gas compositions as function of the gasification temperature with dry beech wood as feed

ECN-E--06-018 33
Effect on tar formation The total amount of tar produced in the gasifier without the use of catalytic bed material is relatively high and varies a lot. Increasing the temperature does not decrease the total amount of tars in the gas (table 3.2). Heterocyclic components, like phenol, pyridine and cresol (class 2 tars) decrease in concentration with increasing temperature. Heavy poly-aromatic hydrocarbons (4-5 rings PAH’s, i.e. class 5 tars) increase in concentration with increasing temperature. The heterocyclic tar components are the least stable and therefore readily broken down. The heavy poly-aromatic hydrocarbons are formed from lighter tars (i.e. via polymerization). This behaviour is also observed in bubbling fluidized and circulating fluidized gasifier [20]. Effect on fuel conversion The fuel conversion (or carbon conversion) in the gasification section of the installation varies between 70 and 90%. The unconverted fuel (char) is send to the combustor were it is completely combusted and produces the heat for the gasification reactor. Resultantly, the fuel conversion in an indirect gasifier system is essentially 100%. The amount of char going to the combustor determines the temperature in the gasifier, so the fuel conversion in the gasification reactor determines the temperature in the combustor and the gasifier. This makes the carbon conversion in the gasification section an important design parameter. Carbon conversion is defined as the amount of carbon in the product gas divided by the amount of carbon in the fuel or 100% minus the amount of solid carbon leaving the gasifiers divided by the amount of carbon in the fuel. The last method was used to calculate the carbon conversion in this report. The amount of solid carbon leaving the gasifier was calculated from the amount of air fed to the combustor and the measured oxygen concentration in the flue gas. Part of the carbon leaves the system with the product gas in the form of dust and is not returned to the combustor in the lab-scale installation. The product gas contains approximately 10 g/mn
3 of dust. An estimated 20 wt% of this dust is bed material (sand). Normally 5 mn
3/h of gas is produced; this results in a char loss of 40 gram/h. Corresponding to approximately 10% of the char that is produced in the gasifier. Carbon conversion is influenced by fuel particle size, fuel type, temperature, and residence time in the gasifier. The particle size cannot be varied in a range that is useful for commercial application, because the size of the feeding system and the reactor is relatively small in the lab-scale set-up. For all test fuel particles of 0.7- 2.5 mm were used. For commercial applications particles up to several cm are foreseen. Tests in a pilot-scale plant must generate the required carbon conversion fuel size relations. The calculated carbon conversions, defined as the percentage of the carbon in the fuel converted to carbon in the product gas (CO, CO2, CH4, CxHy, tar) for the different temperatures are given in table 3.2. The carbon conversion generally increases with increasing temperature. This makes the process self-regulating, if the temperature in the reactor lowers, the amount of char produced increases and the amount of heat produced in the combustor increases, resulting in an increase in gasification temperature.
3.3.3 Recycle of tar to the combustor Tar recycle was simulated by the supply of oil to the combustor, because it was not possible to feed relatively small quantities of tar in the lab-scale set-up. A cooled nozzle was fabricated to feed the oil in the bed (near the bed wall). The temperature in the bed was increased by the combustion of the oil. The increased combustion reactor temperature resulted in an increased gasifier temperature. Table 3.3 gives the gas composition of the flue gas leaving the combustor. Secondary air (approximately 10%) was injected in the freeboard during all tests to improve the combustion. The reference composition given in the first column is an average of all tests done without injection of oils or methane.

34 ECN-E--06-018
Table 3.3 Effect on flue gas composition of tar recycle to the combustor
Tar recycle to combustor [gram/h] - 156 260 Combustor temperature [°C] 873 878 922 O2 in flue gas [vol%dry] 5.6 5.0 3.5 CO in flue gas [vol%dry] 7 18 743 CxHy in flue gas [vol%dry] 15 117 289 NOx in flue gas [vol%dry] 110 109 104
The tar / oil recycle had a negative impact on the flue gas emissions of the combustor. The concentrations of CO and CxHy increased. The local injection of the oil is probably the reason for the incomplete combustion. Without an oil / tar recycle to the combustor the emission of CO and CxHy are below the emission limits for waste streams in the Netherlands. For the injection of tars to the gasifier a properly designed injection nozzle system is required, otherwise the emissions of CO and CxHy will increase to an unacceptable level.
3.3.4 Alternative bed materials Sand is used as the standard bed material, because it is cheap and resistant to abrasion. Other fluidized bed gasifiers use also olivine and dolomite as bed material, because these materials are catalytic active for the reduction of tar in the product gas. Dolomite is relatively soft and has a high abrasion rate in typical fluidized bed applications. Furthermore, fresh dolomite calcines (i.e. reaction of CaCO3 to CaO and CO2) in the reactor, which is an endothermic reaction that decreases the gasifier efficiency. Olivine is much harder then dolomite and seems a good alternative to sand. The FICFB gasifier in Güssing (Austria) used olivine in a bubbling fluidized bed as bed material As can be seen from the gas composition in table 3.4 the decrease of the tar content by the use of olivine instead of sand is not significant. A good contact between the catalyst and the product gas is required for an optimal tar reduction. In the MILENA reactor the biomass is gasified in a riser. Compared to a fluidized bed the contact between the produced gas and the bed material (catalyst) is less optimal. The use of catalytic bed material in the MILENA does not yield advantages.
Table 3.4 Effect of bed material on product gas composition.
Bed material [-] Sand Sand Olivine Gasifier temperature [°C] 825 826 828 CO [vol%dry] 44.1 43.2 43.9 H2 [vol%dry] 20.4 18.1 18.9 CO2 [vol%dry] 10.2 10.3 9.5 CH4 [vol%dry] 15.9 14.6 14.5 C2Hy [vol%dry] 5.1 5.6 5.3 C3H8 + C6H6 + C7H8 [vol%dry] 1.2 1.6 1.1 N2 + Ar (measured) [vol%dry] 4.2 6.6 8.2 Sum [vol%dry] 101.1 100.0 101.4 Class 2 tars [mg/mn
3] 587 1,293 1,675 Class 5 tars [mg/mn
3] 6,651 6,507 3,927 Total tar (from xylene) [mg/mn
3] 40,672 49,748 30,921
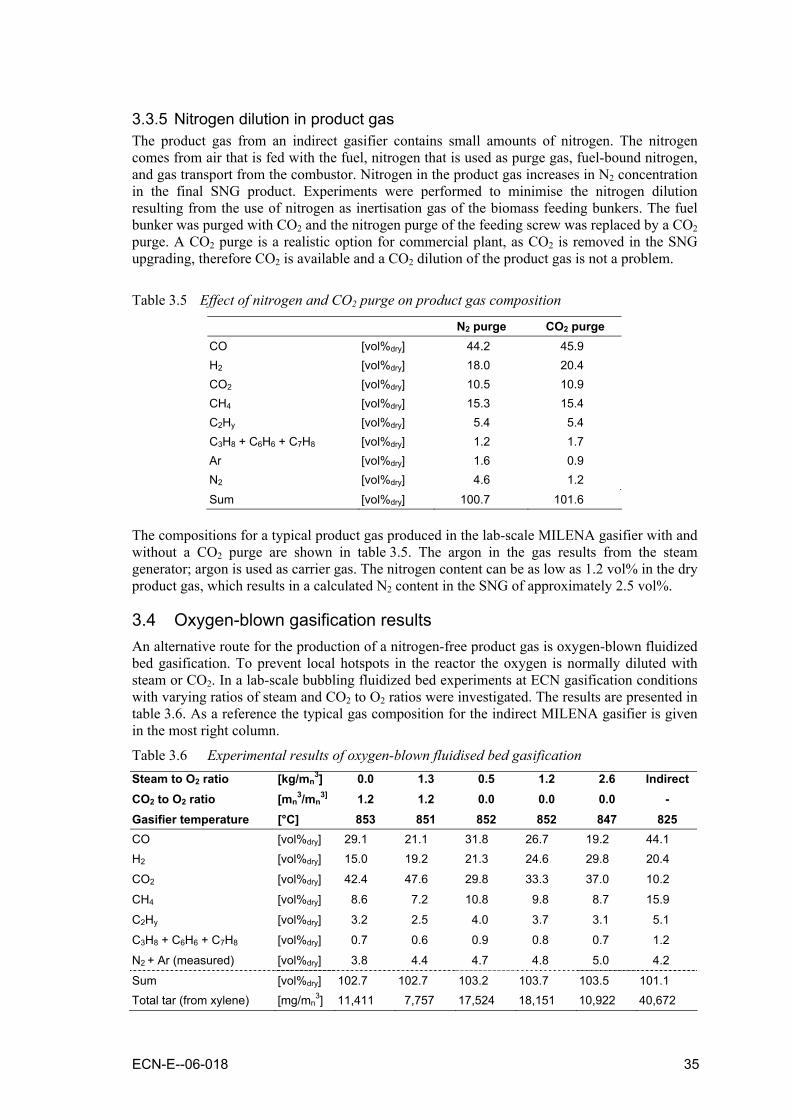
ECN-E--06-018 35
3.3.5 Nitrogen dilution in product gas The product gas from an indirect gasifier contains small amounts of nitrogen. The nitrogen comes from air that is fed with the fuel, nitrogen that is used as purge gas, fuel-bound nitrogen, and gas transport from the combustor. Nitrogen in the product gas increases in N2 concentration in the final SNG product. Experiments were performed to minimise the nitrogen dilution resulting from the use of nitrogen as inertisation gas of the biomass feeding bunkers. The fuel bunker was purged with CO2 and the nitrogen purge of the feeding screw was replaced by a CO2 purge. A CO2 purge is a realistic option for commercial plant, as CO2 is removed in the SNG upgrading, therefore CO2 is available and a CO2 dilution of the product gas is not a problem.
Table 3.5 Effect of nitrogen and CO2 purge on product gas composition
N2 purge CO2 purge CO [vol%dry] 44.2 45.9 H2 [vol%dry] 18.0 20.4 CO2 [vol%dry] 10.5 10.9 CH4 [vol%dry] 15.3 15.4 C2Hy [vol%dry] 5.4 5.4 C3H8 + C6H6 + C7H8 [vol%dry] 1.2 1.7 Ar [vol%dry] 1.6 0.9 N2 [vol%dry] 4.6 1.2 Sum [vol%dry] 100.7 101.6
The compositions for a typical product gas produced in the lab-scale MILENA gasifier with and without a CO2 purge are shown in table 3.5. The argon in the gas results from the steam generator; argon is used as carrier gas. The nitrogen content can be as low as 1.2 vol% in the dry product gas, which results in a calculated N2 content in the SNG of approximately 2.5 vol%.
3.4 Oxygen-blown gasification results An alternative route for the production of a nitrogen-free product gas is oxygen-blown fluidized bed gasification. To prevent local hotspots in the reactor the oxygen is normally diluted with steam or CO2. In a lab-scale bubbling fluidized bed experiments at ECN gasification conditions with varying ratios of steam and CO2 to O2 ratios were investigated. The results are presented in table 3.6. As a reference the typical gas composition for the indirect MILENA gasifier is given in the most right column.
Table 3.6 Experimental results of oxygen-blown fluidised bed gasification Steam to O2 ratio [kg/mn
3] 0.0 1.3 0.5 1.2 2.6 Indirect CO2 to O2 ratio [mn
3/mn3] 1.2 1.2 0.0 0.0 0.0 -
Gasifier temperature [°C] 853 851 852 852 847 825 CO [vol%dry] 29.1 21.1 31.8 26.7 19.2 44.1 H2 [vol%dry] 15.0 19.2 21.3 24.6 29.8 20.4
CO2 [vol%dry] 42.4 47.6 29.8 33.3 37.0 10.2
CH4 [vol%dry] 8.6 7.2 10.8 9.8 8.7 15.9
C2Hy [vol%dry] 3.2 2.5 4.0 3.7 3.1 5.1
C3H8 + C6H6 + C7H8 [vol%dry] 0.7 0.6 0.9 0.8 0.7 1.2
N2 + Ar (measured) [vol%dry] 3.8 4.4 4.7 4.8 5.0 4.2
Sum [vol%dry] 102.7 102.7 103.2 103.7 103.5 101.1 Total tar (from xylene) [mg/mn
3] 11,411 7,757 17,524 18,151 10,922 40,672
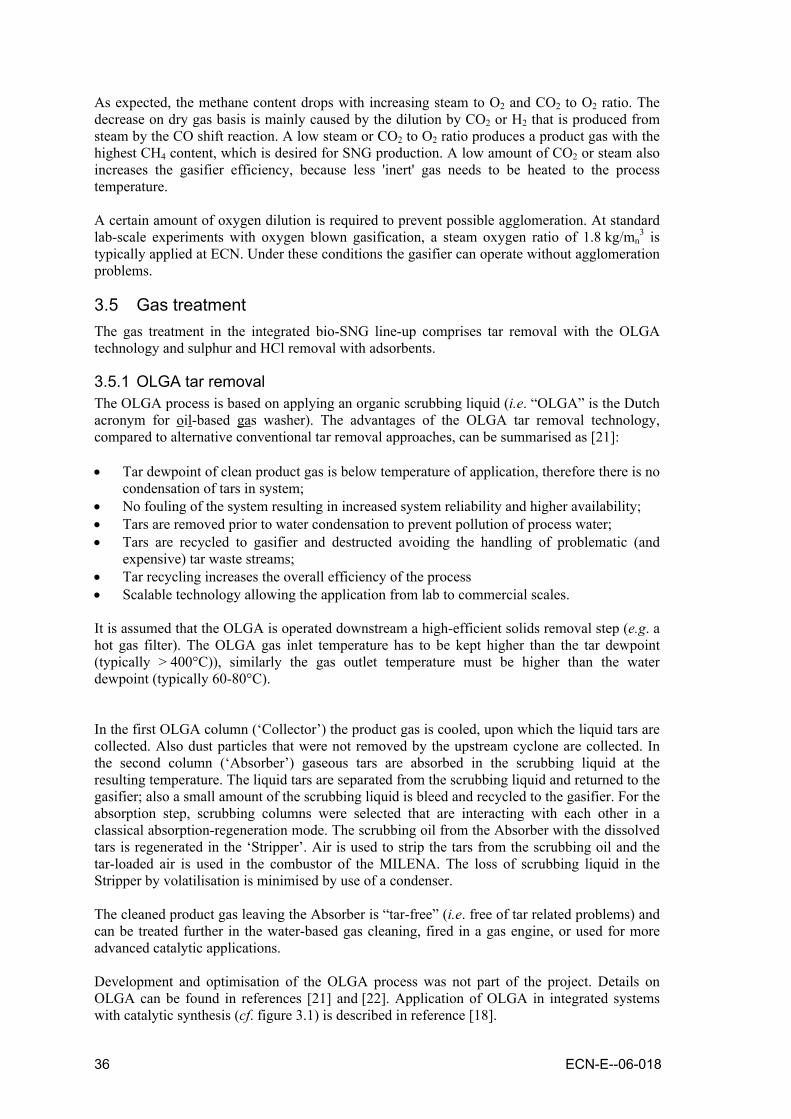
36 ECN-E--06-018
As expected, the methane content drops with increasing steam to O2 and CO2 to O2 ratio. The decrease on dry gas basis is mainly caused by the dilution by CO2 or H2 that is produced from steam by the CO shift reaction. A low steam or CO2 to O2 ratio produces a product gas with the highest CH4 content, which is desired for SNG production. A low amount of CO2 or steam also increases the gasifier efficiency, because less 'inert' gas needs to be heated to the process temperature. A certain amount of oxygen dilution is required to prevent possible agglomeration. At standard lab-scale experiments with oxygen blown gasification, a steam oxygen ratio of 1.8 kg/mn
3 is typically applied at ECN. Under these conditions the gasifier can operate without agglomeration problems.
3.5 Gas treatment The gas treatment in the integrated bio-SNG line-up comprises tar removal with the OLGA technology and sulphur and HCl removal with adsorbents.
3.5.1 OLGA tar removal The OLGA process is based on applying an organic scrubbing liquid (i.e. “OLGA” is the Dutch acronym for oil-based gas washer). The advantages of the OLGA tar removal technology, compared to alternative conventional tar removal approaches, can be summarised as [21]: • Tar dewpoint of clean product gas is below temperature of application, therefore there is no
condensation of tars in system; • No fouling of the system resulting in increased system reliability and higher availability; • Tars are removed prior to water condensation to prevent pollution of process water; • Tars are recycled to gasifier and destructed avoiding the handling of problematic (and
expensive) tar waste streams; • Tar recycling increases the overall efficiency of the process • Scalable technology allowing the application from lab to commercial scales. It is assumed that the OLGA is operated downstream a high-efficient solids removal step (e.g. a hot gas filter). The OLGA gas inlet temperature has to be kept higher than the tar dewpoint (typically > 400°C)), similarly the gas outlet temperature must be higher than the water dewpoint (typically 60-80°C). In the first OLGA column (‘Collector’) the product gas is cooled, upon which the liquid tars are collected. Also dust particles that were not removed by the upstream cyclone are collected. In the second column (‘Absorber’) gaseous tars are absorbed in the scrubbing liquid at the resulting temperature. The liquid tars are separated from the scrubbing liquid and returned to the gasifier; also a small amount of the scrubbing liquid is bleed and recycled to the gasifier. For the absorption step, scrubbing columns were selected that are interacting with each other in a classical absorption-regeneration mode. The scrubbing oil from the Absorber with the dissolved tars is regenerated in the ‘Stripper’. Air is used to strip the tars from the scrubbing oil and the tar-loaded air is used in the combustor of the MILENA. The loss of scrubbing liquid in the Stripper by volatilisation is minimised by use of a condenser. The cleaned product gas leaving the Absorber is “tar-free” (i.e. free of tar related problems) and can be treated further in the water-based gas cleaning, fired in a gas engine, or used for more advanced catalytic applications. Development and optimisation of the OLGA process was not part of the project. Details on OLGA can be found in references [21] and [22]. Application of OLGA in integrated systems with catalytic synthesis (cf. figure 3.1) is described in reference [18].

ECN-E--06-018 37
3.5.2 Gas cleaning Gas cleaning is performed either by water scrubbing in combination with guard bed or absorbent materials, depending on the selected system concept (see Section 3.1). Results of a system including a water scrubber are described in reference [18]. Development of a gas cleaning line-up based on absorbents and which is operated at elevated temperatures (i.e. at least above the water dewpoint) was carried out in a parallel project. Results are described in the final report of this project [23].
3.6 Gas conditioning After the gas treatment, the MILENA product gas (table 3.7) requires additional conditioning before it is suitable for catalytic methanation. Conditioning comprises steam addition, adjustment of the H2/CO ratio, and conversion of the remaining (unsaturated) hydrocarbons.
Table 3.7 Typical MILENA product gas composition for wood with 25% moisture
Product gas CO [vol%dry] 28 H2 [vol%dry] 30 CO2 [vol%dry] 20 N2 + Ar [vol%dry] 2 CH4 [vol%dry] 14 C2Hy [vol%dry] 5 BTX [vol%dry] 1 tar (C8+) [g/mn
3dry] 45
H2O [vol%wet] 35
3.6.1 Carbon formation Carbon formation (coking) is potentially serious threat for the methanation process [24]. Carbon can be formed by several mechanisms, such as: 2 CO CO2 + C (Boudouard reaction) CO + H2 C + H2O The formation of carbon is undesired, because it results in loss of conversion efficiency, but also in deactivation of the catalyst by carbon deposition. Adding steam to the synthesis gas can suppress this reaction. As shown in figure 3.6, at thermodynamic equilibrium (for the MILENA gas from table 3.7) carbon formation is present below 650°C (i.e. the methanation temperature range), regardless of the pressure. The pressure has an influence on the extent of the carbon formation, but only above 550°C, where lower pressures give less carbon formation. Carbon formation is (thermodynamically) completely suppressed above 650°C at 1 bar and above 800°C at 40 bar. Carbon formation is suppressed by steam present in the gas. A variation of the steam content in the gas entering the methanation was thermodynamically modelled and the effect on carbon formation is given in figure 3.7. It is clear that at low temperatures, independent of the pressure, large amounts of steam are necessary in the gas to prevent carbon formation based on thermodynamic equilibrium. At higher temperatures less steam is necessary and the exact amount depends on the pressure. Although the steam content of the raw MILENA product gas is already as high as 35.4%, according to the thermodynamic equilibrium this is not even enough to suppress carbon formation at low temperatures (200-500°C).
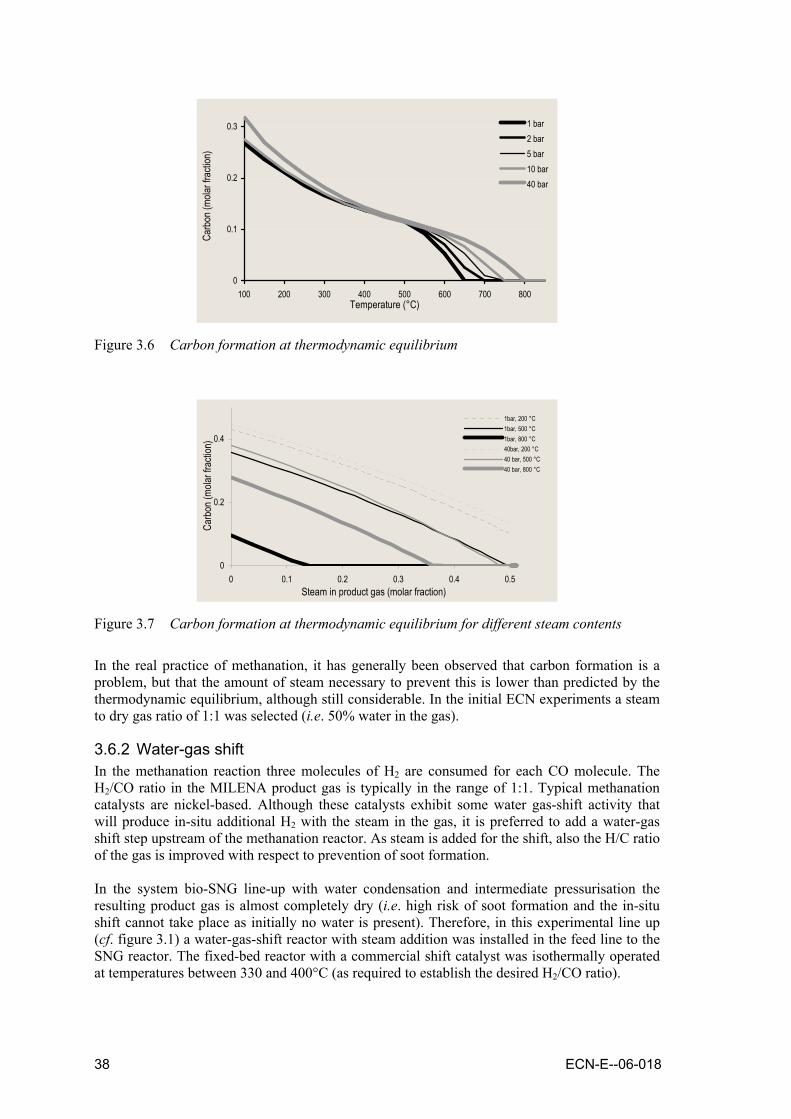
38 ECN-E--06-018
0
0.1
0.2
0.3
100 200 300 400 500 600 700 800Temperature (°C)
Carb
on (m
olar f
racti
on)
1 bar2 bar5 bar10 bar40 bar
Figure 3.6 Carbon formation at thermodynamic equilibrium
0
0.2
0.4
0 0.1 0.2 0.3 0.4 0.5Steam in product gas (molar fraction)
Carb
on (m
olar f
racti
on)
1bar, 200 °C1bar, 500 °C1bar, 800 °C40bar, 200 °C40 bar, 500 °C40 bar, 800 °C
Figure 3.7 Carbon formation at thermodynamic equilibrium for different steam contents
In the real practice of methanation, it has generally been observed that carbon formation is a problem, but that the amount of steam necessary to prevent this is lower than predicted by the thermodynamic equilibrium, although still considerable. In the initial ECN experiments a steam to dry gas ratio of 1:1 was selected (i.e. 50% water in the gas).
3.6.2 Water-gas shift In the methanation reaction three molecules of H2 are consumed for each CO molecule. The H2/CO ratio in the MILENA product gas is typically in the range of 1:1. Typical methanation catalysts are nickel-based. Although these catalysts exhibit some water gas-shift activity that will produce in-situ additional H2 with the steam in the gas, it is preferred to add a water-gas shift step upstream of the methanation reactor. As steam is added for the shift, also the H/C ratio of the gas is improved with respect to prevention of soot formation. In the system bio-SNG line-up with water condensation and intermediate pressurisation the resulting product gas is almost completely dry (i.e. high risk of soot formation and the in-situ shift cannot take place as initially no water is present). Therefore, in this experimental line up (cf. figure 3.1) a water-gas-shift reactor with steam addition was installed in the feed line to the SNG reactor. The fixed-bed reactor with a commercial shift catalyst was isothermally operated at temperatures between 330 and 400°C (as required to establish the desired H2/CO ratio).

ECN-E--06-018 39
In table 3.8 the experimental conditions and the test results are summarised. Experiment 1 with only H2, CO, and N2 was carried out to test the functional operation of the reactor at 330°C and with 46% of steam in the gas on wet basis (or almost a 1:1 ratio of steam to dry gas). When CO2 was added to the feed gas the H2/CO ratio decreased (experiment 2) and a 15°C temperature increase was required to reach the same H2/CO ratio.
Table 3.8 Experimental conditions and results of water-gas shift experiments
Water-gas shift inlet: N2 CO H2 CO2 CH4 C2H4 C2H6 H2O shift tempExp. # [vol%dry] [vol%dry] [vol%dry] [vol%dry] [vol%dry] [vol%dry] [vol%dry] [mol%wet] [°C] 1 50 25 25 0 0 0 0 46 330 2 25 25 25 25 0 0 0 46 330 3 25 25 25 25 0 0 0 46 345 4 20 44 21 11 0 4 0 46 371 5 20 44 21 11 0 4 0 39 371 6 20 44 21 11 0 4 0 39 373 7 20 44 21 11 0 4 0 33 373 8 20 44 21 11 0 4 0 33 377 9 20 44 21 11 0 4 0 26 377 10 20 44 21 11 0 4 0 26 390 11 20 44 21 11 0 4 0 26 400 Water-gas shift outlet:
N2 CO H2 CO2 CH4 C2H4 C2H6 H2/CO (Cin-Cuit)/Cin
Exp. # [vol%dry] [vol%dry] [vol%dry] [vol%dry] [vol%dry] [vol%dry] [vol%dry] [-] 1 46.5 11.8 31.3 10.4 0.0 0.0 0.0 2.6 - 2 24.2 15.4 28.8 31.7 0.0 0.0 0.0 1.9 1% 3 22.7 11.4 31.5 34.4 0.0 0.0 0.0 2.8 1% 4 13.9 12.5 38.6 31.7 0.0 3.2 0.1 3.1 1% 5 14.2 13.3 37.7 31.5 0.0 3.2 0.1 2.8 1% 6 13.5 12.9 39.1 31.2 0.0 3.2 0.1 3.0 0% 7 14.5 14.3 36.5 31.4 0.0 3.2 0.1 2.6 0% 8 14.3 13.3 36.9 32.2 0.0 3.2 0.1 2.8 0% 9 15.0 17.4 37.2 27.0 0.0 3.2 0.2 2.1 4% 10 14.9 14.8 37.7 29.0 0.3 2.6 0.7 2.5 5% 11 15.6 13.7 36.6 30.0 0.6 2.1 1.3 2.7 6% In experiments 4 to 11 a product gas from indirect or oxygen-blown gasification is simulated but with a very low H2/CO ratio of 0.5. N2 is used to represent all inert hydrocarbons (e.g. CH4). C2H4 was included in the feed gas as this compound can react over the water-gas shift catalyst. The main purpose of the experiments was to find the minimum steam concentration at which no carbon formation occurred. In experiment 4 the H2/CO ratio of 3:1 is established at 371°C. As expected, part of the ethylene is converted into H2 and CO and a small part is hydrogenated into ethane (C2H6). When the steam content is decreased (to 39%), the H2/CO ratio also decreases and a small temperature rise is necessary to restore the H2/CO ratio (compare experiments 4, 5, and 6). The same phenomenon is observed at a further decrease of the steam content to 33% (compare experiments 6, 7, and 8).
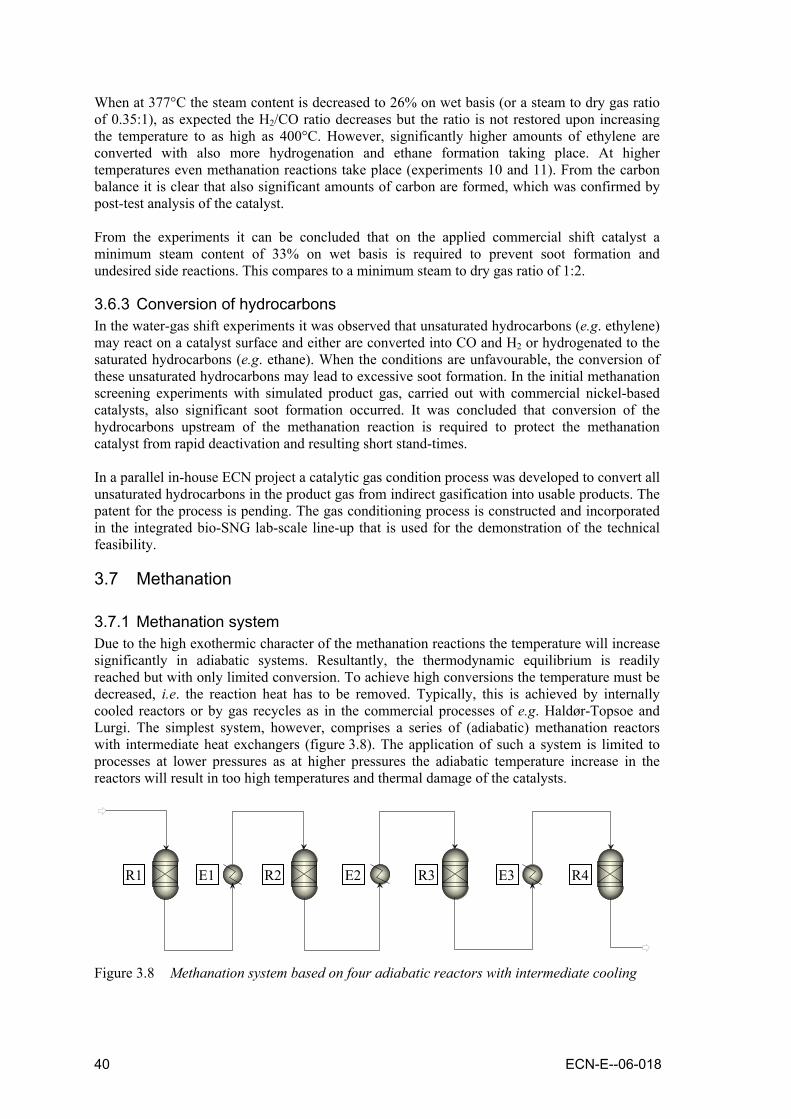
40 ECN-E--06-018
When at 377°C the steam content is decreased to 26% on wet basis (or a steam to dry gas ratio of 0.35:1), as expected the H2/CO ratio decreases but the ratio is not restored upon increasing the temperature to as high as 400°C. However, significantly higher amounts of ethylene are converted with also more hydrogenation and ethane formation taking place. At higher temperatures even methanation reactions take place (experiments 10 and 11). From the carbon balance it is clear that also significant amounts of carbon are formed, which was confirmed by post-test analysis of the catalyst. From the experiments it can be concluded that on the applied commercial shift catalyst a minimum steam content of 33% on wet basis is required to prevent soot formation and undesired side reactions. This compares to a minimum steam to dry gas ratio of 1:2.
3.6.3 Conversion of hydrocarbons In the water-gas shift experiments it was observed that unsaturated hydrocarbons (e.g. ethylene) may react on a catalyst surface and either are converted into CO and H2 or hydrogenated to the saturated hydrocarbons (e.g. ethane). When the conditions are unfavourable, the conversion of these unsaturated hydrocarbons may lead to excessive soot formation. In the initial methanation screening experiments with simulated product gas, carried out with commercial nickel-based catalysts, also significant soot formation occurred. It was concluded that conversion of the hydrocarbons upstream of the methanation reaction is required to protect the methanation catalyst from rapid deactivation and resulting short stand-times. In a parallel in-house ECN project a catalytic gas condition process was developed to convert all unsaturated hydrocarbons in the product gas from indirect gasification into usable products. The patent for the process is pending. The gas conditioning process is constructed and incorporated in the integrated bio-SNG lab-scale line-up that is used for the demonstration of the technical feasibility.
3.7 Methanation
3.7.1 Methanation system Due to the high exothermic character of the methanation reactions the temperature will increase significantly in adiabatic systems. Resultantly, the thermodynamic equilibrium is readily reached but with only limited conversion. To achieve high conversions the temperature must be decreased, i.e. the reaction heat has to be removed. Typically, this is achieved by internally cooled reactors or by gas recycles as in the commercial processes of e.g. Haldør-Topsoe and Lurgi. The simplest system, however, comprises a series of (adiabatic) methanation reactors with intermediate heat exchangers (figure 3.8). The application of such a system is limited to processes at lower pressures as at higher pressures the adiabatic temperature increase in the reactors will result in too high temperatures and thermal damage of the catalysts.
Figure 3.8 Methanation system based on four adiabatic reactors with intermediate cooling
R1 R4 E3R3E2R2 E1

ECN-E--06-018 41
In each adiabatic reactor the methanation reaction will take place till thermodynamic equilibrium is reached. Two effects determine the methane equilibrium concentration: 1. Formation of CH4 due to the reaction of H2 and CO; 2. Conversion of CH4 due to the increase in temperature (steam reforming of methane). In figure 3.9 the variation of the CH4 concentration is illustrated for the four methanation reactors as well as the adiabatic temperature effects. Each diagonal line represents an adiabatic reactor and each horizontal line represents intermediate cooling. The initial CH4 flow is 8.9 mol/h (total flow of wet feed gas is 100 mol/h) and the inlet temperature of the first methanation reactor R1 is 350°C. In the reactor the amount of CH4 increases to 13.7 mol/h, which is accompanied by an adiabatic temperature increase of 199°C (outlet temperature is 549°C). The first cooler E1 cools the gas to 200°C, i.e. the inlet temperatures of the reactors R2, R3, and R4. After the fourth reactor E4 the CH4 flow is 23.1 mol/h, which corresponds to a CO conversion of 98.3%.
0
5
10
15
20
25
150 250 350 450 550 650 750
Temperature
Mol
e C
H4 p
er 1
00 m
ole
feed
Limit CH4
R1
E1R2
E2R3
E3 R4
Figure 3.9 Variation of CH4 flow and (adiabatic) reactor temperature in the methanation
system as shown in figure 3.8 operated at 1 bar. Feed flow is 100 mol/h with 8.9 mol/h of initial CH4
At higher system pressures the thermodynamic equilibrium will shift towards higher conversion and more CH4 formation, resultantly, the adiabatic temperature increase will be higher. In figure 3.10 the variation of the CH4 flow and temperature in the adiabatic systems at 10 bar is illustrated. The conversion at 10 bar is higher compared to the system at 1 bar, i.e. the conversion after the third reactor R3 is even higher than after the fourth reactor R4 in the 1 bar system. Furthermore, the higher pressure has an advantageous effect on the catalyst activity due to which less catalyst is required to reach the same conversion. The amount of CH4 that is formed is 23.5 mol/h, which corresponds to almost 100% conversion.

42 ECN-E--06-018
0
5
10
15
20
25
150 250 350 450 550 650 750 Temperature
Mol
e C
H4 p
er 1
00 m
ole
feed
Limit CH4
R1
E1
R2E2 R3
R4 E3
Figure 3.10 Variation of CH4 flow and (adiabatic) reactor temperature in the methanation
system as shown in figure 3.8 operated at 10 bar. Feed flow is 100 mol/h with 8.9 mol/h of initial CH4
3.7.2 Experimental In an experimental programme various commercial available methanation catalysts were evaluated on their suitability for application in the bio-SNG system with adiabatic reactors. The evaluation as included in the project was limited to the determination of the initial activity of the catalysts. The experiments were performed in a fully automated ‘parallel flow’ set-up with six 4 mm diameter quartz reactors to allow testing of six samples under identical conditions, i.e. pressure, temperature, and feed gas composition. Maximum pressure is 5 bar and maximum temperature is 550°C. Isothermal operation is approached by the use of thin reactors and nitrogen as dilution gas; the lower partial pressures of the reactants are compensated by applying a higher pressure (i.e. 3 bar). A gas chromatograph analyses the reactor off-gases every four minutes. A typical test run comprises a step-wise increase of the temperature and determined the temperature related rate of formation of methane per gram of catalyst (i.e. the activity). Composition of the feed gas for the catalyst screening tests is shown in table 3.9.
Table 3.9 Feed gas composition for catalyst screening tests
Product gas vol%wet CO 0.68 H2 4.28 CO2 8.55 N2 70.31 CH4 6.70 H2O 9.48
In figure 3.11 the results of the activity experiments are shown. The curves for catalysts C to F are not smooth, which is the result of the gas analysis method and not related to the catalyst performance. Catalyst B has the highest activity, i.e. it exhibits already activity at 200°C and at 250°C the activity is already three times higher than catalyst A. The order of activity for the

ECN-E--06-018 43
tested catalysts is B >> A > C > D ≈ E. The negative methane formation rate observed at temperatures above 440°C is due to the methane reforming reaction that is taking place, as at higher temperatures the thermodynamic equilibrium concentration of methane is lower than the feed gas concentrations. Catalyst B was selected for the application in the methanation section in the integrated line-up for the demonstration of the technical feasibility.
Figure 3.11 Activity plots (temperature dependent reaction speed) for selected methanation
catalysts
3.8 Demonstration of technical feasibility The technical feasibility of the production of SNG from biomass is demonstrated by tests with integrated biomass gasification, gas cleaning, and methanation experiments. In the experiments upgrading of the raw product SNG, i.e. water and CO2 removal, was not included for practical considerations. Furthermore, water and CO2 removal are well-known and commercially available technologies.
3.8.1 Pressurised system The first demonstrated integrated system line-up is based on atmospheric gasification in combination with pressurised methanation as shown in figure 3.1 [18]. Biomass (beech wood) is gasified in the ECN lab-scale atmospheric bubbling fluidised bed gasifier “WOB”. Oxygen is used as gasifying medium to produce an essentially nitrogen-free product gas and steam is added to moderate the temperature in the bed of the gasifier. The gasifier is typically operated at 850°C. The raw product gas passes a high-temperature gas filter (ceramic candle) operated at 350°C to remove essentially all the solids. The product gas contained approximately 23 g/mn
3 of tars, almost 1.5 vol% of benzene, toluene and xylene (BTX), and more than 10 vol% of CH4 and C2-hydrocarbons (table 3.10). The lab-scale OLGA unit is operated to remove all the tars, while benzene and toluene were removed for approx. 25 and 50%, respectively. In a larger installation the OLGA unit will bed designed to remove BTX to lower levels. The gas leaving OLGA at a temperature of 80°C (determined by the water dewpoint of the gas) is further cooled and cleaned from NH3, HCl, and other inorganic impurities in a water scrubber at room temperature.

44 ECN-E--06-018
Table 3.10 Measured gas compositions (normalised, dry basis) during integrated test with system of oxygen/steam gasification in WOB, OLGA tar removal, water scrubber, compression and gas polishing, and methanation
Gas Product gas OLGA gas Scrubber gas Clean gas Analysis location after WOB OLGA tar
removal Water
scrubber Compression & gas polishing
Temperature [°C] 850 60-100 20 20 Pressure [bar] 1 1 1 40 Moisture [vol%wet] 0.05 CO [vol%dry] 28.0 28.1 28.2 30.0 H2 [vol%dry] 23.0 22.0 21.9 22.8 CO2 [vol%dry] 28.2 29.6 29.6 26.7 N2 [vol%dry] 2.24 2.11 2.16 2.47 Ar [vol%dry] 4.82 4.86 5.01 5.17 CH4 [vol%dry] 9.11 9.06 9.05 9.42 C2H4 [vol%dry] 3.08 3.21 3.21 3.00 C2H6 [vol%dry] 0.25 0.25 0.21 0.25 C2H2 [vol%dry] 0.16 0.17 0.17 0.15 Benzene [ppmV] 6813 5018 4507 101 Toluene [ppmV] 710 377 282 19 SPA tarsa [ppmV] 4114 < 10b < 10b < 10b NH3 [ppmV] ~ 1304 8.5 0.06 HCN [ppmV] ~ ~ ~ < 6b HCl [ppmV] ~ 0.67 < 0.3b < 0.3b H2S [ppbV] ~ ~ 116496 < 10b COS [ppbV] ~ ~ 4030 50 CS2 [ppbV] ~ ~ 940 30 TOTAL [vol%] 100.0 100.0 100.0 100.0 a Concentration of tars measured by solid phase adsorption (SPA). b Actual concentrations were below detection limit. The reported values are estimated maximum values. Both the OLGA and the water scrubber are equipped with a stripper to regenerate the washing oil and water, respectively. In the lab-scale line-up these stripper gases are flared, whereas in full-scale installations the stripper tars and NH3 would be recycled to the gasifier. Water is condensed from the clean gas and subsequently the gas is compressed to 60 bar. The compressed gases are passed through a ZnO filter to remove the H2S and an active-carbon guard bed to remove all remaining trace impurities. Most of the sulphur is present as H2S with only a few percent COS. H2S is removed by the ZnO filters, COS (and CS2) by the active-carbon guard beds. In this system with water scrubber and guard beds at elevated pressure the critical components were removed to < 10 ppbV (H2S), 50 ppbV (COS), and < 0.3 ppmV (HCl, detection limit). Methanation was carried out in micro-flow fixed bed reactor (gas flow approximately 10 Ln/h) with a Ruthenium catalyst. The test was successful and the first biomass-based SNG was produced. However, loss of catalyst productivity was observed within several hours of testing, which was due to significant soot formation as was confirmed by post-mortem analysis. Optimisation of this line-up not continued as other system line-up without water condensation and pressurisation was selected (see next section).
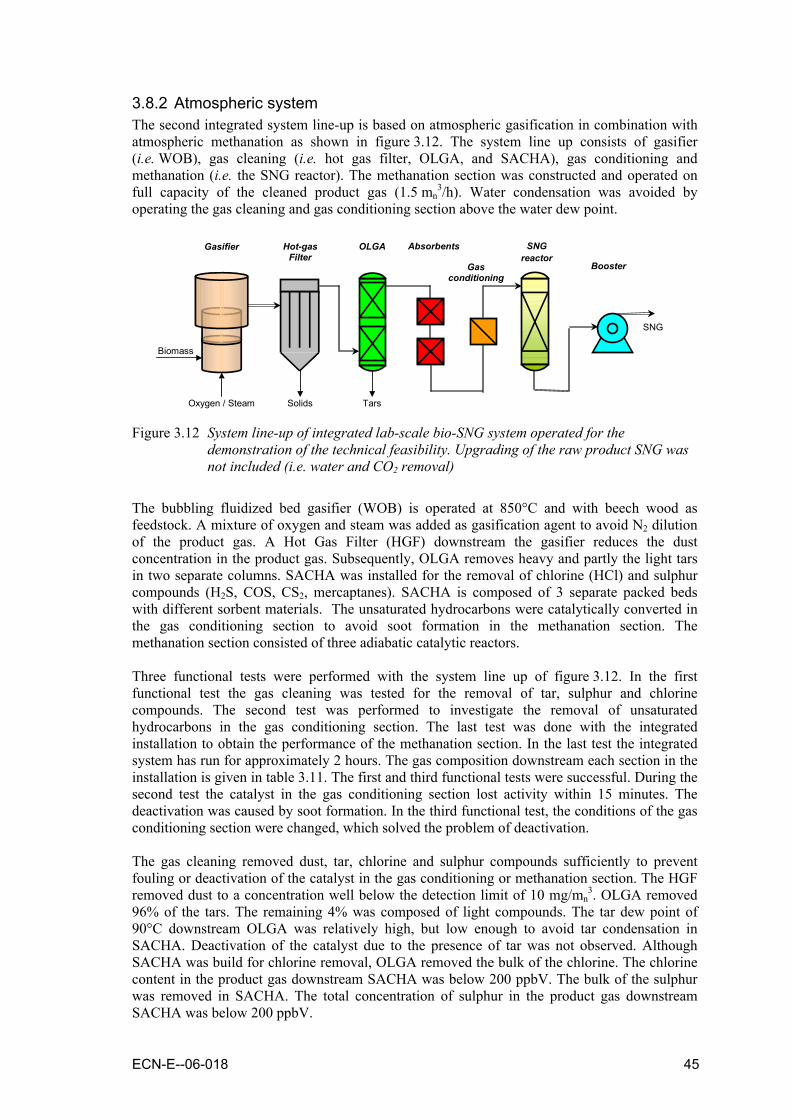
ECN-E--06-018 45
3.8.2 Atmospheric system The second integrated system line-up is based on atmospheric gasification in combination with atmospheric methanation as shown in figure 3.12. The system line up consists of gasifier (i.e. WOB), gas cleaning (i.e. hot gas filter, OLGA, and SACHA), gas conditioning and methanation (i.e. the SNG reactor). The methanation section was constructed and operated on full capacity of the cleaned product gas (1.5 mn
3/h). Water condensation was avoided by operating the gas cleaning and gas conditioning section above the water dew point.
Biomass
Solids Tars
SNG
Hot-gas Filter
OLGA
Booster
Gasifier SNG reactor
Absorbents
Gas conditioning
Oxygen / Steam Figure 3.12 System line-up of integrated lab-scale bio-SNG system operated for the
demonstration of the technical feasibility. Upgrading of the raw product SNG was not included (i.e. water and CO2 removal)
The bubbling fluidized bed gasifier (WOB) is operated at 850°C and with beech wood as feedstock. A mixture of oxygen and steam was added as gasification agent to avoid N2 dilution of the product gas. A Hot Gas Filter (HGF) downstream the gasifier reduces the dust concentration in the product gas. Subsequently, OLGA removes heavy and partly the light tars in two separate columns. SACHA was installed for the removal of chlorine (HCl) and sulphur compounds (H2S, COS, CS2, mercaptanes). SACHA is composed of 3 separate packed beds with different sorbent materials. The unsaturated hydrocarbons were catalytically converted in the gas conditioning section to avoid soot formation in the methanation section. The methanation section consisted of three adiabatic catalytic reactors. Three functional tests were performed with the system line up of figure 3.12. In the first functional test the gas cleaning was tested for the removal of tar, sulphur and chlorine compounds. The second test was performed to investigate the removal of unsaturated hydrocarbons in the gas conditioning section. The last test was done with the integrated installation to obtain the performance of the methanation section. In the last test the integrated system has run for approximately 2 hours. The gas composition downstream each section in the installation is given in table 3.11. The first and third functional tests were successful. During the second test the catalyst in the gas conditioning section lost activity within 15 minutes. The deactivation was caused by soot formation. In the third functional test, the conditions of the gas conditioning section were changed, which solved the problem of deactivation. The gas cleaning removed dust, tar, chlorine and sulphur compounds sufficiently to prevent fouling or deactivation of the catalyst in the gas conditioning or methanation section. The HGF removed dust to a concentration well below the detection limit of 10 mg/mn
3. OLGA removed 96% of the tars. The remaining 4% was composed of light compounds. The tar dew point of 90°C downstream OLGA was relatively high, but low enough to avoid tar condensation in SACHA. Deactivation of the catalyst due to the presence of tar was not observed. Although SACHA was build for chlorine removal, OLGA removed the bulk of the chlorine. The chlorine content in the product gas downstream SACHA was below 200 ppbV. The bulk of the sulphur was removed in SACHA. The total concentration of sulphur in the product gas downstream SACHA was below 200 ppbV.
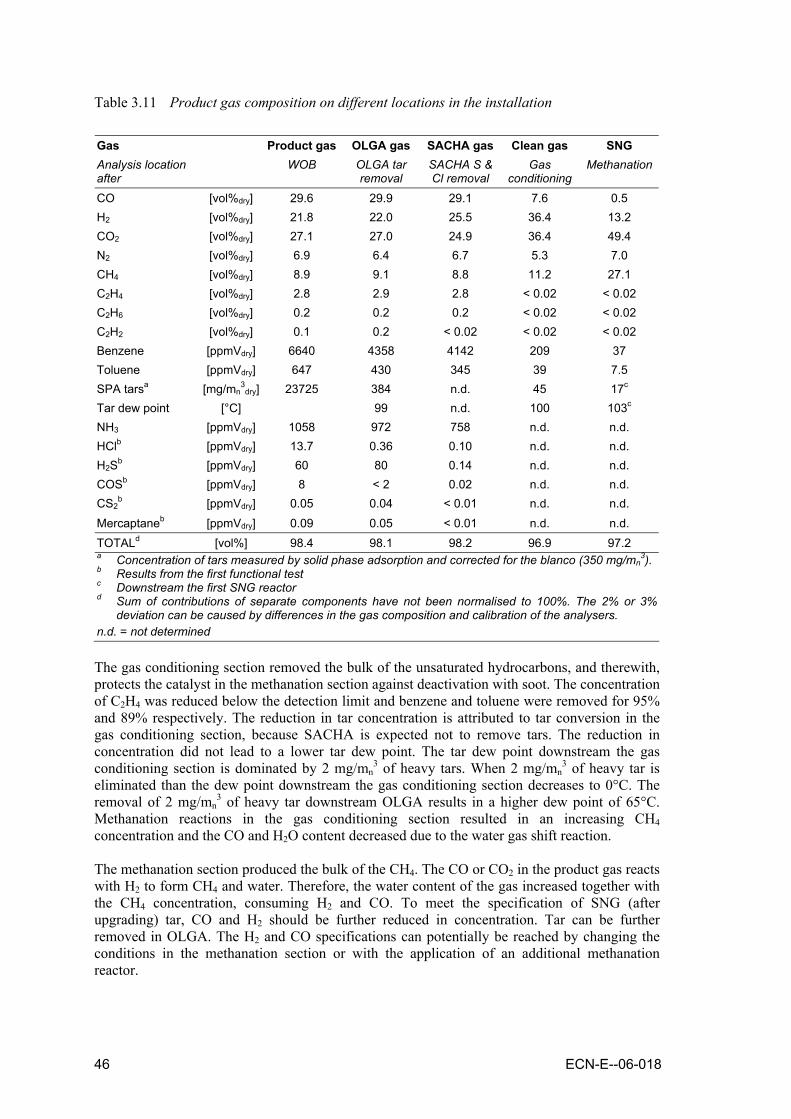
46 ECN-E--06-018
Table 3.11 Product gas composition on different locations in the installation
Gas Product gas OLGA gas SACHA gas Clean gas SNG Analysis location after
WOB OLGA tar removal
SACHA S & Cl removal
Gas conditioning
Methanation
CO [vol%dry] 29.6 29.9 29.1 7.6 0.5 H2 [vol%dry] 21.8 22.0 25.5 36.4 13.2 CO2 [vol%dry] 27.1 27.0 24.9 36.4 49.4 N2 [vol%dry] 6.9 6.4 6.7 5.3 7.0 CH4 [vol%dry] 8.9 9.1 8.8 11.2 27.1 C2H4 [vol%dry] 2.8 2.9 2.8 < 0.02 < 0.02 C2H6 [vol%dry] 0.2 0.2 0.2 < 0.02 < 0.02 C2H2 [vol%dry] 0.1 0.2 < 0.02 < 0.02 < 0.02 Benzene [ppmVdry] 6640 4358 4142 209 37 Toluene [ppmVdry] 647 430 345 39 7.5 SPA tarsa [mg/mn
3dry] 23725 384 n.d. 45 17c
Tar dew point [°C] 99 n.d. 100 103c NH3 [ppmVdry] 1058 972 758 n.d. n.d. HClb [ppmVdry] 13.7 0.36 0.10 n.d. n.d. H2Sb [ppmVdry] 60 80 0.14 n.d. n.d. COSb [ppmVdry] 8 < 2 0.02 n.d. n.d. CS2
b [ppmVdry] 0.05 0.04 < 0.01 n.d. n.d. Mercaptaneb [ppmVdry] 0.09 0.05 < 0.01 n.d. n.d. TOTALd [vol%] 98.4 98.1 98.2 96.9 97.2 a Concentration of tars measured by solid phase adsorption and corrected for the blanco (350 mg/mn
3). b Results from the first functional test c Downstream the first SNG reactor d Sum of contributions of separate components have not been normalised to 100%. The 2% or 3% deviation can be caused by differences in the gas composition and calibration of the analysers. n.d. = not determined The gas conditioning section removed the bulk of the unsaturated hydrocarbons, and therewith, protects the catalyst in the methanation section against deactivation with soot. The concentration of C2H4 was reduced below the detection limit and benzene and toluene were removed for 95% and 89% respectively. The reduction in tar concentration is attributed to tar conversion in the gas conditioning section, because SACHA is expected not to remove tars. The reduction in concentration did not lead to a lower tar dew point. The tar dew point downstream the gas conditioning section is dominated by 2 mg/mn
3 of heavy tars. When 2 mg/mn3 of heavy tar is
eliminated than the dew point downstream the gas conditioning section decreases to 0°C. The removal of 2 mg/mn
3 of heavy tar downstream OLGA results in a higher dew point of 65°C. Methanation reactions in the gas conditioning section resulted in an increasing CH4 concentration and the CO and H2O content decreased due to the water gas shift reaction. The methanation section produced the bulk of the CH4. The CO or CO2 in the product gas reacts with H2 to form CH4 and water. Therefore, the water content of the gas increased together with the CH4 concentration, consuming H2 and CO. To meet the specification of SNG (after upgrading) tar, CO and H2 should be further reduced in concentration. Tar can be further removed in OLGA. The H2 and CO specifications can potentially be reached by changing the conditions in the methanation section or with the application of an additional methanation reactor.
ECN-E--06-018 47
To meet the specification of SNG gas, additional upgrading downstream the methanation section will be necessary. The upgrading concerns the removal of CO2, and H2O and the reduction in N2 concentration. The bulk of the CO2 can be removed with a CO2 separation unit. The N2 in the SNG gas can be reduced by the replacement of the N2 purge on the biomass feeding system with a CO2 purge. The CO2 is available from the separation unit. Finally, the gas must be dehydrated. The upgrading can be done with available technology and was therefore not included in the experimental installation. As a conclusion, the integrated atmospheric gasification installation with atmospheric methanation has run properly. The impurities like dust, sulphur and chlorine have been removed sufficiently and the gas conditioning section removed the bulk of the unsaturated hydrocarbons. To meet the SNG specification, the system (OLGA and methanation section) must be optimised in tar, H2 and CO removal. In future development the process will be optimised by the application of an additional methanation reactor or by changing the methanation conditions. It is expected that the gas conditioning section also reduced the tar concentration from 345 mg/mn
3 to 39 mg/mn
3. Methanation reactions resulted in an increasing CH4 concentration and the CO and H2O content decreased due to the water gas shift reaction.

48 ECN-E--06-018
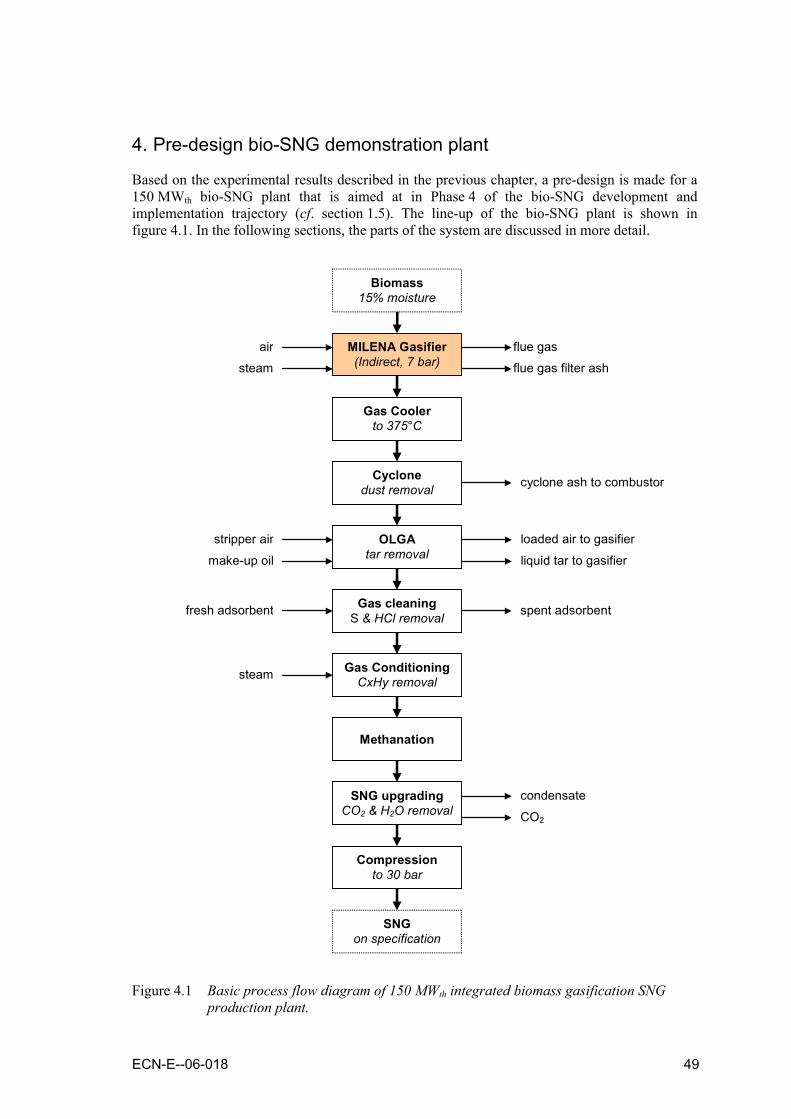
ECN-E--06-018 49
4. Pre-design bio-SNG demonstration plant
Based on the experimental results described in the previous chapter, a pre-design is made for a 150 MWth bio-SNG plant that is aimed at in Phase 4 of the bio-SNG development and implementation trajectory (cf. section 1.5). The line-up of the bio-SNG plant is shown in figure 4.1. In the following sections, the parts of the system are discussed in more detail.
OLGA tar removal
Methanation
Gas cleaning S & HCl removal
Gas ConditioningCxHy removal
Biomass 15% moisture
SNG on specification
make-up oil liquid tar to gasifier
fresh adsorbent spent adsorbent
steam
CO2
MILENA Gasifier (Indirect, 7 bar)
air
steam flue gas filter ash
flue gas
stripper air loaded air to gasifier
Cyclone dust removal cyclone ash to combustor
Gas Cooler to 375°C
Compression to 30 bar
SNG upgrading CO2 & H2O removal
condensate
Figure 4.1 Basic process flow diagram of 150 MWth integrated biomass gasification SNG production plant.

50 ECN-E--06-018
4.1 Gasifier In the MILENA gasifier the 15% wet biomass is converted into an N2-free product gas with high initial methane content. The gasification section is operated at 870°C with steam as fluidisation medium. For inertisation of the feeding system CO2 is used to prevent N2 dilution of the product gas. The sand is heated in the combustion section, which is operated at 965°C. The heat is produced by combustion of the gasification char. Also char-containing cyclone ash and liquid heavy tars separated in the OLGA collector are recycled to the combustor for combustion. Air is used as combustion medium. The full airflow originates from the OLGA Stripper and contains all the light tars that were removed from the product gas in OLGA absorber. Combustion ash leaves the combustor with the flue gas and is recovered in the flue gas filter. In table 4.1 the product gas compositions (on wet basis) are presented for the raw product gas after the gas cooler and the cleaned product gas after the gas cleaning. Calculations are made with the validated in-house ECN expert model for gasification and gas conditioning [25]. Tar concentrations are estimated based on experiments in the ECN lab-scale MILENA gasifier operated at 880°C.
Table 4.1 MILENA product gas compositions (wet basis) of the raw product gas after the gas cooler and after the gas cleaning
Product gas composition Raw product gas After gas cleaning CO vol% 17.35 25.89
H2 vol% 18.42 27.49
CO2 vol% 11.03 16.46
O2 vol% 0 0
H2O vol% 42.44 15.32
CH4 vol% 7.02 10.48
N2 + Ar vol% 0.043 0.064
C2H2 vol% 0.14 0.21
C2H4 vol% 2.24 3.34
C2H6 vol% 0.14 0.21
C6H6 (benzene) vol% 0.55 0.41
C7H8 (toluene) vol% 0.069 0.035
H2S ppmV 113 < 0.1
COS ppmV 13 < 0.1
NH3 ppmV 1,603 809
HCl ppmV 38 < 0.1
Tar g/mn3 30 0.2
LHV (incl. tar) MJ/mn3 10.28 12.90
HHV (incl. tar) MJ/mn3 11.10 14.03
CGE LHV % - 77.5 In the calculation of the impurities concentrations [25] it is assumed that 50% of the sulphur in the biomass fuel ends up in the product gas, of which 90% as H2S and 10% as COS (no CS2). The remainder is retained in the char or has formed volatile salt compounds that are removed as particles in the cyclone. For chloride it is assumed that 20% of the fuel chloride ends up as HCl in the gas, the remainder is removed as (potassium) salts in the cyclone. For fuel-nitrogen a conversion of 50% into NH3 is assumed, the other part is converted into N2 or retained in the char (no HCN).

ECN-E--06-018 51
4.2 Product gas cooler The product gas cooler has to cool the gas from 850°C at the outlet of the gasifier to 400°C. i.e. the operational temperature of the cyclone. Cooling of product gas is not a standard operation and in most biomass plants cooler fouling is a major source of reduced availability. There are very few examples of functioning gas coolers. Conventional water-tube coolers will foul very rapidly (within several hours) resulting in reduction of the cool capacity of up to 80%. Reference is made to the operational (and still unsolved) problems in the AMER 80 MWth CFB gasifier in Geertruidenberg, The Netherlands, which co-fires the cooled gas in a coal boiler after dust removal in a cyclone [26]. The only approach with positive references to prevent significant cooler fouling is to use a dedicated fire tube cooler upstream of the dust removal cyclone and to keep the cooler surfaces at high temperature. The coarse solids in the gas will continuously clean the inner pipe wall, i.e. erode the surface to prevent the build-up of deposit layers. This cooler approach has successfully been applied in the Värnamo 18 MWth pressurised air-blown CFB gasifier and at ECN in the 0.5 MWth atmospheric air-blown CFB gasifier. ECN uses a single-tube fire tube cooler with air as cooling medium. In Värnamo a fire tube cooler (multiple tubes; inner diameter of 5 cm) is used in which water is evaporated at 40 bar (250°C) to produce steam.
4.3 Cyclone The cyclone has to remove the bulk (typically ~95%) of the particles from the raw product gas. The cyclone is operated at 400°C to prevent tar condensation and fouling, and is positioned downstream the gas cooler, so the coarse particles can continuously clean the cooling surfaces. The remaining fine dust in the gas is removed in the OLGA unit (see below). The cyclone ash typically contains 60-80% carbon. The cyclone ash is recycled to the combustor of the MILENA.
4.4 OLGA tar removal In the OLGA unit, tars must be removed from the gas to specifications of (1) a tar dewpoint <10°C; (2) less than 10 mg/mn
3 phenol, and (3) less than 30 mg/mn3 naphthalene in the gas.
OLGA inlet temperature of the cooled and de-dusted product gas is 375°C, i.e. a 25°C temperature decrease due to heat losses is assumed over cyclone and the piping to the OLGA inlet. Total pressure drop over OLGA is less than 50 mbar. The tar removal in OLGA comprises three stages. In the first stage, ‘Collector’ the heavy tars are condensed from the gas by contacting the gas with cool oil scrubbing liquid. Most of the remaining dust is also removed with the scrubbing liquid. The remaining fine dust and entrained oil aerosols are removed in the second stage, i.e. the ‘Demister’. The combined scrubbing oil streams are cooled, passed through a separator, and returned to the first scrubber. In the separator the dust is removed as filter cake and the liquid heavy tars are continuously separated from the oil and recycled as “feedstock” to the combustor of the MILENA, resulting in complete destruction of the tars. In the third stage, the ‘Absorber’, the light tars are removed with oil. The Absorber is operated above the water dew point to avoid mixing of tar and water. The product gas after OLGA is “tar-free”, which means that downstream the OLGA tar-related problems are avoided. The Absorber scrubbing oil is regenerated in the ‘Stripper’, which is operated with air. The Stripper is equipped with a condenser to minimise oil losses. The stripper air is returned to combustor section of the gasifier where the tars are re-used/destructed. The regenerated Stripper oil is cooled in a cross heat exchanger by heating the tar-loaded oil from the Absorber.

52 ECN-E--06-018
With the OLGA process tars can be removed from up to 40 g/mn3 to a level in which the tar
dewpoint (i.e. the temperature at which tar condensation may occur) is below -5°C. Furthermore, the OLGA has also been demonstrated in lab-scale operation for cleaning of gasification gas for Fischer-Tropsch synthesis [18]. The OLGA process was developed at ECN and is commercialised by the Dutch company Dahlman Industrial Group. OLGA has been demonstrated in a 700 hour duration test downstream the ECN CFB gasifier from January to March 2006. Currently (May-June 2006), a 4 MWth pilot OLGA is commissioned, which is part of a semi-commercial pilot CHP plant in France.
4.5 Gas Cleaning In the gas cleaning HCl and sulphur components are removed with adsorbents. The concentration of both HCl and the total sulphur load in the product gas (i.e. H2S, COS, C2S, and organic sulphur) has to be reduced to below 100 ppbV. Commercial adsorbent materials are selected. The gas cleaning section is operated above the water dewpoint.
4.6 Gas conditioning The purpose of the catalytic gas conditioning is to convert all the unsaturated hydrocarbons in the clean product gas to useable CO, H2, and methane. The converted compounds comprise the alkenes and alkynes (ethylene and acetylene), as well as remaining traces of aromatic compounds (e.g. benzene, toluene, and naphthalene). Destruction of the alkenes and alkynes, i.e. ethylene and especially acetylene, is necessary to prevent soot formation on, and deactivation of, the downstream typically nickel-based methanation catalyst. Thermal or catalytic reforming options to remove these compounds also result in significant destruction of the desired product methane. Steam is added to the feed gas to ensure a sufficient H/C ratio to prevent (thermodynamic) soot formation. The feed gas inlet temperature is 350°C. In this catalytic section the water-gas shift also takes place, therefore, a separate shift step is not required. Furthermore, the NH3 in the gas will be converted into N2. Feed gas specifications to protect the catalyst are <100 ppbV for total sulphur and <100 ppbV chloride.
4.7 Methanation In the methanation section the cleaned and conditioned product gas has to be converted into SNG that meets the specifications after downstream water and CO2 removal. For methanation of CO and H2 containing gases, commercial processes and catalysts are available; both Lurgi and Haldor-Topsøe can deliver methanation systems. Typically, these methanation processes are carried out at higher pressures than foreseen in the bio-SNG plant, i.e. 20 to 30 bar compared to 7 bar. These systems are typically also designed with gas recycles or quenches or internally cooled reactors to control the temperatures to prevent thermal degradation of the catalysts. When the methanation is carried out at lower pressures, the adiabatic temperature increase is correspondingly lower. Resultantly, the methanation can be operated adiabatically without gas recycles and in simple vessels without internal cooling. Three methanation reactors, with intermediate cooling, are sufficient to reach sufficient CO and H2 conversion. Commercially available nickel-based catalysts are used.
4.8 SNG upgrading SNG upgrading to grid specifications comprise removal of water and CO2. The product gas from the methanation section typically contains 60 vol% of water. By cooling the gas to 40°C most of the water is condensed. The remaining water is removed in the CO2 removal step.
ECN-E--06-018 53
CO2 has to be removed from the raw SNG to meet the SNG specifications. The final CO2 concentration in the SNG is determined by the specification of the Wobbe Index (LHV) to be 44 MJ/mn
3. A large number processes is available for CO2 removal. Relevant aspects for process selection are the partial pressure of the CO2 and size of the installation. Several alternatives are possible for the scale of a 150 MWth plant. Considering the high partial pressure of CO2 both membranes and physical solvents can be chosen, where membranes are at their maximum scale and physical solvents are at their minimum scale. From the perspective of an outlook to possible future larger SNG production plants, a physical solvent system is most suitable. For the basic design, Selexol was selected. The Selexol process is based on absorption of CO2 in a solvent, based on a mixture of homologues of the dimethylether of polyethylene glycol. CO2 absorbs better than CH4 in this solvent. The process design for the bio-SNG produces a high purity CO2 product at atmospheric pressure, which is partly used for inertisation of the biomass feeding system of the gasifier. The product SNG is compressed from 7 bar to 66 bar for injection to the natural gas grid.

54 ECN-E--06-018

ECN-E--06-018 55
5. Full-scale commercial bio-SNG plant
5.1 Optimum system concept The optimum system concept is based on a gasifier that produces a (almost) nitrogen-free syngas (i.e. indirect gasifier) with preferably high amount of methane (i.e. low-temperature gasifier). The Milena gasifier can be operated at indirect gasification conditions and at a temperature of about 850°C producing such a syngas. Due to the (relatively) low temperature the syngas will, however, contain tars as well. These tars can be removed with the OLGA tar removal technology developed by ECN. The tars are recycled to the gasifier in order to increase efficiency, whereas the tar free syngas is cleaned from other contaminants (e.g. sulphur and chlorine). The clean syngas can than be fed to a combined shift and methanation process, converting the syngas into SNG. After methanation, further upgrading (e.g. CO2 and H2O removal) is required in order to comply with the desired SNG specifications. All (main) process steps are schematically presented in figure 5.1.
indirect gasifier MILENA
OLGA tar reduction
CH4 synthesis
gas upgrading
100% biomass
approx. 70% SNG
approx. 80% product gas
850°C
methanation: 3 H2 + CO CH4 + H2O shift: CO + H2O CO2 + H2
further gas cleaning
tar recycle
Figure 5.1 Schematic presentation of the optimum SNG production system
As the SNG is injected in the HTL network (chapter 2) compression has to take place somewhere along the production line. This can either be done by (front-end) pressurised gasification or (back-end) syngas compression. In case of syngas compression, the compression will preferably take place after cleaning (i.e. compression of tar free syngas) but before methanation (i.e. smaller methanation and CO2 removal at elevated pressure to allow pressure swing absorption). In both cases the SNG product will become available at the desired 66 bar.
5.2 Integrated system analysis The mass and energy balances for two integrated systems of SNG production with MILENA were determined. A 100 MWth case with gasification, gas cleanup and methanation at atmospheric pressure and a 100 MWth case with gasification, gas cleanup and methanation at 7 bar are considered. The MILENA gasifier was modelled based on in-house data of the expected operation of MILENA at 100 MWth. After the raw product gas is cooled, OLGA removes the tars. The tar dew points of the raw product gas for the 1 atmosphere and 7 bar cases were respectively circa 270°C and circa 320°C.

56 ECN-E--06-018
Therefore, for the gas inlet temperature of the OLGA collector respectively 320°C and 350°C were chosen. The water dew points of the raw product gas were respectively circa 75°C and circa 130°C. Therefore, for the oil inlet temperature of the OLGA collector respectively 80°C and 140 °C were chosen. The collector removes tars heavier than naphthalene for more than 99%. These tars are fed back to the Milena combustor. In the OLGA absorber the remaining tars and some of the BTX are removed with scrubbing oil. The operating temperatures are 80°C and 140°C for respectively the 1 atmosphere and 7 bar case. Although the higher pressure of the 7 bar case improves the performance of the OLGA absorber, the higher temperature reduces the performance. The absorber at 7 bar does however remove more BTX than the absorber at 1 atmosphere. The tars are removed from the scrubbing oil in the OLGA stripper with hot air. Because of the good performance of the stripper, the operating temperatures are chosen fairly low, respectively 15°C and 21°C for the 1 atmosphere and 7 bar case. The stripping air loaded with the tars is fed to the combustor. This is done after cooling to respectively 120°C and 140°C for the 1 atmosphere and 7 bar case to remove most of the evaporated scrubbing oil, and re-heating to 400°C. After the OLGA absorber, the product gas is cleaned from sulphur and chlorine containing components at 300°C. Guard beds remove remaining heavy tar components at 80°C. In the 7 bar case this has to be done above the water dew point, thus at 140°C. The methanation is modelled in three adiabatic reactors with cooling in-between the reactors. The first reactor has an inlet temperature of 400°C and the second and third one an inlet temperature of 250°C. In the case of the atmospheric methanation the CO concentration becomes less than 0.1% in the final product, however, the hydrogen content still remains fairly high: at approximately 4% in the final product. For the case of the 7 bar system the hydrogen content ends up lower than two percent in the end product. For the CO2 removal the gas has to be at 7 bar and most of the water has to be removed. In the case with atmospheric methanation the raw SNG is first cooled to 5°C to remove water, then compressed to 7 bar and again cooled to 5°C to remove even more water. In the case of methanation at 7 bar, the raw SNG product is just cooled once to 5°C. During the CO2 removal as much CO2 is removed as is necessary to reach the Wobbe-index. Finally, the SNG product is compressed to 66 bar. The composition of the final SNG product is given in table 5.1. The CO2 from the process corresponds to approximately 50% of the carbon balance of the plant. This CO2 can be stored in e.g. empty gas fields and/or used for enhanced oil recovery. Corresponding additional economic benefits are not included in the calculations.
Table 5.1 Composition of the SNG product
Component Composition (1 atmosphere) Composition (7 bar) CO 0.06 0.04 H2 4.22 1.86
CO2 4.68 5.13 H2O 0.00 0.00 CH4 90.40 92.33 N2 0.64 0.65
With a steam cycle, power is produced from the net heat production. Power is consumed in compressing the raw and/or final SNG product. In the 7 bar case also air and CO2 is compressed for the use in the stripper and the gasifier. The flue gas of the combustor is expanded in a turbine5. The power consumption and production of each of these operations is given in table 5.2. Interestingly, the net power production is higher in the case of the 7 bar gasification. This is probably because the air compression is done at low temperatures, but the flue gas expansion is at high temperature. 5 Due to complexity flue gas expansion might in practice not be implemented, lowering the net power production.

ECN-E--06-018 57
Table 5.2 Power consumption and generation
1 atm (MWe) 7 bar (MWe) Steam cycle 8.5 7.2
Air Compression -2.5 CO2 compression -0.1 Fluegas expansion 5.15
Raw SNG compression -1.2 CO2 removal -1.0 -1.0
SNG compression -0.8 -0.8 Net power production 5.6 8.0
In table 5.3 the overall energy yields of the integrated systems for SNG production are given. The SNG yield is almost equal for both cases, the yield of power however is higher for the 7 bar case than for the atmospheric system due to the fact that the additional power required in the pressurized system for compressing the gasifier air is not very high (low temperature) and because the additional power output from flue gas expansion. Furthermore, the compression energy of the raw SNG before CO2 removal is avoided in the pressurized system. Table 5.3 Overall yields
1 atmosphere 7 bar SNG yield 68.5% 68.4%
Power yield 5.6% 8.0%
5.3 Market analysis Based on the above system analysis, economic calculations were done for four different integrated systems for SNG production. These four systems included the two 100 MWth systems that were modelled and also a 10 MWth case at atmospheric pressure and a 1000 MWth case at 7 bar. The capital costs for these four cases were calculated based on literature, and in-house sources. The results are given in table 5.4.
Table 5.4 Total capital costs for four different SNG production systems.
M€ 10 MWth
atmospheric 100 MWth
atmospheric 100 MWth
7 bar 1000 MWth
7 bar Milena 5.0 25.1 39.9 200.0 Cooler & filter 3.6 11.3 6.6 21.0 OLGA a 1.4 4.8 2.8 8.8 S & Cl cleaning 1.5 7.6 7.6 38.3 Methanation 5.8 18.3 10.7 55.0 CO2 removal 0.4 2.0 2.0 10.2 Steam cycle 4.5 14.3 13.2 41.7 Product compressor 0.3 2.5 2.5 17.5 Total investment 23 86 85 390
a The consequences of operation of the OLGA system at elevated pressure have not yet been evaluated. Hence, the cost estimate for operation at 7 bar is preliminary and not to be used for future reference.
The SNG production costs are determined on the basis of a method used by ECN Policy Studies for calculations of MEP tariffs6. For the biomass cost a figure of 4 €/GJ was assumed for the 100 and 1000 MWth cases (e.g. imported biomass) and 2 €/GJ for the 10 MWth case (i.e. locally available biomass). This results in the costs given in table 5.5.
6 Depreciation time 10 years, (effective) interest rate 5.8%, operational time 7500 hours/year, operation and maintenance costs (O&M) costs 8.6% of investment, but for small plants (e.g. 10 MWth) 10% of investment, electricity price 37 €/MWe.

58 ECN-E--06-018
Table 5.5 SNG production costs
10 MWth
atmospheric 100 MWth
atmospheric 100 MWth
7 bar 1000 MWth
7 bar Capital charge (M€/year) 3.0 11.6 11.5 52.8 O&M costs (M€/year) 2.3 7.4 7.3 33.8 Biomass costs (M€/year) 0.5 10.8 10.8 108.0 Total SNG production costs (€/GJ) 30.8 15.3 14.8 9.3
Taking into consideration a natural gas price of 6 €/GJ, it is clear that for all production systems, bio-SNG is more expensive than natural gas. In table 5.6 the necessary support for SNG to be competitive with natural gas is given. These costs are very high compared to the current trading price of CO2 (EU allowance) of ca. 20-25 €/t CO2. However, current support schemes in Europe for biofuels given subsidies in the order of several hundreds of euros per tonne CO2. The required subsidy for bio-SNG in €ct/kWh of SNG can de compared with current Dutch MEP subsidies for renewable electricity production. Although these MEP subsidies are subject to political choice the current range for electricity from biomass is 6.0-9.7 €ct/kWh, the exact figure depending on the type of biomass used and the size of the installation. These are, however, subsidies per kWh electrical power and not SNG, but still the required support for SNG produced at 100 or 1000 MWth scale does not seem totally unrealistic, hence a subsidy on SNG similar to the MEP subsidy on renewable electricity production might well lead to implementation of SNG production facilities.
Table 5.6 Necessary support for production of SNG
10 MWth
atmospheric 100 MWth
atmospheric 100 MWth
7 bar 1000 MWth
7 bar
Carbon abatement costs7 (€/t CO2) 442 165 158 59 Required subsidy (€/GJ) 24.8 9.3 8.8 3.3 Required subsidy (€ct/kWh) 8.9 3.3 3.2 1.2
With such a financial incentive required for SNG this also means that SNG, like renewable electricity, will mainly focus on application within the domestic natural gas market and not the industrial market. Assuming, however, that similar to renewable electricity approximately one third of the domestic consumers would switch from “grey” natural gas to “green” natural gas (i.e. without having to pay more) the potential market for SNG in the Netherlands would be approximately 110 PJ a year (i.e. the total gas consumption by Dutch domestic consumers in 2003 was 336 PJ/yr [1]). This market might even be bigger considering the fact that also numerous (small) companies are willing to buy renewable electricity, hence SNG as well.
7 Indirect emissions for the production and distribution of natural gas as well as possible CO2 storage are not taken into account.

ECN-E--06-018 59
6. Conclusions & Continuation
6.1 Conclusions 1. With the natural gas consumption representing almost 50% of the Dutch (primary) energy
consumption, substituting natural gas by a renewable equivalent is an interesting option to significantly reduce the use of fossil fuels and the accompanying greenhouse gas emissions.
2. Renewable equivalents to natural gas include (upgraded) biogas and landfill gas. Due to the
limited availability of suitable feedstock / fuel however, and the defined ambition to replace a significant part of the natural gas consumption in (near) future, synthetic natural gas (SNG) produced via biomass gasification should be included.
3. Large quantities of SNG will, from metering and regulating as well as trading point of view,
most likely be injected in the High-pressure Transmission Lines (HTL) of the existing natural gas infrastructure.
4. The supplied gas has to meet strict specifications, regarding composition, Wobbe-index,
calorific value, and relative density, in order to be transported, stored or marketed in the Netherlands without causing damage to either transmission system or consumer applications.
5. In order to demonstrate that bio-SNG can comply (at least after blending) with these
specifications, an experimental lab-scale line-up for SNG production from biomass has been successfully developed and implemented.
6. The technical feasibility of the production of SNG from biomass is demonstrated by tests
with integrated biomass gasification, gas cleaning, and methanation experiments. 7. Three functional tests were performed with the final system line up; in the 1st functional test
the gas cleaning was tested for the removal of tar, sulphur and chlorine compounds, the 2nd test was performed to investigate the removal of unsaturated hydrocarbons in the gas conditioning section, and the 3rd test was done with the integrated installation to obtain the performance of the methanation section.
8. The 1st and 3rd functional tests were successful; during the 2nd test the catalyst in the gas
conditioning section lost activity within 15 minutes due to soot formation. In the 3rd functional test, the conditions of the gas conditioning section were changed, which solved the problem of deactivation.
9. The integrated atmospheric gasification installation with atmospheric methanation has run
properly; the impurities like dust, sulphur and chlorine has been removed sufficiently and the gas conditioning section removed the bulk of the unsaturated hydrocarbons.
10. To meet the SNG specification, the system (OLGA and methanation section) must be
optimised in tar, H2 and CO removal; there is enough room for optimisation. 11. The optimum SNG system concept is based on a gasifier that produced a (almost) nitrogen-
free gas (i.e. indirect gasifier) with preferably high amount of methane (i.e. low-temperature gasifier).

60 ECN-E--06-018
12. As the SNG is injected in the HTL network, compression has to take place either by (front-end) pressurised gasification or (back-end) syngas compression; although the overall SNG yield is almost equal for both cases, the additional yield of power is higher in case of pressurised gasification.
13. Although bio-SNG will be more expensive than natural gas now, the necessary support for
future SNG to be competitive with present natural gas might even be below 60 €/t CO2 carbon abatement costs or almost 1 €ct/kWhSNG; a subsidy on SNG similar to the MEP subsidy on renewable electricity production (6.0-9.7 €ct/kWh) might well lead to implementation of SNG production facilities.
14. Assuming similarity between the market for green electricity and green natural gas, and
approximately one third of the domestic consumers would switch from “grey” natural gas to “green” natural gas (i.e. without having to pay more). This corresponds to approximately 110 PJ a year or almost 7.5% of the annual natural gas consumption in the Netherlands.
6.2 Continuation In the Dutch energy research strategy EOS long-term biomass gasification program a specific target on SNG production is listed. SNG is specifically for the Netherlands a sensible option to sustain part of both the heat and power production as well as of the transportation fuels because of the existing infrastructure and harbours. The Proof-of-Principle phase has successfully finished and a pilot plant of 800 kWth has been developed and the engineering for such a pilot is almost finished, and a go-no-go decision will be made in 2006, mainly depending on the availability for investment. The production of SNG from biomass is expected to become much more efficient compared to options that might be realised on short term with “available” technologies. For high-efficient SNG-systems to become available, R&D should focus on pressurised indirect gasification, self-gasification, high-temperature tar reduction, OLGA, dry sulphur and chlorine removal, and SNG synthesis. The main activities with regards to this SNG related R&D comprise: • Develop MILENA indirect gasification technology (i.e. perform tests with lab-scale
MILENA to determine “window of operation”, supporting tests with cold-flow facility, construct and test 800 kWth pilot-scale MILENA indirect gasifier with connections with existing gas cooler and cleaning units, and perform study on the effects of increasing pressure of MILENA indirect gasification technology.
• Prepare 10 MWth MILENA demonstration plant together with industry and ultimately realise large-scale pressurised plants with MILENA gasifier for high-efficient SNG production.
• Develop filter/OLGA for operation in pressurised system with indirect gasifier for future biomass-to-SNG systems.
• Develop SNG catalytic reactor concepts including material selection, operating conditions, etc. fully integrated with indirect gasifier and (dry) gas cleaning.
• Develop pressurised self-gasification technology for high-efficient biomass-to-SNG systems.
• Develop high-temperature tar reduction (catalytic, partial oxidation, corona) for future biomass-to-SNG systems, avoiding tar-related cooler problems.

ECN-E--06-018 61
References
[1] Statistics Netherlands (CBS), 2006. (www.cbs.nl)
[2] IEA World energy outlook, 1999 (ISBN 92-64-17140-1)
[3] J. Gigler, H. Boerrigter, M. van Burgel, P. Cnubben, R. Hoogma and J. Wempe: Vol gas vooruit; De rol van groen gas in de Nederlandse energiehuishouding, startnotitie voor de werkgroep Groen Gas. On behalf of “Platform Nieuw Gas”, 20 June 2006, The Netherlands.
[4] H. P. Calis, J. P. Haan, H. Boerrigter, A. van der Drift, G. Peppink, R. van den Broek, A. Faaij and R. H. Venderbosch: Technical and economic feasibility of large scale synthesis gas production in the Netherlands from imported biomass feedstock – a Strategic Decision Analysis study. Pyrolysis and gasification of biomass and waste, 30 September - 1 October 2002, Strasbourg, France
[5] A. Faaij, R. van den Broek, B. C. W. van Engelenburg and E. Lysen: Worldwide potential of bio-energy and possibilities for large scale international trade; - technical analysis and policy aspects. In the proceedings of the 5th international conference on greenhouse gas control technologies, 2000.
[6] A. van der Drift, R. van Ree, H. Boerrigter and K. Hemmes: Bio-syngas: key intermediate for large scale production of green fuels and chemicals. In the proceedings of the 2nd World Conference on Biomass for Energy, Industry, and Climate Protection, 10-14 May 2004, Rome, Italy.
[7] H. Boerrigter and A. van der Drift: Biomass pre-treatment for biomass-to-liquids (BTL) plants. ECN, ECN-CX--05-087, 2005, The Netherlands (confidential).
[8] R.W.R. Zwart, H. Boerrigter and A. van der Drift: Integrated Fischer-Tropsch diesel production systems. ECN, ECN-CX—06-033, 2006, The Netherlands (confidential).
[9] A. van der Drift, C. M. van der Meijden and H. Boerrigter: MILENA gasification technology for high efficient SNG production from biomass. In the proceedings of the 14th European Biomass Conference & Exhibition, 17-21 October 2005, Paris, France.
[10] Gas Transport Services (GTS), 2006 (www.gastransportservices.nl).
[11] Gasunie Corporation, 2006 (www.gasunie.nl).
[12] Nederlandse Gasunie N.V. Annual report, 2003.
[13] Personal communication with F. Noltes (GTS), 15-12-2005.
[14] M. Elderman, H. Y. Becht and B. J. C. M. Rutten: Gefaseerde inzet van waterstof in de energie-infrastructuur van aardgas. Centrum voor energiebesparing en schone technologie, 1990, The Netherlands.
[15] GTE Interoperability Report, 2001.
[16] J. Wardzinski, M. M. Foss and F. Delano: Interstate natural gas - quality specifications & interchangeability. Center for Energy Economics, Houston, USA.

62 ECN-E--06-018
[17] Personal communication with F. Noltes (GTS), 24-5-2005.
[18] H. Boerrigter, H.P. Calis, D.J. Slort, H. Bodenstaff, A.J. Kaandorp, H. den Uil and L.P.L.M. Rabou: Gas cleaning for integrated biomass gasification (BG) and Fischer-Tropsch (FT) systems. ECN, ECN-CX--04-004, 2004, The Netherlands (confidential).
[19] A. van der Drift: An overview of innovative biomass gasification concepts. In the proceedings of the 12th European Conference on Biomass for Energy, 17-21 June 2002, Amsterdam, The Netherlands.
[20] S.V.B. van Paasen and J.H.A. Kiel: Tar formation in a fluidised-bed gasifier: Impact of fuel properties and operating conditions. ECN, ECN-C--04-056, 2004, The Netherlands.
[21] H. Boerrigter, S.V.B. van Paasen, P.C.A. Bergman, J.W. Könemann, R. Emmen and A. Wijnands: "OLGA" tar removal technology. ECN, ECN-C--05-009, 2005, The Netherlands.
[22] H. Boerrigter, S.B.V. van Paasen, P.C.A. Bergman, J.W. Könemann and R. Emmen: Tar removal from biomass product gas; development and optimisation of the OLGA tar removal technology. In the proceedings of the 14th European Biomass Conference & Exhibition, 17-21 October 2005, Paris, France.
[23] S.V.B. van Paasen, M.K. Cieplik and N.P. Phokawat: Gasification of non-woody biomass - Chlorine and Sulphur removal; economical and technical perspectives. ECN, ECN-CX--06-080. 2006, The Netherlands (confidential).
[24] E. Deurwaarder, H. Boerrigter, H. Mozaffarian, L.P.L.M. Rabou and A. van der Drift: Methanation of MILENA product gas for the production of bio-SNG. In the proceedings of the 14th European Biomass Conference & Exhibition, 17-21 October 2005, Paris, France.
[25] ECN gasification and gas cleaning expert model "VERGAS17". ECN, 2006, The Netherlands.
[26] A. van der Drift and J.R. Pels: Product gas cooling and ash removal in biomass gasification. ECN, ECN-C--04-077, 2004, The Netherlands.