production and use of ict: a sectoral … · production and use of ict: ... (ict) plays two roles...
TRANSCRIPT
OECD Economic Studies No. 35, 2002/2
47
© OECD 2002
PRODUCTION AND USE OF ICT: A SECTORAL PERSPECTIVE ON PRODUCTIVITY GROWTH
IN THE OECD AREA
Dirk Pilat, Frank Lee and Bart van Ark
TABLE OF CONTENTS
Introduction ................................................................................................................................. 48
Growth and productivity performance in ICT-producing and ICT-using industries............ 49The ICT-producing sector ....................................................................................................... 49Measuring growth in the ICT-producing sector.................................................................... 51Labour productivity growth in ICT-producing industries................................................... 52Does ICT use increase productivity growth? ....................................................................... 56Labour productivity growth in ICT-using industries ........................................................... 58The impact of ICT use and production on aggregate productivity growth ...................... 61
The contribution of ICT production and use to MFP growth ................................................. 63
Annex I. Sensitivity of production growth in the computer industry to price indexes......................................................................................................... 69
Annex II. Measuring labour productivity and multifactor productivity .............................. 71
Bibliography ................................................................................................................................ 76
OECD Economic Analysis and Statistics Division, OECD Industry Division, and University of Groningen andthe Conference Board, respectively. We are grateful to Robert Inklaar, Karine Lepron, Chai So andColin Webb for their help in preparing this paper, and for useful comments from Thomas Andersson,Martine Durand, Robert McGuckin, Someshwar Rao, Paul Schreyer, Candice Stevens and Andrew Wyckoff.Previous versions of this paper were discussed by the Statistical Working Party and the OECD Committeefor Industry and Business Environment. Participants of these meetings provided helpful comments.

48
© OECD 2002
INTRODUCTION
The strong growth performance of the United States over the 1990s and theuneven performance of other OECD economies have led to new attention for thesources of growth in OECD economies. Studies over the past few years (Scarpetta,et al., 2000; Gust and Marquez, 2000; OECD, 2001a) have demonstrated that there isno single factor that explains divergence in growth performance. Rather, OECD coun-tries that improved performance in the 1990s were generally able to draw more peo-ple into employment, increase investment, and improve multifactor productivity(MFP) growth.
Information and communications technology (ICT) plays two roles in thisprocess, first by contributing heavily to the increase in overall investment andthus to capital deepening, second by contributing to MFP growth. The role of ICTinvestment in growth performance is confirmed by a range of empirical studies,for both the United States and several other OECD countries (e.g. Colecchia andSchreyer, 2001; Jorgenson, 2001; Van Ark, et al. 2002a). The strength of ICT invest-ment is commonly attributed to rapid technological progress and strong com-petitive pressure in the production of ICT goods and services, which havecontributed to a steep decline in ICT prices. This price fall, together with thegrowing scope for application of ICT, has encouraged investment in ICT, at timesshifting investment away from other assets.
The contribution that ICT has made to MFP growth is more controversial. Somestudies for the United States have argued that the pick-up in MFP in the second halfof the 1990s was primarily due to technological progress in the production of ICTgoods and services (Gordon, 2000). Technological progress at Intel, for instance, hasenabled the amount of transistors packed on a microprocessor to double every18 months since 1965, and even more rapidly so between 1995 and 1999. The rela-tive importance of the ICT-producing sector in different countries, and its growthover time, might thus be one factor contributing to the differences in growth perfor-mance that have been observed in several OECD countries in recent years. Anempirical examination of this issue is the first goal of this paper.
If the rise in MFP due to ICT were little more than a reflection of rapid techno-logical progress in the production of computers, semi-conductors and relatedproducts and services, there would be no effects of ICT on MFP in countries thatare not already producers of ICT. For ICT to have benefits on MFP in countries that

Production and Use of ICT: a Sectoral Perspective on Productivity Growth in the OECD Area
49
© OECD 2002
do not produce ICT goods, it needs to have productivity impacts linked to its usein the production process. Some studies for the United States have attributed asubstantial part of the pick-up in US MFP growth to ICT-using sectors, notably ser-vices (Baily, 2002; Triplett and Bosworth, 2002). This would mark a change with thepast, as the productivity record of many services sectors has often been poor. Theapplication of ICT may have allowed some of these sectors to strengthen produc-tivity performance, at least in some countries. The second issue addressed in thispaper is therefore an empirical, cross-country examination of productivity growthin the ICT-using sectors, notably services.
Since estimates of MFP growth at the sectoral level can only be derived for afew OECD countries, the paper will first examine the contribution of ICT-producingand ICT-using sectors to labour productivity growth. Attention will also be given tothe measurement problems that complicate productivity analysis in ICT-producingand ICT-using sectors. The final section examines the contribution of ICT-producingand ICT-using sectors to MFP growth and draws some conclusions.
GROWTH AND PRODUCTIVITY PERFORMANCE IN ICT-PRODUCING AND ICT-USING INDUSTRIES
The ICT-producing sector
The ICT producing-sector, as defined by the OECD (Box 1), accounts for only asmall share of the economy. Its share in business employment ranges frombetween 3.7 per cent (in Portugal) to 10.9 per cent (in Finland) (OECD, 2002a). Itsshare in value added is slightly larger, showing that it has an above-average levelof labour productivity, and ranges from 4.9 per cent in Greece, to 16.5 per cent inIreland of business sector value added (Figure 1). ICT manufacturing is typicallyonly a small part of this total and ranges between 1.3 and 13.8 per cent of manu-facturing employment, and between 1.5 and 21.5 per cent of manufacturing valueadded. Finland and Ireland have the largest ICT manufacturing sectors, followedby Korea. New Zealand, Spain and Australia, in contrast, have only a small sectorproducing manufactured ICT goods (OECD, 2002a).
The relative size of the service part of the ICT sector also varies considerablyacross countries, with Germany, Japan, Korea and Mexico having a relatively smallICT service sector. Some of this variation is linked to the telecommunications sector,which is very large in Portugal and the Czech Republic, and quite small in Mexico,Korea and Italy. Another part is linked to computer and related services, the sectorthat accounts for much of the production of software. This sector is particularly largein Ireland, Sweden and Belgium (OECD, 2002a).

OECD Economic Studies No. 35, 2002/2
50
© OECD 2002
Box 1. OECD definition of ICT-producing industries
In 1998, OECD countries reached agreement on an industry-based definitionof the ICT sector based on International Standard Industry Classification (ISIC)Revision 3. The principles are the following: for manufacturing industries, theproducts of an industry must be intended to fulfil the function of information pro-cessing and communication including transmission and display, or must use elec-tronic processing to detect, measure and/or record physical phenomena or controla physical process. For services industries, the products must be intended toenable the function of information processing and communication by electronicmeans. The following industries were included:
Manufacturing
3000 Manufacture of office, accounting and computing machinery.
3130 Manufacture of insulated wire and cable.
3210 Manufacture of electronic valves and tubes and other electroniccomponents.
3220 Manufacture of television and radio transmitters and apparatus forline telephony and line telegraphy.
3230 Manufacture of television and radio receivers, sound or video recordingor reproducing apparatus, and associated goods.
3312 Manufacture of instruments and appliances for measuring, checking,testing, navigating and other purposes, except industrial process controlequipment.
3313 Manufacture of industrial process control equipment.
Services
5150 Wholesale of machinery, equipment and supplies.
7123 Renting of office machinery and equipment (including computers).
6420 Telecommunications.
7200 Computer and related activities (hardware consultancy, software consul-tancy and supply, data processing, database activities, maintenanceand repair of office, accounting and computing machinery, other).
Source: OECD (2002a).

Production and Use of ICT: a Sectoral Perspective on Productivity Growth in the OECD Area
51
© OECD 2002
While the ICT-producing sector is relatively small, it can make a relatively largecontribution to growth and productivity performance if it grows more rapidly than theremainder of the economy. Bivariate correlations point to a positive correlationbetween the size of the ICT manufacturing sector and MFP growth, but this is mainlydue to the position of Finland and Ireland (OECD, 2001a).1 A positive correlationshould be expected, since the ICT manufacturing sector typically has very high rates oftechnological progress and MFP growth. However, some countries with a relativelysmall ICT sector, such as Australia, have also experienced high MFP growth, suggestingthat a large ICT sector is not a necessary condition for improvements in MFP growth.2
Measuring growth in the ICT-producing sector
Examining the role of ICT-producing sectors in economic growth is heavilyinfluenced by measurement problems, both regarding outputs and inputs. Thekey measurement problem for the manufacturing of ICT goods on both the output
Figure 1. The share of the ICT sector in the economyShare of the ICT sector in value added of the non-agricultural business sector, 2000
1. 1999.2. 1998.3. Excludes rental of ICT (ISIC 7123).4. Includes postal services.5. Excludes ICT wholesale (ISIC 5150).6. Includes only part of computer-related activities.7. 2000-2001.Source: OECD (2002), Measuring the Information Economy, www.oecd.org/sti/measuring-infoeconomy, Paris.
% %20
0
15
10
5
20
0
15
10
5
Irelan
d1,
3
Finlan
d
Korea
1, 3
United
Sta
tes
New Z
ealan
d4
Sweden
Hunga
ry1
United
King
dom
Nethe
rland
s
Belgium
3
OECD 25
Japa
n5,
6
Czech
Rep
ublic3,
5
Norway
Canad
a2
EU 14
Denm
ark
Franc
e
Portu
gal1, 3
Austri
a
Austra
lia7
Spain
Italy
Germ
any1,
3, 5
Mex
ico
Slovak
Rep
ublic1,
3, 5
Greec
e1,
3, 4
, 5

OECD Economic Studies No. 35, 2002/2
52
© OECD 2002
and input side concerns prices, in particular how to statistically capture significantquality improvements associated with technological advances in goods such as com-puters and semi-conductors. The use of hedonic deflators is generally considered asthe best way to address these problems (Box 2; OECD, 2002b).3
The measurement of output in the telecommunications industry also raisesproblems. Some countries use consumer price indexes of phone rates to deflatevalue added; others use physical quantity indexes of calls, telexes, and other ser-vices to measure volume changes in output; and some countries use a compositeindex of producer price indices for relevant components (OECD, 1996). Most ofthese methods do not address key measurement problems in this sector,i.e. quality change, adjustment for new products and services, the separation ofgoods and services, and increased price differentiation. A recent overview of pricemeasures for telecommunications services still shows a considerable variety inapproaches across the OECD (OECD, 2000a).
Measurement in the third component of the ICT-producing sector, the com-puter services industry, also raises certain problems. This sector includes difficult-to-measure services, such as hardware and software consultancy services, andmaintenance and repair of computer equipment, but also includes several activi-ties where quality has changed rapidly over time and hedonic deflators may beneeded. These include the development, production and supply of customisedand non-customised software, as well as data processing and database activities.Currently, the United States is among the few countries that applies hedonicmethods to estimate price indices for pre-packaged software (OECD, 2000b).4
The methodological differences highlighted above affect cross-country compar-isons of productivity. Adjusting for these differences is no simple task, as it is notclear, a priori, to what extent differences in output and value added deflators forthese industries are due to measurement (e.g. the use of hedonic deflators) or to dif-ferences in industrial specialisation. However, countries that produce computersand semi-conductors, but that apply conventional deflators (e.g. Korea), are likely tounderestimate output and productivity growth in this industry (see Annex 1). Recentwork (Van Ark, et al., 2002b) has applied US deflators to the measurement of outputin ICT manufacturing in other countries. This demonstrates the potential size andsignificance of the problem, although it may overstate growth in the ICT-producingsector of certain countries that are less specialised than the United States in produc-ing ICT goods characterised by very rapid price declines. Clearly, more work on thedevelopment of appropriate hedonic deflators in each country is warranted.
Labour productivity growth in ICT-producing industries
The contribution of the ICT-producing sector to recent growth performancereflects the productivity performance of the different ICT-related industries and

Production and Use of ICT: a Sectoral Perspective on Productivity Growth in the OECD Area
53
© OECD 2002
Box 2. The use of hedonic deflators in the ICT-producing sector
Several countries currently use hedonic methods to deflate output in thecomputer industry (e.g. Canada, Denmark, France, Sweden and the United States).The production price deflator for the computer industry (ISIC Rev 3, Division 30) isshown in Figure 2.* It shows a very rapid decline in production price indices forFrance and the United States, and a gradual decline in Denmark since 1984, butrelatively little change in some other countries. These differences may partlyreflect the use of a hedonic deflator in both France and the United States, the useof an exchange rate adjusted US hedonic deflator by Denmark, and the use ofconventional deflators in the other countries.
Adjusting for these methodological differences in computer deflators for the pur-pose of a cross-country comparison is difficult, however, since there are considerablecross-country differences in industrial specialisation. Only few OECD countriesproduce computers, where price falls have been very rapid; many only produceperipheral equipment, such as computer terminals. Similar differences in industrycomposition exist in Radio, Television and Communication Equipment (ISIC 32),which includes the semi-conductor industry. The differences in the composition of
Figure 2. Producer price indexes for the computer industry, 1995 = 100
Source: OECD calculations on the basis of the STAN database.
250
19850
200
150
100
50
250
0
200
150
100
50
1986 1987 1988 1989 1990 1991 1992 1993 1994 1995 1996 1997 1998 1999 2000
AustriaUnited States
Italy
Denmark
Korea
France
Finland
250
19850
200
150
100
50
250
0
200
150
100
50
1986 1987 1988 1989 1990 1991 1992 1993 1994 1995 1996 1997 1998 1999 2000
AustriaUnited States
Italy
Denmark
Korea
France
Finland

OECD Economic Studies No. 35, 2002/2
54
© OECD 2002
their weight in the economy (see Annex 2). The OECD STAN database provideshelpful information in this regard. While it does not cover all components of theICT sector separately, the role of key industries has been examined.5
Figure 3a shows the contribution of ICT manufacturing to labour productivitygrowth over the 1990s, distinguishing between the first and second half of thedecade.6 In most OECD countries, the contribution of ICT manufacturing to overalllabour productivity growth has risen over the 1990s. This can primarily be attrib-uted to more rapid technological progress in the production of certain ICT goods,such as semi-conductors, which has contributed to more rapid price declines andthus to higher growth in volumes (Jorgenson, 2001).7 ICT manufacturing made thelargest contributions to aggregate labour productivity growth in Finland, Irelandand Korea, with close to 1 percentage point of aggregate labour productivitygrowth in the 1995-2000 period being due to ICT manufacturing.
The ICT-producing services sector (telecommunications and computer ser-vices) plays a smaller role in aggregate labour productivity growth, although it isalso characterised by rapid improvements (Figure 3b). In part, rapid productivitygrowth is linked to the liberalisation of telecommunications markets and the highspeed of technological change in this market. The contribution of this sector tooverall labour productivity growth increased in several countries over the 1990s,notably in Finland, Germany and the Netherlands. Some of the growth in ICT-producing services is due to the emergence of the computer services industry,which has accompanied the diffusion of ICT in OECD countries.
Figure 3 suggests that the ICT sector is indeed an important driver of growthand productivity in a few OECD countries. But in most countries, the contribution ofthis sector to overall productivity growth is quite small, although it has typicallyincreased over the 1990s.8 This result is linked to differences in specialisation. Only
Box 2. The use of hedonic deflators in the ICT-producing sector (cont.)
output are typically larger than in computer investment, where standardisedapproaches have been applied (e.g. Colecchia and Schreyer, 2001). Annex 1 showssome sensitivity analysis for the impact of different price indexes on outputgrowth (see also Wyckoff, 1995).
* Production price indices for Canada are not available from the OECD STAN database.

Production and Use of ICT: a Sectoral Perspective on Productivity Growth in the OECD Area
55
© OECD 2002
Figure 3. Contribution of ICT-producing industries to aggregate labour productivity growth
Total economy, value added per person employed, annual average contribution in percentage points
Note: 1991-1995 for Germany; 1992-95 for Italy and 1993-1995 for Korea; 1996-98 for Japan, Korea, Spain and Sweden,1996-99 for France, Germany and the United Kingdom; 1996-2001 for Austria, Finland, Italy and the United States.
Source: Estimates on the basis of the OECD STAN database and data underlying Van Ark, et al. (2002b). SeeAnnex tables for detail.
0.80
0.60
0.40
0.20
0.80
0.60
0.40
0.20
0.80
0.60
0.40
0.20
0.80
0.60
0.40
0.20
1.00
0 0
1.00
0 0
1990-95 1996-2000
1.00 1.00
Italy
Norway
Spain
Mex
ico
Denm
ark
Nethe
rland
s
Austri
a
United
King
dom
Switzer
land
Canad
a
Germ
any
Franc
e
Belgium
Japa
n
United
Sta
tes
Sweden
Korea
Irelan
d
Finlan
d
B. ICT-producing services
Belgium
Switzer
land
Austri
a
Japa
n
United
Sta
tes
Korea
Mex
ico
Norway
Spain
Franc
e
United
King
dom
Sweden
Canad
a
Nethe
rland
sIta
ly
Denm
ark
Irelan
d
Finlan
d
Germ
any
A. ICT manufacturing
0.80
0.60
0.40
0.20
0.80
0.60
0.40
0.20
0.80
0.60
0.40
0.20
0.80
0.60
0.40
0.20
1.00
0 0
1.00
0 0
1990-95 1996-2000
1.00 1.00
Italy
Norway
Spain
Mex
ico
Denm
ark
Nethe
rland
s
Austri
a
United
King
dom
Switzer
land
Canad
a
Germ
any
Franc
e
Belgium
Japa
n
United
Sta
tes
Sweden
Korea
Irelan
d
Finlan
d
B. ICT-producing services
Belgium
Switzer
land
Austri
a
Japa
n
United
Sta
tes
Korea
Mex
ico
Norway
Spain
Franc
e
United
King
dom
Sweden
Canad
a
Nethe
rland
sIta
ly
Denm
ark
Irelan
d
Finlan
d
Germ
any
A. ICT manufacturing

OECD Economic Studies No. 35, 2002/2
56
© OECD 2002
few OECD countries are specialised in those parts of ICT sector that are character-ised by very rapid technological progress, e.g. the production of semi-conductorsand electronic computers. Much of the production of this type of ICT hardware ishighly concentrated, because of its large economies of scale and high entry costs.Establishing a new semi-conductor plant cost some USD 100 million in the early 1980s,but as much as USD 1.2 billion in 1999 (United States Council of EconomicAdvisors, 2001). In other words, only a few countries will have the necessary compara-tive advantages to succeed in producing these types of ICT products. This may notnecessarily be a problem for countries that do not produce such goods to the extentthat a substantial part of the benefits of ICT production accrue to importing countriesand to users, as these can benefit from investment and consumer goods characterisedby rapid price declines.
Does ICT use increase productivity growth?
Much of the current interest in ICT’s potential impact on growth is not linkedto the ICT-producing sector, but to the potential benefits arising from its use in theproduction process elsewhere in the economy. The use of ICT could have severalimpacts on productivity. For example, it might help more productive firms gainmarket share. In addition, the use of ICT may help firms expand their productrange, customise the services offered, or respond better to client demand; inshort, to innovate. Moreover, ICT may help reduce inefficiency in the use of capitaland labour, e.g. by reducing inventories. All these effects might lead to higherproductivity growth.
Investment in ICT might also have benefits going beyond those accruing toinvestors in ICT. For instance, the diffusion of ICT may help establish networks,which produce greater benefits (the so-called spillover effects) the more custom-ers or firms are connected to the network. Moreover, the spread of ICT may reducetransaction costs, which could lead to a more efficient matching of supply anddemand, and enable the growth of new markets. Increased use of ICT may alsolead to greater efficiency in the creation of knowledge. Where such spilloversexist, they raise overall MFP growth (Bartelsman and Hinloopen, 2002). Studies atthe firm level (for example Brynjolfsson and Hitt, 2000) indeed point to spilloversfrom ICT capital, but it has generally been difficult to confirm these results at moreaggregate levels of analysis (Box 3).
One way to examine the role of ICT use in more detail is by focusing on thosesectors that are the most intensive users of ICT. If the use of ICT is having effectson MFP growth, it is likely that heavy users would be the first sectors to experi-ence such effects. Although computers may appear to be everywhere, the use ofICT is actually highly concentrated in the services sector and in a few manufactur-ing sectors (McGuckin and Stiroh, 2001).
Production and Use of ICT: a Sectoral Perspective on Productivity Growth in the OECD Area
57
© OECD 2002
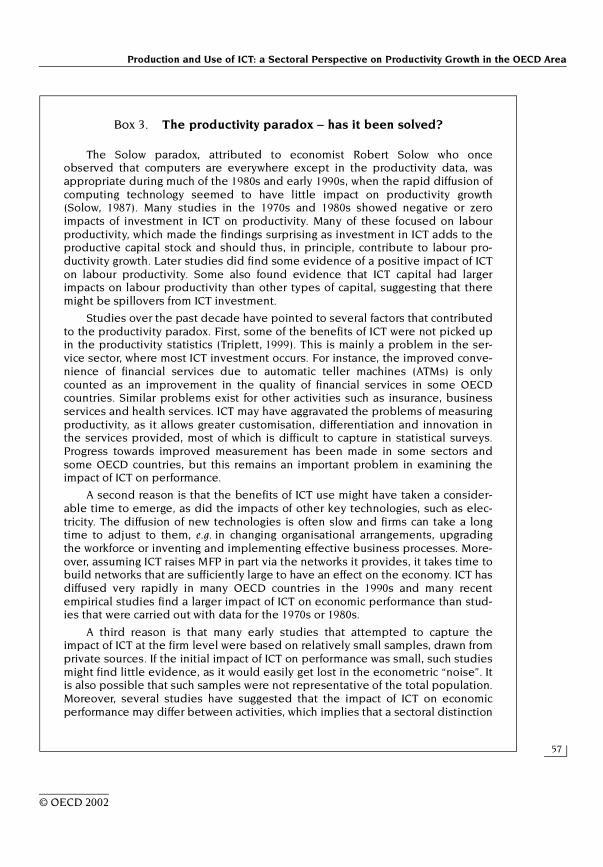
Box 3. The productivity paradox – has it been solved?
The Solow paradox, attributed to economist Robert Solow who onceobserved that computers are everywhere except in the productivity data, wasappropriate during much of the 1980s and early 1990s, when the rapid diffusion ofcomputing technology seemed to have little impact on productivity growth(Solow, 1987). Many studies in the 1970s and 1980s showed negative or zeroimpacts of investment in ICT on productivity. Many of these focused on labourproductivity, which made the findings surprising as investment in ICT adds to theproductive capital stock and should thus, in principle, contribute to labour pro-ductivity growth. Later studies did find some evidence of a positive impact of ICTon labour productivity. Some also found evidence that ICT capital had largerimpacts on labour productivity than other types of capital, suggesting that theremight be spillovers from ICT investment.
Studies over the past decade have pointed to several factors that contributedto the productivity paradox. First, some of the benefits of ICT were not picked upin the productivity statistics (Triplett, 1999). This is mainly a problem in the ser-vice sector, where most ICT investment occurs. For instance, the improved conve-nience of financial services due to automatic teller machines (ATMs) is onlycounted as an improvement in the quality of financial services in some OECDcountries. Similar problems exist for other activities such as insurance, businessservices and health services. ICT may have aggravated the problems of measuringproductivity, as it allows greater customisation, differentiation and innovation inthe services provided, most of which is difficult to capture in statistical surveys.Progress towards improved measurement has been made in some sectors andsome OECD countries, but this remains an important problem in examining theimpact of ICT on performance.
A second reason is that the benefits of ICT use might have taken a consider-able time to emerge, as did the impacts of other key technologies, such as elec-tricity. The diffusion of new technologies is often slow and firms can take a longtime to adjust to them, e.g. in changing organisational arrangements, upgradingthe workforce or inventing and implementing effective business processes. More-over, assuming ICT raises MFP in part via the networks it provides, it takes time tobuild networks that are sufficiently large to have an effect on the economy. ICT hasdiffused very rapidly in many OECD countries in the 1990s and many recentempirical studies find a larger impact of ICT on economic performance than stud-ies that were carried out with data for the 1970s or 1980s.
A third reason is that many early studies that attempted to capture theimpact of ICT at the firm level were based on relatively small samples, drawn fromprivate sources. If the initial impact of ICT on performance was small, such studiesmight find little evidence, as it would easily get lost in the econometric “noise”. Itis also possible that such samples were not representative of the total population.Moreover, several studies have suggested that the impact of ICT on economicperformance may differ between activities, which implies that a sectoral distinction
OECD Economic Studies No. 35, 2002/2
58
© OECD 2002
Empirical evidence on ICT use by industry is available for several countries,based on capital flow matrices and capital stock estimates. US capital flow data for1992, for instance, show that certain manufacturing industries (e.g. printing and pub-lishing, electronic equipment, instruments) as well as transport services, wholesaletrade, finance, insurance and business services, are the largest relative investors inICT equipment (BEA, 1998; Figure 4). These results are broadly confirmed for Canada,the Netherlands and the United Kingdom.
Several studies have focused on those industries that are intensive users of ICT(Stiroh, 2001; Van Ark, et al., 2002b). Examining the performance of these sectors overtime and comparing it with sectors of the economy that do not make intensive use ofICT, can help point to the role of ICT use in strengthening productivity growth.9
Labour productivity growth in ICT-using industries
In several of the sectors that are important users of ICT, output and productiv-ity are hard to measure (Box 4). These measurement problems may obscure actualproductivity gains (Gullickson and Harper, 1999). The STAN database distin-guishes several of the ICT-using industries that were mentioned above, notablywholesale and retail trade, finance, insurance and business services. For the dis-cussion here, the focus is primarily on these services, which are all intensive usersof ICT. Figure 5 shows the contribution of the key ICT-using services to aggregatelabour productivity growth over the 1990s.
Figure 5 suggests small improvements in the contribution of ICT-using ser-vices in Finland and Sweden, and substantial increases in Ireland and Mexico(where it reflects a rebound of very poor productivity performance in the first half
Box 3. The productivity paradox – has it been solved? (cont.)
in the analysis is important. More recent studies based on large samples of (official)data and covering several industries are therefore more likely to find an impact ofICT than earlier studies. In addition, early studies used a wide variation of data onICT and ICT diffusion, often of unknown quality. Much progress has been made inrecent years in measuring ICT investment and the diffusion of ICT technologies,implying that the range of available data is broader, more robust and statisticallymore sound than previous data.

Production and Use of ICT: a Sectoral Perspective on Productivity Growth in the OECD Area
59
© OECD 2002
Figure 4. Relative investment in ICT by economic activity
Source: OECD calculations based on the data from the Bureau of Economic Analysis, Statistics Canada,CPB Netherlands Bureau for Economic Analysis, UK Office of National Statistics.
0 61 2 3 4 5 0 51 2 3 4
0 41 2 3 0 41 2 3
Wood
Services
Wholesale and retail trade
Finance, insurance and real estate
Communications
Electrical and electronics
Other utilities
Printing and publishing
Other manufacturing
Machinery and equipment, n.e.c.
Leather
Food, bev. and tobacco
Chemicals
Furniture and fixture
Transportation equipment
Rubber and plastics
Fabricated metals
United States, 1992 Canada, 1996
Netherlands, 1995 United Kingdom, 1998
Finance and insurance
Real estate, renting, business acti.
Electrical and optical equipment
Post and telecommunications
Machinery and equipment, n.e.c.
Wholesale and retail trade; repairs
Textile and leather
Pulp, paper, printing and publishing
Education
Chemical, rubber and plastics
Basic and fabricated metals
Public admin. and defence
Other community, social andpersonal services
Other manufacturing
Electricity, gas and water
Hotels and restaurants
Paper and printing
Wholesale and retail trade
Machinery and equipment, n.e.c.
Construction
Finance and insurance
Other industry
Electro-technical
Textiles and leather
Oil and refining
Basic and fabricated metals
Chemicals
Food, bev. and tobacco
Transport
Hotels and restaurants
Other community, personal, social Other non-metallic minerals
Construction
Insurance
Finance
Instrument
Communications
Printing
Food, bev. and tobacco
Machinery and equipment, n.e.c.
Electronic
Other transportation equip.
Education
Agric., forestry, fishing and hunting
Wholesale, retail trade and repairs
Chemicals
Misc. manu.
Personal service
Furniture
Motor veh.
Paper
Total economy = 1Total economy = 1
Total economy = 1Total economy = 1

OECD Economic Studies No. 35, 2002/2
60
© OECD 2002
of the 1990s). The United States has experienced the strongest improvement inlabour productivity growth in ICT-using services over the 1990s, which is due tomore rapid labour productivity growth in wholesale and retail trade, and in finan-cial services (notably securities). In Switzerland, ICT-using services made a strongnegative contribution to productivity growth in the first half of the 1990s, whileFrance and Spain experienced small negative contributions during the second halfof the 1990s.10
Box 4. Measurement of productivity in ICT-using services
For several parts of the services sector, output is difficult to measure (Dean,1999). There is little agreement, for example, on the output of banking, insurance,medical care and retailing. In addition, it is difficult to separate service outputfrom the consumer’s role in eliciting the output. For example, output of the educa-tion sector is partly due to the efforts made by students themselves. Such difficul-ties indicate that the volume and price of services – and changes in their quality –are harder to measure than those of goods. In addition, some services are notsold in the market, so that it is hard to establish prices. In practice, these con-straints mean that output in some services is measured on the basis of relativelysimple indicators. Several series are deflated by wages or consumer prices orextrapolated from changes in employment, sometimes with explicit adjustmentfor assumed labour productivity changes. Given these difficulties, adjusting forquality is even more difficult.
With better measurement, potential productivity gains may become visi-ble. Fixler and Zieschang (1999), for example, derive new output measures forthe US financial services industry (depository institutions). They introducequality adjustments to capture the effects of improved service characteristics,such as easier and more convenient transactions, e.g. use of ATMs, and betterintermediation. Their output index grows by 7.4 per cent a year between 1977and 1994, well above the official measure for this sector of only 1.3 per cent ayear on average. The recent revisions of GDP growth for the United States alsoincorporate improved estimates of banking output, notably on the real valueof non-priced banking services, which better capture productivity growth inthis industry.
While some new approaches to measurement in these sectors are beingdeveloped (Triplett and Bosworth, 2000), only few countries have thus far madesubstantial changes in their official statistics to improve measurement. The mea-surement problems can be seen clearly in the official productivity statistics forseveral countries, with several service industries showing negative MFP growthover a prolonged period.

Production and Use of ICT: a Sectoral Perspective on Productivity Growth in the OECD Area
61
© OECD 2002
The impact of ICT use and production on aggregate productivity growth
From the examination above it is possible to determine how productivitygrowth in ICT-producing and ICT-using sectors have contributed to aggregate pro-ductivity growth in OECD countries. The contribution of ICT-producing, ICT-usingindustries and other activities to aggregate labour productivity growth is shown inFigure 6. Among the G7 countries, the United States is the only one that has expe-rienced a marked improvement in labour productivity growth over the 1990s. BothICT-producing and ICT-using industries contributed to the improvement in labourproductivity growth, with the ICT-using sector accounting for the bulk of the pick-upin labour productivity in the second half of the 1990s.11
In the other G7 countries, the ICT-producing sector provided a slightly stron-ger contribution to labour productivity growth in the second half of the 1990s, butthe contribution of ICT-using industries was small and declined in several coun-tries over the 1990s. Among the other OECD countries, the growing contribution ofthe ICT-producing sector to labour aggregate productivity growth in the 1990s is alsovisible, in particular in Finland, Ireland and Korea. The ICT-using industries experi-enced no strong pick-up in labour productivity growth in the 1990s, however, Irelandand Mexico being exceptions.
Figure 5. Contribution of ICT-using services to aggregate labour productivity growthTotal economy, value added per person employed, annual average contribution
in percentage points
Note: See Figure 3 for period coverage.Source: Estimates on the basis of the OECD STAN database and data underlying Van Ark, et al. (2002b). See
Annex tables for detail.
1.4
-0.6
1.21.00.80.60.40.2
0-0.2-0.4
1.4
-0.6
1.21.00.80.60.40.20-0.2-0.4
Mex
ico
United
Sta
tes
Irelan
d
Sweden
United
King
dom
Norway
Switzer
land
Germ
any
Finlan
d
Nethe
rland
s
Spain
Austri
a
Belgium
Canad
a
Denm
ark
Korea
Japa
nIta
ly
Franc
e
Countries where productivity growth improved Countries where productivitygrowth deteriorated
1990-95 1996-2000
1.4
-0.6
1.21.00.80.60.40.2
0-0.2-0.4
1.4
-0.6
1.21.00.80.60.40.20-0.2-0.4
Mex
ico
United
Sta
tes
Irelan
d
Sweden
United
King
dom
Norway
Switzer
land
Germ
any
Finlan
d
Nethe
rland
s
Spain
Austri
a
Belgium
Canad
a
Denm
ark
Korea
Japa
nIta
ly
Franc
e
Countries where productivity growth improved Countries where productivitygrowth deteriorated
1990-95 1996-2000

OECD Economic Studies No. 35, 2002/2
62
© OECD 2002
Figure 6. Contributions to aggregate labour productivity growth, 1990-1995 and 1996-2000
Total economy, annual average contributions to total value added per person employed, in percentage points
Source: Estimates based on the OECD STAN database and data underlying Van Ark, et al. (2002b). See Annextables for detail.
5
5
-1
4
3
2
1
0
-1
4
3
2
1
0
5
5
-1
4
3
2
1
0
-1
4
3
2
1
0
ICT-using services
Other activities
ICT-producing manufacturing ICT-producing services
Residual
A. G7 and non-European countries
Austri
a
Belgium
Denm
ark
Finlan
d
Irelan
d
Nethe
rland
s
Norway
Spain
Sweden
Switzer
land
Canad
a
Franc
e
Germ
any
Italy
Japa
n
United
King
dom
United
Sta
tes
Korea
Mex
ico
B. Smaller European countries
1990-95
1996-2000
1990-95
1996-2000
5
5
-1
4
3
2
1
0
-1
4
3
2
1
0
5
5
-1
4
3
2
1
0
-1
4
3
2
1
0
ICT-using services
Other activities
ICT-producing manufacturing ICT-producing services
Residual
A. G7 and non-European countries
Austri
a
Belgium
Denm
ark
Finlan
d
Irelan
d
Nethe
rland
s
Norway
Spain
Sweden
Switzer
land
Canad
a
Franc
e
Germ
any
Italy
Japa
n
United
King
dom
United
Sta
tes
Korea
Mex
ico
B. Smaller European countries
1990-95
1996-2000
1990-95
1996-2000

Production and Use of ICT: a Sectoral Perspective on Productivity Growth in the OECD Area
63
© OECD 2002
THE CONTRIBUTION OF ICT PRODUCTION AND USE TO MFP GROWTH
Stronger growth in labour productivity in ICT-producing and ICT-using indus-tries could simply be due to capital deepening. Estimates of MFP growth adjustfor this factor. Breaking aggregate MFP growth down in its sectoral contributionscan help show whether changes in MFP growth should be attributed to ICT pro-ducing sectors, to ICT-using sectors, or to other sectors. Figure 7 shows the contri-bution of all activities to aggregate MFP growth for the six countries for whichestimates of capital stock at the industry level were available in the OECD STANdatabase. It shows that the ICT-producing sector provided an important contributionto the acceleration in productivity growth in Finland, with both ICT-producing manu-facturing and ICT-producing services providing a strong contribution. In Germany,the contribution of ICT production to MFP growth also increased over the 1990s, con-firming rapid technological progress in this sector. In France, ICT-producing servicesprovided a strong contribution to productivity growth in the second half of the 1990.
In ICT-using services, the MFP estimates point to growing contributions toaggregate productivity in Denmark and Germany, and to a substantial improve-ment in Finland. In the other countries, MFP growth in the ICT-using services wasnegative over the 1990s.
The OECD STAN database does not yet include capital stock for the UnitedStates, which implies that MFP estimates for the United States can not be derived
Figure 7. Contributions of key sectors to MFP growth, 1990-95 and 1996-2000Total economy, contributions to annual average growth rates, in percentage points
1. Estimates are based on official estimates of capital stock and sector-specific labour shares (adjusted for self-employment). No adjustment is made for capital services, due to lack of relevant information at the industry-level.
Source: Estimates on the basis of the OECD STAN database.
3
-2
2
1
0
-1
3
-2
2
1
0
-1
Denmark France Germany Finland Italy Japan
1990-1995
1996-2000
Other activities ICT-using services ICT-producing services ICT-producing manufacturing
3
-2
2
1
0
-1
3
-2
2
1
0
-1
Denmark France Germany Finland Italy Japan
1990-1995
1996-2000
Other activities ICT-using services ICT-producing services ICT-producing manufacturing

OECD Economic Studies No. 35, 2002/2
64
© OECD 2002
from this source. Several studies provide estimates of the sectoral contributionsto US MFP growth, however (Table 1). The results show considerable variation.Oliner and Sichel (2002) found no contribution of non-ICT producing industries toMFP growth; Gordon (2002) and Jorgenson, Ho and Stiroh (2002) found a relativelysmall contribution, while Baily (2002) and the US Council of Economic Advisors(2001) found a much more substantive contribution.12
The problem with some of the studies presented in Table 1 (e.g. Oliner andSichel, 2002 and Gordon, 2002) is that all non-ICT producing sectors are combined,and the contribution of the non ICT-producing sector to aggregate MFP growth iscalculated as a residual. More detailed examination for the United States suggeststhat this residual is indeed small, but typically made up of a positive contributionfrom wholesale and retail trade and financial services to MFP growth, and a nega-tive contribution of other service sectors. For example, Triplett and Bosworth(2002) find a relatively strong pick-up in MFP growth in certain parts of the US ser-vice sector. They estimated that MFP growth in wholesale trade accelerated from1.1 per cent annually to 2.4 per cent annually from 1987-1995 to 1995-2000. In retailtrade, the jump was from 0.4 per cent annually to 3.0 per cent, and in securitiesthe acceleration was from 2.9 per cent to 11.2 per cent. Combined with the rela-tively large weight of these sectors in the economy, this would translate into aconsiderable contribution to aggregate MFP growth of these ICT-using services.
Table 1. Accounting for the acceleration in US productivity growth in the non-farm business sector
1995-2000 minus 1973-1995 (percentage points per year)
Source: Gordon (2002); Jorgenson, Ho and Stiroh (2002); Oliner and Sichel (2002) updated from estimates receivedfrom Dan Sichel; Council of Economic Advisors (2001) as updated in Baily (2002).
Oliner-Sichel (2002), 1974-1990 versus
1996-2001
Gordon (2002), 1972-95 versus
1995-2000
US Council of Economic Advisors
(2001)
Jorgenson, Ho and Stiroh
(2002)
Output per hour 0.89 1.44 1.39 0.92
Cycle n.a. 0.40 n.a. n.a.
Trend 0.89 1.04 1.39 0.92
Contributions from:Capital services 0.40 0.37 0.44 0.52
IT capital 0.56 0.60 0.59 0.44Other capital –0.17 –0.23 –0.15 0.08
Labour quality 0.03 0.01 0.04 –0.11MFP growth 0.46 0.52 0.91 0.51
Computer sector 0.47 0.30 0.18 0.27Other MFP –0.01 0.22 0.72 0.24
Production and Use of ICT: a Sectoral Perspective on Productivity Growth in the OECD Area
65
© OECD 2002
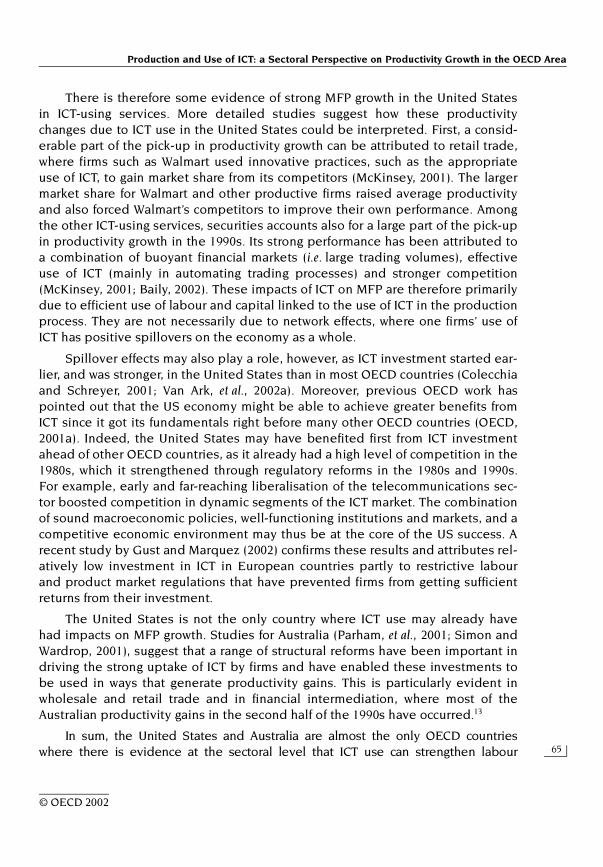
There is therefore some evidence of strong MFP growth in the United Statesin ICT-using services. More detailed studies suggest how these productivitychanges due to ICT use in the United States could be interpreted. First, a consid-erable part of the pick-up in productivity growth can be attributed to retail trade,where firms such as Walmart used innovative practices, such as the appropriateuse of ICT, to gain market share from its competitors (McKinsey, 2001). The largermarket share for Walmart and other productive firms raised average productivityand also forced Walmart’s competitors to improve their own performance. Amongthe other ICT-using services, securities accounts also for a large part of the pick-upin productivity growth in the 1990s. Its strong performance has been attributed toa combination of buoyant financial markets (i.e. large trading volumes), effectiveuse of ICT (mainly in automating trading processes) and stronger competition(McKinsey, 2001; Baily, 2002). These impacts of ICT on MFP are therefore primarilydue to efficient use of labour and capital linked to the use of ICT in the productionprocess. They are not necessarily due to network effects, where one firms’ use ofICT has positive spillovers on the economy as a whole.
Spillover effects may also play a role, however, as ICT investment started ear-lier, and was stronger, in the United States than in most OECD countries (Colecchiaand Schreyer, 2001; Van Ark, et al., 2002a). Moreover, previous OECD work haspointed out that the US economy might be able to achieve greater benefits fromICT since it got its fundamentals right before many other OECD countries (OECD,2001a). Indeed, the United States may have benefited first from ICT investmentahead of other OECD countries, as it already had a high level of competition in the1980s, which it strengthened through regulatory reforms in the 1980s and 1990s.For example, early and far-reaching liberalisation of the telecommunications sec-tor boosted competition in dynamic segments of the ICT market. The combinationof sound macroeconomic policies, well-functioning institutions and markets, and acompetitive economic environment may thus be at the core of the US success. Arecent study by Gust and Marquez (2002) confirms these results and attributes rel-atively low investment in ICT in European countries partly to restrictive labourand product market regulations that have prevented firms from getting sufficientreturns from their investment.
The United States is not the only country where ICT use may already havehad impacts on MFP growth. Studies for Australia (Parham, et al., 2001; Simon andWardrop, 2001), suggest that a range of structural reforms have been important indriving the strong uptake of ICT by firms and have enabled these investments tobe used in ways that generate productivity gains. This is particularly evident inwholesale and retail trade and in financial intermediation, where most of theAustralian productivity gains in the second half of the 1990s have occurred.13
In sum, the United States and Australia are almost the only OECD countrieswhere there is evidence at the sectoral level that ICT use can strengthen labour

OECD Economic Studies No. 35, 2002/2
66
© OECD 2002
productivity and MFP growth. For most other OECD countries, there is little evi-dence that ICT-using industries are experiencing an improvement in labour pro-ductivity growth, let alone any change in MFP growth. Further improvements inlabour and product markets, as well as a focus on policies to seize the benefitsfrom ICT may be required in these countries before ICT will clearly show up in theproductivity statistics.

Production and Use of ICT: a Sectoral Perspective on Productivity Growth in the OECD Area
67
© OECD 2002
NOTES
1. The available data are still somewhat too limited to permit regression analysis on thelink between the size of the ICT sector and aggregate performance.
2. See Productivity Commission (1999) and Parham, et al. (2001) for an extensive discussionof the factors driving MFP growth in Australia.
3. Hedonic deflators for the output of ICT manufacturing are not the only measurementproblem in this sector. Measuring input prices for these industries is also complicated,and requires detailed input-output tables as well as hedonic deflators for certaininputs, such as semi-conductors.
4. US price indexes for other types of software, i.e. custom-made and own-account, are ofthe conventional type and do not adjust for quality change.
5. The analysis here focuses on ISIC 30-33 (Office and computing machinery; Electricalmachinery and apparatus; Radio, television and communication equipment; and Medi-cal, precision and optical instruments) for ICT manufacturing, and ISIC 64 (Post and tele-communications) and ISIC 72 (Computer services) for ICT services. These sectors areoften available from detailed national accounts. More detailed breakdowns, asdemanded by the OECD definition of the ICT sector, create some problems in particularin estimating output and value added in constant prices. Data for wholesale of ICTequipment (ISIC 5150) and renting of ICT equipment (ISIC 7123) are also not availablefrom STAN. Van Ark, et al. (2002b) provide more detailed estimates and discuss themethodological problems involved.
6. The productivity measurement in the paper follows the procedures outlined inOECD’s Productivity Manual (OECD, 2001b). Since value added is more widely avail-able in the STAN database than production, productivity measurement is based onvalue added. An industry’s contribution to aggregate labour productivity growth is cal-culated as the difference between its contribution to the growth of total value addedand its contribution to the growth of total labour input. See Annex 2 for details.
7. Aizcorbe (2002) shows that part of the decline in the prices of Intel chips over the 1990scan be attributed to a decline in Intel’s mark-ups, which points to stronger competitionin the production of chips.
8. Van Ark, et al. (2002b) show that this conclusion also holds up when US hedonic priceindexes are applied to ICT production in other OECD countries.
9. A more rigorous method would be to examine the link between ICT use and productivityperformance through econometric methods, e.g. panel estimation across countries.Unfortunately, the data to engage in such work are still too limited as only few countriesprovide the relevant ICT data by industry.

OECD Economic Studies No. 35, 2002/2
68
© OECD 2002
10. Poor measurement of output in the financial sector (banking, insurance and financialservices) may be one factor driving this result. An OECD taskforce is currently workingto improve output measurement in the banking sector.
11. The “residual” shown in Figure 6 is due to aggregation effects. It is typically small.
12. The differences between the various US studies are partly due to the data sources andmethodology used, as well as the timing of various studies.
13. At the time of writing, Australia is not yet included in the OECD STAN database.

Production and Use of ICT: a Sectoral Perspective on Productivity Growth in the OECD Area
69
© OECD 2002
Annex I
SENSITIVITY OF PRODUCTION GROWTH IN THE COMPUTER INDUSTRY TO PRICE INDEXES
The main paper argued that differences in industrial specialisation might limit the scopefor application of the hedonic price index for the US computer industry to other countries. Ifcertain countries only produce peripheral equipment or computer terminals, the US producerprice index for the computer industry as a whole may not be appropriate, since the US index isheavily influenced by products where price declines are much more rapid, such as electroniccomputers. To illustrate this, Figure A1 shows average production growth in seven OECD coun-tries, using five different producer price deflators, namely the deflator used in national statis-tics for ISIC 30 (Office, accounting and computer machinery), the US deflator for this industry,and the detailed PPIs for computers, computer terminals and peripheral equipment.
The graph illustrates the sensitivity of production growth to price deflators. In Austria, theprice index used in the national accounts already adjusts for the sharp fall in computer prices.
Figure A1. Growth of production in office, accounting and computer machinery, 1996-2000
Annual average growth rates, in per cent
Source: OECD calculations based on STAN database, US PPI deflators from BLS, www.bls.gov.
100
-40
80
60
40
20
0
-20
100
-40
80
60
40
20
0
-20
Austria Denmark Finland France Italy Korea United States
US PPI for peripheral equipmentUS PPI for terminals
National deflator US deflator US PPI for computers
100
-40
80
60
40
20
0
-20
100
-40
80
60
40
20
0
-20
Austria Denmark Finland France Italy Korea United States
US PPI for peripheral equipmentUS PPI for terminals
National deflator US deflator US PPI for computers

OECD Economic Studies No. 35, 2002/2
70
© OECD 2002
In Denmark, the particular hedonics index that is used is quite close to the US PPIs for com-puter terminals or for peripheral equipment. The Italian result also mirrors the US PPI for thesetwo industries. In Finland, use of the US PPI for the entire computer industry would understatethe sharp fall in production, whereas the French hedonic deflator for ISIC 30 leads to slowergrowth than the US deflator for this industry. In Korea, the national deflator falls even slowerthan the US PPI for computer terminals, leading to a lower estimate of growth rates.
All of this shows that industrial specialisation matters. Hedonic price indexes for com-puter equipment are in general more appropriate for the computer-producing industry thanconventional deflators, but they should be adjusted to the industry in question. The Danishhedonic deflator appears appropriate for a country that primarily produces peripheralequipment. Moreover, the conventional deflator used by the Italian Statistical Office mayalso be appropriate. Applying the US deflator would substantially overestimate productiongrowth in these countries. This implies that further work is needed in statistical offices todevelop appropriate hedonic indexes for the computer industry in each individual country.

Production and Use of ICT: a Sectoral Perspective on Productivity Growth in the OECD Area
71
© OECD 2002
Annex II
MEASURING LABOUR PRODUCTIVITY AND MULTIFACTOR PRODUCTIVITY
The productivity measurement in the paper follows the procedures outlined in OECD’sProductivity Manual (OECD, 2001b). Since value added is more widely available in the STANdatabase than production, productivity measurement in this paper is based on value added.The value-added based measure of labour productivity by industry ( ) is given by the
relation . denotes the rate of change of real value-added in industry j
and the rate of change of labour input. The aggregate rate of change in value addedis a share-weighted average of the industry-specific rate of change of value-added whereweights reflect the current-price share of each industry in value-added:
, where ,
On the input side, aggregation of industry-level labour input is achieved by weight-ing the growth rates of hours worked by industry with each industry’s share in total labourcompensation.
, where ,
Aggregate labour productivity growth is defined as the difference between aggregategrowth in value-added and aggregate growth in labour input:
An industry’s contribution to aggregate labour productivity growth is , orthe difference between its contribution to total value-added and to total labour input. If
, total labour productivity growth is a simple weighted average of industry-specificlabour productivity growth.
Multifactor productivity growth, on the basis of value added, is computed as the differ-ence between the rate of growth of deflated value-added and the rate of growth of the pri-mary factor inputs. It is straightforward to aggregate industry-level productivity growth to aneconomy-wide measure. Aggregation weights are simply each industry’s current price sharein total value-added.
Source: OECD (2001b).
jπjjj LAV ˆˆ −=π jAV ˆ
jL̂
∑ ⋅= jjVA AVsAV ˆˆ
VAP
VAPs
VA
jjVAj
VA = ∑=j
jjVAVA VAPVAP
∑ ⋅=j
jjL LsL ˆˆ
wL
Lws
jjj
L = ∑=j
jj LwwL
∑ −=Πj
jjL
jjVA LsAVs )ˆˆ(
jjL
jjVA LsAVs ˆˆ −
jL
jVA ss =

OE
CD
Econ
om
ic Stud
ies N
o. 35, 2
002/2
72
© O
EC
D 2002
Annex Table 1. Contributions to labour productivity growth by industry, 1990-19951
Contributions to value added per person engaged, in percentage point per year
ISIC
Re
v. 3
Au
stri
a
Be
lgiu
m
Can
ada
De
nm
ark
Fin
lan
d
Fra
nce
Ge
rman
y
Ire
lan
d
Ital
y
Jap
an
Ko
rea
Me
xico
Ne
the
rlan
ds
No
rway
Sp
ain
Sw
ed
en
Sw
itze
rlan
d
UK
US
Total economy 01-99 2.32 1.91 1.19 1.99 3.01 1.17 2.10 2.39 2.83 1.20 4.94 0.51 1.24 2.79 1.30 2.95 –0.03 2.02 0.97
ICT-producing manufacturing 30-33 0.12 0.04 0.10 0.09 0.23 0.22 0.17 0.43 0.08 0.36 0.85 0.01 0.12 0.03 .. 0.27 0.10 0.18 0.33
Office, accounting and comp. mach. 30 0.00 .. 0.02 0.02 0.01 0.07 0.05 0.28 0.01 .. 0.04 0.02 .. 0.00 .. 0.01 0.00 .. ..
Electrical machinery, nec 31 0.04 .. 0.01 0.04 0.04 0.06 0.03 0.12 .. .. 0.04 –0.01 .. 0.01 .. 0.03 0.00 .. ..Radio, TV and comm.
equipment 32 0.06 .. 0.03 0.01 0.19 0.09 0.07 .. .. .. 0.75 0.01 .. 0.01 .. 0.19 0.03 .. ..Medical, precision
and optical instr. 33 0.02 .. 0.04 0.02 0.00 –0.01 0.03 0.03 0.02 0.00 0.05 .. .. 0.00 .. 0.04 0.06 .. 0.00
ICT-producing services 64+72 0.15 0.04 0.09 0.27 0.14 0.07 0.19 0.10 0.12 0.08 0.22 0.19 0.10 0.21 0.09 0.24 0.06 0.23 0.14Post and
telecommunications 64 0.14 0.04 0.07 0.12 0.15 0.04 0.17 0.07 0.11 0.08 0.22 0.19 0.10 0.22 0.09 0.18 0.09 0.17 0.14Computer services 72 0.02 .. 0.03 0.15 –0.01 0.04 0.02 0.03 0.01 .. .. .. .. 0.00 .. 0.05 –0.03 0.05 ..
ICT-using services 0.59 0.70 0.61 0.37 0.19 –0.02 0.17 0.15 0.92 0.67 0.96 0.25 0.09 0.37 –0.15 0.45 –0.58 0.37 0.24Wholesale and retail
trade, repairs 50-52 0.15 0.24 0.22 0.36 0.21 0.16 0.07 –0.04 0.57 0.31 0.10 –0.33 0.02 0.38 0.06 0.42 –0.15 0.15 0.25Financial intermediation 65-67 0.23 .. 0.34 –0.07 –0.06 –0.02 0.06 0.33 0.25 –0.04 0.44 0.27 –0.03 –0.08 –0.18 0.10 –0.06 0.13 0.12
Financ. interm, excl. insur./pens. 65 0.24 .. 0.27 –0.07 –0.05 –0.07 0.05 0.21 0.18 .. .. .. .. –0.10 .. 0.10 –0.12 0.09 0.06
Insurance and pension funding 66 0.00 .. 0.07 –0.01 –0.01 0.00 0.03 0.09 0.03 .. .. .. .. 0.01 .. .. 0.08 0.05 0.02
Activities related to fin. int. 67 0.00 .. .. 0.02 0.00 0.04 –0.01 0.04 0.04 .. .. .. .. 0.00 .. .. –0.02 0.01 0.01
Renting of m.and eq., other buss. act. 71-74 0.21 .. 0.06 0.22 0.04 –0.13 0.04 –0.15 0.11 0.41 0.41 0.30 0.10 0.08 –0.03 –0.07 –0.37 0.18 –0.10Renting of mach.
and equipm. 71 0.07 .. .. 0.07 –0.01 –0.01 0.04 0.01 .. .. .. .. .. 0.03 .. –0.04 0.00 0.03 ..Research and
development 73 0.02 .. 0.03 0.00 0.00 –0.02 0.00 –0.03 .. .. .. .. .. 0.00 .. 0.00 –0.01 0.01 ..Other business
activities 74 0.10 .. 0.03 –0.01 0.05 –0.12 –0.01 –0.13 0.11 .. .. .. .. 0.05 .. –0.03 –0.36 0.03 ..

Pro
ductio
n and
Use
of IC
T: a Secto
ral Pe
rspective
on P
rod
uctivity G
row
th in the O
EC
D A
rea
73
© O
EC
D 2002
Annex Table 1. Contributions to labour productivity growth by industry, 1990-19951 (cont.)Contributions to value added per person engaged, in percentage point per year
1. 1991-95 for Germany; 1992-95 for Italy and 1993-95 for Korea.Source: OECD STAN database and data underlying Van Ark, et al. (2002b).
ISIC
Re
v. 3
Au
stri
a
Be
lgiu
m
Can
ada
De
nm
ark
Fin
lan
d
Fra
nce
Ge
rman
y
Ire
lan
d
Ital
y
Jap
an
Ko
rea
Me
xico
Ne
the
rlan
ds
No
rway
Sp
ain
Sw
ed
en
Sw
itze
rlan
d
UK
US
Other activities 1.38 1.04 0.31 1.35 2.35 0.89 1.79 1.87 1.78 0.02 3.96 –0.04 1.13 2.20 1.04 1.95 0.41 1.77 0.68Agriculture, forestry,
fishing 01-05 0.31 0.07 0.03 0.24 0.41 0.19 0.19 0.52 0.39 0.08 0.82 0.12 0.19 0.31 0.04 0.07 –0.02 0.03 0.01
Mining and quarrying 10-14 –0.01 0.01 0.15 0.05 0.02 0.09 0.07 0.02 0.00 0.08 0.08 0.06 1.38 0.05 0.01 –0.01 0.27 0.05
Non-ICT manufacturing 15-29, 34-37 0.68 0.52 0.31 0.31 0.90 0.61 1.03 1.77 0.84 0.13 2.61 0.50 0.59 0.12 0.46 0.91 0.52 0.81 0.56
Electricity, gas and water 40-41 0.06 0.08 0.07 0.10 0.10 0.02 0.07 0.11 0.08 0.07 0.21 0.01 0.06 0.07 0.05 0.02 0.16 0.18 0.06Construction 45 0.18 –0.03 –0.07 –0.04 0.12 0.06 –0.10 –0.08 0.01 –0.09 0.32 –0.21 –0.05 0.18 0.14 0.15 –0.12 0.14 0.00Hotels and restaurants 55 –0.03 0.00 0.04 0.02 0.11 –0.15 –0.09 –0.26 –0.01 –0.19 –0.11 –0.01 –0.04 0.07 0.05 –0.18 –0.05 0.01Transport and storage 60-63 0.01 0.08 0.06 0.14 0.25 0.04 0.19 0.17 0.26 –0.09 0.21 –0.07 0.15 0.36 0.15 –0.02 –0.14 0.13 0.06Real estate 70 0.15 .. .. 0.06 0.35 0.16 0.32 –0.03 0.12 0.32 .. .. .. 0.12 0.15 0.29 0.28 –0.05 0.23Comm., social, pers.
services 75-99 0.03 0.32 –0.28 0.47 0.10 –0.04 0.10 –0.41 0.08 –0.40 –0.09 –0.37 0.14 –0.30 –0.06 0.47 –0.09 0.32 –0.30
Sum of sectors 2.23 1.82 1.12 2.08 2.91 1.16 2.31 2.55 2.90 1.13 6.00 0.40 1.43 2.81 0.98 2.90 –0.01 2.55 1.40Residual 0.09 0.10 0.07 –0.09 0.10 0.01 –0.21 –0.16 –0.07 0.07 –1.06 0.11 –0.19 –0.02 0.32 0.05 –0.02 –0.53 –0.43

OE
CD
Econ
om
ic Stud
ies N
o. 35, 2
002/2
74
© O
EC
D 2002
Annex Table 2. Contributions to labour productivity growth by industry, 1996-20001
Contributions to value added per person engaged, in percentage point per year
ISIC
Re
v. 3
Au
stri
a
Be
lgiu
m
Can
ada
De
nm
ark
Fin
lan
d
Fra
nce
Ge
rman
y
Ire
lan
d
Ital
y
Jap
an
Ko
rea
Me
xico
Ne
the
rlan
ds
No
rway
Sp
ain
Sw
ed
en
Sw
itze
rlan
d
UK
US
Total economy 01-99 1.78 1.39 0.94 1.47 2.41 1.18 1.34 3.76 0.74 0.83 2.70 2.07 0.89 2.41 0.44 2.67 1.10 1.21 1.74
ICT-producing manufacturing 30-33 0.09 0.20 0.15 0.03 0.90 0.18 0.17 0.89 0.01 0.38 0.81 0.02 0.04 0.01 0.02 0.51 0.13 0.10 0.45Office, accounting and comp. mach. 30 0.03 .. 0.00 0.01 0.00 0.04 0.04 0.37 0.00 .. 0.09 .. .. 0.00 0.00 0.01 0.01 0.07 ..Electrical machinery, nec 31 0.05 .. 0.05 –0.01 0.05 0.01 0.06 0.36 .. .. –0.10 .. .. 0.01 0.02 0.01 0.10 .. ..Radio, TV and comm. equipment 32 –0.01 .. 0.05 0.00 0.85 0.11 0.06 .. .. .. 0.71 .. .. 0.01 0.00 0.43 0.00 .. ..Medical, precision and optical instr. 33 0.01 .. 0.05 0.02 0.01 0.01 0.02 0.18 0.00 0.02 –0.02 .. .. –0.01 0.00 0.07 0.02 –0.03 –0.01
ICT-producing services 64+72 0.06 .. 0.22 0.25 0.29 0.19 0.42 0.28 0.23 0.13 0.17 0.17 0.23 0.18 0.18 0.22 0.01 0.20 0.16Post and telecommunications 64 0.09 .. 0.21 0.17 0.36 0.20 0.31 –0.03 0.19 0.13 0.17 0.17 0.27 0.18 0.19 0.18 0.04 0.23 0.16Computer services 72 –0.02 .. 0.01 0.08 –0.07 –0.01 0.11 0.31 0.04 .. .. .. –0.04 0.00 0.00 0.05 –0.04 –0.03 ..
ICT-using services 0.52 0.44 0.34 0.28 0.26 –0.11 0.27 0.73 0.13 0.17 0.27 1.41 0.23 0.42 0.04 0.60 0.29 0.54 1.29Wholesale and retail trade, repairs 50-52 0.20 –0.05 0.14 0.16 0.18 0.02 –0.01 0.25 0.05 –0.10 –0.04 1.01 0.32 0.39 0.09 0.40 –0.08 0.10 0.92Financial intermediation 65-67 0.20 0.22 0.22 0.15 0.21 –0.07 0.30 0.03 0.12 0.08 0.09 0.19 0.01 –0.05 0.00 0.24 0.56 0.12 0.43
Financ. interm, excl. insur./pens. 65 0.20 .. 0.22 0.11 0.18 –0.05 0.30 0.03 0.15 .. .. .. –0.01 –0.05 0.03 0.24 0.50 0.12 0.21
Insurance and pension funding 66 0.04 .. 0.00 0.08 0.00 –0.01 –0.02 0.00 0.00 .. .. .. 0.00 0.00 –0.06 .. 0.05 0.00 0.01
Activities related to fin. int. 67 –0.01 .. .. –0.03 0.04 0.00 0.02 0.00 –0.01 .. .. .. 0.03 0.00 0.03 .. 0.01 0.00 0.19
Renting of m. and eq., other buss. act. 71-74 0.10 0.28 –0.02 0.05 –0.18 –0.07 0.10 0.45 –0.02 0.19 0.21 0.21 –0.15 0.08 –0.06 –0.04 –0.18 0.28 –0.05
Renting of mach. and equipm. 71 0.07 .. .. 0.00 0.01 0.03 0.10 0.04 .. .. .. .. 0.07 0.03 0.01 –0.01 0.00 0.02 ..
Research and development 73 0.00 .. 0.00 0.00 –0.01 –0.01 0.00 –0.02 .. .. .. .. –0.02 0.00 0.00 0.00 –0.02 –0.03 ..
Other business activities 74 0.04 .. –0.03 –0.04 –0.13 –0.08 –0.11 0.43 –0.01 .. .. .. –0.21 0.05 –0.11 –0.03 –0.16 0.32 ..

Pro
ductio
n and
Use
of IC
T: a Secto
ral Pe
rspective
on P
rod
uctivity G
row
th in the O
EC
D A
rea
75
© O
EC
D 2002
Annex Table 2. Contributions to labour productivity growth by industry, 1996-20001 (cont.)Contributions to value added per person engaged, in percentage point per year
1. 1996-98 for Japan, Korea, Spain and Sweden; 1996-99 for France, Germany and the United Kingdom; 1996-2001 for Austria, Finland, Italy and the United States.Source: OECD STAN database and data underlying Van Ark, et al. (2002b).
ISIC
Re
v. 3
Au
stri
a
Be
lgiu
m
Can
ada
De
nm
ark
Fin
lan
d
Fra
nce
Ge
rman
y
Ire
lan
d
Ital
y
Jap
an
Ko
rea
Me
xico
Ne
the
rlan
ds
No
rway
Sp
ain
Sw
ed
en
Sw
itze
rlan
d
UK
US
Other activities 0.98 0.66 0.26 0.82 0.81 0.88 0.54 1.93 0.31 0.53 1.53 0.18 0.41 1.84 0.49 1.14 0.74 0.58 0.27Agriculture, forestry, fishing 01-05 0.16 0.05 0.14 0.15 0.19 0.14 0.09 0.24 0.09 0.03 0.10 0.07 0.04 0.22 0.24 0.09 –0.12 –0.02 0.07Mining and quarrying 10-14 0.01 0.00 0.02 0.21 0.00 .. 0.03 0.01 –0.01 0.01 –0.02 0.04 –0.03 1.40 0.00 0.00 0.01 0.03 –0.01
Non-ICT manufacturing 15-29, 34-37 0.69 0.55 0.31 0.31 0.36 0.43 0.11 2.84 0.21 0.59 1.04 0.52 0.35 0.06 0.01 0.41 0.64 0.13 0.09Electricity, gas and water 40-41 0.09 0.14 0.04 –0.03 0.08 0.09 0.08 0.09 0.06 0.13 0.19 0.00 0.04 0.02 0.15 0.01 –0.01 0.10 –0.01Construction 45 0.13 0.07 0.02 0.00 –0.12 –0.10 0.11 –0.38 0.01 –0.40 0.61 –0.37 –0.04 0.06 –0.12 0.00 0.02 –0.11 –0.06Hotels and restaurants 55 0.06 0.01 –0.06 –0.03 –0.04 –0.03 –0.10 –0.24 –0.04 .. –0.16 0.07 0.02 –0.06 0.00 0.04 0.04 –0.01 –0.01Transport and storage 60-63 0.08 0.13 0.06 0.22 0.14 0.12 0.12 –0.05 –0.04 –0.04 0.30 0.24 0.11 0.44 0.20 0.15 0.10 0.08 0.01Real estate 70 0.12 .. .. 0.19 0.34 0.20 0.21 0.04 0.07 0.40 .. .. 0.17 0.05 0.04 0.11 0.30 0.30 0.32Comm., social, pers. services 75-99 –0.36 –0.29 –0.28 –0.19 –0.13 0.05 –0.11 –0.62 –0.05 –0.19 –0.53 –0.39 –0.24 –0.34 –0.03 0.33 –0.22 0.08 –0.14Sum of sectors 1.65 1.29 0.97 1.37 2.27 1.15 1.40 3.83 0.68 1.21 2.77 1.78 0.91 2.47 0.74 2.48 1.17 1.41 2.16Residual 0.12 0.10 –0.04 0.09 0.14 0.04 –0.05 –0.07 0.06 –0.38 –0.07 0.28 –0.02 –0.06 –0.30 0.19 –0.07 –0.20 –0.42

Production and Use of ICT: a Sectoral Perspective on Productivity Growth in the OECD Area
76
© OECD 2002
BIBLIOGRAPHY
AIZCORBE, A. (2002), “Why Are Semiconductor Prices Falling So Fast? Industry Estimates and Implicationsfor Productivity Measurement”, Finance and Economics Discussion Series 2002-20, FederalReserve Board, Washington D.C.
BAILY, M.N. (2002), “The New Economy: Post Mortem or Second Wind”, Journal of Economic Perspectives, Vol. 16,No. 2, Spring 2002, pp. 3-22.
BARTELSMAN, E. and J. HINLOOPEN (2002), “Unleashing Animal Spirits: Investment in ICT and Economic Growth”, mimeo.
BRYNJOLFSSON, E. and L.M. HITT (2000), “Beyond Computation: Information Technology, Organizational Transformation andBusiness Performance”, Journal of Economic Perspectives Vol. 14, pp. 23-48.
BUREAU OF ECONOMIC ANALYSIS (1998), “Investment in New Structures and Equipment in 1992 by Using Industries”, Survey ofCurrent Business, December, pp. 26-51.
COLECCHIA, A. and P. SCHREYER (2001), “The Impact of Information Communications Technology on Output Growth”,STI Working Paper 2001/7, OECD, Paris.
DEAN, E.R. (1999), “The Accuracy of the BLS Productivity Measures”, Monthly Labor Review, February, pp. 24-34.
FIXLER, D. and K. ZIESCHANG (1999), “The Productivity of the Banking Sector: Integrating Approaches to Measuring FinancialService Output”, Canadian Journal of Economics, Vol. 32, No. 2, pp. 547-569.
GORDON, R.J. (2000), “Does the ‘New Economy’ Measure up to the Great Inventions of the Past?”, Journal ofEconomic Perspectives, Vol. 14, pp. 49-74.
GORDON, R.J. (2002), “Technology and Economic Performance in the American Economy”, NBER WorkingPapers, No. 8771, National Bureau of Economic Research, February.
GUST, C. and J. MARQUEZ (2000), “Productivity Developments Abroad”, Federal Reserve Bulletin, October, pp. 665-681.
GUST, C. and J. MARQUEZ (2002), “International Comparisons of Productivity Growth: The Role of Information Technology andRegulatory Practices”, International Finance Discussion Papers, No. 727, Board of Governors ofthe Federal Reserve System, Washington D.C., May.

Production and Use of ICT: a Sectoral Perspective on Productivity Growth in the OECD Area
77
© OECD 2002
GULLICKSON, W. and M.J. HARPER (1999), “Possible Measurement Bias in Aggregate Productivity Growth”, Monthly Labor Review,February, pp. 47-67.
HEMPELL, T. (2002), “What’s Spurious, What’s Real? Measuring the Productivity Impacts of ICT at the Firm-Level”, Discussion Paper No. 02-42, Centre for European Economic Research, Mannheim.
JORGENSON, D.W. (2001), “Information Technology and the U.S. Economy”, American Economic Review, Vol. 91, No. 1,pp. 1-32.
JORGENSON, D.W., M.S. HO and K.J. STIROH (2002), “Information Technology, Education, and the Sources of Economic Growth across U.S.Industries”, mimeo.
McGUCKIN, R.H. and K.J. STIROH (2001), “Do Computers Make Output Harder to Measure”, Journal of Technology Transfer, Vol. 26,pp. 295-321.
McGUCKIN, R.H. and B. VAN ARK (2001), “Making the Most of The Information Age – Productivity and Structural Reform in the NewEconomy”, Perspectives on a Global Economy, Research Report R-1301-01-RR, ConferenceBoard, October.
McKINSEY (2001), US Productivity Growth 1995-2000: Understanding the Contribution of Information Technology Relativeto Other Factors, McKinsey Global Institute, Washington, D.C., October.
OECD (1996), Services – Measuring Real Annual Value Added, OECD, Paris.
OECD (2000a), “OECD Inquiry on National Collection of Services Producer Prices”, Statistics Directorate,September, mimeo.
OECD (2000b), “Software in the National Accounts: Recent Developments”, STD/NA(2000)37, OECD,Paris, www.oecd.org/std/Nameet2000/docs/na2000e37.pdf
OECD (2001a), The New Economy: Beyond the Hype, OECD, Paris.
OECD (2001b), OECD Productivity Manual: A Guide to the Measurement of Industry-Level and Aggregate ProductivityGrowth, OECD, Paris.
OECD (2002a), Measuring the Information Economy, OECD, Paris, www.oecd.org/sti/measuring-infoeconomy.
OECD (2002b), Reader on Quality Adjustment of Price Indices for Information Technology Products, OECD, Paris,forthcoming.
OLINER, S.D. and D.E. SICHEL (2000), “The Resurgence of Growth in the Late 1990s: Is Information Technology the Story?”,Journal of Economic Perspectives, Vol. 14, No. 4, pp. 3-22.

OECD Economic Studies No. 35, 2002/2
78
© OECD 2002
OLINER, S.D. and D.E. SICHEL (2002), “Information Technology and Productivity: Where are We Now and Where Are WeGoing?”, Finance and Economics Discussion Series, No. 2002-29, Federal Reserve Board, May.
PARHAM, D., P. ROBERTS and H. SUN (2001), Information Technology and Australia’s Productivity Surge, Staff Research Paper, ProductivityCommission, AusInfo, Canberra.
PRODUCTIVITY COMMISSION (1999), Microeconomic Reform and Australian Productivity: Exploring the Links, Research Paper, AusInfo,Canberra.
SCARPETTA, S., A. BASSANINI, D. PILAT and P. SCHREYER (2000), “Economic Growth in the OECD Area: Recent Trends at the Aggregate and Sectoral Levels”,OECD Economics Department Working Papers, OECD, Paris.
SIMON, J. and S. WARDROP (2002), “Australian Use of Information Technology and its Contribution to Growth”, ResearchDiscussion Paper RDP2002-02, Reserve Bank of Australia, Sydney, January.
SOLOW, R.M. (1987), “We’d Better Watch Out”, New York Times, July 12, Book Review, No. 36.
STIROH, K. (2001), “Information Technology and the U.S. Productivity Revival: What Do the Industry DataSay”, Staff Report No. 115, Federal Reserve Bank of New York, New York.
TRIPLETT, J. (1999), “Economics and Statistics, the New Economy and the Productivity Slowdown”, BusinessEconomics, April, Vol. 34, No. 2, pp. 13-17.
TRIPLETT, J.E. and B. BOSWORTH (2000), “Productivity in the Services Sector”, in: R.M. Stern (ed.), Services in the International Economy,forthcoming.
TRIPLETT, J.E. and B. BOSWORTH (2002), “Baumol’s Disease Has Been Cured: IT and Multifactor Productivity in U.S. ServicesIndustries”, paper prepared for Brookings workshop on services industry productivity,Brookings Institution, Washington, D.C., September.
UNITED STATES COUNCIL OF ECONOMIC ADVISORS (2001), Economic Report of the President 2001, United States Government Printing Office, Washington,D.C., February.
VAN ARK, B., J. MELKA, N. MULDER, M. TIMMER and G. YPMA (2002), “ICT Investment and Growth Accounts for the European Union, 1980-2000”, paper preparedfor DG ECFIN, European Commission, Brussels, September, www.eco.rug.nl/ggdc/homeggdc.html
VAN ARK, B., R. INKLAAR and R.H. McGUCKIN (2002b), “Changing Gear: Productivity, ICT and Service Industries: Europe and the UnitedStates”, paper prepared for ZEW Conference, June.
WYCKOFF, A.W. (1995), “The Impact of Computer Prices on International Comparisons of Labour Productivity”,Economics of Innovation and New Technology, Vol. 3, No. 2, pp. 277-293.