product quality effects of international airline alliances
TRANSCRIPT
Munich Personal RePEc Archive
Product Quality Effects of International
Airline Alliances, Antitrust Immunity,
and Domestic Mergers
Gayle, Philip and Thomas, Tyson
Kansas State University, Kansas State University
September 2015
Online at https://mpra.ub.uni-muenchen.de/67788/
MPRA Paper No. 67788, posted 10 Nov 2015 06:07 UTC
Product Quality Effects of International Airline Alliances, Antitrust Immunity, and Domestic Mergers
Philip G. Gayle* and Tyson Thomas**
This draft: September 1, 2015 First draft: October 20, 2014
Forthcoming in Review of Network Economics
Abstract
Much of the literature on airline cooperation focuses on the price effects of cooperation. A key contribution of our paper is to empirically examine the product quality effects of airline cooperation. Two common types of cooperation among airlines involve international alliances and antitrust immunity (ATI), where ATI allows for more extensive cooperation. Additionally, this paper examines the extent to which domestic mergers affect the quality of international air travel products. The results suggest that increases in the membership of a carrier’s alliance or ATI partners and domestic mergers are associated with the carrier’s own products having more travel-convenient routing quality. Therefore, a complete welfare evaluation of airline cooperation and mergers should not ignore product quality effects.
Keywords: Product quality; Airline competition; International alliance; Antitrust immunity;
Mergers JEL classification codes: L13; L93; L40 Acknowledgements: For very helpful comments and suggestions we thank editor, Julian Wright, two anonymous referees, Peri da Silva, Yang-Ming Chang, and Tian Xia. Any remaining errors are our own. *Kansas State University, Department of Economics, 322 Waters Hall, Manhattan, KS 66506; Voice: (785) 532-4581; Fax: (785) 532-6919; email: [email protected]; Corresponding author
.
**Kansas State University, Department of Economics, 327 Waters Hall, Manhattan, KS 66506; email: [email protected].
1
1. Introduction
The international airline industry has undergone dramatic changes since the early 1990s.
There has been a tendency toward increased cooperation among airlines that provide
international air travel. This increase in cooperation may in part be due to regulations restricting
the ability of carriers to operate flights to various locations in a foreign country beyond the
primary airport in the foreign country that the carrier uses to facilitate international air travel.
Cooperation between carriers that are based in different countries effectively allows each carrier
greater access to potential passengers in locations of a foreign country that the carrier is not
permitted to operate its own flights. In other words, each carrier in the partnership is able to
leverage its foreign partner's local route network in the foreign country to better access
passengers there.
International cooperation among carriers can take various forms. Two common types of
cooperation involve international alliances and antitrust immunity (ATI). These two forms of
cooperation differ in the extent of cooperation. For instance, international airline alliances allow
the carriers in the alliance to codeshare flights. Codesharing allows a carrier to sell tickets for
seats on its partner carriers’ planes. Consumers can benefit from an alliance since carriers in the
alliance may coordinate flight schedules in an attempt to decrease layover times, check baggage
through to the final destination, share frequent flier programs and decrease the distance between
the carriers’ gates at airports. These features of alliances serve to increase the convenience of
international travel for consumers. These travel conveniences are especially important to
passengers traveling internationally because international air travel, as compared to domestic air
travel, is more likely to require that passengers switch operating carriers at some point on their
journey. In these cases, the products offered by each of the operating carriers are
complementary.
The three international alliances are Star, Skyteam and Oneworld. Subsets of carriers
within these alliances do have ATI. ATI permits more extensive cooperation in which carriers
can cooperate on setting fares and capacity in addition to the types of cooperation that can occur
without ATI.
Much of the existing literature on airline cooperation focuses on the price effects of
cooperation, and often infers welfare effects from these price effects. Results from these
previous studies overwhelmingly suggest that cooperation can benefit passengers in the form of
2
lower prices.1
Although there is extensive literature examining the price effects of international airline
cooperation, there is a paucity of research regarding the effects on air travel product quality.
Some of the research regarding air travel product quality has focused on the relationship between
competition and the carriers’ on-time performance [e.g. Mazzeo (2003), Rupp et al. (2006) and
Prince and Simon (2010)]. Likewise, Richard (2003), Brueckner and Luo (2014), Bilotkach
(2011) have examined the effects of competition on flight frequency. However, the existing
studies that explore these determinants of air travel product quality focus on domestic air travel
markets; whereas this study focuses on international air travel markets, and uses a measure of
product quality that has not been fully explored by others.
However, it is well-known in economics that, all else equal, consumer welfare is
positively related to product quality. A key objective of this paper is to better understand how
international cooperation among carriers affects the quality of the cooperating carriers’ air travel
products. Understanding the product quality effects is important for a complete welfare
evaluation of airline cooperation.
Our study focuses on a measure of quality that is directly related to the travel
convenience of the product in terms of the directness of the product's itinerary routing (measured
by distance flown) between the passengers' origin and destination. This quality measure is
termed routing quality [Chen and Gayle (2014)], and is calculated as the minimum flying
distance between an origin/destination, divided by the actual distance flown by passengers using
a specific itinerary routing between the origin and destination. As the distance flown by a
passenger to reach their destination increases relative to the minimum distance, the lower is the
routing quality of the product. The assumption is that, all else equal, passengers prefer the most
direct routing to get to their destination.
Cooperation between carriers may require each to rearrange parts of their route network
to facilitate network integration. Rearrangement of networks can result in new product offerings
and impact the average routing quality of the set of products offered by each carrier in the
alliance. Since a given carrier typically needs to accommodate multiple alliance partners, it is
not clear a priori that such multi-dimensional network integration necessarily results in a given
1 Theoretical papers examining the effects of cooperation include, but are not limited to: Bilotkach (2005), Brueckner (2001), Chen and Gayle (2007), Hassin and Shy (2004) and Park (1997). Empirical papers examining the effects of cooperation include, but are not limited to: Brueckner and Whalen (2000), Brueckner (2003), Brueckner et al. (2011), Flores-Fillol and Moner-Colonques (2007), Park and Zhang (2000) and Oum et al. (1996).
3
carrier offering products of higher routing quality. However, to persuade regulatory authorities
to approve formation of the alliance, which is required before the alliance can be implemented,
carriers typically make arguments suggesting that the alliance will result in their products having
better routing quality. Similar arguments are often made to convince regulatory authorities to
grant the carriers ATI.
For instance, in a joint application to the U.S. Department of Transportation (DOT) for
ATI in 2007 involving Delta Airlines, Northwest Airlines and four European carriers, the carriers
make the claim that 1,466 city-pair combinations will be upgraded to one-stop service and 4,071
city-pair combinations will be upgraded to two-stop service. 2
Using rigorous econometric analysis this study seeks to be the first to formally establish
and document systematic evidence of the relationship between routing quality and international
airline cooperation. We estimate reduced-form regression equations that use a difference-in-
differences strategy via interaction variables to identify the relationship of interest. The data
sample focuses on products offered by the three carriers: United Airlines, Delta Airlines and
American Airlines. Each of these carriers is a founding member of their respective alliance, their
participation in the alliance has not wavered over time, and any ATI agreement between a U.S.
carrier and foreign carrier involves one of these carriers. Additionally, Clougherty (2002)
suggests that the effects of domestic mergers on international travel often get overlooked. As
such, we also use the data to better understand the impacts of the United/Continental merger and
the Delta/Northwest merger on routing quality in international air travel markets. Therefore, this
Additionally, after the approval of
this ATI application in 2008, Delta Airlines added nonstop service from Newark, Portland,
Minneapolis/St. Paul, Seattle and Memphis among other origins to Amsterdam. Similarly, when
an ATI agreement between American Airlines and SN Brussels Airlines ceased in 2009,
American Airlines then stopped offering nonstop flights from Los Angeles to Brussels.
Although, when SN Brussels was granted ATI with United Airlines in 2009, United Airlines
added nonstop service between Los Angeles and Brussels. Note that SN Brussels was granted
ATI with United Airlines shortly prior to joining the Star alliance with United Airlines. These
are just a handful of examples. However, it is clear that cooperation can induce changes in flight
offerings.
2 See U.S. Department of Transportation docket: Joint Application for Approval of and Antitrust Immunity for Alliance Agreements (Public Version), DOT-OST-2007-28644-0001-0001.
4
paper complements work by Chen and Gayle (2014) who focus on the routing quality impacts of
these mergers within U.S. domestic air travel markets.
The results provide strong evidence that cooperation among international carriers is
associated with an increase in a carrier’s routing quality on average. This is a result that is
consistent for alliance and ATI membership for each of the three carriers examined. Moreover,
the results indicate that an increase in alliance membership is associated with relative routing
quality increases for online, traditional codeshare and virtual codeshare products offered by the
carriers.3
This paper proceeds as follows. Section 2 provides a brief background history of each of
the three major international alliances and ATI partnerships with U.S. carriers, defines key
concepts, as well as a discussion of the data used in the analysis. Section 3 provides a
description of the methodology used, while Section 4 discusses the empirical results. Section 5
concludes the paper.
In the case of United Airlines and American Airlines, the greatest relative routing
quality increase shows up in the virtual codeshare products offered by these carriers. This
suggests that when a carrier gains an alliance member, the carrier is able to utilize the alliance
member’s network to offer new products with relatively better routing quality. The results
regarding the routing quality effects of ATI on a carriers’ products are mixed. However, there is
evidence that the United/Continental and Delta/Northwest mergers are associated with a relative
increase in the routing quality of international air travel products provided by the merging
airlines.
2. Data
2.1 Background Information on Alliances, ATI Partnerships, and two Domestic Mergers
The landscape in the international airline industry has undergone rapid changes over the
past 20 years. There are currently three major international alliances: Star, Oneworld and
SkyTeam. The first of these alliances to be founded was the Star alliance in 1997. There were
five original members which included United Airlines. As of the first quarter of 2005, the
alliance had grown to include 18 official members and by the third quarter of 2011 the alliance
included 27 official members. The star alliance is the largest international alliance in terms of
3 In the following section of the paper we define and distinguish between these three types of air travel products.
5
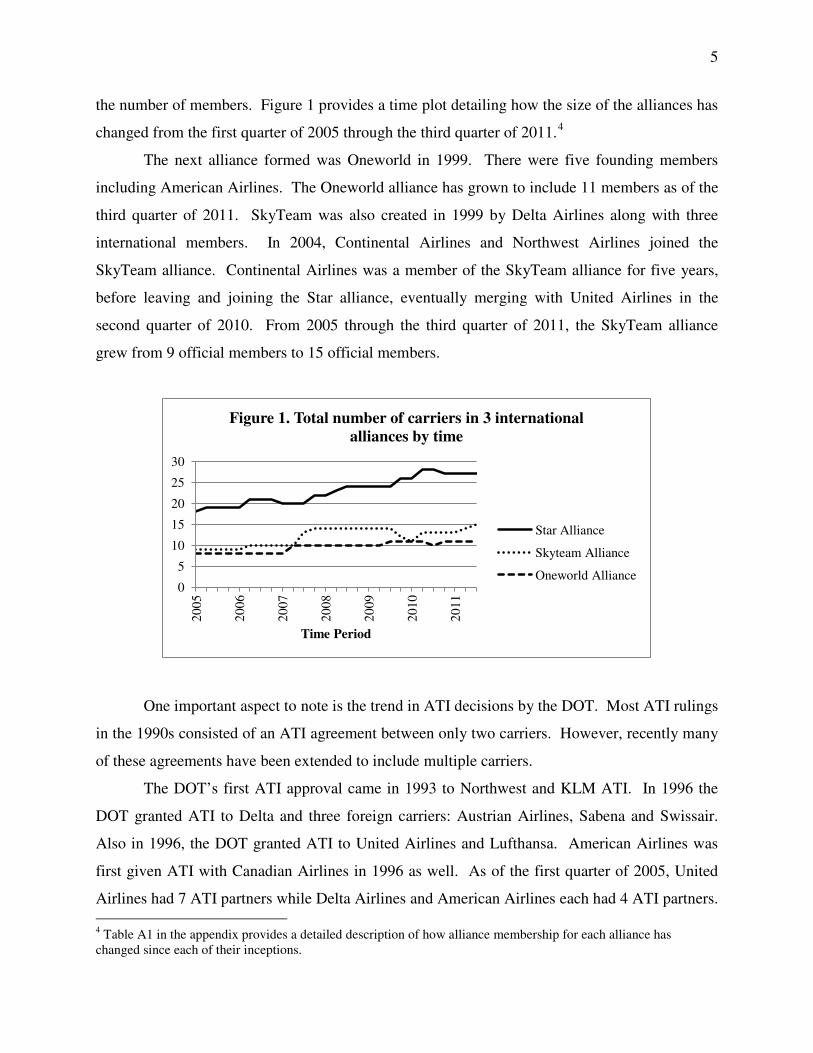
the number of members. Figure 1 provides a time plot detailing how the size of the alliances has
changed from the first quarter of 2005 through the third quarter of 2011.4
The next alliance formed was Oneworld in 1999. There were five founding members
including American Airlines. The Oneworld alliance has grown to include 11 members as of the
third quarter of 2011. SkyTeam was also created in 1999 by Delta Airlines along with three
international members. In 2004, Continental Airlines and Northwest Airlines joined the
SkyTeam alliance. Continental Airlines was a member of the SkyTeam alliance for five years,
before leaving and joining the Star alliance, eventually merging with United Airlines in the
second quarter of 2010. From 2005 through the third quarter of 2011, the SkyTeam alliance
grew from 9 official members to 15 official members.
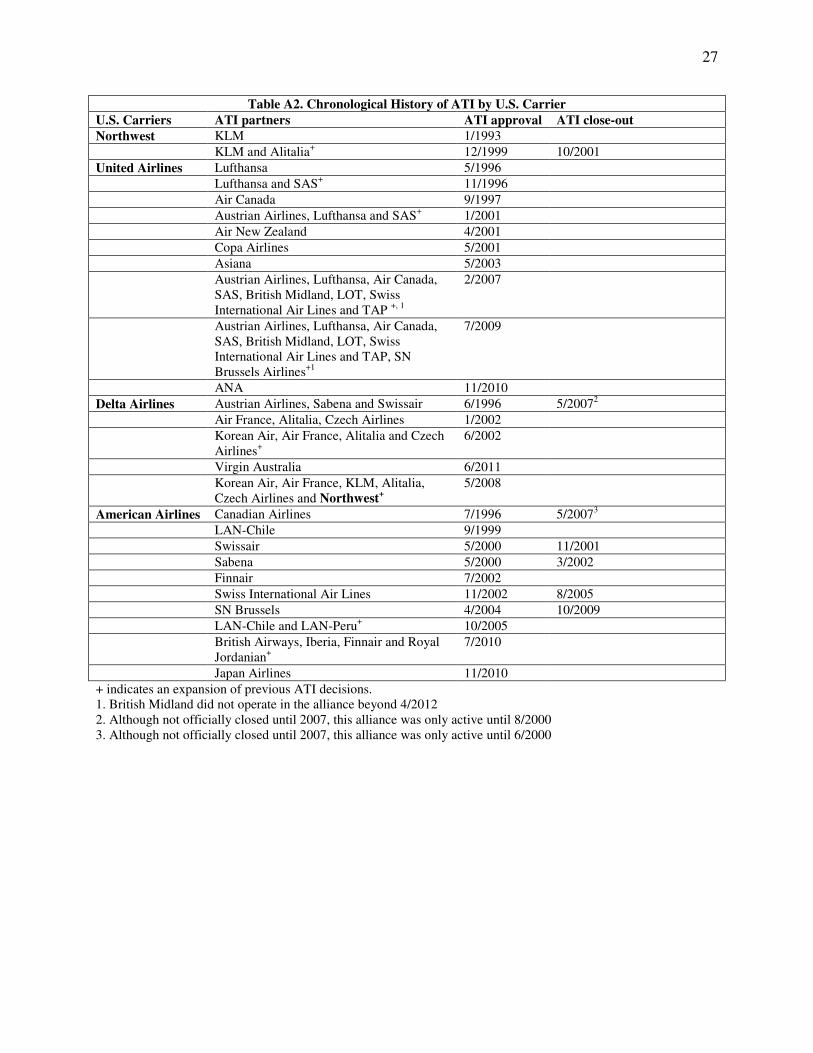
One important aspect to note is the trend in ATI decisions by the DOT. Most ATI rulings
in the 1990s consisted of an ATI agreement between only two carriers. However, recently many
of these agreements have been extended to include multiple carriers.
The DOT’s first ATI approval came in 1993 to Northwest and KLM ATI. In 1996 the
DOT granted ATI to Delta and three foreign carriers: Austrian Airlines, Sabena and Swissair.
Also in 1996, the DOT granted ATI to United Airlines and Lufthansa. American Airlines was
first given ATI with Canadian Airlines in 1996 as well. As of the first quarter of 2005, United
Airlines had 7 ATI partners while Delta Airlines and American Airlines each had 4 ATI partners.
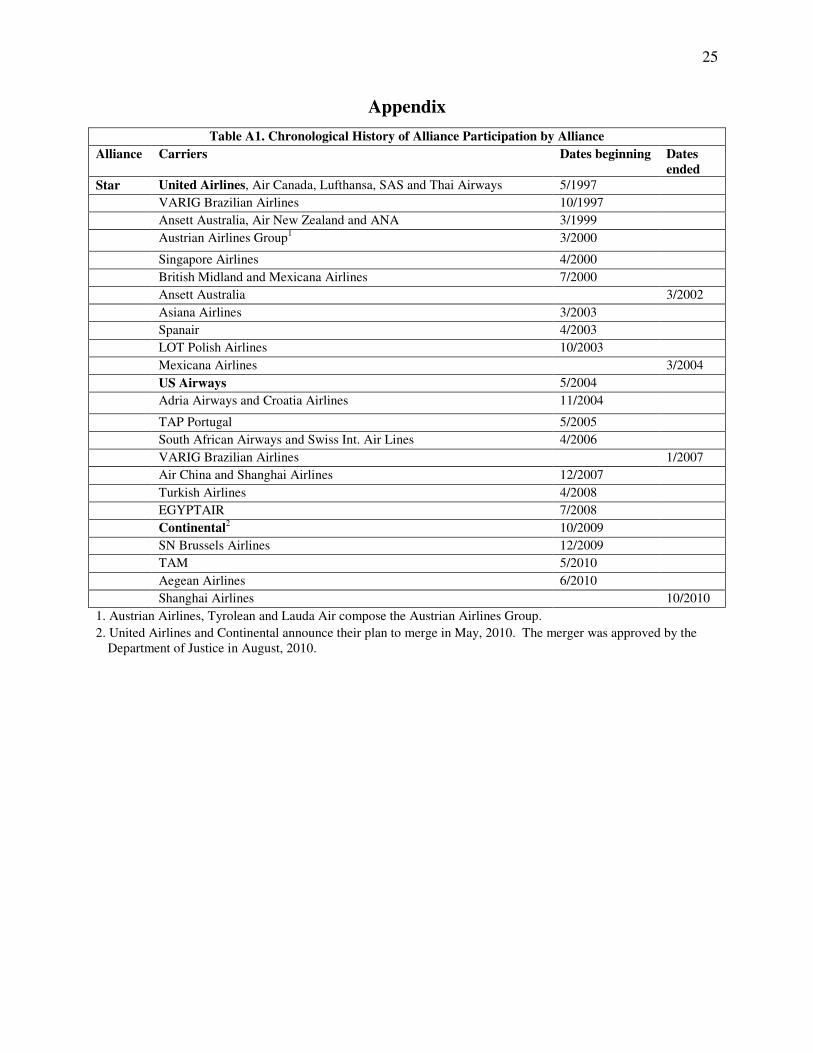
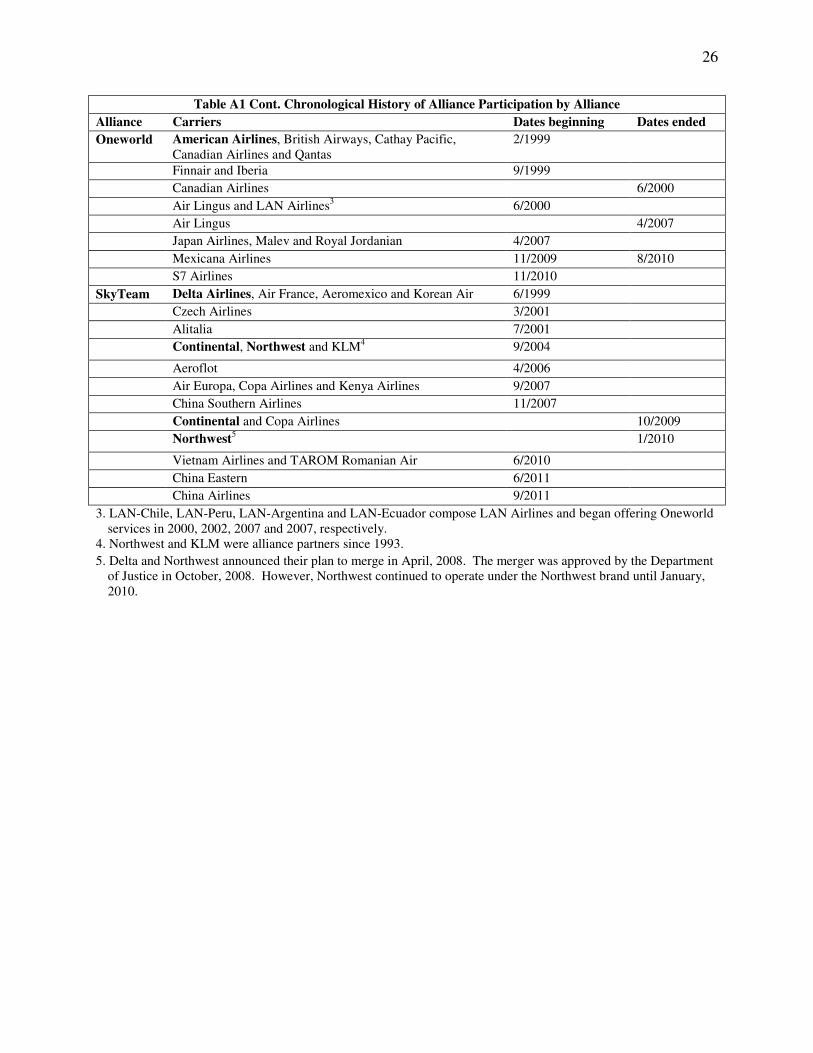
4 Table A1 in the appendix provides a detailed description of how alliance membership for each alliance has changed since each of their inceptions.
0
5
10
15
20
25
30
20
05
20
06
20
07
20
08
20
09
20
10
20
11
Time Period
Figure 1. Total number of carriers in 3 international
alliances by time
Star Alliance
Skyteam Alliance
Oneworld Alliance
6
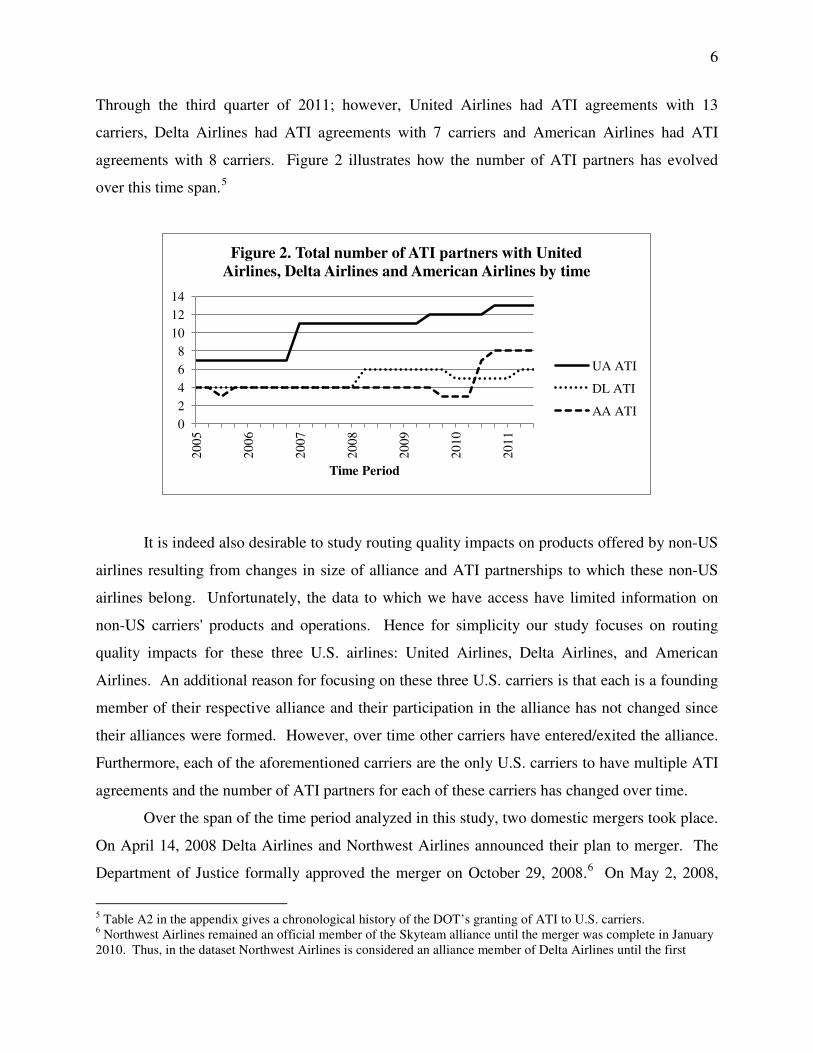
Through the third quarter of 2011; however, United Airlines had ATI agreements with 13
carriers, Delta Airlines had ATI agreements with 7 carriers and American Airlines had ATI
agreements with 8 carriers. Figure 2 illustrates how the number of ATI partners has evolved
over this time span.5
It is indeed also desirable to study routing quality impacts on products offered by non-US
airlines resulting from changes in size of alliance and ATI partnerships to which these non-US
airlines belong. Unfortunately, the data to which we have access have limited information on
non-US carriers' products and operations. Hence for simplicity our study focuses on routing
quality impacts for these three U.S. airlines: United Airlines, Delta Airlines, and American
Airlines. An additional reason for focusing on these three U.S. carriers is that each is a founding
member of their respective alliance and their participation in the alliance has not changed since
their alliances were formed. However, over time other carriers have entered/exited the alliance.
Furthermore, each of the aforementioned carriers are the only U.S. carriers to have multiple ATI
agreements and the number of ATI partners for each of these carriers has changed over time.
Over the span of the time period analyzed in this study, two domestic mergers took place.
On April 14, 2008 Delta Airlines and Northwest Airlines announced their plan to merger. The
Department of Justice formally approved the merger on October 29, 2008.6
5 Table A2 in the appendix gives a chronological history of the DOT’s granting of ATI to U.S. carriers.
On May 2, 2008,
6 Northwest Airlines remained an official member of the Skyteam alliance until the merger was complete in January 2010. Thus, in the dataset Northwest Airlines is considered an alliance member of Delta Airlines until the first
0
2
4
6
8
10
12
14
20
05
20
06
20
07
20
08
20
09
20
10
20
11
Time Period
Figure 2. Total number of ATI partners with United
Airlines, Delta Airlines and American Airlines by time
UA ATI
DL ATI
AA ATI
7
United Airlines and Continental Airlines announced their plan to merge and the Department of
Justice approved the merger on August 27, 2010. There is the potential that these mergers
between U.S. national carriers could have routing quality impacts on the merging airlines'
international travel products since a merger allows a carrier better direct control over the route
network structure of the carrier it merges with.
2.2 Key Definitions
Before describing the variables used in the analysis, it is worth defining a few key
concepts. First, a market is defined as an origin, destination and time period combination. For
example, Chicago to Paris in the first quarter of 2005 is a different market than Chicago to Paris
in the second quarter of 2005. Furthermore, there is a set of products offered by a carrier or
carriers in each market. A product is defined by the unique combination of ticketing carrier,
operating carrier(s), origin airport, destination airport and sequence of intermediate stop
airport(s). The ticketing carrier is the carrier from which a passenger bought the travel ticket for
the itinerary, while the operating carrier(s) are the carrier(s) that physically transport the
passenger between the origin and destination. Our analysis focuses on products with a single
ticketing carrier.
Products in which the ticketing carrier is the same as the operating carrier on each trip
segment are defined as online products. For example, a product that is ticketed by United
Airlines and United Airlines is the sole operating carrier is an online product. However, in some
cases the ticketing carrier and operating carrier of a product may differ. Products that have
multiple operating carriers are defined as traditional codeshare products. Thus, a consumer
travelling on an itinerary that is traditional codeshared is switching carriers at some point along
their trip. For instance, a product ticketed by United Airlines with one intermediate stop where
United Airlines operates the first segment and Air Canada operates the second segment is a
traditional codeshare product. A product that has a single operating carrier that is different from
the ticketing carrier is defined as a virtual codeshare product. Thus, a product in which United
Airlines is the ticketing carrier, but Air Canada is the sole operating carrier is a virtual codeshare
product.
quarter of 2010. Similarly, Northwest Airlines is also considered an ATI partner of Delta Airlines until the first quarter of 2010.
8
2.3 Data and Sample Selection
This study is performed using quarterly data from the International Passenger Origin and
Destination Survey obtained from the U.S. Department of Transportation. This data is a 10%
sample of all itineraries involving an international flight segment, where at least one segment is
operated by a U.S. carrier. The time period examined in this study spans from the first quarter of
2005 through the third quarter of 2011. Each observation in the dataset is an itinerary containing
information regarding the prices, origin airport, intermediate stop airports, destination airport,
distance between each airport, operating carrier for each coupon segment, ticketing carrier for
each coupon segment, and the number of passengers that purchased the itinerary at a particular
price. One key characteristic of this dataset is that it contains information for each direction of
travel (going and returning/coming) on the itinerary. Thus, there is information regarding the
going portion of the itinerary (origin to destination) and the coming portion of the itinerary
(destination back to origin) for roundtrip itineraries.
In order to properly study the effects of international airline alliance and ATI
participation on product quality, the data are restricted to itineraries that meet specific criteria.
First, only roundtrip itineraries are used in the analysis. Additionally, itineraries in which there
are multiple ticketing carriers are excluded. Itineraries in which the origin airport, destination
airport or one of the intermediate airport stops occur more than once for the going portion or
coming portion of the itinerary are also excluded. Finally, only itineraries with a price within the
range of $100 to $10,000 are examined. The number of itineraries within each quarter of the
dataset is extremely large and repeated multiple times. Therefore, repeated itineraries are
collapsed into uniquely defined products for each quarter. Thus, each observation in the dataset
represents a particular product. The final sample consists of 2,057,144 observations/products
spread across 541,978 markets.
In this study we focus on each product’s quality of routing between the origin and
destination, and we measure routing quality using distance travelled on an itinerary. Routing
quality is measured as follows:
𝑅𝑜𝑢𝑡𝑖𝑛𝑔_𝑞𝑢𝑎𝑙𝑖𝑡𝑦𝑗𝑚𝑡 =𝑀𝑖𝑛_𝑑𝑖𝑠𝑡𝑚𝐼𝑡𝑖𝑛𝑒𝑟𝑎𝑟𝑦_𝑑𝑖𝑠𝑡𝑗𝑚𝑡 × 100. (1)
9
Given that information is available for the going and coming portion of an itinerary, one can
separately measure the routing quality for the going and coming portions of the itinerary.
Routing_quality_going is calculated as minimum flying distance between the origin/destination
divided by the actual itinerary flying distance for the going portion of the itinerary. Actual flying
distance may differ across products due to differences in intermediate stop(s) locations across
products. Routing_quality_coming is similarly calculated for the coming portion of the itinerary.
Mindist_going (Mindist_coming) is calculated as the minimum distance on the going (coming)
portion of a product in a given market.7
Other variables used in the study include a measure of an airline’s origin airport presence,
Opres. Opres is calculated as the number of destination airports that a ticketing carrier offers
nonstop service to leaving from a given origin airport. N_comp_nonstop_going
(N_comp_nonstop_coming) is defined as the total number of products in a market that do not
require an intermediate stop on the going (coming) portion of the itinerary, and these enumerated
products are offered by ticketing carriers that are competing with the ticketing carrier of the
product for which N_comp_nonstop_going (N_comp_nonstop_coming) is computed.
Analogously, N_comp_interstop_going (N_comp_interstop_coming) is defined as the total
number of products in a market that require an intermediate stop on the going (coming) portion
of the itinerary, and these enumerated products are offered by ticketing carriers that are
competing with the ticketing carrier of the product for which N_comp_interstop_going
(N_comp_interstop_coming) is computed.
Both routing quality variables are measured in terms of
percentage. The highest routing quality product in each market has a measure of 100.
Therefore, the routing quality of each product is measured relative to the highest quality product
in the market. We also construct a variable, Routing_quality, that assigns a unique routing
quality value to each product. Routing_quality is the mean of Routing_quality_going and
Routing_quality_coming.
Other key variables in the analysis include codeshare variables. In order to create the
codeshare variables regional carriers must be accounted for. Specifically, to facilitate accurate
construction of codeshare variables, we follow previous studies and convert regional carriers to
7 It is important to note that the minimum flying distance between the origin and destination is not always equal to the nonstop flying distance. This is because there is not always a nonstop flight available between an origin and destination. In cases where there is not a nonstop flight available, the minimum distance is calculated using the lowest itinerary distance between the origin and destination.
10
their respective major carrier. For instance, consider the US domestic regional carrier SkyWest
Airlines (OO). The assumption is made that SkyWest Airlines is operating a coupon segment for
the US major ticketing carrier that often transport passengers internationally. Therefore, in the
sample the ticketing carrier/operating carrier combination, UA/OO, would be transformed to
UA/UA and classified as online. This procedure ensures that when an itinerary is classified as
having codeshare features, this codesharing is between major carriers, and therefore consistent
with the focus of much of the literature on airline codesharing.
Two types of codeshare variables are defined: traditional and virtual. Traditional_going
(Traditional_coming) is a zero-one dummy variable that takes the value one only if there are
multiple carriers that operate respective coupon segments on the going (coming) portion of the
itinerary. Virtual_going (Virtual_coming) is a zero-one dummy variable that takes the value one
only if there is one carrier that operates each coupon segment on the going (coming) portion of
the itinerary, but the sole operating carrier is different than the ticketing carrier.
Dummy variables are created to indicate whether a product is a United Airlines (UA),
Delta Airlines (DL) or American Airlines (AA) product. Star is a variable indicating the total
number of carriers in the Star alliance other than United Airlines for each quarter. In the event
that a carrier enters the alliance in a particular quarter, the number of carriers in the alliance
increases for that quarter. Similarly, if a carrier exits the alliance in a particular quarter, the
number of carriers in the alliance decreases for that quarter. ATIUA is defined as the total number
of carriers in each quarter that have ATI agreement with United Airlines. Skyteam and ATIDL are
analogously defined variables for the Skyteam alliance and ATI agreements that include Delta
Airlines. Additionally, Oneworld and ATIAA are analogously defined variables for the Oneworld
alliance and ATI agreements that include American Airlines.
2.4 Summary Statistics
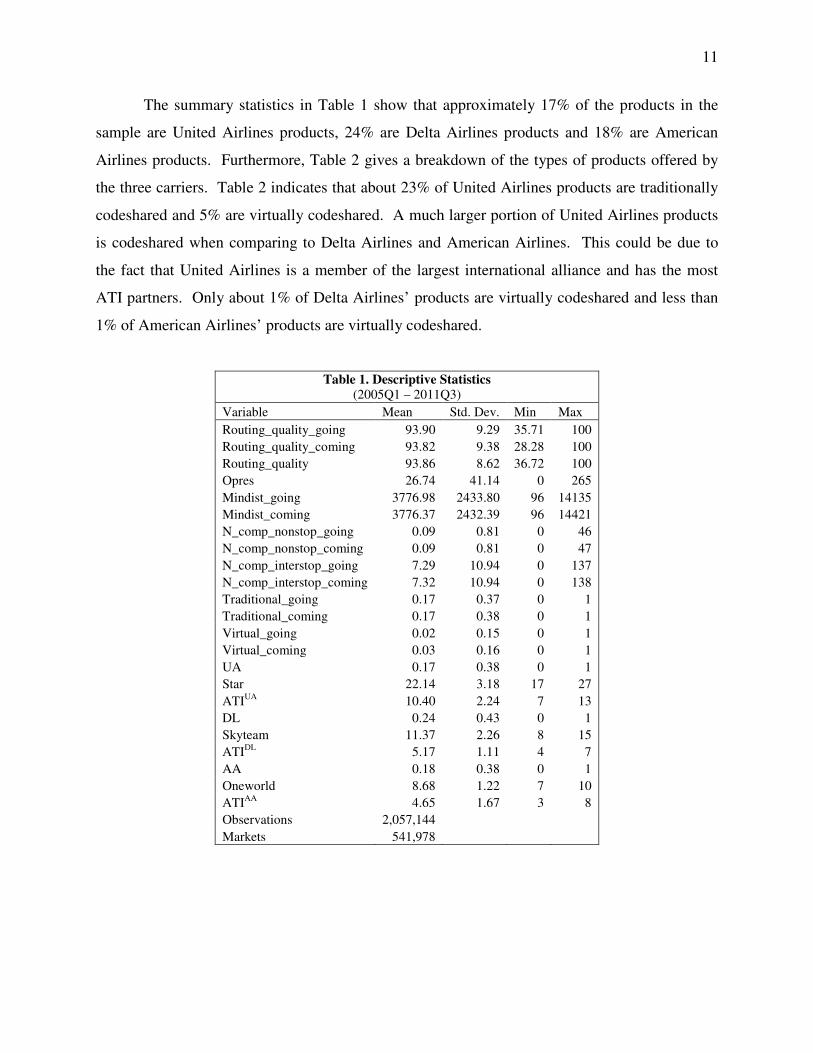
Table 1 reports summary statistics on each of the variables. The summary statistics in
Table 1 for the going portion of all itineraries in the sample indicate that approximately 17% of
the products in the sample are traditionally codeshared, and about 2% are virtually codeshared.
Therefore, approximately 81% are online products. These statistics are similar when examining
the coming portion of itineraries.
11
The summary statistics in Table 1 show that approximately 17% of the products in the
sample are United Airlines products, 24% are Delta Airlines products and 18% are American
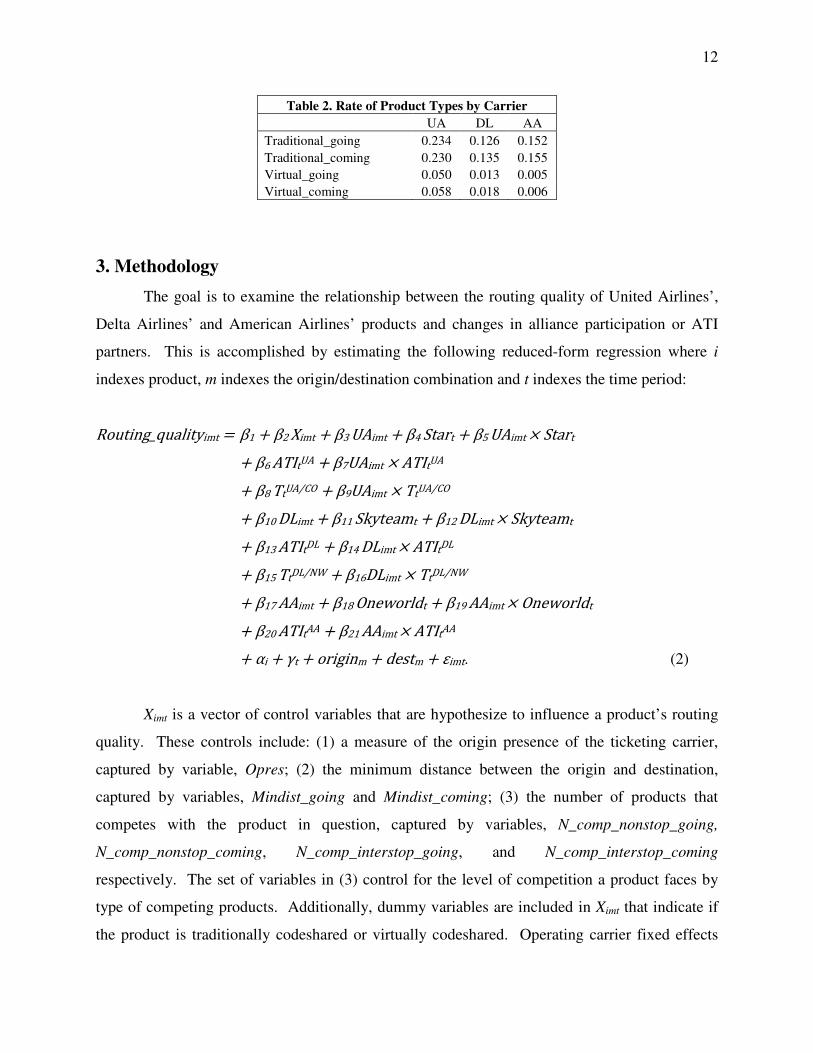
Airlines products. Furthermore, Table 2 gives a breakdown of the types of products offered by
the three carriers. Table 2 indicates that about 23% of United Airlines products are traditionally
codeshared and 5% are virtually codeshared. A much larger portion of United Airlines products
is codeshared when comparing to Delta Airlines and American Airlines. This could be due to
the fact that United Airlines is a member of the largest international alliance and has the most
ATI partners. Only about 1% of Delta Airlines’ products are virtually codeshared and less than
1% of American Airlines’ products are virtually codeshared.
Table 1. Descriptive Statistics
(2005Q1 – 2011Q3)
Variable Mean Std. Dev. Min Max
Routing_quality_going 93.90 9.29 35.71 100
Routing_quality_coming 93.82 9.38 28.28 100
Routing_quality 93.86 8.62 36.72 100
Opres 26.74 41.14 0 265
Mindist_going 3776.98 2433.80 96 14135
Mindist_coming 3776.37 2432.39 96 14421
N_comp_nonstop_going 0.09 0.81 0 46
N_comp_nonstop_coming 0.09 0.81 0 47
N_comp_interstop_going 7.29 10.94 0 137
N_comp_interstop_coming 7.32 10.94 0 138
Traditional_going 0.17 0.37 0 1
Traditional_coming 0.17 0.38 0 1
Virtual_going 0.02 0.15 0 1
Virtual_coming 0.03 0.16 0 1
UA 0.17 0.38 0 1
Star 22.14 3.18 17 27
ATIUA 10.40 2.24 7 13
DL 0.24 0.43 0 1
Skyteam 11.37 2.26 8 15
ATIDL 5.17 1.11 4 7
AA 0.18 0.38 0 1
Oneworld 8.68 1.22 7 10
ATIAA 4.65 1.67 3 8
Observations 2,057,144
Markets 541,978
12
Table 2. Rate of Product Types by Carrier
UA DL AA
Traditional_going 0.234 0.126 0.152
Traditional_coming 0.230 0.135 0.155
Virtual_going 0.050 0.013 0.005
Virtual_coming 0.058 0.018 0.006
3. Methodology
The goal is to examine the relationship between the routing quality of United Airlines’,
Delta Airlines’ and American Airlines’ products and changes in alliance participation or ATI
partners. This is accomplished by estimating the following reduced-form regression where i
indexes product, m indexes the origin/destination combination and t indexes the time period:
Routing_qualityimt = β1 + β2 Ximt + β3 UAimt + β4 Start + β5 UAimt × Start
+ β6 ATItUA + β7UAimt × ATIt
UA
+ β8 TtUA/CO + β9UAimt × Tt
UA/CO
+ β10 DLimt + β11 Skyteamt + β12 DLimt × Skyteamt
+ β13 ATItDL + β14 DLimt × ATIt
DL
+ β15 TtDL/NW + β16DLimt × Tt
DL/NW
+ β17 AAimt + β18 Oneworldt + β19 AAimt × Oneworldt
+ β20 ATItAA + β21 AAimt × ATIt
AA
+ αi + γt + originm + destm + εimt. (2)
Ximt is a vector of control variables that are hypothesize to influence a product’s routing
quality. These controls include: (1) a measure of the origin presence of the ticketing carrier,
captured by variable, Opres; (2) the minimum distance between the origin and destination,
captured by variables, Mindist_going and Mindist_coming; (3) the number of products that
competes with the product in question, captured by variables, N_comp_nonstop_going,
N_comp_nonstop_coming, N_comp_interstop_going, and N_comp_interstop_coming
respectively. The set of variables in (3) control for the level of competition a product faces by
type of competing products. Additionally, dummy variables are included in Ximt that indicate if
the product is traditionally codeshared or virtually codeshared. Operating carrier fixed effects
13
(αi), year and quarter fixed effects (γt), origin fixed effects (originm) and destination fixed effects
(destm) are included to control for their unobserved effects on a product’s routing quality.
The specification in equation (2) can identify how alliance participation and ATI
membership affect routing quality of a carrier’s products. This is achieved through a difference-
in-differences identification approach through the use of interaction variables. UA, DL and AA
are dummy variables indicating if the ticketing carrier is United Airlines, Delta Airlines or
American Airlines, respectively. Star, Skyteam and Oneworld are as previously defined.
Likewise, ATIUA, ATI
DL and ATIAA are as previously defined. The specification in equation (2)
implies that the routing quality of products offered by United Airlines, Delta Airlines or
American Airlines depends on the number of alliance and ATI partners. Therefore, β3, β10 and
β17 by themselves capture how the routing quality of products offered by each of these carriers
differs from the routing quality of products offered by other carriers on average if the respective
carrier had no alliance or ATI partners. The coefficient estimates of the interaction variables
then capture how an additional alliance member or ATI partner affects the routing quality of the
respective ticketing carrier’s products relative to products offered by other carriers.8
One of the key variables in this analysis is the interaction variable, UA×Star. The
coefficient on this interaction variable, β5, indicates how, on average, an additional member in
the Star alliance affects the routing quality of United Airlines’ products relative to the routing
quality of non-United products, all else constant. A positive value for β5 indicates that an
additional member in the Star alliance increases the routing quality of United Airlines’ products
relative to non-United products, while a negative value indicates a relative decrease in routing
quality of United Airlines’ products. Similarly, β7, indicates how the routing quality of United
Airlines’ products change on average relative to non-United products when United receives an
additional ATI partner. Note that β4 and β6 respectively capture how an additional member in
the Star alliance and an additional ATI partner for United Airlines affect the routing quality of
other carriers’ products on average, all else constant. The total effect of an additional Star
8 ∂Routing_quality/∂UA = β3 + β5Star + β7ATI
UA + β9TUA/CO. How the routing quality of United’s products compare
to products of other carriers depends on the number of alliance members (Star), ATI partners (ATIUA), and whether
the time period is before or after the United/Continental merger. A positive estimate of β5 indicates that each alliance partner increases the routing quality of United Airlines’ products relative to other carriers’ products on average, and an analogous interpretation for β7 in case of United Airlines acquiring an additional ATI partner. A positive estimate of β9 indicates that the average routing quality of the set of products offered by United has increased relative to the average routing quality of products offered by other carrier’s after the merger with Continental.
14
alliance member can be calculated as β4 + β5.9
To help identify the potential routing quality impacts of two domestic mergers -
United/Continental merger and Delta/Northwest merger - we construct two zero-one time period
dummy variables, TUA/CO and TDL/NW, respectively. These time period dummy variables that take
the value one during post-merger time periods for the respective mergers, i.e., TUA/CO takes the
value of one for time periods beyond and including the fourth quarter of 2010, while TDL/NW
takes the value of one for time periods beyond and including the fourth quarter of 2008.
Therefore, β8 measures systematic changes in routing quality of non-UA/CO products that
occurred subsequent to the UA/CO merger, and β9 measures how the routing quality of UA
products change relative to other carriers' products subsequent to the UA/CO merger.
This total effect captures the total change in
routing quality of United Airlines’ products on average with an additional member in the Star
alliance. Similarly, the total effect of an additional ATI partner of United can be calculated as β6
+ β7. β11, β12, β13 and β14 can be interpreted similarly for Delta Airlines and the Skyteam
alliance, while β18, β19, β20 and β21 can be interpreted similarly for American Airlines and the
Oneworld alliance.
10
As mentioned previously, one characteristic of the International Passenger Origin and
Destination Survey is that it contains information for the going and coming portions of roundtrip
Thus, a
positive estimate of β9 indicates that the merger increased the average routing quality of United’s
products relative to other carriers’ products. The sum of β8 and β9 tells one how the total routing
quality of United’s products changed on average after the merger. Analogous interpretations
hold for β15 and β16 in case of the Delta Airlines and Northwest Airlines merger.
9 ∂Routing_quality/∂Star = β4 + β5UA. The effect an additional Star alliance member has on routing quality depends on whether the product is a United Airlines product (i.e. the effect depends on whether UA = 0 or UA = 1). β4 captures the effect of Star when UA = 0. β4 + β5 captures the effect of Star when UA = 1. For instance, if the coefficient estimate for this interaction term (β5) is statistically significant, it means an additional Star Alliance member affects the routing quality of United products differently than products offered by other carriers. So β5 illustrates how the routing quality of United products change relative to products offered by other carriers. In order to determine whether the overall routing quality of United’s products increase or decrease, one must consider the coefficients estimates of both β4 and β5. 10 ∂Routing_quality/∂T
UA/CO = β8 + β9UA. This partial derivative illustrates that the effect of the United/Continental
merger on routing quality depends on whether the product is a United Airlines product (i.e. the effect depends on whether UA = 0 or UA = 1). β8 captures the effect of the merger when UA = 0. β8 + β9 captures the effect of the merger when UA = 1. For instance, if the coefficient estimate for the interaction term (β9) is statistically significant, it means that the merger affects the routing quality of United products differently than products offered by other carriers. So β9 illustrates how the routing quality of United products change relative to products offered by other carriers as a result of the merger. In order to determine whether the overall routing quality of United’s products increase or decrease, one must consider the coefficients estimates of both β8 and β9.
15
itineraries. The method proposed in this study is to separately examine the going and coming
portions. In line with this, the reduced-form equation (2) is estimated under three sets of
information. Equation (2) is estimated using only the information for the going portion of the
itinerary, using only information for the coming portion of the itinerary, and using information
from the entire itinerary.
4. Estimation Results
4.1 The Effects of Alliance Membership and ATI on Average Routing Quality
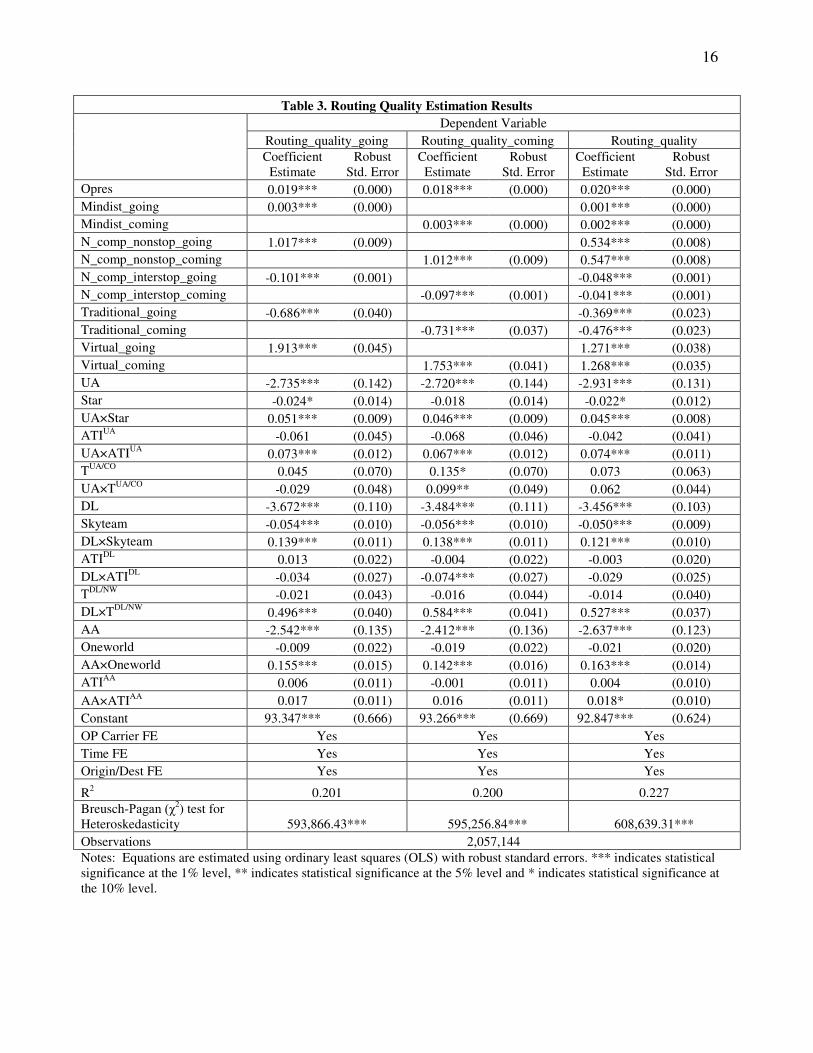
Table 3 reports parameter estimates for equation (2). Regressions are estimated using
ordinary least squares (OLS) with robust standard errors. The first column in the table shows
estimation results based on information from the going portion of each itinerary, estimates in the
second column are based on information from the coming portion of each itinerary, and
estimates in the third column are based on information from each complete itinerary. The
qualitative results are quite consistent across each column of estimates. For brevity, the
following discussion focuses on estimation results based on information from each complete
itinerary.
The first point to be made is in regard to the constant term. The constant term of 92.85
indicates that the minimum distance between an origin and destination is on average 92.85% of
the itinerary distances actually flown by passengers when all independent variables in the
regression have a value of zero. Although, this mean will change as values of the independent
variables change. The result regarding origin presence, Opres, suggests that each additional
airport that a carrier offers nonstop service to from the market’s origin airport increases routing
quality of the carriers’ products in that market by 0.02 percentage points on average. In other
words, the mean distance flown by passengers decreases and becomes closer to the minimum
distance between the origin and destination.
16
Table 3. Routing Quality Estimation Results
Dependent Variable
Routing_quality_going Routing_quality_coming Routing_quality
Coefficient
Estimate Robust
Std. Error Coefficient Estimate
Robust Std. Error
Coefficient Estimate
Robust Std. Error
Opres 0.019*** (0.000) 0.018*** (0.000) 0.020*** (0.000)
Mindist_going 0.003*** (0.000) 0.001*** (0.000)
Mindist_coming 0.003*** (0.000) 0.002*** (0.000)
N_comp_nonstop_going 1.017*** (0.009) 0.534*** (0.008)
N_comp_nonstop_coming 1.012*** (0.009) 0.547*** (0.008)
N_comp_interstop_going -0.101*** (0.001) -0.048*** (0.001)
N_comp_interstop_coming -0.097*** (0.001) -0.041*** (0.001)
Traditional_going -0.686*** (0.040) -0.369*** (0.023)
Traditional_coming -0.731*** (0.037) -0.476*** (0.023)
Virtual_going 1.913*** (0.045) 1.271*** (0.038)
Virtual_coming 1.753*** (0.041) 1.268*** (0.035)
UA -2.735*** (0.142) -2.720*** (0.144) -2.931*** (0.131)
Star -0.024* (0.014) -0.018 (0.014) -0.022* (0.012)
UA×Star 0.051*** (0.009) 0.046*** (0.009) 0.045*** (0.008)
ATIUA -0.061 (0.045) -0.068 (0.046) -0.042 (0.041)
UA×ATIUA 0.073*** (0.012) 0.067*** (0.012) 0.074*** (0.011)
TUA/CO 0.045 (0.070) 0.135* (0.070) 0.073 (0.063)
UA×TUA/CO -0.029 (0.048) 0.099** (0.049) 0.062 (0.044)
DL -3.672*** (0.110) -3.484*** (0.111) -3.456*** (0.103)
Skyteam -0.054*** (0.010) -0.056*** (0.010) -0.050*** (0.009)
DL×Skyteam 0.139*** (0.011) 0.138*** (0.011) 0.121*** (0.010)
ATIDL 0.013 (0.022) -0.004 (0.022) -0.003 (0.020)
DL×ATIDL -0.034 (0.027) -0.074*** (0.027) -0.029 (0.025)
TDL/NW -0.021 (0.043) -0.016 (0.044) -0.014 (0.040)
DL×TDL/NW 0.496*** (0.040) 0.584*** (0.041) 0.527*** (0.037)
AA -2.542*** (0.135) -2.412*** (0.136) -2.637*** (0.123)
Oneworld -0.009 (0.022) -0.019 (0.022) -0.021 (0.020)
AA×Oneworld 0.155*** (0.015) 0.142*** (0.016) 0.163*** (0.014)
ATIAA 0.006 (0.011) -0.001 (0.011) 0.004 (0.010)
AA×ATIAA 0.017 (0.011) 0.016 (0.011) 0.018* (0.010)
Constant 93.347*** (0.666) 93.266*** (0.669) 92.847*** (0.624)
OP Carrier FE Yes Yes Yes
Time FE Yes Yes Yes
Origin/Dest FE Yes Yes Yes
R2 0.201 0.200 0.227
Breusch-Pagan (χ2) test for Heteroskedasticity 593,866.43*** 595,256.84*** 608,639.31***
Observations 2,057,144
Notes: Equations are estimated using ordinary least squares (OLS) with robust standard errors. *** indicates statistical significance at the 1% level, ** indicates statistical significance at the 5% level and * indicates statistical significance at the 10% level.
17
The estimates regarding Mindist_going and Mindist_coming indicate that the greater the
distance between an origin and destination, the greater the routing quality for products in the
market on average. The number of competing products a given product faces in a market also
impacts the product’s routing quality. A given product’s routing quality tends to be higher the
greater the number of competing products with nonstop service (going or coming) it faces. In
contrast, a given product’s routing quality tends to be lower the greater the number of competing
products with interstop service (going or coming) it faces.
The results indicating the effects of codesharing also provide interesting results. A
product can be online, traditionally codeshared or virtually codeshared. The results indicate that
products where the going or coming portion are traditionally codeshared have lower routing
quality than online products on average. Specifically, the going (coming) portion of itineraries
that are traditionally codeshared have routing quality that is on average 0.37 percentage points
(0.48 points) lower than routing quality of online itineraries. Perhaps this result is primarily
driven by the fact that traditional codeshared products require intermediate stop(s) to facilitate a
change of operating carrier, while some online products do not have an intermediate stop.
On the other hand, products in which the going or coming portion of the itinerary are
virtually codeshared have higher routing quality than online products on average. Routing
quality for products where the going (coming) itinerary portion is virtually codeshared is on
average 1.27 percentage points (1.27 percentage points) higher than if the itinerary portion was
online. This result suggests that ticketing carriers of virtual codeshare products tend to practice
this type of codesharing with operating carriers that offer online products with higher routing
quality than the ticketing carriers’ own online products.
The key variables in this analysis are the variables involving the carriers United Airlines,
Delta Airlines and American Airlines as well as the variables regarding membership changes in
their respective alliance and ATI agreement. The coefficient estimate on UA suggests that in the
absence of UA having any alliance members or ATI partners, and prior to merging with
Continental Airlines, the mean routing quality for products offered by United Airlines is
estimated to be 2.93 percentage points lower than the mean routing quality of products offered
by other airlines. Analogous estimates of the mean routing quality of Delta Airlines’ and
American Airlines’ products are about 3.46 and 2.64 percentage points lower than the mean
routing quality of products offered by other airlines, respectively. However, the positive
18
coefficient estimates on the interaction terms UA × Star and UA × ATIUA indicate that as the Star
alliance expands or United Airlines gains an additional ATI partner, the routing quality of United
Airlines’ products increases relative to the routing quality of other carriers’ products.
The coefficient estimate on Star indicates that an additional member in the Star alliance is
associated with lower routing quality of non-United Airlines products by 0.02 percentage points,
and the coefficient estimate for Skyteam indicates that the routing quality of non-Delta Airlines
products decreases by 0.05 percentage points on average with each additional member of the
Skyteam alliance.
The coefficient estimates on the interaction term, UA×Star, indicates that each additional
member in the Star alliance increases the routing quality of United Airline’s products relative to
other carriers’ products by 0.05 percentage points on average. Table 3.1 provides estimates of
the total effect of alliance membership and ATI partnerships. The estimates regarding the total
effect of an additional Star alliance member (-0.022+0.045) provide some evidence that on
average the routing quality of United Airlines’ products increase with each additional Star
alliance member. The coefficient estimate for UA×ATIUA indicates that each additional ATI
partner for United Airlines increases the relative routing quality of United Airlines’ products by
0.07 percentage points on average.
The results suggest that each additional member in the Skyteam alliance increases the
routing quality of Delta Airlines’ products relative other carriers’ products on average by 0.12
percentage points. The total effect of an additional Skyteam member indicates an average
increase in routing quality of Delta Airline’s products of about 0.07 percentage points. It is
important to note there is evidence that ATI partnerships involving Delta Airlines are associated
with lower routing quality for Delta Airlines’ products by 0.08 percentage points on average for
the coming portion of itineraries. Although, this result is mixed among the three specifications.
Each additional member in the Oneworld alliance, and each additional ATI partner,
increase the routing quality of American Airlines’ products relative to other carriers’ products by
0.16 percentage points and 0.02 percentage points on average, respectively. The total effect of
an additional Oneworld member or ATI partner for American Airlines is associated with an
increase in routing quality of about 0.14 percentage points and 0.02 percentage points on
average, respectively.
19
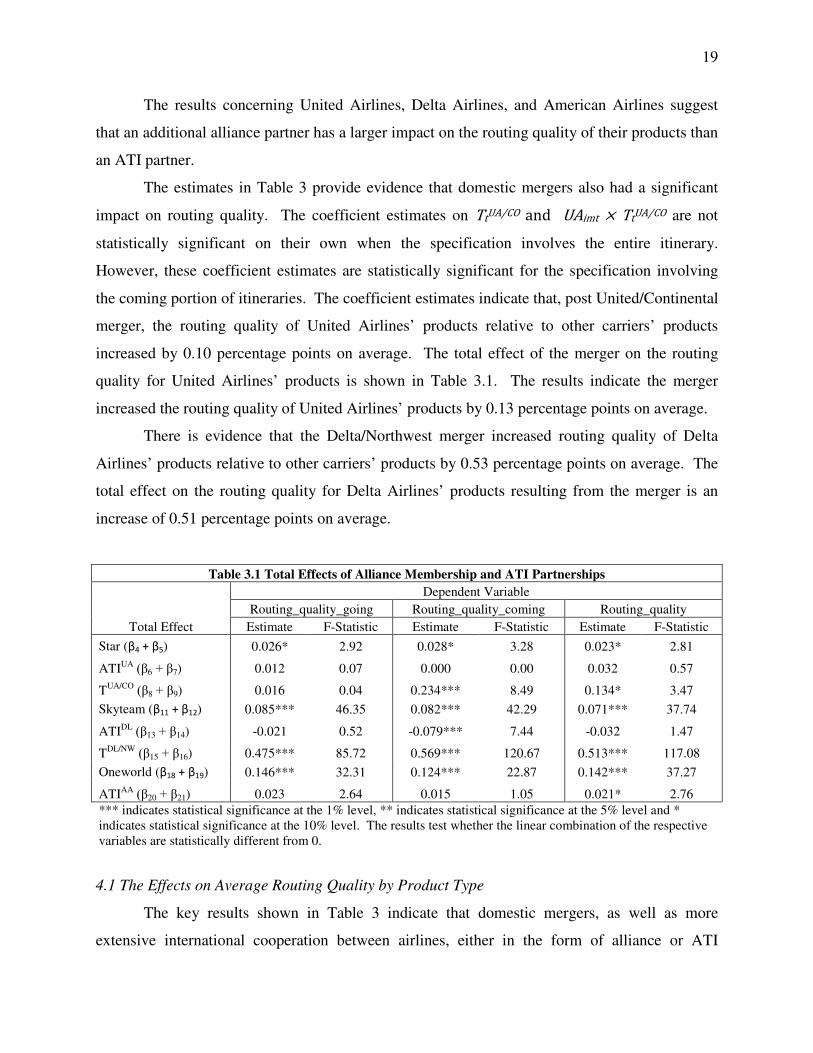
The results concerning United Airlines, Delta Airlines, and American Airlines suggest
that an additional alliance partner has a larger impact on the routing quality of their products than
an ATI partner.
The estimates in Table 3 provide evidence that domestic mergers also had a significant
impact on routing quality. The coefficient estimates on TtUA/CO and UAimt × Tt
UA/CO are not
statistically significant on their own when the specification involves the entire itinerary.
However, these coefficient estimates are statistically significant for the specification involving
the coming portion of itineraries. The coefficient estimates indicate that, post United/Continental
merger, the routing quality of United Airlines’ products relative to other carriers’ products
increased by 0.10 percentage points on average. The total effect of the merger on the routing
quality for United Airlines’ products is shown in Table 3.1. The results indicate the merger
increased the routing quality of United Airlines’ products by 0.13 percentage points on average.
There is evidence that the Delta/Northwest merger increased routing quality of Delta
Airlines’ products relative to other carriers’ products by 0.53 percentage points on average. The
total effect on the routing quality for Delta Airlines’ products resulting from the merger is an
increase of 0.51 percentage points on average.
Table 3.1 Total Effects of Alliance Membership and ATI Partnerships
Dependent Variable
Routing_quality_going Routing_quality_coming Routing_quality
Total Effect Estimate F-Statistic Estimate F-Statistic Estimate F-Statistic
Star (β4 + β5) 0.026* 2.92 0.028* 3.28 0.023* 2.81
ATIUA (β6 + β7) 0.012 0.07 0.000 0.00 0.032 0.57
TUA/CO (β8 + β9) 0.016 0.04 0.234*** 8.49 0.134* 3.47
Skyteam (β11 + β12) 0.085*** 46.35 0.082*** 42.29 0.071*** 37.74
ATIDL (β13 + β14) -0.021 0.52 -0.079*** 7.44 -0.032 1.47
TDL/NW (β15 + β16) 0.475*** 85.72 0.569*** 120.67 0.513*** 117.08
Oneworld (β18 + β19) 0.146*** 32.31 0.124*** 22.87 0.142*** 37.27
ATIAA (β20 + β21) 0.023 2.64 0.015 1.05 0.021* 2.76
*** indicates statistical significance at the 1% level, ** indicates statistical significance at the 5% level and * indicates statistical significance at the 10% level. The results test whether the linear combination of the respective variables are statistically different from 0.
4.1 The Effects on Average Routing Quality by Product Type
The key results shown in Table 3 indicate that domestic mergers, as well as more
extensive international cooperation between airlines, either in the form of alliance or ATI
20
membership increase, are associated with relative increases in the merging or cooperating
airlines' product quality. Equation (2) can be modified to identify changes in relative routing
quality by types of products when there is: (i) an additional alliance member; (ii) an additional
ATI partner; or (iii) a domestic merger. The routing quality effects by product type are identified
by the coefficient estimates on three-way interaction variables included in the regressions. For
example, the coefficient estimates on three-way interaction variables, UA×Star×online,
UA×Star×traditional, and UA×Star×virtual, identify the extent to which increases in
membership of the Star alliance influence routing quality of United Airline’s online, traditional
codeshare, and virtual codeshare products relative to other carriers’ products respectively.
Analogous three-way interaction variables in the cases of the other two alliances (Skyteam and
Oneworld) and carriers (Delta Airlines and American Airlines) are included in the regressions to
identify analogous relative routing quality effects by product types.
An increase in the routing quality of a carrier’s online products suggests that the carrier’s
rearrangement of its own network resulted in new routing to more conveniently transport
passengers between their origin and destination. An increase in the routing quality of a carrier’s
codeshare products suggests that an expansion in alliance members/ATI partners resulted in new
higher quality routing options that require using its partner carriers’ networks.
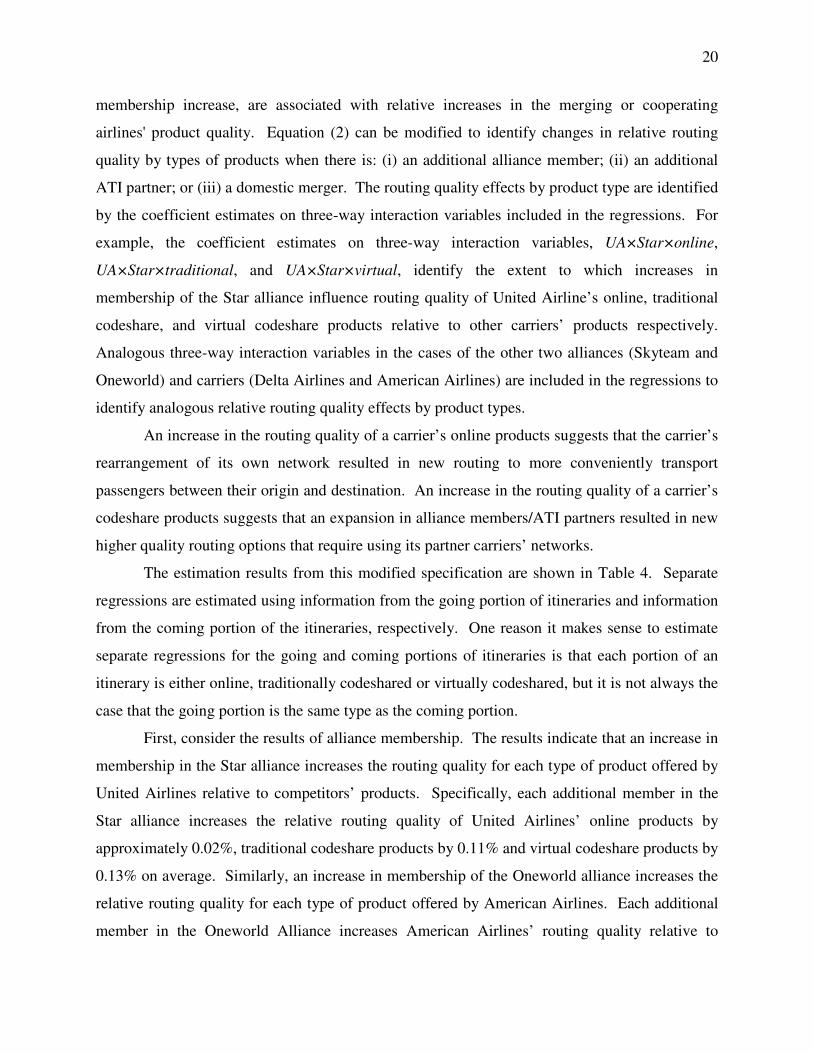
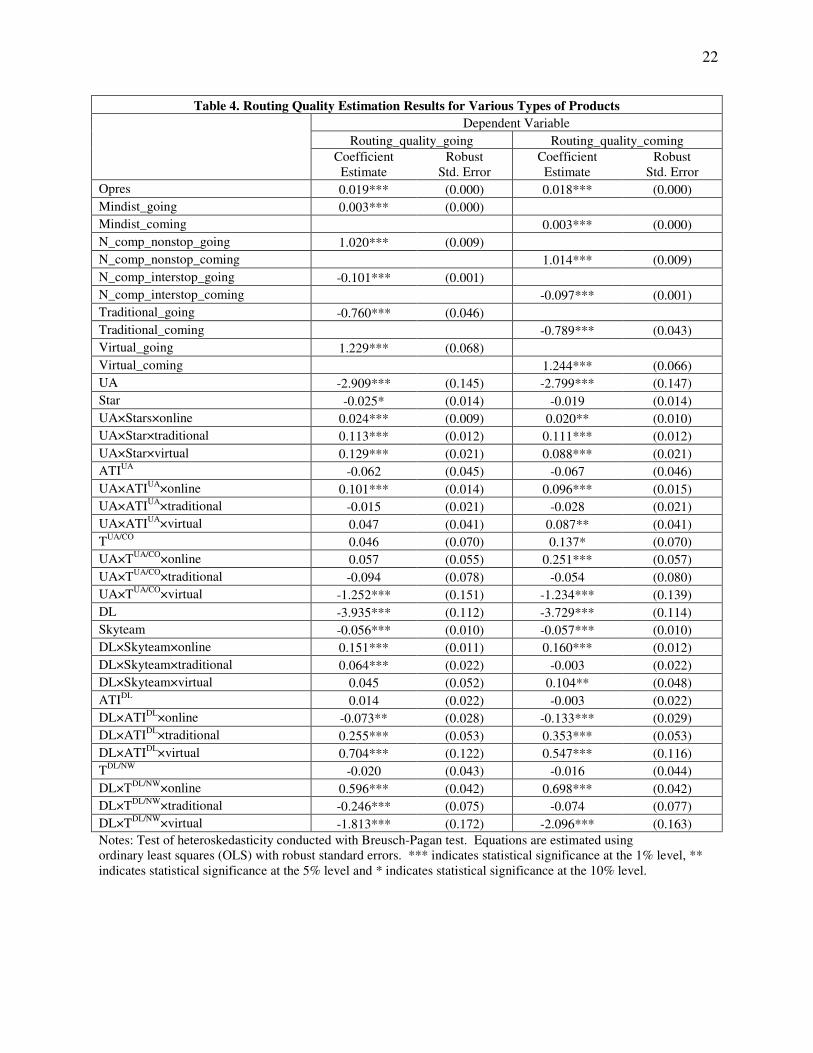
The estimation results from this modified specification are shown in Table 4. Separate
regressions are estimated using information from the going portion of itineraries and information
from the coming portion of the itineraries, respectively. One reason it makes sense to estimate
separate regressions for the going and coming portions of itineraries is that each portion of an
itinerary is either online, traditionally codeshared or virtually codeshared, but it is not always the
case that the going portion is the same type as the coming portion.
First, consider the results of alliance membership. The results indicate that an increase in
membership in the Star alliance increases the routing quality for each type of product offered by
United Airlines relative to competitors’ products. Specifically, each additional member in the
Star alliance increases the relative routing quality of United Airlines’ online products by
approximately 0.02%, traditional codeshare products by 0.11% and virtual codeshare products by
0.13% on average. Similarly, an increase in membership of the Oneworld alliance increases the
relative routing quality for each type of product offered by American Airlines. Each additional
member in the Oneworld Alliance increases American Airlines’ routing quality relative to
21
competitors’ products for online, traditional codeshare, and virtual codeshare products by about
0.13%, 0.21%, and 1.18% on average, respectively.
In the case of Delta Airlines, an additional Skyteam member increases the relative routing
quality of Delta Airlines’ online products by about 0.15% on average. Furthermore, there is
evidence that an additional Skyteam member increases the relative routing quality of Delta
Airlines’ traditional and virtual codeshare products by 0.06% and 0.10% on average.11
Next, consider the effects of ATI. The results regarding the effects of ATI on routing
quality of the different product types are mixed. With regard to United Airlines, each additional
ATI partner increases relative routing quality of United Airlines’ online products, but not the
relative routing quality of its codeshare products. More precisely, each additional ATI partner
increases relative routing quality for United Airlines’ online products by about 0.10% on
average. With respect to Delta Airlines, each additional ATI partner decreases the relative
routing quality of Delta Airlines’ online products by 0.07%, but increases with traditional
codeshare and virtual codeshare products respectively by 0.26% and 0.70% on average. Finally,
the results suggest that an additional ATI partner with American Airlines increases relative
routing quality of American Airlines’ online products by about 0.04% on average. However, an
additional ATI partner decreases relative routing quality for traditional and virtual codeshare
products by 0.05% and 1.28% on average, respectively.
Collectively, these results suggest that an increase in alliance membership is
accompanied with higher relative routing quality for each type of product a carrier can offer. In
the cases of United Airlines and American Airlines, the types of products that experience the
largest increase in relative routing quality are virtually codeshared products. This suggests that
the greater the number of alliance members, the greater the number of flights in which other
alliance members can sell to conveniently transport passengers. In the case of Delta Airlines, the
types of products that experience the largest increase in relative routing quality are online
products. The results regarding alliance membership and a carrier’s online products suggest that
increases in the membership of a carrier’s alliance incentivize that carrier to rearrange its own
network to accommodate the partner carriers’ network, and this network rearrangement tends to
result in products with higher routing quality.
11 Note that the coefficient indicating the effect of Skyteam alliance membership on the routing quality of Delta Airlines’ traditional codeshare products is not statistically significant on the coming portion of itineraries, and the effect on virtual codeshare products is not statistically significant on the going portion of itineraries.
22
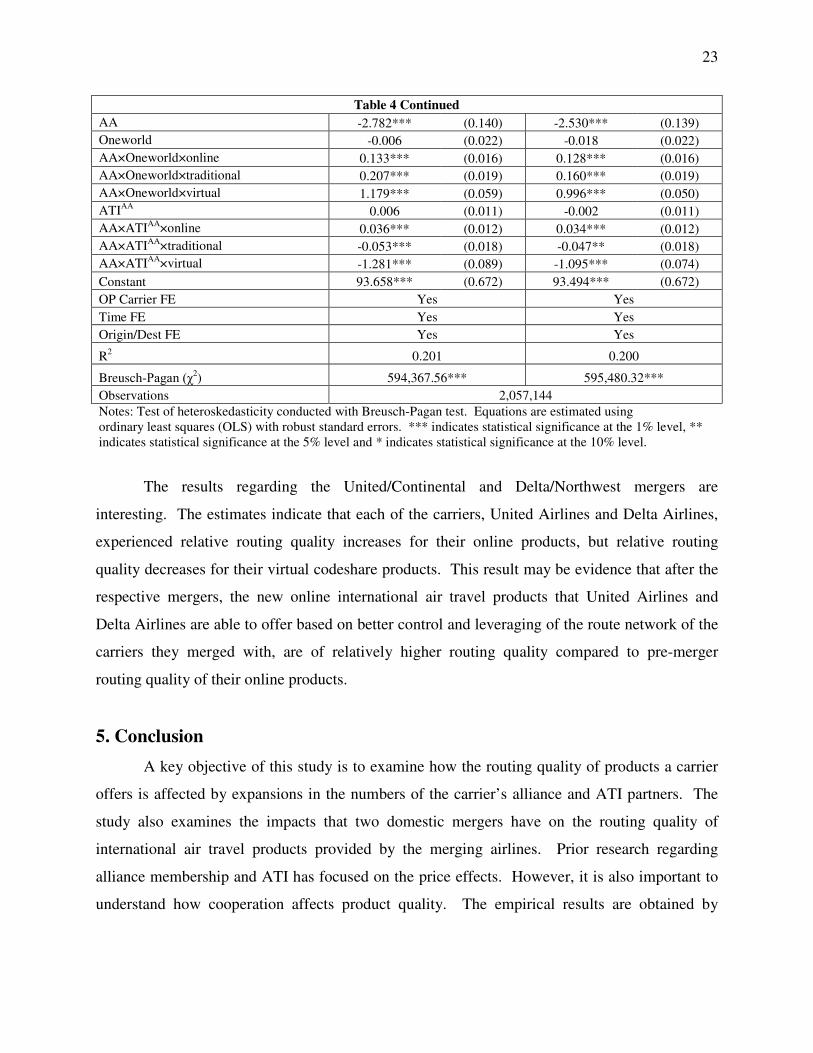
Table 4. Routing Quality Estimation Results for Various Types of Products
Dependent Variable
Routing_quality_going Routing_quality_coming
Coefficient Estimate
Robust Std. Error
Coefficient Estimate
Robust Std. Error
Opres 0.019*** (0.000) 0.018*** (0.000)
Mindist_going 0.003*** (0.000)
Mindist_coming 0.003*** (0.000)
N_comp_nonstop_going 1.020*** (0.009)
N_comp_nonstop_coming 1.014*** (0.009)
N_comp_interstop_going -0.101*** (0.001)
N_comp_interstop_coming -0.097*** (0.001)
Traditional_going -0.760*** (0.046)
Traditional_coming -0.789*** (0.043)
Virtual_going 1.229*** (0.068)
Virtual_coming 1.244*** (0.066)
UA -2.909*** (0.145) -2.799*** (0.147)
Star -0.025* (0.014) -0.019 (0.014)
UA×Stars×online 0.024*** (0.009) 0.020** (0.010)
UA×Star×traditional 0.113*** (0.012) 0.111*** (0.012)
UA×Star×virtual 0.129*** (0.021) 0.088*** (0.021)
ATIUA -0.062 (0.045) -0.067 (0.046)
UA×ATIUA×online 0.101*** (0.014) 0.096*** (0.015)
UA×ATIUA×traditional -0.015 (0.021) -0.028 (0.021)
UA×ATIUA×virtual 0.047 (0.041) 0.087** (0.041)
TUA/CO 0.046 (0.070) 0.137* (0.070)
UA×TUA/CO×online 0.057 (0.055) 0.251*** (0.057)
UA×TUA/CO×traditional -0.094 (0.078) -0.054 (0.080)
UA×TUA/CO×virtual -1.252*** (0.151) -1.234*** (0.139)
DL -3.935*** (0.112) -3.729*** (0.114)
Skyteam -0.056*** (0.010) -0.057*** (0.010)
DL×Skyteam×online 0.151*** (0.011) 0.160*** (0.012)
DL×Skyteam×traditional 0.064*** (0.022) -0.003 (0.022)
DL×Skyteam×virtual 0.045 (0.052) 0.104** (0.048)
ATIDL 0.014 (0.022) -0.003 (0.022)
DL×ATIDL×online -0.073** (0.028) -0.133*** (0.029)
DL×ATIDL×traditional 0.255*** (0.053) 0.353*** (0.053)
DL×ATIDL×virtual 0.704*** (0.122) 0.547*** (0.116)
TDL/NW -0.020 (0.043) -0.016 (0.044)
DL×TDL/NW×online 0.596*** (0.042) 0.698*** (0.042)
DL×TDL/NW×traditional -0.246*** (0.075) -0.074 (0.077)
DL×TDL/NW×virtual -1.813*** (0.172) -2.096*** (0.163)
Notes: Test of heteroskedasticity conducted with Breusch-Pagan test. Equations are estimated using ordinary least squares (OLS) with robust standard errors. *** indicates statistical significance at the 1% level, ** indicates statistical significance at the 5% level and * indicates statistical significance at the 10% level.
23
Table 4 Continued
AA -2.782*** (0.140) -2.530*** (0.139)
Oneworld -0.006 (0.022) -0.018 (0.022)
AA×Oneworld×online 0.133*** (0.016) 0.128*** (0.016)
AA×Oneworld×traditional 0.207*** (0.019) 0.160*** (0.019)
AA×Oneworld×virtual 1.179*** (0.059) 0.996*** (0.050)
ATIAA 0.006 (0.011) -0.002 (0.011)
AA×ATIAA×online 0.036*** (0.012) 0.034*** (0.012)
AA×ATIAA×traditional -0.053*** (0.018) -0.047** (0.018)
AA×ATIAA×virtual -1.281*** (0.089) -1.095*** (0.074)
Constant 93.658*** (0.672) 93.494*** (0.672)
OP Carrier FE Yes Yes
Time FE Yes Yes
Origin/Dest FE Yes Yes
R2 0.201 0.200
Breusch-Pagan (χ2) 594,367.56*** 595,480.32***
Observations 2,057,144
Notes: Test of heteroskedasticity conducted with Breusch-Pagan test. Equations are estimated using ordinary least squares (OLS) with robust standard errors. *** indicates statistical significance at the 1% level, ** indicates statistical significance at the 5% level and * indicates statistical significance at the 10% level.
The results regarding the United/Continental and Delta/Northwest mergers are
interesting. The estimates indicate that each of the carriers, United Airlines and Delta Airlines,
experienced relative routing quality increases for their online products, but relative routing
quality decreases for their virtual codeshare products. This result may be evidence that after the
respective mergers, the new online international air travel products that United Airlines and
Delta Airlines are able to offer based on better control and leveraging of the route network of the
carriers they merged with, are of relatively higher routing quality compared to pre-merger
routing quality of their online products.
5. Conclusion
A key objective of this study is to examine how the routing quality of products a carrier
offers is affected by expansions in the numbers of the carrier’s alliance and ATI partners. The
study also examines the impacts that two domestic mergers have on the routing quality of
international air travel products provided by the merging airlines. Prior research regarding
alliance membership and ATI has focused on the price effects. However, it is also important to
understand how cooperation affects product quality. The empirical results are obtained by
24
estimating reduced-form product quality regressions, which are specified using a difference-in-
differences approach for identifying relevant quality effects.
The results give strong evidence indicating that cooperation among international carriers
is associated with an increase in routing quality of a carrier’s products on average. This result
holds for expansions in alliance membership for each of the three carriers examined: United
Airlines, Delta Airlines and American Airlines. Furthermore, the results suggest that increases in
alliance membership are associated with relative routing quality increases for each type of
product the carrier offers (online, traditional codeshare and virtual codeshare) with virtual
codeshare products experiencing the greatest relative routing quality increase for United Airlines
and American Airlines. The results regarding the impact of ATI on routing quality of codeshare
products are mixed among the three carriers. Furthermore, the United/Continental and
Delta/Northwest domestic mergers appear to have increased the routing quality for passengers
travelling internationally with United Airlines and Delta Airlines.
Much of the literature to date has focused on the price effects of airline cooperation and
mergers, and have used these price effects to infer associated welfare effects. It is well-known in
economics that, all else equal, consumer welfare is positively related to product quality. This
research formally provides evidence of product quality effects associated with airline
cooperation and mergers, which implies that a complete welfare evaluation of these strategic
choices of airlines should not ignore product quality effects.
This paper leaves unanswered the question of whether product quality is worse for
itineraries involving nonaligned carriers than for alliance itineraries. Future work may consider
answering this question.
25
Appendix
Table A1. Chronological History of Alliance Participation by Alliance
Alliance Carriers Dates beginning Dates
ended
Star United Airlines, Air Canada, Lufthansa, SAS and Thai Airways 5/1997
VARIG Brazilian Airlines 10/1997
Ansett Australia, Air New Zealand and ANA 3/1999
Austrian Airlines Group1 3/2000
Singapore Airlines 4/2000
British Midland and Mexicana Airlines 7/2000
Ansett Australia 3/2002
Asiana Airlines 3/2003
Spanair 4/2003
LOT Polish Airlines 10/2003
Mexicana Airlines 3/2004
US Airways 5/2004
Adria Airways and Croatia Airlines 11/2004
TAP Portugal 5/2005
South African Airways and Swiss Int. Air Lines 4/2006
VARIG Brazilian Airlines 1/2007
Air China and Shanghai Airlines 12/2007
Turkish Airlines 4/2008
EGYPTAIR 7/2008
Continental2 10/2009
SN Brussels Airlines 12/2009
TAM 5/2010
Aegean Airlines 6/2010
Shanghai Airlines 10/2010
1. Austrian Airlines, Tyrolean and Lauda Air compose the Austrian Airlines Group.
2. United Airlines and Continental announce their plan to merge in May, 2010. The merger was approved by the Department of Justice in August, 2010.
26
Table A1 Cont. Chronological History of Alliance Participation by Alliance
Alliance Carriers Dates beginning Dates ended
Oneworld American Airlines, British Airways, Cathay Pacific, Canadian Airlines and Qantas
2/1999
Finnair and Iberia 9/1999
Canadian Airlines 6/2000
Air Lingus and LAN Airlines3 6/2000
Air Lingus 4/2007
Japan Airlines, Malev and Royal Jordanian 4/2007
Mexicana Airlines 11/2009 8/2010
S7 Airlines 11/2010
SkyTeam Delta Airlines, Air France, Aeromexico and Korean Air 6/1999
Czech Airlines 3/2001
Alitalia 7/2001
Continental, Northwest and KLM4 9/2004
Aeroflot 4/2006
Air Europa, Copa Airlines and Kenya Airlines 9/2007
China Southern Airlines 11/2007
Continental and Copa Airlines 10/2009
Northwest5 1/2010
Vietnam Airlines and TAROM Romanian Air 6/2010
China Eastern 6/2011
China Airlines 9/2011
3. LAN-Chile, LAN-Peru, LAN-Argentina and LAN-Ecuador compose LAN Airlines and began offering Oneworld services in 2000, 2002, 2007 and 2007, respectively.
4. Northwest and KLM were alliance partners since 1993.
5. Delta and Northwest announced their plan to merge in April, 2008. The merger was approved by the Department of Justice in October, 2008. However, Northwest continued to operate under the Northwest brand until January, 2010.
27
Table A2. Chronological History of ATI by U.S. Carrier
U.S. Carriers ATI partners ATI approval ATI close-out
Northwest KLM 1/1993
KLM and Alitalia+ 12/1999 10/2001
United Airlines Lufthansa 5/1996
Lufthansa and SAS+ 11/1996
Air Canada 9/1997
Austrian Airlines, Lufthansa and SAS+ 1/2001
Air New Zealand 4/2001
Copa Airlines 5/2001
Asiana 5/2003
Austrian Airlines, Lufthansa, Air Canada, SAS, British Midland, LOT, Swiss International Air Lines and TAP +, 1
2/2007
Austrian Airlines, Lufthansa, Air Canada, SAS, British Midland, LOT, Swiss International Air Lines and TAP, SN Brussels Airlines+1
7/2009
ANA 11/2010
Delta Airlines Austrian Airlines, Sabena and Swissair 6/1996 5/20072
Air France, Alitalia, Czech Airlines 1/2002
Korean Air, Air France, Alitalia and Czech Airlines+
6/2002
Virgin Australia 6/2011
Korean Air, Air France, KLM, Alitalia, Czech Airlines and Northwest
+ 5/2008
American Airlines Canadian Airlines 7/1996 5/20073
LAN-Chile 9/1999
Swissair 5/2000 11/2001
Sabena 5/2000 3/2002
Finnair 7/2002
Swiss International Air Lines 11/2002 8/2005
SN Brussels 4/2004 10/2009
LAN-Chile and LAN-Peru+ 10/2005
British Airways, Iberia, Finnair and Royal Jordanian+
7/2010
Japan Airlines 11/2010
+ indicates an expansion of previous ATI decisions. 1. British Midland did not operate in the alliance beyond 4/2012 2. Although not officially closed until 2007, this alliance was only active until 8/2000 3. Although not officially closed until 2007, this alliance was only active until 6/2000
28
References
Bilotkach, V. (2005), “Price Competition between International Airline Alliances,” Journal of
Transport Economics and Policy, 39: 167-189.
Bilotkach, V. (2011), “Multimarket Contact and Intensity of Competition: Evidence from an
Airline Merger,” Review of Industrial Organization, 38: 95-115.
Brueckner, J. K. (2001), “The Economics of International Codesharing: An Analysis of Airline
Alliances,” International Journal of Industrial Organization, 19: 1475-1498.
Brueckner, J. K. (2003), “International Airfares in the Age of Alliances: The Effects of
Codesharing and Antitrust Immunity,” The Review of Economics and Statistics, 85: 105-
118.
Brueckner, J. K., D. N. Lee, and E. S. Singer (2011), “Alliances, Codesharing, Antitrust
Immunity, and International Airfares: Do Previous Patterns Persist,” Journal of
Competition Law and Economics, 7: 573-602.
Brueckner, J.K., and D. Luo (2014), “Measuring Strategic Firm Interaction in Product-Quality
Choices: The Case of Airline Flight Frequency,” Economics of Transportation, 3: 102-
115.
Brueckner, J. K., and T. W. Whalen (2000), “The Price Effects of International Airline
Alliances,” Journal of Law and Economics, 43: 503-546.
Chen, Y., and P. G. Gayle (2007), “Vertical Contracting between Airlines: An Equilibrium
Analysis of Codeshare Alliances,” International Journal of Industrial Organization, 25:
1046-1060.
Chen, Y. and P. G. Gayle (2014), “Mergers and Product Quality: Evidence from the Airline
Industry,” Manuscript, Kansas State University, 2014.
Clougherty, J. A. (2002), “US Domestic Airline Mergers: The Neglected International
Determinants,” International Journal of Industrial Organization, 20: 557-576.
Flores-Fillol, R., and R. Moner-Colonques (2007), “Strategic Formation of Airline Alliances,”
Journal of Transport Economics and Policy, 41: 427-449.
Hassin, O., and O. Shy (2004), “Code-sharing Agreements and Interconnections in Markets for
International Flights,” Review of International Economics, 12: 337-352.
Mazzeo, M. J. (2003), “Competition and Service Quality in the U.S. Airline Industry,” Review of
Industrial Organization, 22: 275-296.

29
Oum, T. H., J. Park, and A. Zhang (1996), “The Effects of Airline Codesharing Agreements on
Firm Conduct and International Air Fares,” Journal of Transport Economics and Policy,
30: 187-202.
Park, J. (1997), “The Effect of Airline Alliances on markets and Economic Welfare,”
Transportation Research E, 33: 181-195.
Park, J., and A. Zhang (2000), “An Empirical Analysis of Global Airline Alliances: Cases in
North Atlantic Markets,” Review of Industrial Organization, 16: 367-383.
Prince, J., and D. Simon (2014), “Do Incumbents Improve Service Quality in Response to Entry:
Evidence from Airlines’ On-Time Performance,” Managements Science, Forthcoming.
Richard, O. (2003), “Flight Frequency and Mergers in Airline Markets,” International Journal of
Industrial Organization, 21: 907-922.
Rupp, N. G., D. Owens, and L. Plumly (2006), “Does Competition Influence Airline On-Time
Performance?,” Advances in Airline Economics: Competition Policy and Antitrust, Vol.
1, Elsevier, ed. D. Lee.
U.S. Department of Transportation (2007), “Joint Application for Approval of and Antitrust
Immunity for Alliance Agreements (Public Version),” DOT Docket DOT-OST-2007-
28644-0001-0001 < http://www.regulations.gov/#!documentDetail;D=DOT-OST-2007-
28644-0001-0001>.
Whalen, T. (2007), “A Panel Data Analysis of Code-sharing, Antitrust Immunity, and Open
Skies Treaties in International Aviation Markets,” Review of Industrial Organization, 30:
39-61.