product brochure (english) for r&s®vse vector signal ... · gsm/edge/edge evolution ......
TRANSCRIPT

Prod
uct B
roch
ure
| Ver
sion
05.
00
R&S®VSEVector Signal Explorer SoftwareDesktop signal analysis
VSE_bro_en_3607-1371-12_v0500.indd 1 13.12.2017 10:35:03

2
Thanks to the clearly structured menu concept, it is a quick and easy matter to operate the software and control the instruments, and the flexible arrangement of measure-ment displays provides new ways to visualize measure-ment results.
With R&S®VSE, users can analyze and investigate a cap-tured signal over and over again, change parameters and settings, examine the signal in depth and troubleshoot a wide range of signals, from simple BPSK to complex wide-band signals such as IEEE 802.11ac and 4096QAM.
The user interface is clearly structured with a flat menu structure. Users arrange results as required, which greatly facilitates result interpretation.
The R&S®VSE is available in two versions. The basic ver-sion serves the typical R&D work using a desktop PC and a single instrument at the time. The enterprise edition adds connectivity to multiple instruments in parallel as well as in-creased capabilities for parallel processing of measure-ment results typically performed on a server.
Key facts ❙ Supports R&S®FSL/FPS/FSV/FSVA/FSW/FSWP/RTO/ FPL1000/ZNL
❙ Control multiple instruments from one PC ❙ Remote controllable and compatible with R&S®FSW ❙ Advanced pulse analysis with R&S®RTO digital oscilloscopes
❙ Supports all relevant mobile and wireless communications standards
R&S®VSE Vector Signal Explorer SoftwareAt a glanceThe R&S®VSE vector signal explorer software brings the experience and power of Rohde & Schwarz signal analysis to the desktop, offering a wide range of analysis tools for troubleshooting and optimizing designs on your PC. With this software, users analyze and solve problems in analog and digitally modulated signals for a wide range of standards using the signal and spectrum analyzers and digital oscilloscopes from Rohde & Schwarz.
The R&S®VSE vector signal explorer software was devel-oped to bring the power of R&S®FSW signal processing to the engineer’s PC. It analyzes signals from a wide range of instruments as well as files originating from simulations or recorded measurements.
VSE_bro_en_3607-1371-12_v0500.indd 2 13.12.2017 10:35:07

Rohde & Schwarz R&S®VSE Vector Signal Explorer Software 3
R&S®VSE Vector Signal Explorer SoftwareBenefits and key features
The R&S®VSE signal analysis software enables remote signal analysis and debugging on the desktop. Signals can originate from several different instruments that are controlled from one PC. The R&S®VSE easily works with files of recorded data or simulations, saving a trip to the lab. When large amounts of data need to be analyzed, the R&S®VSE can be remotely controlled and is remote con-trol compatible with the R&S®FSW signal and spectrum analyzer
R&S®VSE-K6 ❙ Pulse measurements ▷ page 4
R&S®VSE-K7 ❙ Modulation analysis for AM/FM/φM modulated single carriers ▷ page 5
R&S®VSE-K10 ❙ GSM/EDGE/EDGE Evolution ▷ page 6
R&S®VSE-K60 ❙ Transient analysis ▷ page 7
R&S®VSE-K70 ❙ Vector signal analysis ▷ page 8
R&S®VSE-K72 ❙ WCDMA signal analysis ▷ page 9
R&S®VSE-K91 ❙ WLAN signal analysis ▷ page 10
R&S®VSE-K96 ❙ OFDM analysis ▷ page 11
R&S®VSE-K100/ -K102/-K104 ❙ LTE signal analysis ▷ page 12
R&S®VSE-K106 ❙ LTE narrowband IoT analysis ▷ page 13
VSE_bro_en_3607-1371-12_v0500.indd 3 13.12.2017 10:35:07

4
Measurement parameters ❙ Pulse parameters: pulse width, pulse repetition rate, pulse repetition interval, duty cycle, rise/fall time, settling time
❙ Frequency: carrier frequency, pulse-to-pulse frequency difference, chirp rate, frequency deviation, frequency error
❙ Power: peak power, average power, peak-to-average power, pulse-to-pulse power
❙ Phase: carrier phase, pulse-to-pulse phase difference, phase deviation, phase error
❙ Amplitude droop, ripple, overshoot width ❙ Measurement functions ❙ Point-in-pulse measurements: frequency, amplitude, phase versus pulse, trends and histograms for all parameters
❙ Pulse statistics: standard deviation, average, maximum, minimum
❙ Pulse tables ❙ User-defined measurement parameters
R&S®VSE-K6Pulse measurementsThe R&S®VSE-K6 option measures all relevant parameters such as pulse duration, pulse period, pulse rise and fall times, power drop across a pulse, and intrapulse phase modulation, and produces a trend analysis over many pulses. The user selects which results should be displayed simultaneously on the screen. The R&S®VSE thus delivers a full picture of e.g. a radar system within seconds.
Pulse measurements with split
screen display.
VSE_bro_en_3607-1371-12_v0500.indd 4 13.12.2017 10:35:11
Rohde & Schwarz R&S®VSE Vector Signal Explorer Software 5
R&S®VSE-K7Modulation analysis for AM/FM/φM modulated single carriers
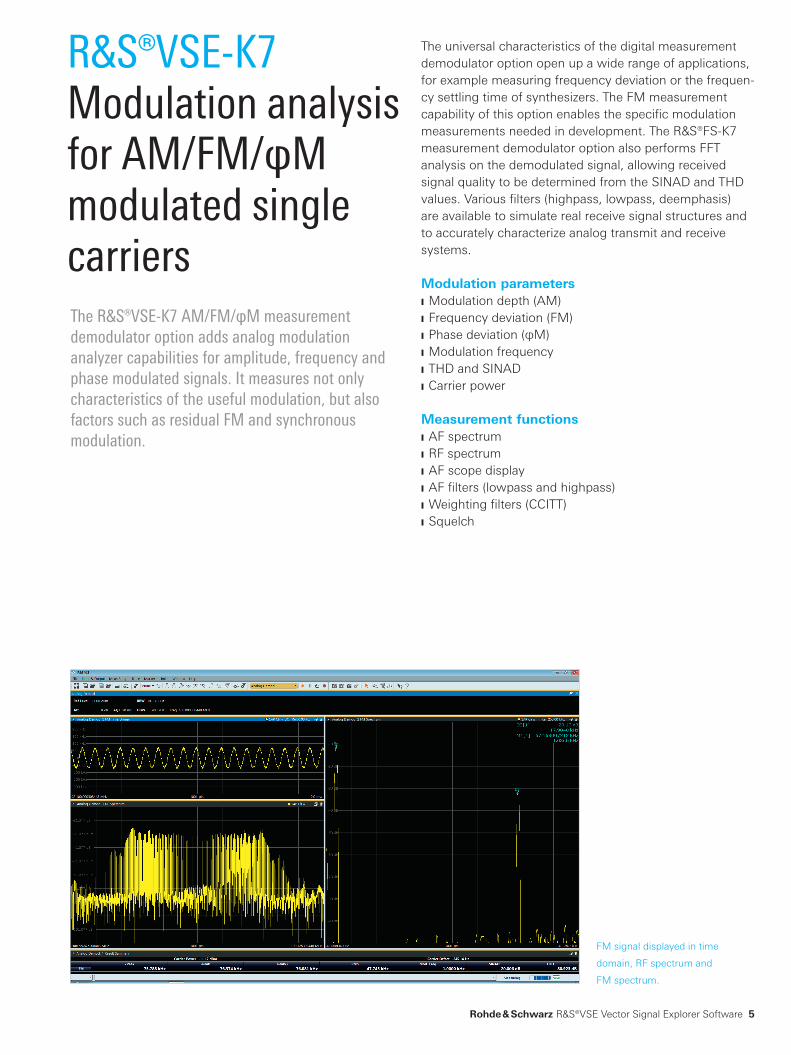
The universal characteristics of the digital measurement demodulator option open up a wide range of applications, for example measuring frequency deviation or the frequen-cy settling time of synthesizers. The FM measurement capability of this option enables the specific modulation measurements needed in development. The ¸FS-K7 measurement demodulator option also performs FFT analysis on the demodulated signal, allowing received signal quality to be determined from the SINAD and THD values. Various filters (highpass, lowpass, deemphasis) are available to simulate real receive signal structures and to accurately characterize analog transmit and receive systems.
Modulation parameters ❙ Modulation depth (AM) ❙ Frequency deviation (FM) ❙ Phase deviation (φM) ❙ Modulation frequency ❙ THD and SINAD ❙ Carrier power
Measurement functions ❙ AF spectrum ❙ RF spectrum ❙ AF scope display ❙ AF filters (lowpass and highpass) ❙ Weighting filters (CCITT) ❙ Squelch
The R&S®VSE-K7 AM/FM/φM measurement demodulator option adds analog modulation analyzer capabilities for amplitude, frequency and phase modulated signals. It measures not only characteristics of the useful modulation, but also factors such as residual FM and synchronous modulation.
FM signal displayed in time
domain, RF spectrum and
FM spectrum.
VSE_bro_en_3607-1371-12_v0500.indd 5 13.12.2017 10:35:14
6
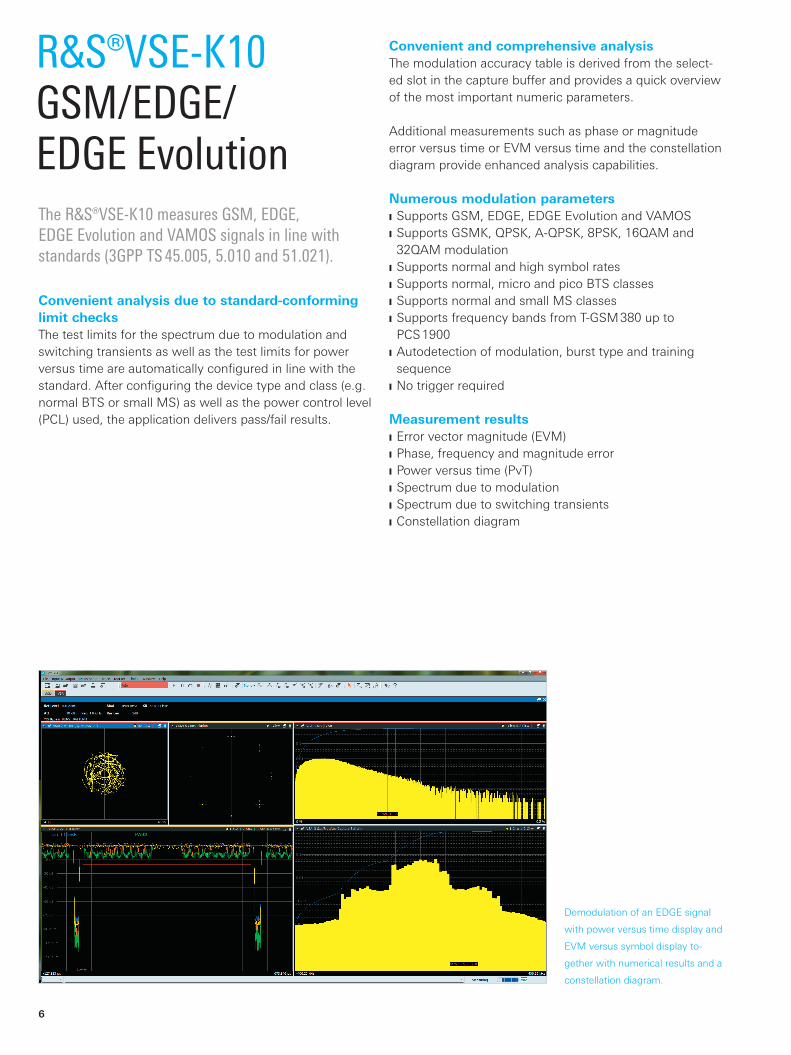
Convenient and comprehensive analysisThe modulation accuracy table is derived from the select-ed slot in the capture buffer and provides a quick overview of the most important numeric parameters.
Additional measurements such as phase or magnitude error versus time or EVM versus time and the constellation diagram provide enhanced analysis capabilities.
Numerous modulation parameters ❙ Supports GSM, EDGE, EDGE Evolution and VAMOS ❙ Supports GSMK, QPSK, A-QPSK, 8PSK, 16QAM and 32QAM modulation
❙ Supports normal and high symbol rates ❙ Supports normal, micro and pico BTS classes ❙ Supports normal and small MS classes ❙ Supports frequency bands from T-GSM 380 up to PCS 1900
❙ Autodetection of modulation, burst type and training sequence
❙ No trigger required
Measurement results ❙ Error vector magnitude (EVM) ❙ Phase, frequency and magnitude error ❙ Power versus time (PvT) ❙ Spectrum due to modulation ❙ Spectrum due to switching transients ❙ Constellation diagram
R&S®VSE-K10GSM/EDGE/EDGE EvolutionThe R&S®VSE-K10 measures GSM, EDGE, EDGE Evolution and VAMOS signals in line with standards (3GPP TS 45.005, 5.010 and 51.021).
Convenient analysis due to standard-conforming limit checksThe test limits for the spectrum due to modulation and switching transients as well as the test limits for power versus time are automatically configured in line with the standard. After configuring the device type and class (e.g. normal BTS or small MS) as well as the power control level (PCL) used, the application delivers pass/fail results.
Demodulation of an EDGE signal
with power versus time display and
EVM versus symbol display to-
gether with numerical results and a
constellation diagram.
VSE_bro_en_3607-1371-12_v0500.indd 6 13.12.2017 10:35:15
Rohde & Schwarz R&S®VSE Vector Signal Explorer Software 7
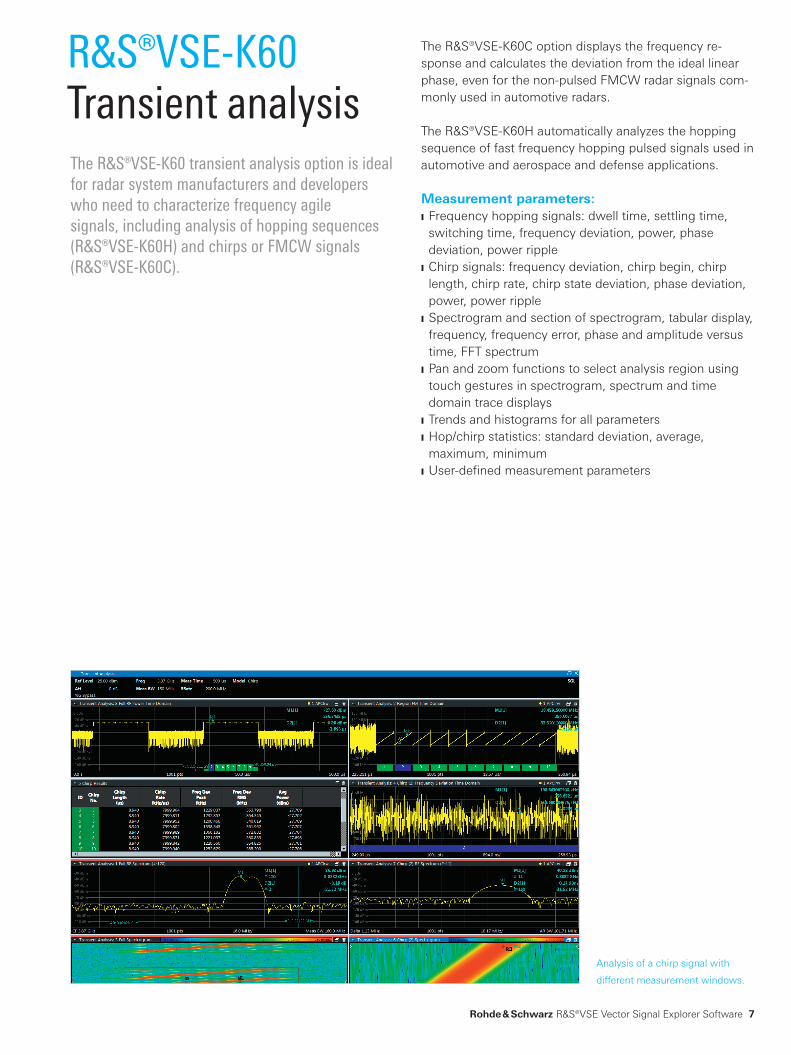
The R&S®VSE-K60C option displays the frequency re-sponse and calculates the deviation from the ideal linear phase, even for the non-pulsed FMCW radar signals com-monly used in automotive radars.
The R&S®VSE-K60H automatically analyzes the hopping sequence of fast frequency hopping pulsed signals used in automotive and aerospace and defense applications.
Measurement parameters: ❙ Frequency hopping signals: dwell time, settling time, switching time, frequency deviation, power, phase deviation, power ripple
❙ Chirp signals: frequency deviation, chirp begin, chirp length, chirp rate, chirp state deviation, phase deviation, power, power ripple
❙ Spectrogram and section of spectrogram, tabular display, frequency, frequency error, phase and amplitude versus time, FFT spectrum
❙ Pan and zoom functions to select analysis region using touch gestures in spectrogram, spectrum and time domain trace displays
❙ Trends and histograms for all parameters ❙ Hop/chirp statistics: standard deviation, average, maximum, minimum
❙ User-defined measurement parameters
The R&S®VSE-K60 transient analysis option is ideal for radar system manufacturers and developers who need to characterize frequency agile signals, including analysis of hopping sequences (R&S®VSE-K60H) and chirps or FMCW signals (R&S®VSE-K60C).
R&S®VSE-K60Transient analysis
Analysis of a chirp signal with
different measurement windows.
VSE_bro_en_3607-1371-12_v0500.indd 7 13.12.2017 10:35:16

8
R&S®VSE-K70Vector signal analysis
Easy operation with graphical supportWith the clearly visualized demodulation stages and asso-ciated settings, even beginners and infrequent users find the correct settings. Based on the description of the signal to be analyzed (e.g. modulation format, continuous or with bursts, symbol rate, transmit filtering), users also quickly find useful settings.
Flexible analysis tools for detailed signal analysis make troubleshooting really easy ❙ Display choices for amplitude, frequency, phase, I/Q, eye diagram; amplitude, phase or frequency error; constellation or vector diagram
❙ Analysis of RF signals or analog and digital baseband signals
❙ Statistical evaluations ❙ Histogram representation ❙ Standard deviation and 95th percentile in the result summary
❙ Spectrum analyses of the measurement and error signal considerably help users find signal errors such as incorrect filtering and spurious emissions
❙ Flexible burst search for analyzing complex signal combinations, short bursts or signal mix – capabilities that go beyond the scope of many signal analyzers
❙ Bit error calculation on known data sequences ❙ Equalizer for finding the optimum filter design
The R&S®VSE-K70 option flexibly analyzes digitally modulated single carriers down to the bit level. The clearly structured operating concept simplifies measurements, despite the wide range of analysis tools.
Flexible modulation analysis from MSK to 4096QAM ❙ Modulation formats:
■ 2FSK, 4FSK, 8FSK ■ MSK, GMSK, DMSK ■ BPSK, QPSK, offset QPSK, DQPSK, 8PSK, D8PSK, π/4-DQPSK, 3π/8-8PSK, π/8-D8PSK
■ 16QAM, 32QAM, 64QAM, 128QAM, 256QAM, 512QAM, 1024QAM, 2048QAM, 4096QAM
■ 16 APSK (DVB-S2), 32 APSK (DVB-S2), 2 ASK, 4 ASK, π/4-16QAM (EDGE), –π/4-16QAM (EDGE)
Numerous standard-specific presets ❙ User-definable constellations and mappings ❙ GSM, GSM/EDGE ❙ 3GPP WCDMA, CDMA2000® ❙ TETRA, APCO25 ❙ Bluetooth®, ZigBee ❙ DECT, DVB-S2
Demodulation of a 64QAM signal
with frequency and group delay
display of the equalizer together
with numerical modulation accu-
racy results.
VSE_bro_en_3607-1371-12_v0500.indd 8 13.12.2017 10:35:19

Rohde & Schwarz R&S®VSE Vector Signal Explorer Software 9
The main application of the R&S®VSE-K72 option is the determination of the power in the individual code chan-nels, referred to as code domain power measurement. The power ratios between the individual channels, for instance, can be checked for compliance with the nominal values. This measurement is a very efficient tool for detecting im-pairments such as clipping or intermodulation that are not obvious from the spectrum alone. The power of the differ-ent codes is shown versus the code number.
Code domain power measurementsThe code domain power measurement offers in-depth analysis for a WCDMA signal with several active channels. The composite EVM measurement returns a modulation error value for the total signal. The symbol EVM function yields the individual vector errors of the active channels. ❙ Code domain power versus time ❙ CCDF ❙ Constellation diagram ❙ Modulation quality ❙ EVM ❙ Peak code domain error ❙ Residual code domain error constellation diagram ❙ I/Q offset ❙ I/Q imbalance ❙ Gain imbalance ❙ Center frequency ❙ Automatic detection of:
■ Active channels and decoding of useful information ■ Scrambling code ■ HSDPA modulation format
❙ Supports: ■ Compressed mode signals ■ HSPA and HSPA+ (HSDPA+ and HSUPA+)
R&S®VSE-K72WCDMA signal analysisThe R&S®VSE-K72 covers the in-band measurements of the 3GPP WCDMA uplinks and downlinks, including HSDPA, HSUPA and HSPA+.
Demodulation of a downlink sig-
nal with numerical results as well
as EVM versus symbols and con-
stellation diagram of the composite
signal and also the symbol constel-
lation diagram of the CPICH.
VSE_bro_en_3607-1371-12_v0500.indd 9 13.12.2017 10:35:22
10
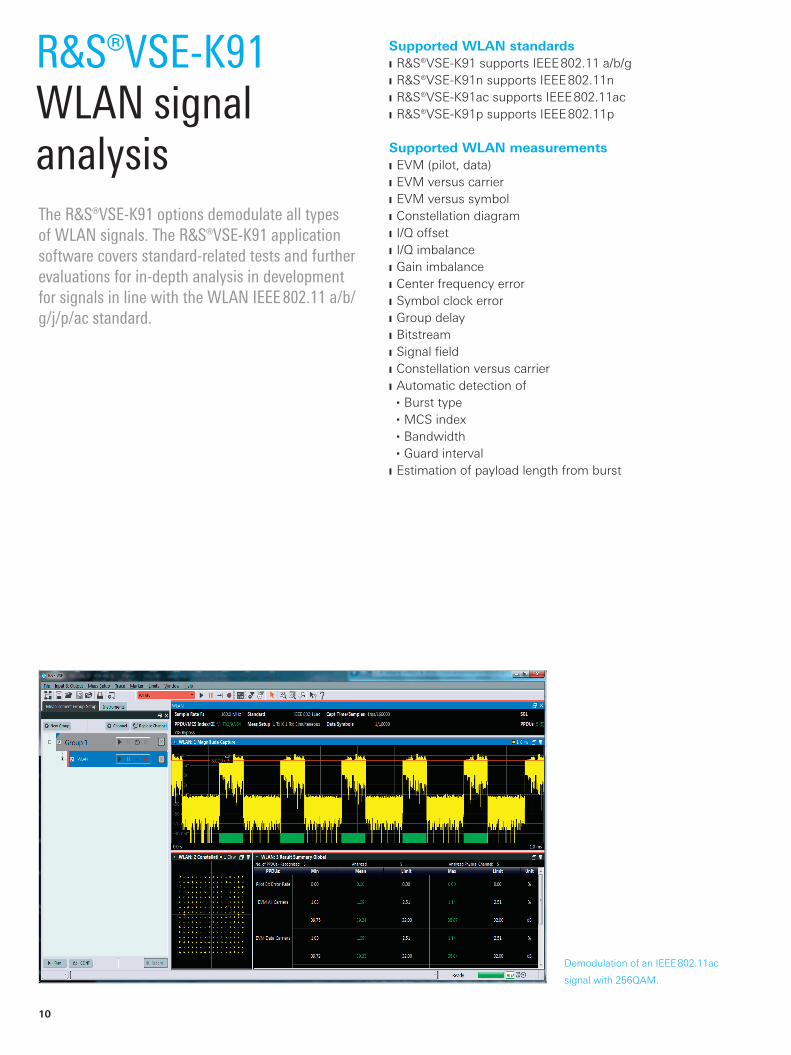
Supported WLAN standards ❙ R&S®VSE-K91 supports IEEE 802.11 a/b/g ❙ R&S®VSE-K91n supports IEEE 802.11n ❙ R&S®VSE-K91ac supports IEEE 802.11ac ❙ R&S®VSE-K91p supports IEEE 802.11p
Supported WLAN measurements ❙ EVM (pilot, data) ❙ EVM versus carrier ❙ EVM versus symbol ❙ Constellation diagram ❙ I/Q offset ❙ I/Q imbalance ❙ Gain imbalance ❙ Center frequency error ❙ Symbol clock error ❙ Group delay ❙ Bitstream ❙ Signal field ❙ Constellation versus carrier ❙ Automatic detection of
■ Burst type ■ MCS index ■ Bandwidth ■ Guard interval
❙ Estimation of payload length from burst
R&S®VSE-K91WLAN signal analysisThe R&S®VSE-K91 options demodulate all types of WLAN signals. The R&S®VSE-K91 application software covers standard-related tests and further evaluations for in-depth analysis in development for signals in line with the WLAN IEEE 802.11 a/b/g/j/p/ac standard.
Demodulation of an IEEE 802.11ac
signal with 256QAM.
VSE_bro_en_3607-1371-12_v0500.indd 10 13.12.2017 10:35:23
Rohde & Schwarz R&S®VSE Vector Signal Explorer Software 11
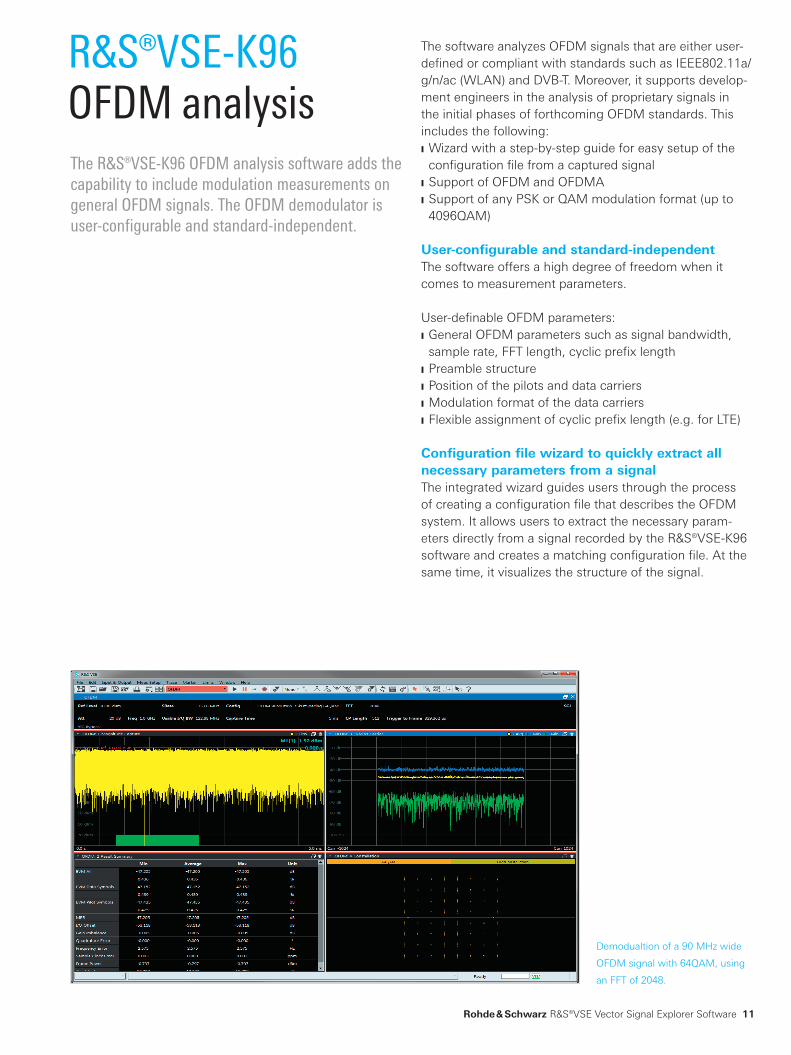
The software analyzes OFDM signals that are either user-defined or compliant with standards such as IEEE802.11a/g/n/ac (WLAN) and DVB-T. Moreover, it supports develop-ment engineers in the analysis of proprietary signals in the initial phases of forthcoming OFDM standards. This includes the following: ❙ Wizard with a step-by-step guide for easy setup of the configuration file from a captured signal
❙ Support of OFDM and OFDMA ❙ Support of any PSK or QAM modulation format (up to 4096QAM)
User-configurable and standard-independentThe software offers a high degree of freedom when it comes to measurement parameters.
User-definable OFDM parameters: ❙ General OFDM parameters such as signal bandwidth, sample rate, FFT length, cyclic prefix length
❙ Preamble structure ❙ Position of the pilots and data carriers ❙ Modulation format of the data carriers ❙ Flexible assignment of cyclic prefix length (e.g. for LTE)
Configuration file wizard to quickly extract all necessary parameters from a signalThe integrated wizard guides users through the process of creating a configuration file that describes the OFDM system. It allows users to extract the necessary param-eters directly from a signal recorded by the R&S®VSE-K96 software and creates a matching configuration file. At the same time, it visualizes the structure of the signal.
R&S®VSE-K96OFDM analysisThe R&S®VSE-K96 OFDM analysis software adds the capability to include modulation measurements on general OFDM signals. The OFDM demodulator is user-configurable and standard-independent.
Demodualtion of a 90 MHz wide
OFDM signal with 64QAM, using
an FFT of 2048.
VSE_bro_en_3607-1371-12_v0500.indd 11 13.12.2017 10:35:31

12
R&S®VSE-K100/ -K102/-K104LTE signal analysis
Supported LTE capabilities ❙ R&S®VSE-K100: Uplink and downlink capabilities for LTE FDD
❙ R&S®VSE-K104: Uplink and downlink capabilities for LTE TDD
❙ R&S®VSE-K102: MIMO and LTE-Advanced capabilities added to the R&S®VSE-K100/-K104 options
Extensive TDD supportR&S®VSE-K104 provides many TDD-specific features such as power versus time measurement, special subframe configurations and measurements on downlink dual layer beamforming signals using UE-specific reference signals. Users can verify all important aspects of a TDD transmitter.
Supported LTE measurements ❙ EVM ❙ Constellation diagram ❙ I/Q offset ❙ Gain imbalance ❙ Quadrature error ❙ Center frequency error (symbol clock error) ❙ Bitstream ❙ Allocation summary list ❙ Averaging over multiple measurements
With R&S®VSE-K102 option, additionally ❙ MIMO demodulation ❙ MIMO time alignment for R&S®FSW-K100/-K104 ❙ Interband carrier aggregation time alignment
The R&S®VSE-K10x options cover 3GPP LTE and LTE-Advanced in-band measurements. The R&S®VSE-K100/-K102/-K104 options provide convenient analysis due to automatic detection of modulation formats. Each signal subframe is analyzed and the QPSK, 16QAM and 64QAM modulation formats plus the length of the cyclic prefix are automatically detected and used in the analysis. The cell identity can also be automatically detected. This minimizes the number of settings users have to make.
An LTE downlink signal with mod-
ulation results and in-band results
such as bitstreams and informa-
tion gained from decoding control
channels.
VSE_bro_en_3607-1371-12_v0500.indd 12 13.12.2017 10:35:35
Rohde & Schwarz R&S®VSE Vector Signal Explorer Software 13
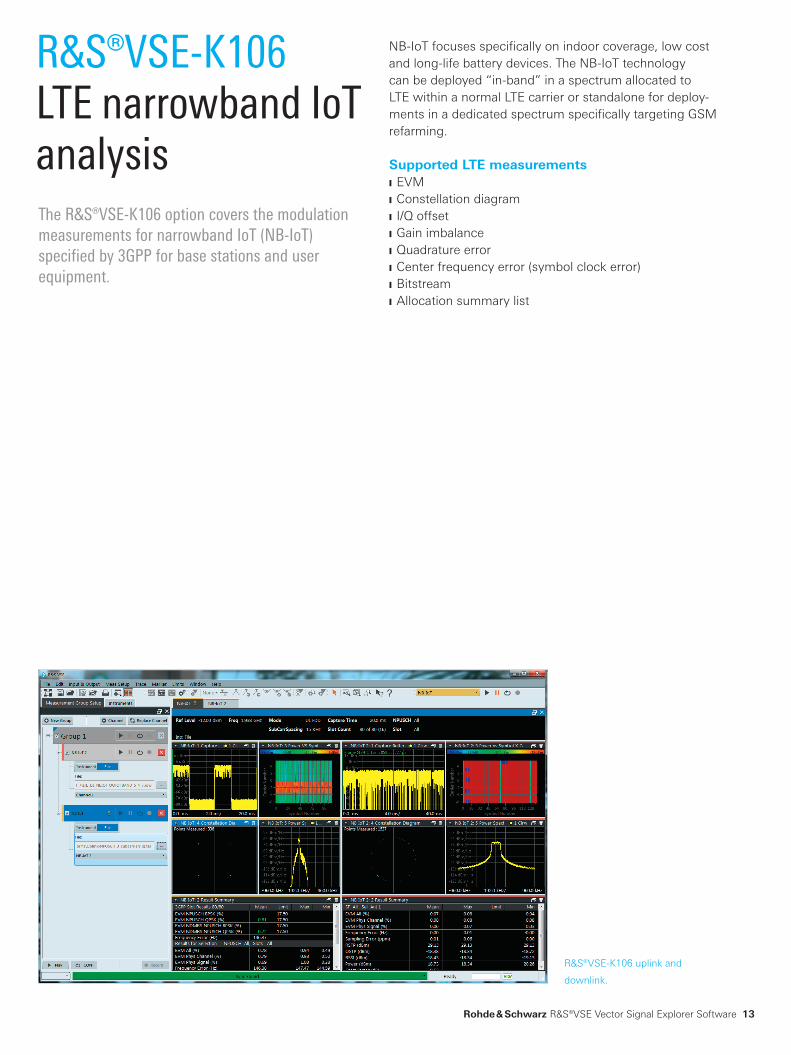
The R&S®VSE-K106 option covers the modulation measurements for narrowband IoT (NB-IoT) specified by 3GPP for base stations and user equipment.
R&S®VSE-K106 uplink and
downlink.
NB-IoT focuses specifically on indoor coverage, low cost and long-life battery devices. The NB-IoT technology can be deployed “in-band” in a spectrum allocated to LTE within a normal LTE carrier or standalone for deploy-ments in a dedicated spectrum specifically targeting GSM refarming.
Supported LTE measurements ❙ EVM ❙ Constellation diagram ❙ I/Q offset ❙ Gain imbalance ❙ Quadrature error ❙ Center frequency error (symbol clock error) ❙ Bitstream ❙ Allocation summary list
R&S®VSE-K106LTE narrowband IoT analysis
VSE_bro_en_3607-1371-12_v0500.indd 13 13.12.2017 10:35:36
Canada
USA
Mexico
Brazil
Colombia
Argentina
UruguayChile
South Africa
UAESaudi Arabia India
Pakistan
Kazakhstan
Azerbaijan
Mongolia
China
Egypt
IsraelAlgeria
Senegal
Nigeria
Kenya
Jordan
Oman
Tunisia
JapanSouthKorea
Malaysia
Indonesia
Australia
Singapore
New Zealand
Philippines
Taiwan
Thailand
Vietnam
Germany
Dallas
Monterrey
Mexico City
Ottawa
Rio de Janeiro
São Paulo
Portland
New DelhiKarachi
Islamabad
HyderabadMumbai
Bangalore
SydneyMelbourne
Canberra
ShanghaiTaipei
Kaohsiung
Tokyo
KanagawaOsaka
SeoulDaejeon
Gumi CityChengdu
Xi'an
Ho Chi Minh City
Beijing
Hong Kong
Penang
Hanoi
Selangor
Los Angeles
Columbia/Maryland
Munich
Cologne
Shenzhen
Guangzhou
United Kingdom
Ukraine
Turkey
Switzerland
Sweden
Spain
Russian Federation
Romania
Bulgaria
Portugal
Poland
Norway
Netherlands
Italy
Hungary
Greece
Malta
France
Finland
Denmark
Czech Republic
Austria
Cyprus
Azerbaijan
LithuaniaLatvia
Estonia
Slovenia
Serbia
Sales level
Sales locations
Service level
Backup service
Area support center
Local service center
Calibration and maintenance with standardized automatic calibration systems
Calibration and maintenance
Maintenance
14
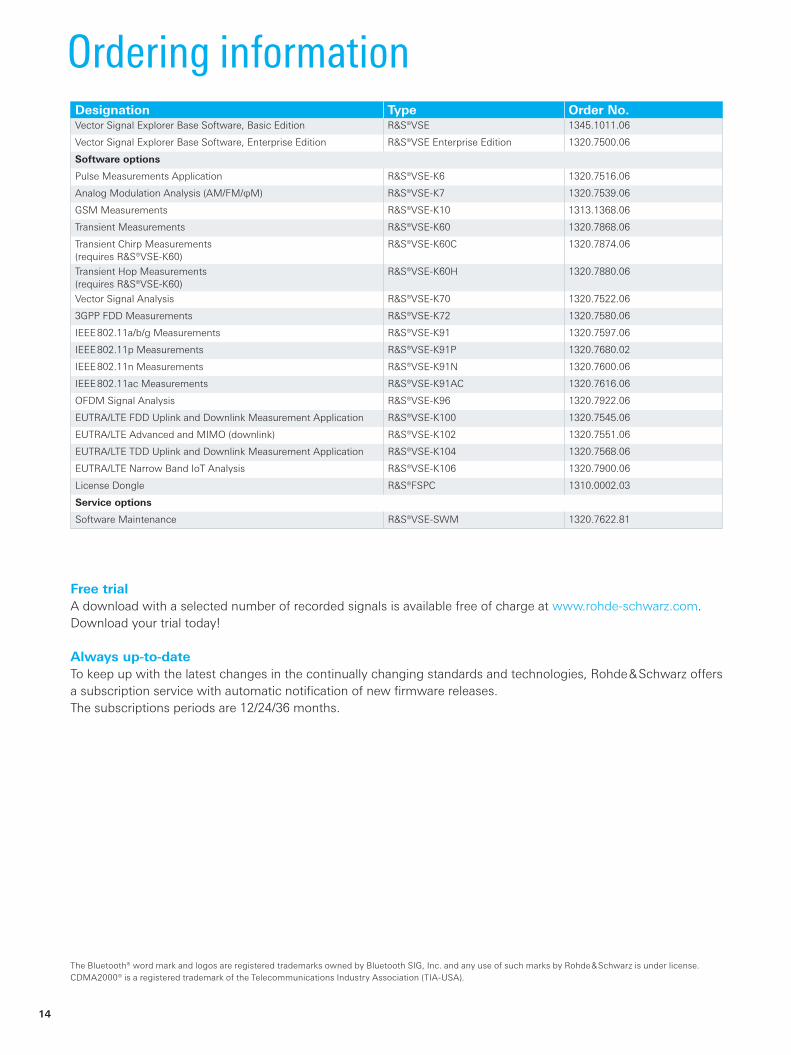
Ordering informationDesignation Type Order No.Vector Signal Explorer Base Software, Basic Edition R&S®VSE 1345.1011.06
Vector Signal Explorer Base Software, Enterprise Edition R&S®VSE Enterprise Edition 1320.7500.06
Software options
Pulse Measurements Application R&S®VSE-K6 1320.7516.06
Analog Modulation Analysis (AM/FM/φM) R&S®VSE-K7 1320.7539.06
GSM Measurements R&S®VSE-K10 1313.1368.06
Transient Measurements R&S®VSE-K60 1320.7868.06
Transient Chirp Measurements (requires R&S®VSE-K60)
R&S®VSE-K60C 1320.7874.06
Transient Hop Measurements (requires R&S®VSE-K60)
R&S®VSE-K60H 1320.7880.06
Vector Signal Analysis R&S®VSE-K70 1320.7522.06
3GPP FDD Measurements R&S®VSE-K72 1320.7580.06
IEEE 802.11a/b/g Measurements R&S®VSE-K91 1320.7597.06
IEEE 802.11p Measurements R&S®VSE-K91P 1320.7680.02
IEEE 802.11n Measurements R&S®VSE-K91N 1320.7600.06
IEEE 802.11ac Measurements R&S®VSE-K91AC 1320.7616.06
OFDM Signal Analysis R&S®VSE-K96 1320.7922.06
EUTRA/LTE FDD Uplink and Downlink Measurement Application R&S®VSE-K100 1320.7545.06
EUTRA/LTE Advanced and MIMO (downlink) R&S®VSE-K102 1320.7551.06
EUTRA/LTE TDD Uplink and Downlink Measurement Application R&S®VSE-K104 1320.7568.06
EUTRA/LTE Narrow Band IoT Analysis R&S®VSE-K106 1320.7900.06
License Dongle R&S®FSPC 1310.0002.03
Service options
Software Maintenance R&S®VSE-SWM 1320.7622.81
Free trialA download with a selected number of recorded signals is available free of charge at www.rohde-schwarz.com.Download your trial today!
Always up-to-dateTo keep up with the latest changes in the continually changing standards and technologies, Rohde & Schwarz offers a subscription service with automatic notification of new firmware releases.The subscriptions periods are 12/24/36 months.
The Bluetooth® word mark and logos are registered trademarks owned by Bluetooth SIG, Inc. and any use of such marks by Rohde & Schwarz is under license.CDMA2000® is a registered trademark of the Telecommunications Industry Association (TIA-USA).
VSE_bro_en_3607-1371-12_v0500.indd 14 13.12.2017 10:35:39

Canada
USA
Mexico
Brazil
Colombia
Argentina
UruguayChile
South Africa
UAESaudi Arabia India
Pakistan
Kazakhstan
Azerbaijan
Mongolia
China
Egypt
IsraelAlgeria
Senegal
Nigeria
Kenya
Jordan
Oman
Tunisia
JapanSouthKorea
Malaysia
Indonesia
Australia
Singapore
New Zealand
Philippines
Taiwan
Thailand
Vietnam
Germany
Dallas
Monterrey
Mexico City
Ottawa
Rio de Janeiro
São Paulo
Portland
New DelhiKarachi
Islamabad
HyderabadMumbai
Bangalore
SydneyMelbourne
Canberra
ShanghaiTaipei
Kaohsiung
Tokyo
KanagawaOsaka
SeoulDaejeon
Gumi CityChengdu
Xi'an
Ho Chi Minh City
Beijing
Hong Kong
Penang
Hanoi
Selangor
Los Angeles
Columbia/Maryland
Munich
Cologne
Shenzhen
Guangzhou
United Kingdom
Ukraine
Turkey
Switzerland
Sweden
Spain
Russian Federation
Romania
Bulgaria
Portugal
Poland
Norway
Netherlands
Italy
Hungary
Greece
Malta
France
Finland
Denmark
Czech Republic
Austria
Cyprus
Azerbaijan
LithuaniaLatvia
Estonia
Slovenia
Serbia
Sales level
Sales locations
Service level
Backup service
Area support center
Local service center
Calibration and maintenance with standardized automatic calibration systems
Calibration and maintenance
Maintenance
Rohde & Schwarz R&S®VSE Vector Signal Explorer Software 15
From pre-sale to service. At your doorstep.
The Rohde & Schwarz network in over 70 countries ensures optimum on-site support by highly qualified experts. User risks are reduced to a minimum at all stages of the project: ❙ Solution finding/purchase ❙ Technical startup/application development/integration ❙ Training ❙ Operation/calibration/repair
VSE_bro_en_3607-1371-12_v0500.indd 15 13.12.2017 10:35:39
R&S® is a registered trademark of Rohde & Schwarz GmbH & Co. KG
Trade names are trademarks of the owners
PD 3607.1371.12 | Version 05.00 | December 2017 (fi)
R&S®VSE Vector Signal Explorer Software
Data without tolerance limits is not binding | Subject to change
© 2016 - 2017 Rohde & Schwarz GmbH & Co. KG | 81671 Munich, Germany
Service that adds value❙ Worldwide ❙ Local and personalized❙ Customized and flexible❙ Uncompromising quality ❙ Long-term dependability
3607
.137
1.12
05.
00 P
DP
1 e
n
Rohde & SchwarzThe Rohde & Schwarz electronics group offers innovative solutions in the following business fields: test and mea-surement, broadcast and media, secure communications, cybersecurity, monitoring and network testing. Founded more than 80 years ago, the independent company which is headquartered in Munich, Germany, has an extensive sales and service network with locations in more than 70 countries.
Sustainable product design ❙ Environmental compatibility and eco-footprint ❙ Energy efficiency and low emissions ❙ Longevity and optimized total cost of ownership
Certified Environmental Management
ISO 14001Certified Quality Management
ISO 9001
Regional contact ❙ Europe, Africa, Middle East | +49 89 4129 12345 [email protected]
❙ North America | 1 888 TEST RSA (1 888 837 87 72) [email protected]
❙ Latin America | +1 410 910 79 88 [email protected]
❙ Asia Pacific | +65 65 13 04 88 [email protected]
❙ China | +86 800 810 82 28 | +86 400 650 58 96 [email protected]
Rohde & Schwarz GmbH & Co. KGwww.rohde-schwarz.com
Rohde & Schwarz trainingwww.training.rohde-schwarz.com
3607137112
VSE_bro_en_3607-1371-12_v0500.indd 16 13.12.2017 10:35:40