produced 05 november 2021 - mms-marketing.co.uk
TRANSCRIPT

Housing market overviewProduced 05 November 2021This document provides the latest information available from various sources, with dates varying from August –October 2021
Contents
Market overview 3
Summary of published price indices 4
UK annual house prices – rate of change 5
Regional all-dwellings annual house price – 12-month % change 6
UK house-price rates of change: types of buyer 7
UK house-price rates of change: types of dwelling 8
Number of housing transactions per month 9
Monthly asking-price trend 10
Home asking-price trend (England & Wales) 11
Average-time-on-market indicator (National) 12
Asking-price fluctuation percentage 13
UK sales volumes by funding status 14
UK house-price-to-earnings ratio 15
Average properties for sale per estate agent 16
2

Market overview
Following what may have been no more than a blip last month, house prices continue their upward trajectory with all of our sources reporting month-on-month rises ranging from 0.5% to 2.9%. All sources report year-on-year increases in the range 3.6% to 10.6%.
The Telegraph reports that three of the country’s biggest lenders have pulled mortgage deals from the market and increased the cost of their loans as expectations grow that the Bank of England will put up interest rates. They report that HSBC, Nationwide and NatWest have announced the changes as markets are braced for an expected rise in the base rate to 0.25 per cent from its historic low of 0.1 per cent.
Latest figures from the NHBC show UK private sector registrations grew 43% during Q3 2021 compared to the same period in 2020.
According to Halifax, UK house prices climbed again in October, as the value of the average property grew by 0.9%, an increase of more than £2,500 during the month. They say with prices rising for a fourth straight month, the annual rate of house-price inflation now sits at 8.1%, its highest level since June.
Rightmove comments that strong housing market fundamentals and a window of opportunity to buy before a potential interest rate rise keep activity robust despite the end of the final Stamp Duty incentive.
Hometrack reports the housing market has outperformed their forecasts from a year ago. They say it is set to record its strongest year for sales and house-price inflation since 2007 with £473bn of new sales agreed in 2021, £95bn higher than 2020. This is a result of the ongoing national re-evaluation of housing, low mortgage rates and the additional boost from the extended Stamp Duty holiday.
Nationwide say annual house-price growth remained elevated in October at 9.9%, albeit marginally lower than the 10.0% recorded in September. They say prices rose 0.7% in month-on-month terms, after taking account of seasonal effects. The price of a typical UK home has now passed the £250,000 mark, an increase of £30,728 since the pandemic struck in March 2020.
3
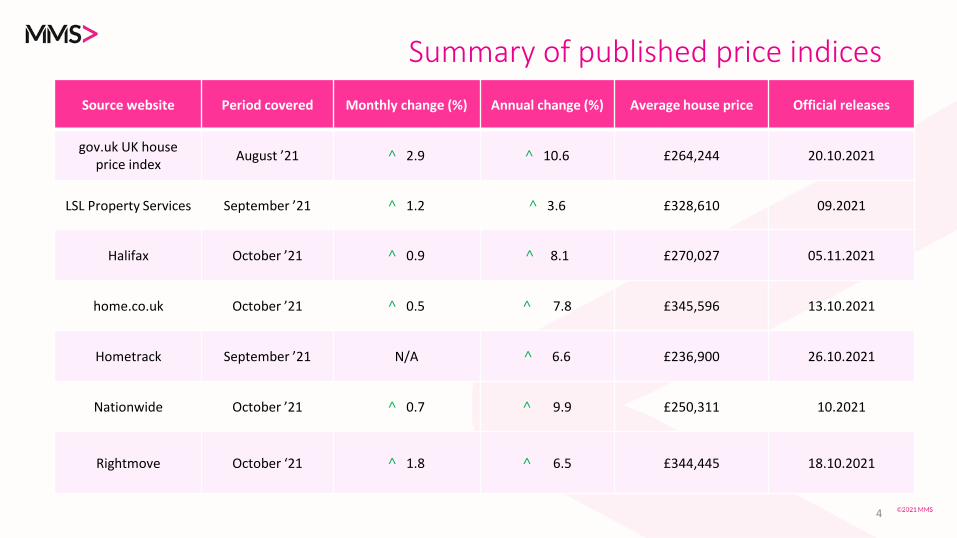
Summary of published price indices
Source website Period covered Monthly change (%) Annual change (%) Average house price Official releases
gov.uk UK house price index
August ’21 ˄ 2.9 ˄ 10.6 £264,244 20.10.2021
LSL Property Services September ’21 ˄ 1.2 ˄ 3.6 £328,610 09.2021
Halifax October ’21 ˄ 0.9 ˄ 8.1 £270,027 05.11.2021
home.co.uk October ’21 ˄ 0.5 ˄ 7.8 £345,596 13.10.2021
Hometrack September ’21 N/A ˄ 6.6 £236,900 26.10.2021
Nationwide October ’21 ˄ 0.7 ˄ 9.9 £250,311 10.2021
Rightmove October ‘21 ˄ 1.8 ˄ 6.5 £344,445 18.10.2021
4
UK annual house prices – rate of change
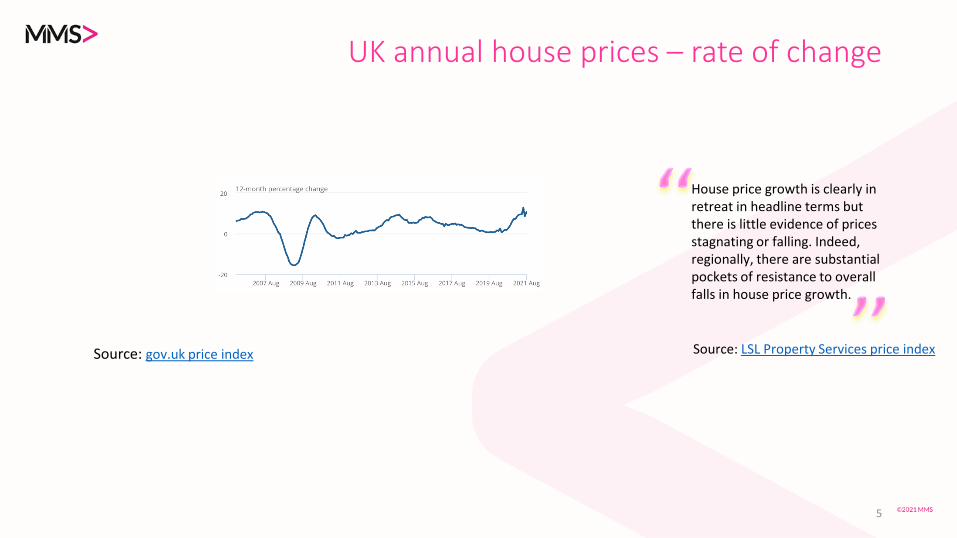
Source: gov.uk price index
House price growth is clearly in retreat in headline terms but there is little evidence of prices stagnating or falling. Indeed, regionally, there are substantial pockets of resistance to overall falls in house price growth.
5
Source: LSL Property Services price index
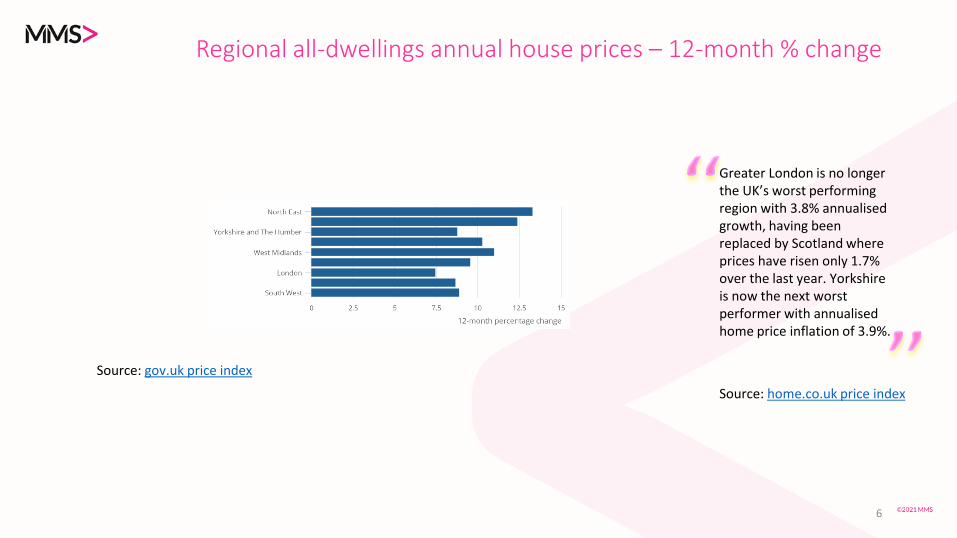
Regional all-dwellings annual house prices – 12-month % change
Source: gov.uk price index
Greater London is no longer the UK’s worst performing region with 3.8% annualised growth, having been replaced by Scotland where prices have risen only 1.7% over the last year. Yorkshire is now the next worst performer with annualised home price inflation of 3.9%.
6
Source: home.co.uk price index
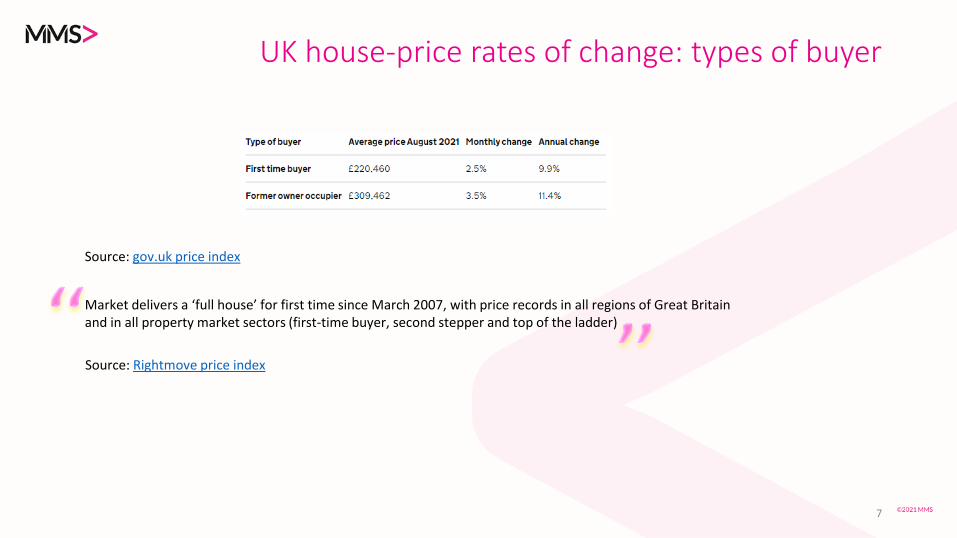
UK house-price rates of change: types of buyer
Source: gov.uk price index
Market delivers a ‘full house’ for first time since March 2007, with price records in all regions of Great Britain and in all property market sectors (first-time buyer, second stepper and top of the ladder)
7
Source: Rightmove price index

UK house-price rates of change: types of dwelling
Source: gov.uk price index
One of the key drivers of activity in the housing market over the past 18 months has been the race for space, with buyers seeking larger properties, often further from urban centres. Combined with temporary measures such as the cut to Stamp Duty, this has helped push the average property price up to an all-time high of £270,027. Since April 2020, the first full month of lockdown, the value of the average property has soared by £31,516 (13.2%).
8
Source: Halifax price index
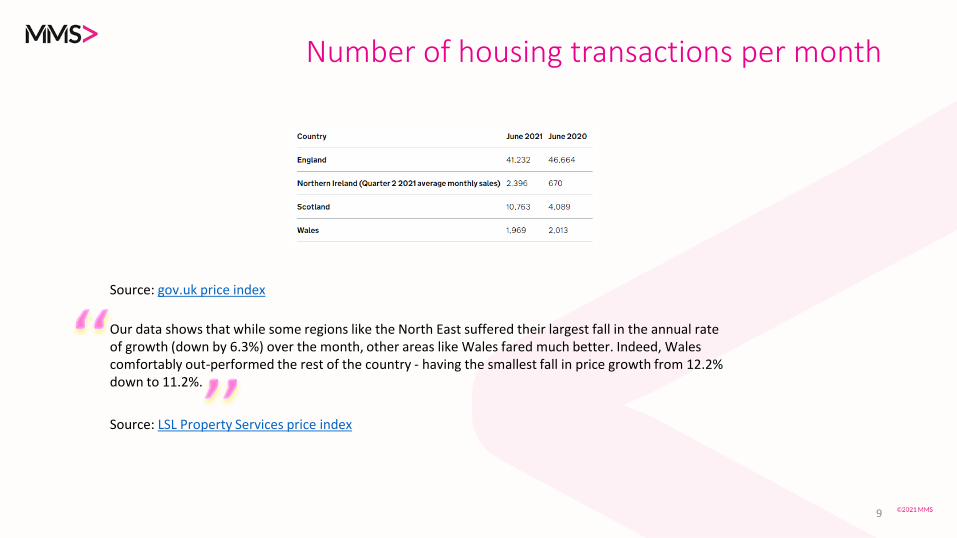
Number of housing transactions per month
Source: gov.uk price index
Our data shows that while some regions like the North East suffered their largest fall in the annual rate of growth (down by 6.3%) over the month, other areas like Wales fared much better. Indeed, Wales comfortably out-performed the rest of the country - having the smallest fall in price growth from 12.2% down to 11.2%.
9
Source: LSL Property Services price index

Monthly asking-price trend
Annual house price growth remained elevated in October at 9.9%, albeit marginally lower than the 10.0% recorded in September. Prices rose 0.7% in month-on-month terms, after taking account of seasonal effects. The price of a typical UK home has now passed the £250,000 mark, an increase of £30,728 since the pandemic struck in March 2020.
10
Source: Rightmove price index
Source: Nationwide price index

Home asking-price trend for England & Wales
Despite the end of the stamp duty tax break, asking prices across England and Wales moved up again thanks to low stock and low supply, adding 0.5% since last month and taking the annualised average growth up to 7.8%. However, surging monetary inflation at 5.0% (RPI ex-housing for August) accounts for most of this rise.
Source: home.co.uk price index
11
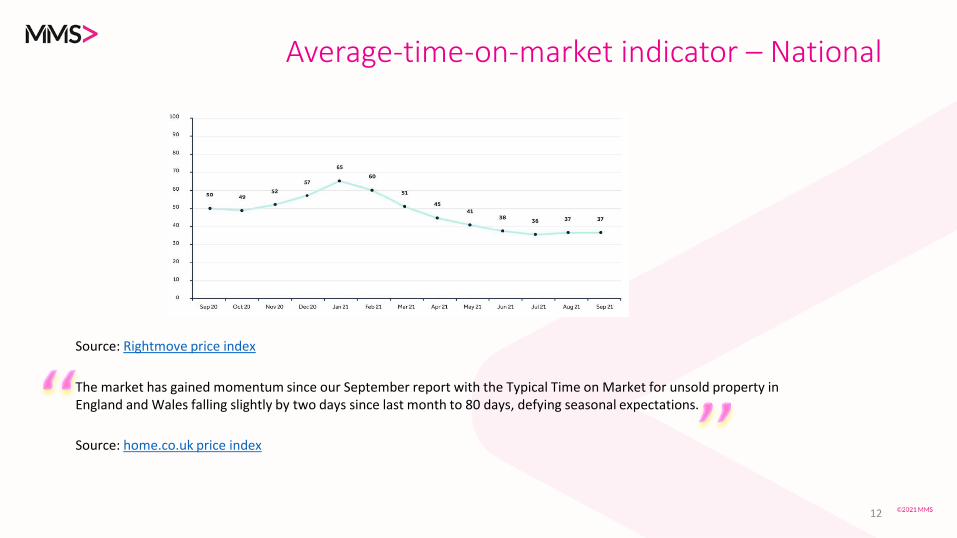
Average-time-on-market indicator – National
Source: Rightmove price index
The market has gained momentum since our September report with the Typical Time on Market for unsold property in England and Wales falling slightly by two days since last month to 80 days, defying seasonal expectations.
12
Source: home.co.uk price index
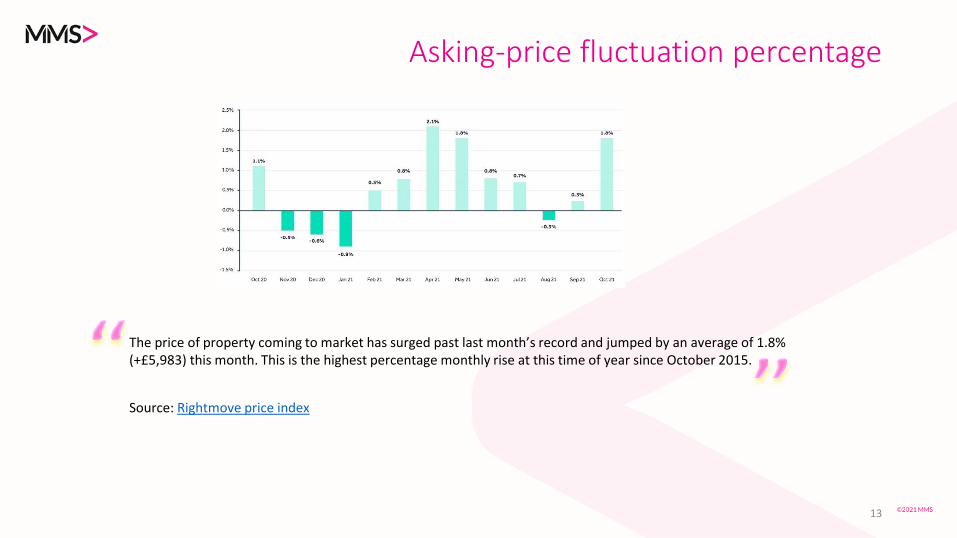
Asking-price fluctuation percentage
The price of property coming to market has surged past last month’s record and jumped by an average of 1.8% (+£5,983) this month. This is the highest percentage monthly rise at this time of year since October 2015.
13
Source: Rightmove price index
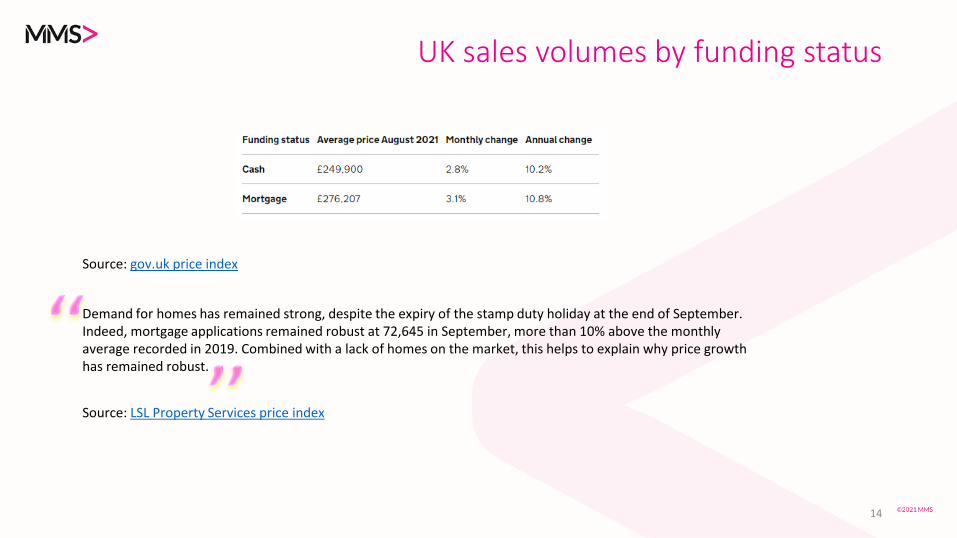
UK sales volumes by funding status
Demand for homes has remained strong, despite the expiry of the stamp duty holiday at the end of September. Indeed, mortgage applications remained robust at 72,645 in September, more than 10% above the monthly average recorded in 2019. Combined with a lack of homes on the market, this helps to explain why price growth has remained robust.
Source: gov.uk price index
14
Source: LSL Property Services price index

UK house-price-to-earnings ratio
Source: Nationwide price index
The outlook remains extremely uncertain. If the labour market remains resilient, conditions may stay fairly buoyant in the coming months – especially as the market continues to have momentum and there is scope for ongoing shifts in housing preferences as a result of the pandemic to continue to support activity.
15
Source: Nationwide price index
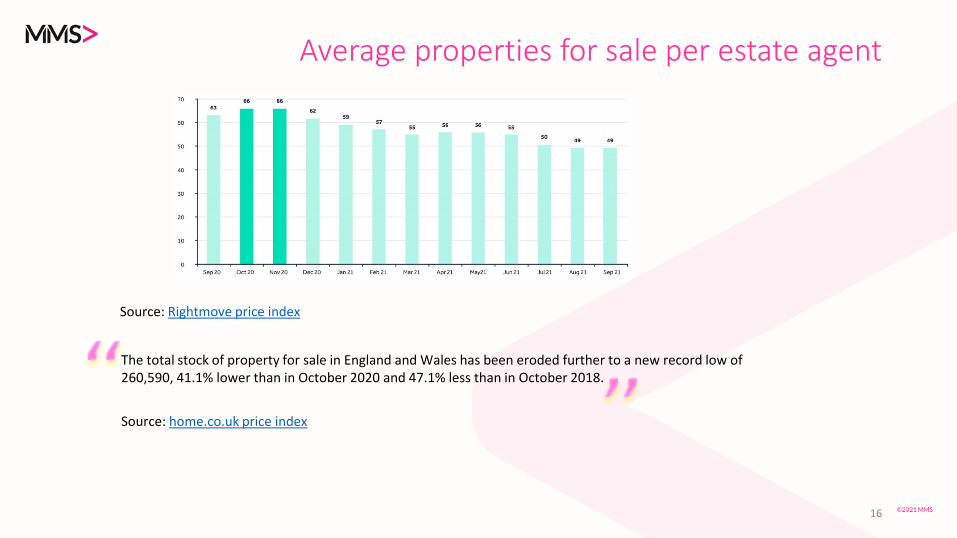
Average properties for sale per estate agent
The total stock of property for sale in England and Wales has been eroded further to a new record low of 260,590, 41.1% lower than in October 2020 and 47.1% less than in October 2018.
16
Source: Rightmove price index
Source: home.co.uk price index
Got feedback?
If there’s anything you think we can be doing better with this report we’d love to hear from you. You can email us at [email protected] with any feedback.
You can receive this report directly into your inbox each month by signing up at mms-marketing.co.uk/contact.
Did you find this useful?
17