procredit initiation of coverage · lifecycles, with individual loan volumes mostly in the range of...
TRANSCRIPT
4 June 2020 ProCredit (PCB) has extensive experience in supporting small and
medium-sized enterprises (SMEs) in emerging economies (coupled with a
strong environmental, social and governance (ESG) profile), with a focus
on Southeastern (SEE) and Eastern Europe (EE) and banking operations in
Ecuador. Its in-depth, impact-oriented relationships with SME borrowers
(93% of loan book at end-Q120), prudent credit risk management and solid
capital base (CET-1 ratio of 14.0% at end-Q120) should help reduce the
impact of macro headwinds. We forecast PCB’s ROE to increase from c 7%
in FY19 to 10% by FY24, driven by solid loan book growth after FY20e
(c 9% pa), which can be achieved with the existing capital base. This
should be assisted by limited growth in operating expenses due to a lean
branch network and digital platform.
Year end Net interest
income (€m) EPS*
(€) DPS
(€) P/BV
(x) P/E (x)
ROE (%)
Yield (%)
12/18 186.2 0.90 0.30 0.5 7.0 7.6 4.8
12/19 194.5 0.89 0.30 0.5 7.1 6.9 4.8
12/20e 199.9 0.54 0.18 0.5 11.7 4.0 2.8
12/21e 205.1 0.70 0.23 0.5 9.0 5.2 3.7
Source: ProCredit, Edison Investment Research. Note: * From total operations.
‘Hausbank’ for SMEs, direct bank for individuals
PCB has recently finalised streamlining its business, involving a digital direct bank
strategy for private clients (leveraging its in-house tech company Quipu) while
offering comprehensive services to SMEs. As a result, PCB has reduced its branch
network (by c 8x) and headcount (by c 3–4x) over the last six years, and also sold
banks in less promising markets in Latin America and Africa. This is gradually
translating into a lower cost income ratio (CIR), at 64.6% in Q120 (although lower
income in 2020 may temporarily push it back to c 70%). While recently PCB’s
return on equity has been below peers, we underline its relative stability throughout
the cycle and believe that its mid-term ROE and CIR targets of 10% and below
60%, respectively, are achievable (close to our FY24 forecasts).
Pause in secular growth trend due to the pandemic
The SEE and EE region has benefited from secular GDP growth of 3–5% pa in the
last five years, with SMEs being one of the main drivers. COVID-19 is expected to
trigger a recession in 2020 (the IMF forecasts a decline of 4–5% in PCB’s markets),
with a rebound of c 5% forecast in 2021. In the longer run, PCB’s business should
be assisted by the low banking sector penetration in the region (with a loan book to
GDP of 40–45% on average vs over 70% in Western Europe).
Valuation: Looking undemanding
We have valued PCB’s shares using a P/BV-ROE approach and, based on a
sustainable return on tangible equity (RoTE) of 10%, we arrive at a fair value of
€7.50 per share (c 20% upside to the current share price). Factoring in an RoTE in
line with PCB’s five-year historical average of c 8% would translate into a fair value
of €5.63. PCB trades on an FY20e P/BV multiple of 0.5x vs the peer average of
0.9x, which we believe is only partially justified by its lower ROE.
ProCredit Initiation of coverage
Impact-oriented SME lender in SEE and EE
Price €6.30
Market cap €371m
Total assets (€bn) at end-March 2020 6.6
Shares in issue 58.9m
Free float 35.7%
Code PCZ
Primary exchange Frankfurt Prime Standard
Secondary exchange N/A
Share price performance
% 1m 3m 12m
Abs 25.5 (6.8) (27.5)
Rel (local) 9.2 (10.5) (31.5)
52-week high/low €8.6 €4.6
Business description
ProCredit is a Germany-based group operating
regional banks across Southeastern and Eastern
Europe, as well as in Ecuador. The banks focus on
SMEs and private middle-income and high earners.
At end-March 2020, the group’s total assets stood
at €6.6bn.
Next events
Q220 results 13 August 2020
Q320 results 12 November 2020
Analysts
Milosz Papst +44 (0)20 3077 5700
Anna Dziadkowiec +44 (0)20 3077 5700
Edison profile page
Banks
ProCredit is a research client
of Edison Investment
Research Limited

ProCredit | 4 June 2020 2
Investment summary
Company description: Specialist lender for SMEs
PCB is focused on providing impact-oriented financing primarily to SMEs (93% of the bank’s loan
book at end-March 2020) to support investment and working capital needs throughout their
lifecycles, with individual loan volumes mostly in the range of €50k to €3m. Green loans represent a
growing share of its loan book (16.7% at end-March 2020). Moreover, it is a direct bank for private
clients with a proprietary digital platform and a lean branch network, targeting middle-income and
high earners (including SME owners) in particular. Importantly, as ESG aspects stand high on
PCB’s priority list, it does not provide meaningful volumes of consumer loans. Its geographical
footprint currently covers 10 countries in SEE and EE, as well as Ecuador plus its holding and
minor banking operations in Germany (it operates under a German banking licence). PCB’s major
strategic shareholder since inception is Zeitinger Invest (17% stake). Prominent shareholders
include KfW (a leading German development bank), holding a 13.2% stake, and International
Finance Corporation (IFC, which is part of the World Bank), with a 10.0% stake. PCB’s solid
financial standing was confirmed by Fitch in April 2020 with a long-term rating of BBB and stable
outlook for ProCredit Holding and its six subsidiary banks. The company’s strong ESG profile is
illustrated by its MSCI ESG rating of AA.
Valuation: Our base scenario indicates c 20% upside
Our P/BV-ROE valuation indicates a fair value of €7.50 per share, which is c 20% upside potential to
the current share price. This is based on our assumed sustainable RoTE of 10%, in line with
management’s mid-term ambition and our FY24e forecast. Factoring in a sustainable RoTE of 8%
(in line with PCB’s five-year historical average) would translate into a fair value of €5.63 per share.
As the valuation is based on our FY20 tangible book value forecast (€13.0 per share), it is
dependent on the cost of credit risk we have pencilled in for FY20e (80bp at group level vs
management guidance of 50–75bp), as well as net interest margin (NIM) (we assume the NIM
declines by 12bp in FY20e), which this year may be affected by multiple factors, including rate cuts
by central banks (potentially intensifying competition in the sector) and additional liquidity needs, eg
due to deposit outflows (which might force PCB’s banks to seek more expensive external funding or
raise deposit rates). PCB’s FY20e P/BV stands at c 0.5x (vs the peer average of c 0.9x), which we
believe is not fully justified by its relatively lower return on equity (ROE).
Financials: Dependent on SME NPL ratios in the region
Although COVID-19 will weigh on PCB’s profitability this year due to a higher level of loss
allowances (provisions for credit losses) and muted growth in gross loan book (we assume 2.1% in
FY20e), we believe the bank will remain profitable with an ROE of c 4.0% in FY20e. This is the
function of a slight NIM decline on one hand, but modest growth in operating costs on the other
hand following the efficiency measures introduced in the past (translating into a CIR of 68.8% in
FY20e). For FY21e, we forecast an ROE of 5.2%, supported by a gradually declining cost of risk
and rebounding lending volumes. The group’s capital base should remain resilient as PCB remains
profitable while loan book growth decelerates. This will be further assisted by the recent reduction
in PCB’s Supervisory Review and Evaluation Process (SREP) add-on, the European Banking
Authority’s equivalence acknowledgement of the Serbian banking regulatory framework, as well as
the prospective introduction of Capital Requirements Regulation II (CRR II) from 2021 (extending
the SME support factor to exposures above €1.5m). Consequently, we forecast PCB’s CET-1 ratio
will be 14.1% in FY20e and 14.3% in FY21e (vs 14.0% at end-March 2020), well above regulatory
requirements. In line with management’s mid-term targets, we assume that PCB’s loan book growth

ProCredit | 4 June 2020 3
will accelerate to c 10% pa in FY22–24e, assisting a stable decline in CIR (to 61% by FY24e) and
improvement in profitability (ROE at c 10% in FY24e).
Sensitivities: Cost of risk and structural macro/political factors
As discussed above, PCB’s near-term performance will be largely determined by the macro
environment amid the COVID-19 outbreak, in particular the level of loan loss provisions and non-
performing loans (NPLs). We estimate that every 10bp increase in FY20e cost of risk reduces our
PCB valuation by €0.03 (or a mere 0.5%) per share. In this context, we note a number of factors
supporting PCB, such as 1) high loan book quality and collateral requirements, 2) well-trained and
experienced staff aligned with PCB’s ‘Hausbank’ for SMEs approach, 3) a lean branch network and
digital platform, 4) support from international financial institutions (as shareholders, debt holders
and/or partners in SME funding schemes) and 5) solid liquidity with a liquidity coverage ratio (LCR)
of 181% at end-March 2020. Beyond COVID-19, we have identified other important sensitivity
factors for PCB, comprising foreign exchange risk (mostly affecting the value of PCB’s equity stakes
in regional banks), as well as macroeconomic and political risk in the region (discussed in detail
later in the note).
Company description: Leading lender for leading SMEs
PCB specialises in financing SMEs in transition economies, including SEE, EE and South America
(Ecuador). Its focus is on impact-oriented financing, which supports sustainable development,
employment and social prosperity. In the past, the group offered mainly small-volume lending to
micro and SMEs (MSMEs) but has changed its target customer group to growing, well-established
SMEs, which foster innovation, local production and a transition to a green economy. PCB also
offers banking services to private clients, predominantly to middle-income and high earners (SME
owners in particular).
The company provides a full range of banking services. This includes lending to business clients in
the form of investment and working capital loans (with a target amount of €50k to €3m) as well as
liquidity management and trade finance. Moreover, it offers housing and investment loans as well
as overdrafts to private clients. The company also provides current accounts, flexible savings and
term deposit accounts.
History: From NGO consulting to own banking operations
Consulting projects in emerging markets
PCB has its origins in IPC, a consulting company founded in 1980 (now Zeitinger Invest, a major
shareholder with a c 17% stake in PCB). Initially, the company ran advisory projects with
government-owned development banks and credit-granting NGOs in Latin America aimed at
providing access to the formal financial sector for MSMEs in emerging markets. In the 1990s, IPC
expanded its activities to downscaling programmes in commercial banks in Latin America and the
former Soviet Union, which were intended to improve financial services offered to MSMEs by
commercial banks.
Starting to set up ‘greenfield’ banks
In 1997, the company established its first microfinance bank in Bosnia in the aftermath of the
Bosnian War, which left the country highly disorganised while the economy remained strongly
dependent on SMEs. The bank was set up together with international public sector development
organisations, including KfW (a German development bank), IFC (a member of the World Bank
Group), the European Bank for Reconstruction and Development (EBRD) and the Netherlands
Development Finance Company (FMO). Notably, KfW and IFC are still PCB’s major shareholders,
ProCredit | 4 June 2020 4
with stakes of c 13% and 10%, respectively. At that time, IPC was also granted a management
mandate in the Bosnian bank. To raiseaccess more capital, the company was founded in 1998 as
Internationale Micro Investitionen (IMI). The initial shareholders were IPC and ipc-investment (now
ProCredit Staff Invest) and new investors soon joined, eg PCB’s current shareholder DOEN
Foundation (a Dutch entity focused on supporting sustainable and socially inclusive entrepreneurs),
and expanded the network of its banks to 17 entities.
The foundation of ProCredit
IMI became ProCredit in 2003, with core shareholders being IPC, DOEN, KfW, IFC and ProCredit
Staff Invest, and continued consolidating ownership of the respective regional banks. Meanwhile, it
expanded its geographical footprint in Latin America and Africa. In December 2011, ProCredit Bank
in Germany obtained a banking licence from the German regulator (BaFin). ProCredit Group has
been listed on the Prime Standard segment of the Frankfurt Stock Exchange since December 2016.
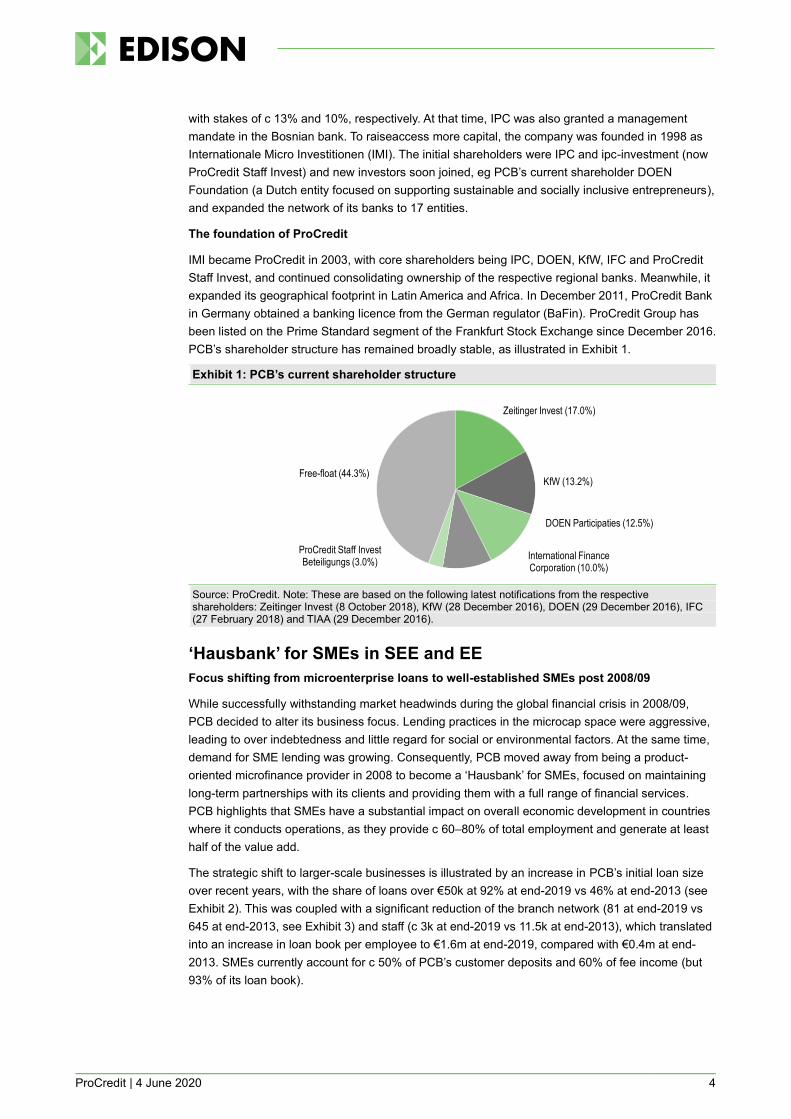
PCB’s shareholder structure has remained broadly stable, as illustrated in Exhibit 1.
Exhibit 1: PCB’s current shareholder structure
Source: ProCredit. Note: These are based on the following latest notifications from the respective shareholders: Zeitinger Invest (8 October 2018), KfW (28 December 2016), DOEN (29 December 2016), IFC (27 February 2018) and TIAA (29 December 2016).
‘Hausbank’ for SMEs in SEE and EE
Focus shifting from microenterprise loans to well-established SMEs post 2008/09
While successfully withstanding market headwinds during the global financial crisis in 2008/09,
PCB decided to alter its business focus. Lending practices in the microcap space were aggressive,
leading to over indebtedness and little regard for social or environmental factors. At the same time,
demand for SME lending was growing. Consequently, PCB moved away from being a product-
oriented microfinance provider in 2008 to become a ‘Hausbank’ for SMEs, focused on maintaining
long-term partnerships with its clients and providing them with a full range of financial services.
PCB highlights that SMEs have a substantial impact on overall economic development in countries
where it conducts operations, as they provide c 60–80% of total employment and generate at least
half of the value add.
The strategic shift to larger-scale businesses is illustrated by an increase in PCB’s initial loan size
over recent years, with the share of loans over €50k at 92% at end-2019 vs 46% at end-2013 (see
Exhibit 2). This was coupled with a significant reduction of the branch network (81 at end-2019 vs
645 at end-2013, see Exhibit 3) and staff (c 3k at end-2019 vs 11.5k at end-2013), which translated
into an increase in loan book per employee to €1.6m at end-2019, compared with €0.4m at end-
2013. SMEs currently account for c 50% of PCB’s customer deposits and 60% of fee income (but
93% of its loan book).
Zeitinger Invest (17.0%)
KfW (13.2%)
DOEN Participaties (12.5%)
International Finance Corporation (10.0%)
ProCredit Staff Invest Beteiligungs (3.0%)
Free-float (44.3%)

ProCredit | 4 June 2020 5
Exhibit 2: Share of loans with a volume over €50k in PCB’s loan book
Exhibit 3: Reduction of PCB’s branch and service point network over time
Source: ProCredit Source: ProCredit
Optimising its regional footprint
PCB decided to focus on SEE and EE and exit operations in less promising markets, such as Africa
and Latin America (except for Ecuador), as well as Armenia. It finalised the consolidation and
restructuring of the group in 2019. Finally, it acquired the remaining minority stake in ProCredit
Bank Ukraine in January 2020 (and thus holds a 100% stake in each of its regional banks now).
The company highlights that most of the disposals were motivated by the group’s long-term
strategic vision and it is worth noting that these loan books were not under/non-performing.
Consequently, at end-March 2020, PCB conducted its banking operations in 12 markets (13 if we
include ProCredit Bulgaria’s branch in Greece). SEE and EE represented 93% of its gross loan
book, up from 46% at end-2013. The largest markets are Bulgaria (20% of gross loan book at end-
March 2020), followed by Serbia (18%), Ukraine (12%) and Kosovo (11%), see Exhibit 5. PCB’s
banking business in Ecuador was c 6% of the gross loan book at end-March 2020. The company’s
German operations are largely focused on providing services to the group, such as efficient
payment, liquidity and support functions. They include ProCredit, Quipu (the software subsidiary
responsible for developing its digital platform), ProCredit Bank Germany (1% of the group’s gross
loan portfolio at end-March 2020) and ProCredit Academy in Fürth (which runs a training centre for
the group’s employees). The company has implemented German banking standards across its
regional banks and is supervised by the German authorities (BaFin and Bundesbank).
Exhibit 4: PCB’s regional loan book split between 2013 and 2019
Exhibit 5: PCB’s regional loan book exposure at end-March 2020
Source: ProCredit Source: ProCredit
46%
70%
92%
0%
10%
20%
30%
40%
50%
60%
70%
80%
90%
100%
FY13 FY16 FY19
645
290
81
0
100
200
300
400
500
600
700
FY13 FY16 FY19
0%
20%
40%
60%
80%
100%
FY13 FY16 FY19
GermanyAfricaSouth AmericaSouth Eastern Europe and Eastern Europe
Bulgaria (incl. Greece) (20%)
Serbia (18%)
Kosovo (11%)
North Macedonia (8%)
Romania (6%)
Albania (4%)
Bosnia (4%)
Ukraine (12%)
Georgia (7%)
Moldova (3%)
Ecuador (6%)
ProCredit | 4 June 2020 6
Strategy
Sustainability and impact orientation as a top priority
PCB’s long-term mission is to contribute to an inclusive, stable and efficient financial system. It
focuses on building and maintaining long-term relationships with its clients and employees, offers
only simple and transparent products, promotes a savings-oriented culture and puts a strong
emphasis on prudent credit as well as environmental and social risk management. This is
enhanced by the group-wide code of conduct, which includes an exclusion list, specifying business
activities that must not be financed by the group (in fact, no business activities will be established
with clients engaged in any of these activities). Additionally, the company has set standards to
minimise the environmental impact of its lending operations, supported by the Group Environmental
Steering Committee at group level and Environmental Committees in the local banks. PCB’s
strategy is aligned with the UN’s Sustainable Development Goals.
Moreover, it has been actively cooperating with European institutions to foster innovation and
became one of the largest partners for the InnovFin programme run by the European Investment
Fund (EIF). The latter doubled the available financing covered by guarantees provided to PCB
through the InnovFin initiative to €1.62bn in July 2019, which extended PCB’s capacity to grant
loans to innovative companies. PCB has enabled access to this EU-backed funding to around
2,000 SMEs.
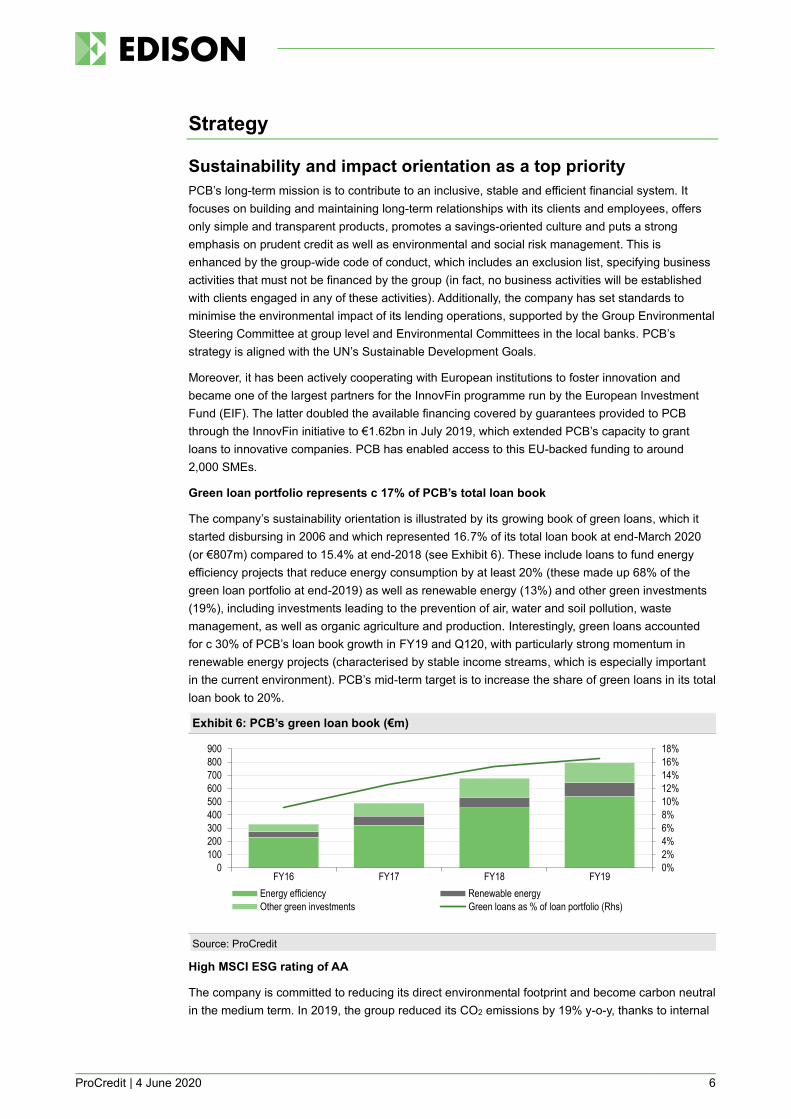
Green loan portfolio represents c 17% of PCB’s total loan book
The company’s sustainability orientation is illustrated by its growing book of green loans, which it
started disbursing in 2006 and which represented 16.7% of its total loan book at end-March 2020
(or €807m) compared to 15.4% at end-2018 (see Exhibit 6). These include loans to fund energy
efficiency projects that reduce energy consumption by at least 20% (these made up 68% of the
green loan portfolio at end-2019) as well as renewable energy (13%) and other green investments
(19%), including investments leading to the prevention of air, water and soil pollution, waste
management, as well as organic agriculture and production. Interestingly, green loans accounted
for c 30% of PCB’s loan book growth in FY19 and Q120, with particularly strong momentum in
renewable energy projects (characterised by stable income streams, which is especially important
in the current environment). PCB’s mid-term target is to increase the share of green loans in its total
loan book to 20%.
Exhibit 6: PCB’s green loan book (€m)
Source: ProCredit
High MSCI ESG rating of AA
The company is committed to reducing its direct environmental footprint and become carbon neutral
in the medium term. In 2019, the group reduced its CO2 emissions by 19% y-o-y, thanks to internal
0%
2%
4%
6%
8%
10%
12%
14%
16%
18%
0
100
200
300
400
500
600
700
800
900
FY16 FY17 FY18 FY19
Energy efficiency Renewable energy
Other green investments Green loans as % of loan portfolio (Rhs)

ProCredit | 4 June 2020 7
environmental measures in its premises, replacing fleet with electric and hybrid vehicles (c 65% of
its car fleet currently), as well as progressive reduction and recycling of waste.
PCB’s ESG performance, measured by the MSCI ESG rating, was AA at 12 May 2020, which
places it in the top 15% of companies rated by MSCI in the banking sector worldwide.
Direct (digital) bank for private clients
Despite its traditional approach to banking, the company is committed to investing in the
development of efficient and secure technology. Its app- and web-based functionalities are
developed in-house by its software subsidiary Quipu, which PCB believes helps address IT
challenges quickly. With respect to the development of PCB’s direct (digital) banking, a major
milestone was the introduction of ‘ProCredit Direct’ in 2017, a digital banking platform primarily for
private clients. It complemented the existing approach of ‘Hausbank’ for SMEs and allowed it to
initiate the digitalisation of financial services to private clients, fully completed in 2018. Since then,
all transactions in the group’s banks have been digital (ie PCB substantially abolished over-the-
counter and cash transactions in its branches). Currently, PCB is focused on the digitalisation of
non-financial transactions, including development of MyDIRECT, an online service that enables
clients to confirm their identity digitally via remote video (which was introduced in its banks in
Bulgaria and Georgia last year). The company underlines the innovative nature of its IT solutions in
the markets it operates in, eg PCB’s bank in Ecuador is the only fully digital and cash-free bank in
the country. Interestingly, while the group has largely finalised the shift away from loans with a
volume below €50k last year, it treats this market segment as an opportunity for more streamlined
lending to private and small corporate clients using its digital platform.
Hiring/HR policy
PCB highlights that it can fulfil the needs of SMEs better than its competitors, thanks to its well-
trained and long-serving staff, with 75% of the team having more than five years of experience in
the group, while managers in local banks have worked for PCB for over 12 years on average. PCB
remains focused on targeted recruitment and staff development, which it supports with
comprehensive training programmes provided by ProCredit Academy in Fürth, Germany. PCB’s
spending on employee training rose from €6.8m to €7.2m in FY19. Notably, the company’s
renumeration policy is aligned to its long-term oriented business objectives and does not include
any short-term, performance-related bonuses. PCB promotes gender diversity, as exhibited by the
composition of the management boards in the group’s banks, with women representing 53% of the
headcount. The bank’s response to COVID-19, and in particular the health and safety of
employees, has benefited from a focus on digital banking, which has enabled staff to work from
home and continue to engage with clients.
Management
ProCredit’s business is managed by ProCredit General Partner (the personally liable managing
partner of ProCredit AG & Co KGaA), which has a management board consisting of two members:
◼ Dr Gabriel Schor has worked for the consulting company IPC (discussed above) since
1983. He was appointed a member of PCB’s management board in 2004 and is
responsible for reporting and controlling, supervisory reporting and capital planning,
accounting and taxes, group treasury and group funding. In September 2019, he also took
over investor relations, group communications, administration and translation.
◼ Sandrine Massiani joined PCB in 2007 and initially worked as regional coordinator in
Africa. She became a coordinator of the group’s human resources in 2011, and a manager
of human resources and IT in 2015. She was appointed to the management board in 2017

ProCredit | 4 June 2020 8
and has overseen human resources, internal audit, risk management, IT, business support
and compliance. Since September 2019, she has also been responsible for credit risk,
group environmental management, legal, group anti-money laundering and fraud
prevention. Before Sandrine Massiani joined PCB, she worked at BNP Paribas and
Development Finance International (an international advisory firm focused on emerging
markets) and was a project coordinator and short-term expert at IPC.
A notable change to the management board took place in September 2019, when Borislav
Kostadinov (who had been responsible for credit risk management, environmental management
and impact reporting) resigned from his function for personal reasons. Dr Gian Marco Felice will
join the management board in June 2020 once all formal procedures with BaFin have been
completed. He has held various managerial positions within the group since 2001 and is now an
authorised representative of the company (‘prokurist’), responsible for business support,
environmental management and impact reporting.
PCB’s key management personnel also includes Christian Dagrosa, who is a prokurist and
manager responsible for investor relations, as well as reporting and controlling. However, he is not
a member of the management board of ProCredit General Partner.
Overview of operations by country
We have summarised PCB’s operations by country in Exhibit 7. We note that EE displays higher
profitability (annualised return on average equity (ROAE) of 15.2% in Q120 vs 7.1% in SEE), driven
by a higher NIM (4.5% vs 2.5% in SEE and 3.1% at group level) and lower CIR (39.7% vs 65.7% in
SEE and 64.6% at group level). At the same time, the share of NPLs remains low across regions.
Exhibit 7: Summary of PCB’s operations by region and country
Gross book at end-Q120 (€m)
Gross loan book y-o-y
NPL ratio (end-Q120)
Cost income ratio (Q120)
Cost income ratio (FY19)
Profit after tax in FY19 (€m)
ROE (FY19)
Southeastern Europe 3,414 9.9% 2.2% 65.7% 72.0% 38.4 7.8%
Bulgaria 956 12.7% N/A N/A N/A 18.5 N/A
Serbia 854 12.2% N/A N/A N/A 5.9 N/A
Kosovo 512 0.8% N/A N/A N/A 21.5 N/A
North Macedonia 376 13.3% N/A N/A N/A 4.2 N/A
Romania 307 17.8% N/A N/A N/A -4.1 N/A
Bosnia & Herzegovina 205 8.5% N/A N/A N/A -0.8 N/A
Albania 205 -1.2% N/A N/A N/A -6.6 N/A
Eastern Europe 1,064 10.5% 3.2% 39.7% 42.3% 37.7 17.4%
Ukraine 607 16.4% N/A N/A N/A 24.2 N/A
Georgia 319 -0.7% N/A N/A N/A 9.0 N/A
Moldova 138 16.5% N/A N/A N/A 4.5 N/A
Ecuador 307 26.7% 2.6% 90.8% 102.5% -1.3 -2.3%
Germany 54 -26.2% N/M N/M N/M 1.6 N/M
TOTAL 4,839 9.2% 2.4% 64.6% 70.5% 54.3 6.9%
Source: ProCredit
SEE: Strong loan book momentum and quality, but muted margins
PCB’s loan book growth across countries (except for Kosovo and Albania) has been strong overall
in recent years at 10%+ pa, supported by the comparatively low level of loan book to GDP at c 30–
55% compared to 70%+ in major Western European economies (see Exhibit 8). In Kosovo, PCB
has a leading position in a rather saturated market and thus focuses on retaining its high market
share.
PCB’s NPL ratio (2.2%) is below local sector levels as banks continue to deal with legacy assets. It
is below the ratio reported by Raiffeisen in SEE (3.3% at end-March 2020), as well as its two listed
Romanian peers (BRD at 3.3% and Banca Transilvania at 2.83% at end-March 2020), although it is

ProCredit | 4 June 2020 9
also worth highlighting that these peers had a significantly higher ratio a few years back (at c 10–
15%). PCB’s NIM in the region stood at 2.5% in Q120 (annualised), below the c 3.3–3.5% for some
of its listed peers, with the lack of meaningful consumer lending being likely one of the key reasons.
PCB faces competition from European banking groups in the region, which means margins are
likely to remain moderate.
Overall, profitability in SEE was dampened by PCB’s bank in Romania, which posted a €4.1m loss
in FY19 amid high financing costs as the bank is still in the process of building critical mass. On the
positive side, we note that the bank tax announced in Romania in 2019 was abolished at the
beginning of 2020. Moreover, Albania recognised a loss of €6.6m in FY19, resulting from
restructuring costs as well as the earthquake in November 2019. Key positive earnings contributors
in SEE were Bulgaria (profit after tax of €18.5m in FY19) as well as Kosovo (€21.5m).
EE: Solid growth and margins, with NPL ratio well under control
The EE region’s performance in recent years was characterised by a gradual recovery in corporate
funding in Ukraine (57% of PCB’s loan book in EE at end-March 2020) from the ongoing conflict
with Russia, which started in 2014 and triggered a wave of bank closures (with their number down
from c 180 in 2014 to 76 in June 2019, according to the German Advisory Group Ukraine). Similarly,
Moldova has been recovering from the 2014 banking crisis induced by the collapse of three local
commercial banks (Banca de Economii, Unibank and Banca Socială). Like SEE, loan book
momentum was further supported by low banking sector penetration (see Exhibit 8).
With respect to competition in the region, it seems to be somewhat weaker compared to SEE due
to the more limited presence of international banking groups and thus higher market share of
local/regional players. For instance, the two largest banks in Georgia (TBC Bank and Bank of
Georgia) have a combined market share of c 70% by total assets. While the presence of
international (non-Russian) banks is slightly higher in Ukraine, all local banks (in particular state-
owned) hold c 70% of the market. Consequently, PCB’s interest rates on loans, and hence NIM and
profitability, remain solid in the region. The company’s NIM in Q120 stood at an annualised 4.5%.
It is worth highlighting that the NPL ratio in the Ukrainian banking sector was 48.4% at end-2019
according to the IMF (vs ProCredit Bank Ukraine at 3.7% at end-2019). The NPL ratio in Georgia at
end-September 2019 stood at around 4.4% based on local central bank data (vs PCB at around
3.0% at end-2019), whereas in Moldova it was c 8.5% at end-2019 according to the IMF (vs PCB at
3.1%).
Ecuador: Healthy margins, but a particularly weak macro environment
Ecuador is PCB’s only exposure to Latin America (c 6% of its total loan book). While the NIM in the
region has been favourable for PCB at 5.2% in Q120, the local economy has experienced a ‘perfect
storm’ in recent years with headwinds from 1) political instability and social unrest triggered by,
among other things, the fuel subsidy cut, 2) the impact from Fed rate hikes up to end-2018 (as the
US dollar is its official currency), 3) a significant drop in oil prices lately (Ecuador is a major regional
exporter) and 4) COVID-19. Consequently, the country recently defaulted on its bonds and
requested IMF funding. Competition in the banking sector is predominantly from local market
participants. While PCB’s operations in Ecuador have been profitable in the past, they are yet to
return to break-even since realignment of the business model.

ProCredit | 4 June 2020 10
Exhibit 8: Domestic credit to private sector by banks as percentage of GDP in 2018
Source: World Bank
Market outlook
Pandemic has led to revised macro projections for the region
SEE and EE experienced relatively benign economic conditions after the global financial crisis
(GFC), posting continuous, stable, low- to mid-single digit growth (as measured by real GDP) over
the last five years and around 3–5% in 2019 alone (see Exhibit 9). However, the pandemic led to a
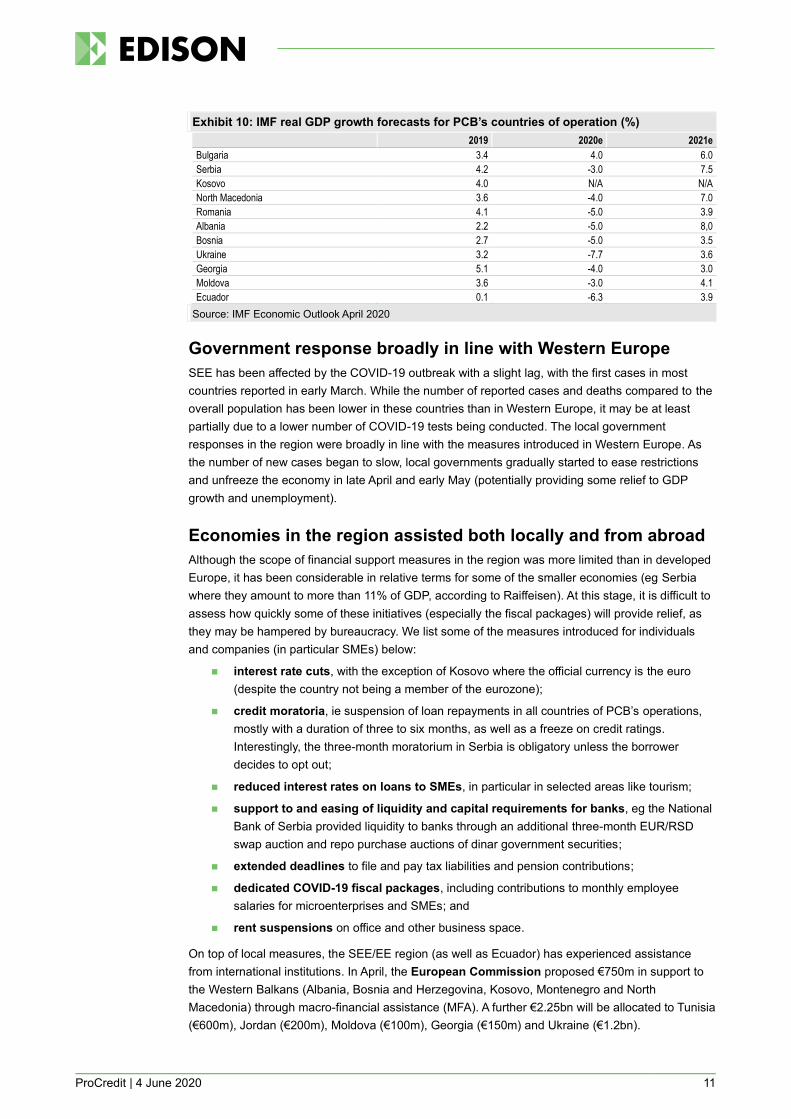
significant downward forecast revision by the IMF in April 2020 (see Exhibit 10). Although these
projections assume a visible rebound in economic activity in 2021 (in line with the base case
scenario in our PCB forecasts), they are subject to a high level of uncertainty.
Exhibit 9: Average GDP growth by region of PCB’s operations (%)
Source: IMF. Note: Includes only countries where PCB has its regional banks.
0%
20%
40%
60%
80%
100%
120%
140%
160%
UK
Net
herla
nds
Fra
nce
Spa
in
Aus
tria
Ger
man
y
Italy
Bel
gium
Geo
rgia
Bos
nia
& H
erze
govi
na
Pol
and
Cze
ch R
epub
lic
Bul
garia
Nor
th M
aced
onia
Kos
ovo
Ser
bia
Ecu
ador
Ukr
aine
Alb
ania
Hun
gary
Rom
ania
Mol
dova
-8.0
-6.0
-4.0
-2.0
0.0
2.0
4.0
6.0
8.0
2015 2016 2017 2018 2019 2020e 2021e
South Eastern Europe Eastern Europe Ecuador
ProCredit | 4 June 2020 11
Exhibit 10: IMF real GDP growth forecasts for PCB’s countries of operation (%)
2019 2020e 2021e
Bulgaria 3.4 4.0 6.0
Serbia 4.2 -3.0 7.5
Kosovo 4.0 N/A N/A
North Macedonia 3.6 -4.0 7.0
Romania 4.1 -5.0 3.9
Albania 2.2 -5.0 8,0
Bosnia 2.7 -5.0 3.5
Ukraine 3.2 -7.7 3.6
Georgia 5.1 -4.0 3.0
Moldova 3.6 -3.0 4.1
Ecuador 0.1 -6.3 3.9
Source: IMF Economic Outlook April 2020
Government response broadly in line with Western Europe
SEE has been affected by the COVID-19 outbreak with a slight lag, with the first cases in most
countries reported in early March. While the number of reported cases and deaths compared to the
overall population has been lower in these countries than in Western Europe, it may be at least
partially due to a lower number of COVID-19 tests being conducted. The local government
responses in the region were broadly in line with the measures introduced in Western Europe. As
the number of new cases began to slow, local governments gradually started to ease restrictions
and unfreeze the economy in late April and early May (potentially providing some relief to GDP
growth and unemployment).
Economies in the region assisted both locally and from abroad
Although the scope of financial support measures in the region was more limited than in developed
Europe, it has been considerable in relative terms for some of the smaller economies (eg Serbia
where they amount to more than 11% of GDP, according to Raiffeisen). At this stage, it is difficult to
assess how quickly some of these initiatives (especially the fiscal packages) will provide relief, as
they may be hampered by bureaucracy. We list some of the measures introduced for individuals
and companies (in particular SMEs) below:
◼ interest rate cuts, with the exception of Kosovo where the official currency is the euro
(despite the country not being a member of the eurozone);
◼ credit moratoria, ie suspension of loan repayments in all countries of PCB’s operations,
mostly with a duration of three to six months, as well as a freeze on credit ratings.
Interestingly, the three-month moratorium in Serbia is obligatory unless the borrower
decides to opt out;
◼ reduced interest rates on loans to SMEs, in particular in selected areas like tourism;
◼ support to and easing of liquidity and capital requirements for banks, eg the National
Bank of Serbia provided liquidity to banks through an additional three-month EUR/RSD
swap auction and repo purchase auctions of dinar government securities;
◼ extended deadlines to file and pay tax liabilities and pension contributions;
◼ dedicated COVID-19 fiscal packages, including contributions to monthly employee
salaries for microenterprises and SMEs; and
◼ rent suspensions on office and other business space.
On top of local measures, the SEE/EE region (as well as Ecuador) has experienced assistance
from international institutions. In April, the European Commission proposed €750m in support to
the Western Balkans (Albania, Bosnia and Herzegovina, Kosovo, Montenegro and North
Macedonia) through macro-financial assistance (MFA). A further €2.25bn will be allocated to Tunisia
(€600m), Jordan (€200m), Moldova (€100m), Georgia (€150m) and Ukraine (€1.2bn).

ProCredit | 4 June 2020 12
The International Monetary Fund recently approved financial support through the Rapid Credit
Facility (RCF) and Rapid Financing Instrument (RFI) to a number of countries in the region,
including Bosnia and Herzegovina (US$361m), North Macedonia (US$191.8m), Albania
(US$190.5m), Moldova (US$156.7m) and Kosovo (US$56.5m). Furthermore, it has provided
US$375.6m in support to Georgia through an augmentation of its Extended Fund Facility. Ecuador
also received considerable support through the RFI of US$643m, with the country being hit
severely by both COVID-19 and the sharp drop in oil prices. We underline that Ecuador defaulted
on its bond payment in April, postponing the repayment of US$800m until August.
Finally, what is particularly important from PCB’s perspective is that the European Investment
Bank (EIB) has embarked on mobilising up to €40bn funding for SMEs and mid-caps in Europe.
This includes: 1) up to €20bn financing from dedicated guarantee schemes to banks, 2) liquidity
lines to banks to facilitate additional capital support for SMEs and mid-caps of €10bn, and 3) asset-
backed securities purchasing programmes allowing banks to transfer risk SME loan portfolios worth
another €10bn. Specifically, the EIF (part of EIB Group) announced additional COVID-19 measures
in the COSME and InnovFin programmes involving new guarantee capacity to unlock €8.0bn in
working capital loans for SMEs to mitigate their liquidity constraints. The new measures in the
InnovFin programme (in which PCB is participating) comprise, among others, a higher guarantee
rate for working capital loans (80% vs 50% previously), reduced financial intermediary risk retention
(10 vs 20% earlier), more flexible guarantee terms (including innovation eligibility criteria) and
extended coverage of accrued or capitalised interest.
Sensitivities
We have identified several sensitivities influencing PCB’s business. These include:
◼ COVID-19: we discuss the potential impact of the pandemic on PCB’s cost of risk, as well
as customer loan and deposit growth throughout the note in detail. We would like to
emphasise that PCB’s performance should be supported by a number of factors, including:
1) a lean branch network and digital platform (powered by Quipu) with all clients already
on-boarded, 2) the high loan book quality and collateral requirements, 3) well-trained and
experienced staff (most of the managers worked at PCB during the 2008/09 crisis), 4)
emphasis on a long-term, in-depth and individual approach to SMEs throughout their
lifecycle, with every business client advisor (BCA) responsible for only 40–50 loan clients,
5) support from international financial institutions (as shareholders, debt holders and/or
partners in SME funding schemes) and 6) solid liquidity with a LCR of 181% at end-March
2020 vs the regulatory requirement of 100%. Overall, we estimate that every increase in
cost of risk by 10bp in FY20e would reduce our PCB valuation by c €0.03 per share (or
0.5% vs the current level).
◼ Foreign exchange risk: PCB is exposed to foreign currency exchange rate volatility due
to its international operations. At group level, currency risk primarily arises from the
changing value of the parent company’s equity investments in regional banks, which are
denominated in the respective domestic currencies. This is being reflected directly in PCB’s
equity in the changes to its translation reserve. However, the impact on PCB’s CET-1
capital is normally largely offset by a corresponding downward FX impact on its risk-
weighted assets. We also note that 56% of the group’s loan portfolio was denominated in
euros at end-March 2020, followed by the US dollar (11%) and local currencies (33%).
However, PCB aims to reduce credit risk for clients and the group’s banks by typically
disbursing foreign currency loans only to customers who generate revenues in this
currency. Finally, depreciation of domestic currencies could lead to the reduction of
regulatory capital ratios in local banks, but PCB mitigates this risk by matching the foreign
ProCredit | 4 June 2020 13
currency exposures of its assets and liabilities. The use of hedging instruments is thus
limited at PCB.
Some countries where PCB is present have pegged their domestic currencies to the euro,
which inherently reduces their volatility vs the euro (the group’s reporting currency). This
includes Bulgaria and Bosnia and Herzegovina (‘hard’ pegs) as well as Serbia and North
Macedonia (‘soft’ pegs), which together represented 50% of PCB’s loan book at end-March
2020. In addition, the euro is the official currency in Kosovo (11% of loan book at end-
March 2020). At the same time, however, we acknowledge that currency pegs may be
broken and consequently do not ensure the stability of exchange rates at all times (a good
example here is Ukraine back in 2015).
◼ Political risk is elevated in several SEE/EE countries, as illustrated by military conflicts
(Ukraine, Georgia), territorial disputes (Kosovo-Serbia) and internal political deadlocks (eg
North Macedonia back in 2015–17). As global populism has intensified in recent years, the
Western Balkans face the potential risk of conflicts between parties appealing to major
ethnic groups. Moreover, the region is one of the playgrounds for political competition
between the West and Russia.
Having said that, we note that two countries where PCB operates – Bulgaria and Romania
– are EU members, while Albania, North Macedonia and Serbia are EU member
candidates. Several countries are also NATO members (Albania, Bulgaria, North
Macedonia and Romania). Finally, we note that PCB has extensive experience in operating
in these countries and navigating through times of political and military unrest.
◼ Macroeconomic risk remains higher in PCB’s countries of operation compared to
Western Europe and the CEE countries given the earlier stage of economic development
and several challenges/risks these economies face, including:
– higher share of foreign currency-denominated loans in the banking sector in several
countries (eg Serbia, Albania and across EE);
– susceptibility to global supply chain disruptions;
– high reliance on remittances (eg Kosovo, Albania, Moldova);
– high tourism contribution to GDP (eg Georgia, Albania); and
– Ecuador’s high sensitivity to oil prices.
◼ Weather and natural disaster risk, as illustrated by the 6.4 magnitude earthquake in
Albania in November 2019, which contributed to PCB’s NPL ratio in this country of 6.1% at
end-2019 (above group average). Moreover, we understand that PCB’s loan book could be
affected in the event of a regionwide drought (which seems to be unfolding currently, with a
particular impact on Ukraine and Romania) given its c 20% exposure to the agricultural
sector.
◼ Fintech competition: a number of innovative companies (both balance sheet lenders and
operators of digital marketplaces) such as Ferratum, Kapilendo, Creditshelf and Funding
Circle seek to address the SME funding gap in Europe. These constitute potential new
competition for PCB, given that they target a similar segment (eg Kapilendo focuses on
loan volumes between €250k and €5m). Having said that, we believe that PCB’s
‘Hausbank’ approach, coupled with strong experience in the markets in which it operates,
represents a significant competitive advantage. Furthermore, fintech expansion in these
markets is likely to occur later than in Western Europe or CEE.
ProCredit | 4 June 2020 14
Financials
Prudent credit risk management and good loan book quality
Sustained low NPL ratio historically
The current downturn is likely to cause a deterioration of corporate asset quality, with SMEs and
micro-companies being normally most vulnerable to this kind of shock given their more limited
capacity to absorb a drop in revenue and withstand a liquidity crunch (even if this is somewhat
mitigated by initiatives similar to the EIB’s described earlier). Having said that, we note that PCB
has shied away from aggressive lending and continuously focused on deep, long-term relationships
with high-quality SMEs. Moreover, as a reminder, PCB does not offer any meaningful volumes of
consumer loans, with 93% of its portfolio in SME lending and 6% in housing loans to private
customers.
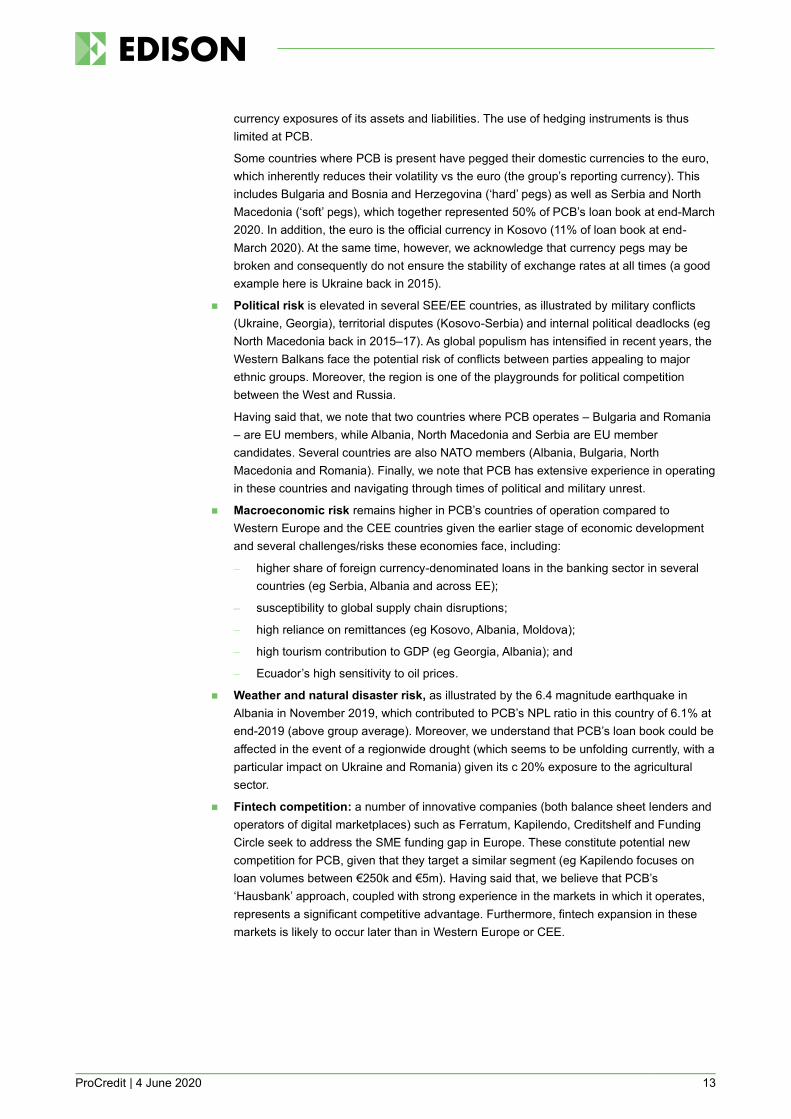
Consequently, PCB was able to report a low NPL ratio (reflecting Stage 3 loans under IFRS)
historically, which stood at 2.4% in Q120 and 2.5% at end-2019 (compared to 3.1% in FY18 and
3.9% in FY17, see Exhibit 11). Previously, PCB reported the ratio of loans over 30 days late (vs 90
days for NPLs currently), which stood at a relatively low level between 3.7% and 4.9% in 2010–16.
It is also worth noting that PCB’s green loan portfolio is characterised by even better quality, with its
NPL rate at end-2019 of just 0.6%. We forecast NPL ratios at group level of 2.8% in FY20e and
2.7% in FY21e.
Exhibit 11: PCB’s historical and forecast NPL ratio at group level
Source: ProCredit, Edison Investment Research
In this context, we note that PCB has never sold NPL portfolios, which means that its historical NPL
ratio development may be largely considered organic (and supported by low net write-offs through
the cycle), except for the business disposals in South and Central America as well as Africa.
However, the NPL ratios for these businesses (except for Africa, which was slightly higher) did not
differ materially from its current portfolio and their disposals were based on the evaluation of their
long-term prospects rather than due to inferior loan book quality. PCB highlights that its focus on
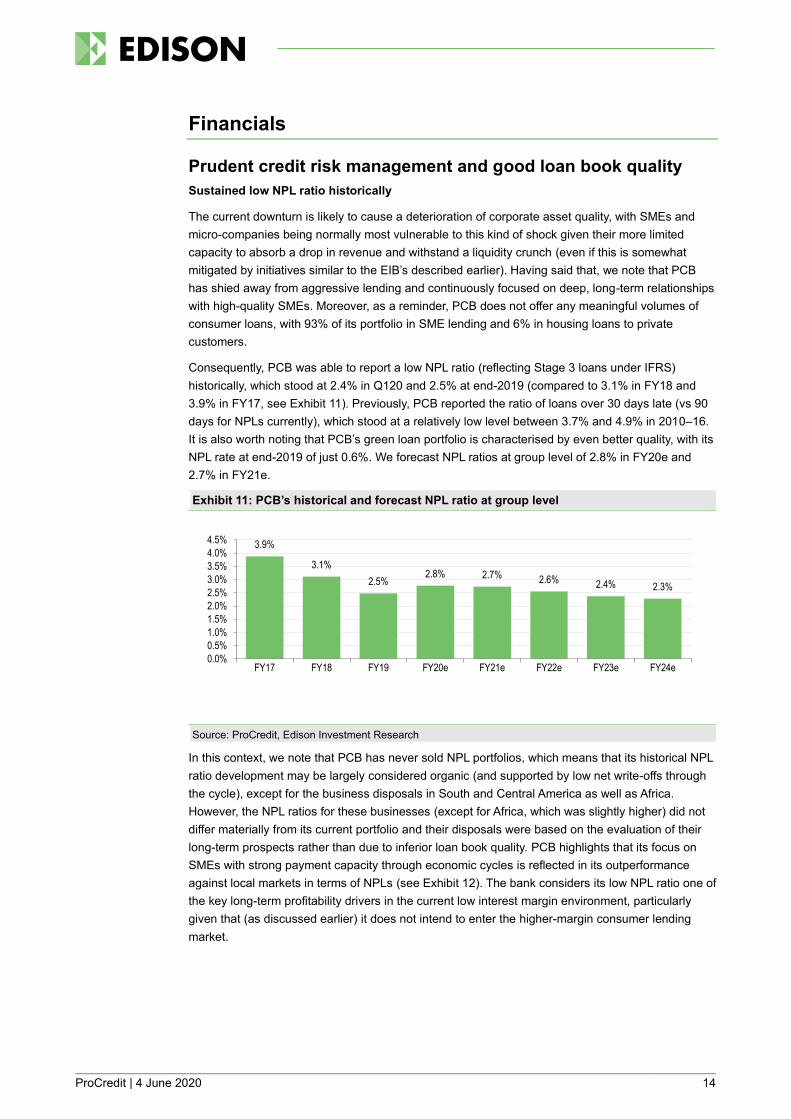
SMEs with strong payment capacity through economic cycles is reflected in its outperformance
against local markets in terms of NPLs (see Exhibit 12). The bank considers its low NPL ratio one of
the key long-term profitability drivers in the current low interest margin environment, particularly
given that (as discussed earlier) it does not intend to enter the higher-margin consumer lending
market.
3.9%
3.1%
2.5%2.8% 2.7% 2.6% 2.4% 2.3%
0.0%
0.5%
1.0%
1.5%
2.0%
2.5%
3.0%
3.5%
4.0%
4.5%
FY17 FY18 FY19 FY20e FY21e FY22e FY23e FY24e
ProCredit | 4 June 2020 15
Exhibit 12: PCB’s NPL ratios (FY19) vs local banking sector NPLs
Source: IMF Financial Soundness Indicators, ProCredit. Note: Country ratios are last available (at end-Q219, Q319 or Q419). *NPL ratio for Georgia based on local central bank’s methodology. Based on IMF data, this would be 2.7%.
Strict loan collateral policy and NPL coverage ratio comfortably at c 95%
PCB has consistently emphasised strict, formalised collateral requirements compared to many
other local players that were relaxed about their requirements to fuel growth until February 2020.
PCB’s total loan collateral at end-March 2020 was €3.7bn and included commercial and residential
mortgages (66%), financial guarantees (12%) and other (22%). Financial guarantees are largely
provided by the EIF through ProCredit’s regional banks to SMEs as part of the InnovFin
programme, which in the case of PCB was increased from €800m to €1,620m as announced in July
2019 (making PCB one of the largest programme participants). These guarantees normally cover
50% of potential credit losses, translating into a lower loss allowance requirement for PCB
(although loss allowances would not be much higher without the guarantees according to
management). It is worth highlighting that the InnovFin SME Guarantee COVID-19 measures
recently announced by the EIF, which include an increased 80% cover of credit losses for new
working capital facilities (as discussed above), should help PCB grow its loan portfolio while
allowing it to maintain its collateral standards. Despite the solid collateral for PCB’s loan book, the
group retained a robust NPL coverage ratio, which in Q120 was 95.5% (vs 89.1% at end-2019 and
90.8% at end-2018).
No elevated risk from sector exposure
It is also important to note that PCB has relatively limited exposure to sectors most affected by
COVID-19, such as hotels and travel (c 4% of loan book) or transport and logistics (5%).
Furthermore, PCB has an insignificant exposure to automotive production and supply, as well as
the oil & gas sector (although it still has exposure to the broader manufacturing sector at 23%). In
total, the most affected sectors (horeca, transportation, construction, as well as arts and
entertainment) made up c 15% of PCB’s loan book at end-March 2020, according to the company.
At the same time, one of its top sector exposures is agriculture, forestry and fishing (20%), which is
likely to prove more resilient in the current overall adverse market conditions (although this may
change if the drought unfolding in the region turns out to have a significant impact). Together with
other relatively defensive sectors (food and drinks, waste management and health services), this
represents around 40% of PCB’s portfolio. This also includes PCB’s renewable energy loans
portfolio (c 2% of the group’s loan book at end-2019, according to our estimates). Finally, it is worth
noting that PCB states its single largest client exposure represents just 1.5% of the group’s CET-1
capital.
1.9% 2.9% 1.9% 2.2%6.1%
2.1% 3.7% 3.0% 3.1% 2.4%7.6%
2.4%4.6% 4.6%
8.4% 7.4%
48.4%
4.4%8.5%
3.2%
0%5%
10%15%20%25%30%35%40%45%50%
Bulgaria(incl.
Greece)
Kosovo NorthMacedonia
Romania Albania Bosnia Ukraine Georgia* Moldova Ecuador
PCB NPL ratio Country NPL ratio

ProCredit | 4 June 2020 16
Cost of risk likely to increase
Management has guided to a cost of risk (defined as loss allowances to average gross loan book)
of 50–75bp in FY20, which is broadly in line with recent management guidance at Raiffeisen Bank
International (75bp) and Erste Group (50–80bp based on a V-shaped recovery assumption). This
will come from loans moving to Stage 2 (significantly increased credit risk) and Stage 3 (non-
performing). Hence, although the cost of risk has already increased in Q120, this was not
accompanied by a spike in NPL ratio. The latter should be largely back-end loaded (Q420 in
particular) as defaults should materialise with a lag because: loans are considered non-performing
if they are 90 days past due; credit moratoria of three to six months have been a common response
across PCB’s countries of operations (as per ESMA guidelines, moratoria do not increase credit
risk); and some distressed loans will go through a restructuring process in H220 first. Importantly, in
a statement released on 27 April, management highlighted that it has not experienced strong
pressure on loan quality to date. We have factored in cost of risk at 80bp in FY20e, followed by
62bp in FY21e as we still assume elevated default rates in early 2021.
At end-March 2020, the share of PCB’s loan book under moratorium was c 30%. However, this is
distorted because (as mentioned earlier) Serbia has introduced moratoria in an opt-out setup (ie
borrowers have to apply to not be subject to a moratorium). Excluding Serbia, 20% of PCB’s loan
book (or €0.8bn) is under moratorium, with the breakdown presented in Exhibit 13. The company
has also disclosed the share of portfolio in moratorium by sector, with hotel, retail and catering
(horeca) unsurprisingly at the top of the list (see Exhibit 14). We note that PCB (in line with
standard sector practice) continues accruing interest income on its P&L from these loans despite
the fact that actual cash inflow is being postponed.
Exhibit 13: Breakdown of PCB’s loan portfolio under moratorium by sector
Exhibit 14: Share of portfolio in moratorium by sector
Source: ProCredit. Note: Excludes Serbia. Source: ProCredit. Note: Excludes Serbia.
Prospective loan book growth muted as SMEs curb investments
The adverse macro environment will limit SME investments significantly but may also increase
demand for bridge/working capital funding. Consequently, while the current environment is
characterised by elevated risk, it may also prove an opportunity for PCB to expand its business.
Nevertheless, risks seem to significantly outweigh opportunities at this stage. Moreover, predictions
in the current environment are obviously subject to significant uncertainty. Still, our base case
scenario assumes that, while a recessionary environment is likely to persist into early 2021, we may
see some gradual recovery in the second half of next year (and technically also in Q221 given the
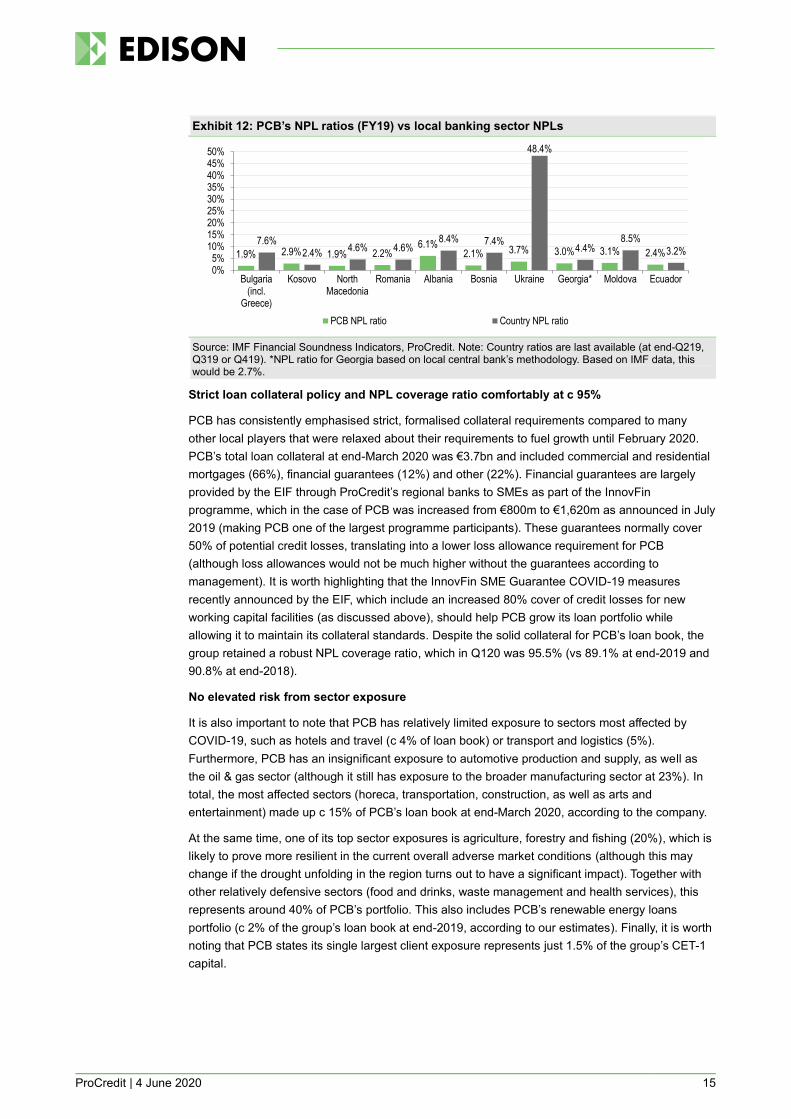
low base effect). Consequently, we forecast PCB’s net loan book growth at c 2% in FY20e and 7%
in FY21e (see Exhibit 15). The FY20e assumption is broadly in line with company guidance of low
single-digit growth in loan book. Management’s mid-term target is to grow the loan portfolio by
around 10% pa and our FY22e assumption is in line with this.
Trade (33%)
Production (25%)
Services (14%)
HORECA (6%)
Transport (6%)
Agro (5%)
Construction (4%)
Private (6%)
38%
27%
25%
24%
23%
18%
6%
15%
0% 10% 20% 30% 40%
HORECA
Services
Transport
Trade
Production
Construction
Agro
Private
ProCredit | 4 June 2020 17
Exhibit 15: PCB’s historical and forecast net loan book evolution
Source: ProCredit, Edison Investment Research
Maintaining a diversified range of funding sources
High emphasis on growing the customer deposit base
Last year, management put strong emphasis on customer deposits base expansion to diversify its
funding sources and reduce average funding costs. This is important given that PCB’s ratio of
customer deposits to loans stands at a moderate 88% (at end-March 2020) compared to c 113% for
Erste Bank, 102% in case of Raiffeisen Bank and 125% for OTP Bank. This translated into solid
deposit growth in FY19 of 14.2% y-o-y (vs 7.1% and 2.8% in FY18 and FY17, respectively),
assisted by both private and SME customers. This has been achieved despite PCB’s continued
execution of the ‘ProCredit Direct’ strategy in its private customer business (involving, among other
things, abolishing cash transactions and migrating customers to its digital platform), which resulted
in the departure of non-core clients with low account balances (which led to lower fees from
account maintenance), particularly in Kosovo.
For this year, we assume the company may face some deposits outflow amid the liquidity crunch
triggered by the COVID-19 lockdown. We understand the deposit outflow may be more pronounced
in economies that rely on cash payments and where remittances from diaspora (which are likely to
diminish) represent a large part of GDP, including many SEE/EE countries such as for instance
Kosovo (remittances represent c 15% of GDP according to the OECD). That said, this should be
partially offset by PCB’s focus on digital banking for middle-income and high earners in the private
customers segment, as well as the high level of client confidence its regional banks enjoy, which is
underpinned by the German reputation and PCB’s track record (eg it remained one of the last
banks to stay open in several countries during the global financial crisis in 2008/09 as well as the
military conflict in Georgia, according to the company). Although we understand that c 55% of
PCB’s deposit base consists of sight and savings (FlexSave) accounts (with limited or no
withdrawal restrictions), the remaining 45% represent term deposits, which predominantly have a
maturity longer than 12 months.
Based on all the above, we have conservatively assumed a 2% decline year-on-year in customer
deposits in FY20e, followed by a 5% rebound in FY21e. Nevertheless, we acknowledge that (as per
the company’s statement dated 27 April) apart from some usual seasonal drop, PCB’s deposit base
has remained resilient so far (and was down c 2% in Q120 vs end-2019).
Other funding sources: Backed by international financial institutions
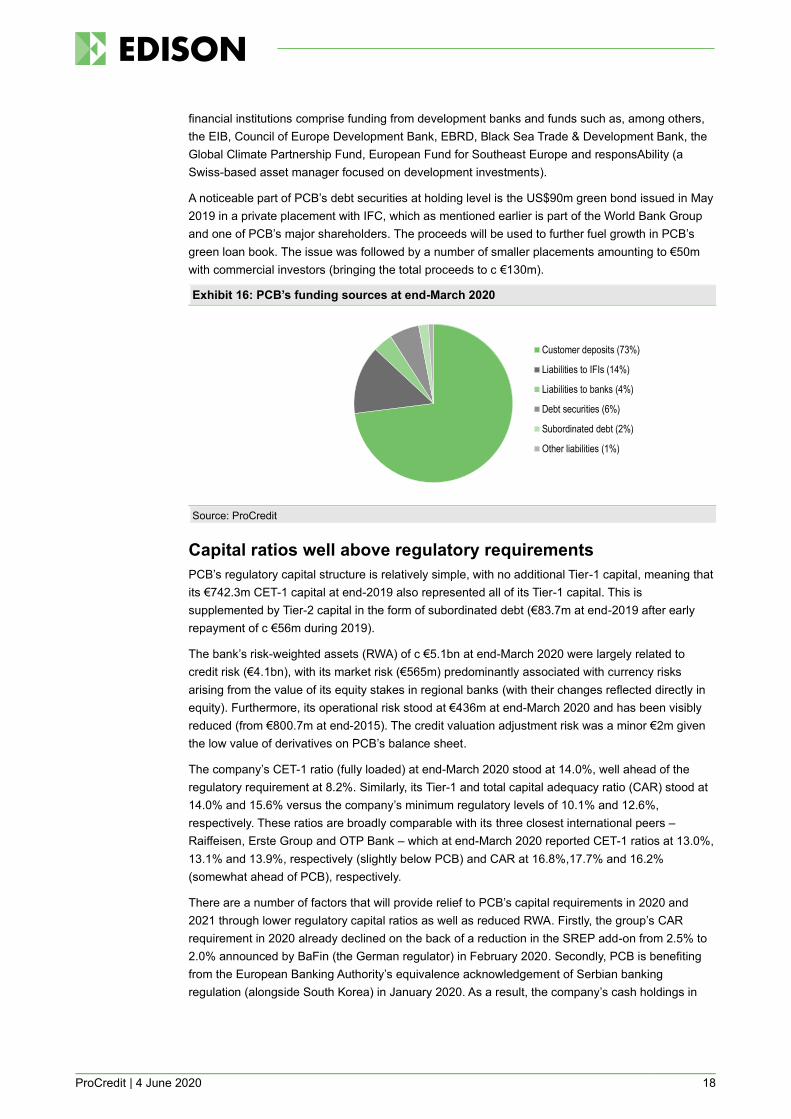
PCB’s remaining external funding is a combination of financing provided by international financial
institutions to the regional ProCredit banks (€838.5m at end-March 2020), as well as debt securities
issued at holding level (€446.7m), including subordinated debt (€89.3m). Liabilities to international
-15%
-10%
-5%
0%
5%
10%
15%
-
1,000
2,000
3,000
4,000
5,000
6,000
7,000
8,000
FY16 FY17 FY18 FY19 FY20e FY21e FY22e FY23e FY24e
Net loan book (€m, Lhs) growth y-o-y (Rhs)
ProCredit | 4 June 2020 18
financial institutions comprise funding from development banks and funds such as, among others,
the EIB, Council of Europe Development Bank, EBRD, Black Sea Trade & Development Bank, the
Global Climate Partnership Fund, European Fund for Southeast Europe and responsAbility (a
Swiss-based asset manager focused on development investments).
A noticeable part of PCB’s debt securities at holding level is the US$90m green bond issued in May
2019 in a private placement with IFC, which as mentioned earlier is part of the World Bank Group
and one of PCB’s major shareholders. The proceeds will be used to further fuel growth in PCB’s
green loan book. The issue was followed by a number of smaller placements amounting to €50m
with commercial investors (bringing the total proceeds to c €130m).
Exhibit 16: PCB’s funding sources at end-March 2020
Source: ProCredit
Capital ratios well above regulatory requirements
PCB’s regulatory capital structure is relatively simple, with no additional Tier-1 capital, meaning that
its €742.3m CET-1 capital at end-2019 also represented all of its Tier-1 capital. This is
supplemented by Tier-2 capital in the form of subordinated debt (€83.7m at end-2019 after early
repayment of c €56m during 2019).
The bank’s risk-weighted assets (RWA) of c €5.1bn at end-March 2020 were largely related to
credit risk (€4.1bn), with its market risk (€565m) predominantly associated with currency risks
arising from the value of its equity stakes in regional banks (with their changes reflected directly in
equity). Furthermore, its operational risk stood at €436m at end-March 2020 and has been visibly
reduced (from €800.7m at end-2015). The credit valuation adjustment risk was a minor €2m given
the low value of derivatives on PCB’s balance sheet.
The company’s CET-1 ratio (fully loaded) at end-March 2020 stood at 14.0%, well ahead of the
regulatory requirement at 8.2%. Similarly, its Tier-1 and total capital adequacy ratio (CAR) stood at
14.0% and 15.6% versus the company’s minimum regulatory levels of 10.1% and 12.6%,
respectively. These ratios are broadly comparable with its three closest international peers –
Raiffeisen, Erste Group and OTP Bank – which at end-March 2020 reported CET-1 ratios at 13.0%,
13.1% and 13.9%, respectively (slightly below PCB) and CAR at 16.8%,17.7% and 16.2%
(somewhat ahead of PCB), respectively.
There are a number of factors that will provide relief to PCB’s capital requirements in 2020 and
2021 through lower regulatory capital ratios as well as reduced RWA. Firstly, the group’s CAR
requirement in 2020 already declined on the back of a reduction in the SREP add-on from 2.5% to
2.0% announced by BaFin (the German regulator) in February 2020. Secondly, PCB is benefiting
from the European Banking Authority’s equivalence acknowledgement of Serbian banking
regulation (alongside South Korea) in January 2020. As a result, the company’s cash holdings in
Customer deposits (73%)
Liabilities to IFIs (14%)
Liabilities to banks (4%)
Debt securities (6%)
Subordinated debt (2%)
Other liabilities (1%)

ProCredit | 4 June 2020 19
the Serbian Central Bank are assigned a 0% weight for the purpose of calculating its RWA, which
led to a €120m reduction, according to management.
Finally, the introduction of CRR II in 2021 brings an extension of the SME support factor (SME SF)
to exposures above €1.5m at 0.85. This should reduce PCB’s RWA (and thus support its capital
ratios) given that 30% of its loan book at end-March 2020 represented loans with a volume above
€1.5m. That said, we acknowledge that credit exposures up to €1.5m for these loans were already
previously subject to an SME SF of 0.7612 and SME loans disbursed by PCB rarely exceed €5.0m.
The recently introduced higher guarantee cover for working capital needs as part of the InnovFin
SMEG COVID-19 measures (80% vs 50% previously) is only applicable to new loan disbursements
and should thus have a limited positive impact on PCB’s RWA.
In conjunction with the short-term slowdown in loan book growth (as discussed above), we estimate
the above factors will translate into CET-1 ratios of 14.1% in FY20e and 14.3% in FY21e (see
Exhibit 17). Management has guided that CET-1 will be above 13% in FY20. We expect PCB’s total
CAR to reach 15.8% in FY20e and FY21e. We estimate that PCB’s capital ratios at end-FY20 can
support loan book growth of 15% pa until FY24 (excluding any retained earnings or translation
reserve impact) compared to our current loan book growth forecast of 9% pa.
Exhibit 17: PCB’s historical and prospective capital ratios vs regulatory requirements
Source: ProCredit, Edison Investment Research. Note: As PCB’s Tier-1 ratio is in line with CET-1 ratio, we have excluded CET-1 capital from the chart.
Profitability below peers but likely to be resilient
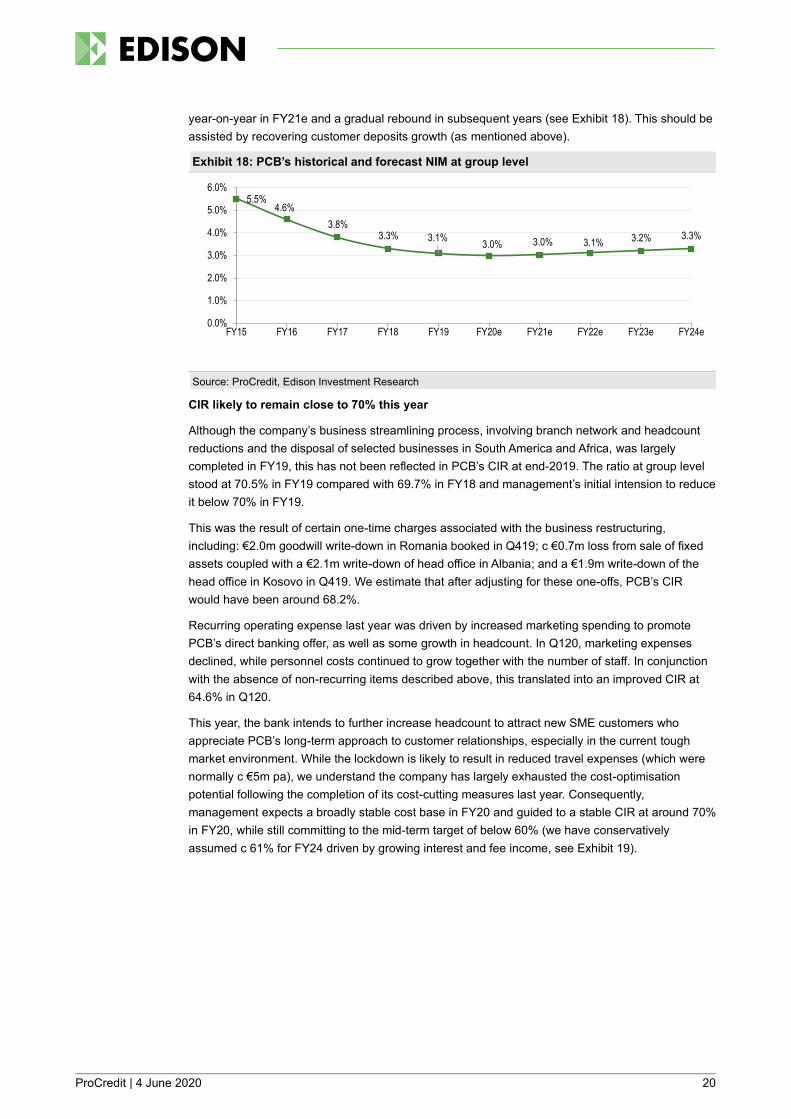
NIM compressing in recent years
PCB’s NIM has been under pressure in recent years, mostly due to its repositioning from higher-risk
(but also higher-margin) microloans to the segment for SME loans with a higher volume and to
some extent also because of the competitive environment amid low interest rates. As a result, its
NIM declined to 3.1% at end-March 2020 compared to 5.5% in FY15. As discussed above, this
reflects a higher margin in EE (4.5%) and Ecuador (5.2%) compared to SEE (2.5%).
Before the COVID-19 outbreak, management highlighted that these margin pressures had abated
and were not expected to continue. While management’s working assumption is still for stable
margins in FY20, the company also flagged a high level of uncertainty around margins in the near
term. We note that PCB may seek additional external funding to secure incremental liquidity and/or
raise the interest rate on customer deposits (thus increasing its cost of funding) due to reduced
cash inflow from its loan book (due to the credit moratoria) and potentially also deposits outflows (in
case these materialise). However, we note that the group’s LCR is 181%, which is visibly above the
regulatory requirement of 100%.
We also note potential pressures on margins resulting from central bank interest rate cuts. As a
result, we have pencilled in a slight NIM decline to 3.0% in FY20e, followed by a stable margin
0%
3%
6%
9%
12%
15%
18%
21%
FY18 FY19 FY20e FY21e FY22e FY23e FY24e
Tier-1 CAR Tier-1 requirement CAR requirement
ProCredit | 4 June 2020 20
year-on-year in FY21e and a gradual rebound in subsequent years (see Exhibit 18). This should be
assisted by recovering customer deposits growth (as mentioned above).
Exhibit 18: PCB’s historical and forecast NIM at group level
Source: ProCredit, Edison Investment Research
CIR likely to remain close to 70% this year
Although the company’s business streamlining process, involving branch network and headcount
reductions and the disposal of selected businesses in South America and Africa, was largely
completed in FY19, this has not been reflected in PCB’s CIR at end-2019. The ratio at group level
stood at 70.5% in FY19 compared with 69.7% in FY18 and management’s initial intension to reduce
it below 70% in FY19.
This was the result of certain one-time charges associated with the business restructuring,
including: €2.0m goodwill write-down in Romania booked in Q419; c €0.7m loss from sale of fixed
assets coupled with a €2.1m write-down of head office in Albania; and a €1.9m write-down of the
head office in Kosovo in Q419. We estimate that after adjusting for these one-offs, PCB’s CIR
would have been around 68.2%.
Recurring operating expense last year was driven by increased marketing spending to promote
PCB’s direct banking offer, as well as some growth in headcount. In Q120, marketing expenses
declined, while personnel costs continued to grow together with the number of staff. In conjunction
with the absence of non-recurring items described above, this translated into an improved CIR at
64.6% in Q120.
This year, the bank intends to further increase headcount to attract new SME customers who
appreciate PCB’s long-term approach to customer relationships, especially in the current tough
market environment. While the lockdown is likely to result in reduced travel expenses (which were
normally c €5m pa), we understand the company has largely exhausted the cost-optimisation
potential following the completion of its cost-cutting measures last year. Consequently,
management expects a broadly stable cost base in FY20 and guided to a stable CIR at around 70%
in FY20, while still committing to the mid-term target of below 60% (we have conservatively
assumed c 61% for FY24 driven by growing interest and fee income, see Exhibit 19).
5.5%4.6%
3.8%3.3% 3.1%
3.0% 3.0% 3.1% 3.2% 3.3%
0.0%
1.0%
2.0%
3.0%
4.0%
5.0%
6.0%
FY15 FY16 FY17 FY18 FY19 FY20e FY21e FY22e FY23e FY24e

ProCredit | 4 June 2020 21
Exhibit 19: PCB’s CIR at group level
Source: ProCredit, Edison Investment Research
Return on equity: Affected by cost of risk but should still be positive in FY20
PCB’s return on equity was somewhat below its local peers at c 7–8% over the last three years
compared to its Austrian peers (Raiffeisen Bank International and Erste Group) at c 10–13% and
local peers at c 15–25% (although this is in local currencies and is therefore subject to FX risk for
international investors). However, it is important to highlight PCB’s very stable returns, with the
company remaining profitable in each year since 2005 (even during the GFC in 2008/09 at c 4%,
see Exhibit 20) with an average ROE around 9%. In particular, the company’s ROE remained
ahead of the peer average over 2011–14, when the regional banking sectors faced high-risk
provisions and NPL ratios. Nevertheless, PCB’s ROE has lagged its peers during the expansionary
phase of regional economies (and throughout the whole cycle). However, we note that the last
seven years have been a period of business realignment (as outlined earlier).
Exhibit 20: PCB’s historical ROE vs peers
Source: Company accounts, Refinitiv. Note: Local peers include BRD, Banca Transilvania, TBC Bank, Bank of Georgia, OTP Bank, Bulgarian American Credit Bank, KomerčnI Bank and Moneta Bank. Austrian international peers include Erste Group and Raiffeisen Bank International.
Management’s intension is to improve PCB’s ROAE to c 10% in the medium term. This compares
with earlier targets of above 12% (communicated back in 2013) and 10–12% (shared in 2014). We
have examined the main factors behind PCB’s lower ROE by looking at its key performance
indicators versus Raiffeisen Bank International, Erste Group and OTP Bank (due to a somewhat
similar regional footprint) reported for FY19 (see Exhibit 21).
Based on the exhibit below, we conclude that that PCB’s profitability versus the three banking
groups may be lower due to 1) higher RWA as a percentage of total assets (78% vs c 50% for
Austrian peers and 69% for OTP Bank), which we understand may be due to a higher risk weight of
mortgages on commercial versus residential real estate, higher risk weight of corporate vs retail
68.9% 71.3% 73.6%69.7% 70.5% 68.7% 68.3% 66.1% 63.3% 61.0%
0%
10%
20%
30%
40%
50%
60%
70%
80%
FY15 FY16 FY17 FY18 FY19 FY20e FY21e FY22e FY23e FY24e
-15.0%-10.0%-5.0%0.0%5.0%
10.0%15.0%20.0%25.0%30.0%35.0%
2005 2006 2007 2008 2009 2010 2011 2012 2013 2014 2015 2016 2017 2018 2019
ProCredit Holding Austrian international peers Local peers

ProCredit | 4 June 2020 22
loans, as well as the lack of EBA equivalence acknowledgement for some of PCB’s countries of
operation (which means that most of PCB’s liquid assets have a 100% weighting, as opposed to
some of its peers), 2) a higher CIR at 70% vs c 60% for peers (although we note PCB’s Q120 ratio
was 64.6%) and 3) a higher customer loans to deposits ratio (although we note that PCB’s NIM is
higher).
Still, we forecast that PCB will be able to reach the 10% ROE target by growing its portfolio by c 9%
pa over multiple years and expanding its customer deposit base at a mid- to high-single digit rate
while keeping growth in operating costs at a limited level (following the efficiency measures
introduced in recent years).
Exhibit 21: KPI comparison – PCB vs closest international peers
FY19 ProCredit Raiffeisen Erste Group OTP Bank
Net interest margin 3.1% 2.4% 2.2% 4.1%
Net fee and commission income as % of total assets 0.8% 1.2% 0.8% 1.7%
Cost Income ratio 70% 57% 59% 58%
Effective tax rate 20% 23% 18% 11%
Customer loans as % of total assets 70%* 60% 65% 59%**
Cash (incl. with central banks) as % of total assets 16% 16% 4% 9%
Customer deposits as % of total liabilities 74% 70% 77% 85%
Equity to total assets 12% 9% 8% 11%
Customer loans to deposits 111% 95% 92% 78%
RWA to total assets 78% 51% 48% 69%
CET-1 ratio 14.1% 13.9% 13.7% 13.9%
ROE 6.9% 11.0% 10.0% 20.6%
Total assets (€m) 6,698 152,200 245,693 60,616
Source: Company accounts, Edison Investment Research calculations. Note: *68.2% when adjusted for one-off items; **52.7% on an adjusted basis.
For FY20e, management guides to an ROAE below FY19 (affected particularly by a higher cost of
risks as discussed earlier in the note), though still positive. We estimate it at 4.0% in FY20e
(broadly in line with the GFC level) and 5.2% in FY21e.
Dividend policy: Targeting a payout ratio of 33%
PCB’s general dividend policy is to pay out one-third of its profits to shareholders, which translated
into a board proposal to pay €0.30 per share from FY19 earnings. However, in response to the
COVID-19 outbreak, the European Central Bank and BaFin have released a recommendation to
banks to withhold any dividend payout and share buybacks at least until 1 October 2020.
Consequently, PCB’s management (after a discussion with the supervisory board) decided to
postpone the decision with respect to dividend payments until Q420. In our forecasts, we assume
that PCB will pay the above dividend in Q420.
Valuation
We have valued ProCredit using the implied price to tangible book value method based on our
assessment of the bank’s sustainable ROE and cost of equity derived from a capital asset pricing
model. This is a common valuation method for banks, which allowed us to reflect PCB’s specific
profitability as well as risk profile. To arrive at the book value of PCB’s tangible equity, we have
subtracted the balance sheet value of intangibles from our shareholders’ equity forecast.
Subsequently, we have calculated the RoTE using net profit after taxes.
We have assumed a sustainable RoTE of 10.0%. We believe the bank is well positioned to reach
its mid-term ROAE target at 10%, even if this may be achieved later than the management initially
planned due to the COVID-19 outbreak and the resulting recession. We forecast that PCB should
be able to reach this level in FY24e. Importantly, it should be able to do so based exclusively on the
current regulatory capital and prospective retained earnings, with our forecasted CET-1 and CAR in

ProCredit | 4 June 2020 23
FY24 at 14.2% and 15.5%, respectively. Although PCB’s capital ratios should by then still be ahead
of regulatory requirements (currently at 8.2% and 12.6%), we are conservatively not adjusting our
valuation for any remaining excess capital to retain a certain buffer in forecasts.
We have also factored in a cost of equity of 14.7%. For the purpose of estimating it, we have used
country-level market risk premiums as calculated by Aswath Damoradan (professor of finance at
the Stern School of Business at New York University) based on default spreads estimated from
Moody’s local currency sovereign ratings or sovereign credit default swaps. We have then weighted
these market risk premiums according to PCB’s gross loan book split by country at end-2019.
Given the euro area yield curve is negative for maturities up to 28 years, we have assumed a 1%
risk free rate, which is close to the average 10-year German bond yield over the last 10 years.
We have applied a beta of 1.0x, given the banking sector’s performance tends to mirror conditions
in the broader economy. We believe this is a conservative assumption given the risk profile of
PCB’s loan book (as illustrated by the net write-offs and share of defaulted loans) is below local
banking sectors (as discussed above) and the fact that PCB operates under German regulations
and supervision. We have also used a long-term growth rate of 2.0% in the P/BV-ROE valuation.
Based on these assumptions, we have arrived at a fair value per PCB share of €7.50 (see Exhibit
22), which represents c 20% upside potential to the current share price.
Exhibit 22: PCB’s P/BV-ROE valuation
€’000s unless otherwise stated FY19 FY20e FY21e FY22e FY23e FY24e
Shareholder’s equity 792,552 784,678 816,000 866,390 928,892 1,001,805
Intangibles 20,345 20,775 20,775 20,775 20,775 20,775
Tangible equity 772,207 763,903 795,225 845,615 908,117 981,030
Net attributable profit 61,522 31,652 41,339 64,169 83,891 100,877
RoTE 8.3% 4.1% 5.3% 7.8% 9.6% 10.7%
Tangible equity per share (€) 13.1 13.0 13.5 14.4 15.4 16.7
Tangible equity per share (FY20e, €) 13.0
Sustainable RoTE 10.0%
Growth rate 2.0%
Cost of equity 14.7%
Fair value multiple 0.6x
Fair value per share (end-2020, €) 8.15
discount factor 0.92
Fair value per share (€) 7.50
Current share price (€) 6.30
upside / downside 20%
Source: ProCredit, Edison Investment Research
Below we show a valuation sensitivity analysis based on cost of equity and sustainable RoTE. We
note that when we assume an RoTE in line with PCB’s five-year historical average of 8% (rather
than the mid-term target of 10% assumed above) we arrive at a value at €5.63 per share (see
Exhibit 23).
Exhibit 23: PCB’s valuation sensitivity analysis (€/share)
Sustainable RoTE
7.0% 8.0% 9.0% 10.0% 11.0% 12.0% 13.0%
Co
st o
f eq
uit
y
13.2% 5.32 6.39 7.45 8.51 9.58 10.64 11.71
13.7% 5.10 6.11 7.13 8.15 9.17 10.19 11.21
14.2% 4.89 5.86 6.84 7.82 8.80 9.77 10.75
14.7% 4.69 5.63 6.57 7.50 8.45 9.39 10.33
15.2% 4.52 5.42 6.32 7.23 8.13 9.04 9.94
15.7% 4.35 5.22 6.09 6.96 7.84 8.71 9.58
16.2% 4.20 5.04 5.88 6.72 7.56 8.40 9.24
Source: Edison Investment Research
In Exhibits 24 and 25, we present how PCB fares versus its local peers on a P/BV-ROE scatter plot
based on FY19 actuals as well as FY20e estimates (Edison forecasts for PCB and Refinitiv
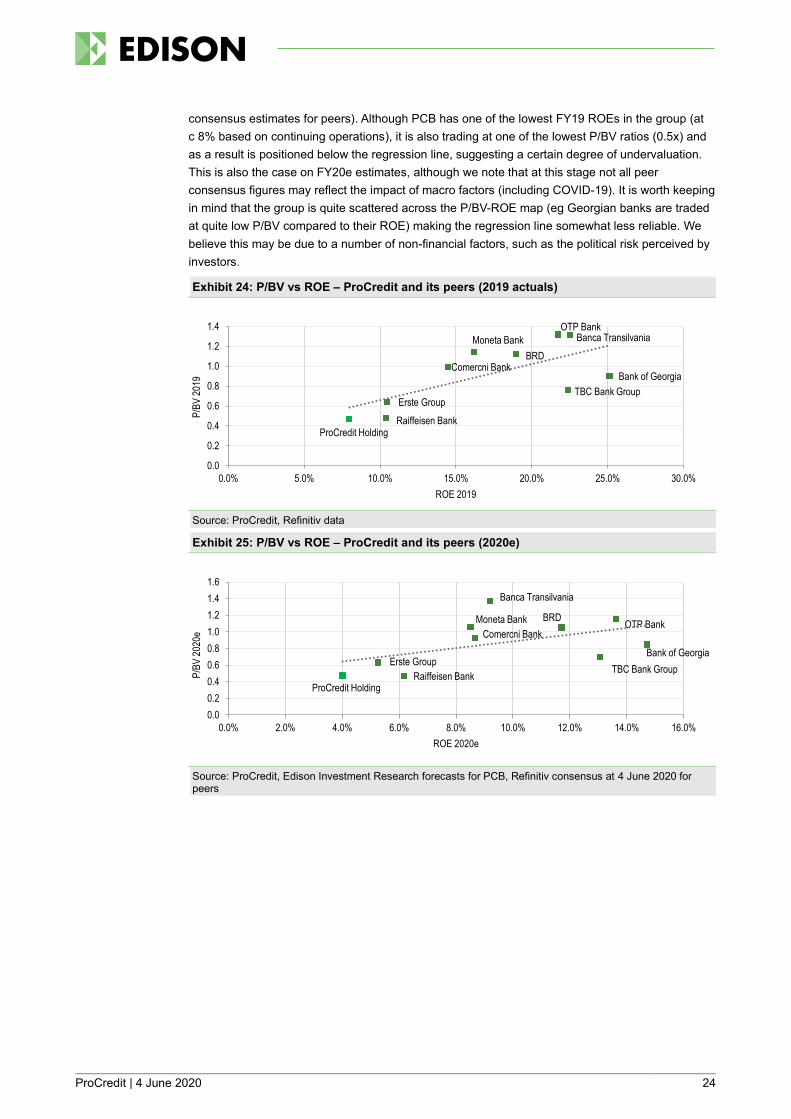
ProCredit | 4 June 2020 24
consensus estimates for peers). Although PCB has one of the lowest FY19 ROEs in the group (at
c 8% based on continuing operations), it is also trading at one of the lowest P/BV ratios (0.5x) and
as a result is positioned below the regression line, suggesting a certain degree of undervaluation.
This is also the case on FY20e estimates, although we note that at this stage not all peer
consensus figures may reflect the impact of macro factors (including COVID-19). It is worth keeping
in mind that the group is quite scattered across the P/BV-ROE map (eg Georgian banks are traded
at quite low P/BV compared to their ROE) making the regression line somewhat less reliable. We
believe this may be due to a number of non-financial factors, such as the political risk perceived by
investors.
Exhibit 24: P/BV vs ROE – ProCredit and its peers (2019 actuals)
Source: ProCredit, Refinitiv data
Exhibit 25: P/BV vs ROE – ProCredit and its peers (2020e)
Source: ProCredit, Edison Investment Research forecasts for PCB, Refinitiv consensus at 4 June 2020 for peers
ProCredit Holding
BRD
Banca Transilvania
TBC Bank Group
Bank of Georgia
OTP Bank
Erste Group
Raiffeisen Bank
Comercni Bank
Moneta Bank
0.0
0.2
0.4
0.6
0.8
1.0
1.2
1.4
0.0% 5.0% 10.0% 15.0% 20.0% 25.0% 30.0%
P/B
V 2
019
ROE 2019
ProCredit Holding
BRD
Banca Transilvania
TBC Bank Group
Bank of Georgia
OTP Bank
Erste Group
Raiffeisen Bank
Comercni Bank
Moneta Bank
0.0
0.2
0.4
0.6
0.8
1.0
1.2
1.4
1.6
0.0% 2.0% 4.0% 6.0% 8.0% 10.0% 12.0% 14.0% 16.0%
P/B
V 2
020e
ROE 2020e
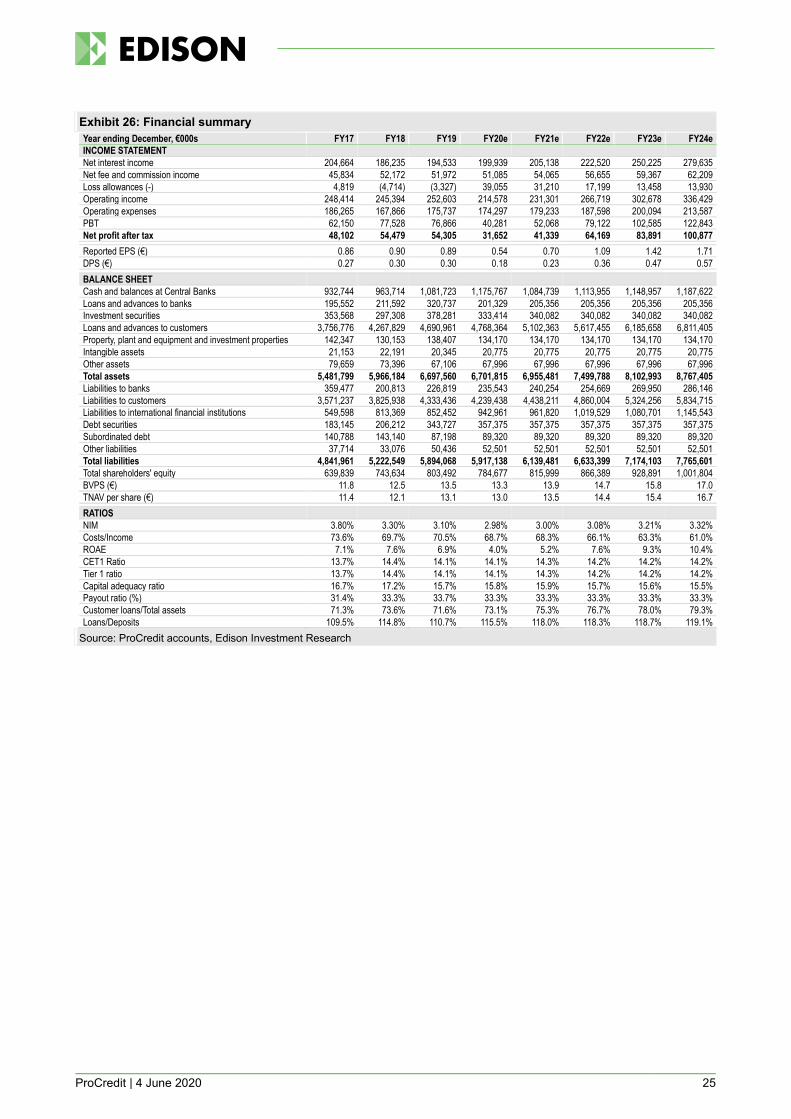
ProCredit | 4 June 2020 25
Exhibit 26: Financial summary
Year ending December, €000s FY17 FY18 FY19 FY20e FY21e FY22e FY23e FY24e
INCOME STATEMENT
Net interest income 204,664 186,235 194,533 199,939 205,138 222,520 250,225 279,635
Net fee and commission income 45,834 52,172 51,972 51,085 54,065 56,655 59,367 62,209
Loss allowances (-) 4,819 (4,714) (3,327) 39,055 31,210 17,199 13,458 13,930
Operating income 248,414 245,394 252,603 214,578 231,301 266,719 302,678 336,429
Operating expenses 186,265 167,866 175,737 174,297 179,233 187,598 200,094 213,587
PBT 62,150 77,528 76,866 40,281 52,068 79,122 102,585 122,843
Net profit after tax 48,102 54,479 54,305 31,652 41,339 64,169 83,891 100,877
Reported EPS (€) 0.86 0.90 0.89 0.54 0.70 1.09 1.42 1.71
DPS (€) 0.27 0.30 0.30 0.18 0.23 0.36 0.47 0.57
BALANCE SHEET
Cash and balances at Central Banks 932,744 963,714 1,081,723 1,175,767 1,084,739 1,113,955 1,148,957 1,187,622
Loans and advances to banks 195,552 211,592 320,737 201,329 205,356 205,356 205,356 205,356
Investment securities 353,568 297,308 378,281 333,414 340,082 340,082 340,082 340,082
Loans and advances to customers 3,756,776 4,267,829 4,690,961 4,768,364 5,102,363 5,617,455 6,185,658 6,811,405
Property, plant and equipment and investment properties 142,347 130,153 138,407 134,170 134,170 134,170 134,170 134,170
Intangible assets 21,153 22,191 20,345 20,775 20,775 20,775 20,775 20,775
Other assets 79,659 73,396 67,106 67,996 67,996 67,996 67,996 67,996
Total assets 5,481,799 5,966,184 6,697,560 6,701,815 6,955,481 7,499,788 8,102,993 8,767,405
Liabilities to banks 359,477 200,813 226,819 235,543 240,254 254,669 269,950 286,146
Liabilities to customers 3,571,237 3,825,938 4,333,436 4,239,438 4,438,211 4,860,004 5,324,256 5,834,715
Liabilities to international financial institutions 549,598 813,369 852,452 942,961 961,820 1,019,529 1,080,701 1,145,543
Debt securities 183,145 206,212 343,727 357,375 357,375 357,375 357,375 357,375
Subordinated debt 140,788 143,140 87,198 89,320 89,320 89,320 89,320 89,320
Other liabilities 37,714 33,076 50,436 52,501 52,501 52,501 52,501 52,501
Total liabilities 4,841,961 5,222,549 5,894,068 5,917,138 6,139,481 6,633,399 7,174,103 7,765,601
Total shareholders' equity 639,839 743,634 803,492 784,677 815,999 866,389 928,891 1,001,804
BVPS (€) 11.8 12.5 13.5 13.3 13.9 14.7 15.8 17.0
TNAV per share (€) 11.4 12.1 13.1 13.0 13.5 14.4 15.4 16.7
RATIOS
NIM 3.80% 3.30% 3.10% 2.98% 3.00% 3.08% 3.21% 3.32%
Costs/Income 73.6% 69.7% 70.5% 68.7% 68.3% 66.1% 63.3% 61.0%
ROAE 7.1% 7.6% 6.9% 4.0% 5.2% 7.6% 9.3% 10.4%
CET1 Ratio 13.7% 14.4% 14.1% 14.1% 14.3% 14.2% 14.2% 14.2%
Tier 1 ratio 13.7% 14.4% 14.1% 14.1% 14.3% 14.2% 14.2% 14.2%
Capital adequacy ratio 16.7% 17.2% 15.7% 15.8% 15.9% 15.7% 15.6% 15.5%
Payout ratio (%) 31.4% 33.3% 33.7% 33.3% 33.3% 33.3% 33.3% 33.3%
Customer loans/Total assets 71.3% 73.6% 71.6% 73.1% 75.3% 76.7% 78.0% 79.3%
Loans/Deposits 109.5% 114.8% 110.7% 115.5% 118.0% 118.3% 118.7% 119.1%
Source: ProCredit accounts, Edison Investment Research

ProCredit | 4 June 2020 26
Contact details Gross loan book by geography
Rohmerplatz 33-37 60486 Frankfurt Germany +49 69 951 437 0 www.procredit-holding.com
Management team
Board member: Dr Gabriel Schor Board member: Sandrine Massiani
Gabriel has been part of the company since the beginning. He worked for the consulting company IPC since 1983 (IPC was consulting company founded in 1980; now Zeitinger Invest, a major PCB’s shareholder). He was appointed a member of PCB’s management board in 2004 and has been responsible for reporting and controlling, supervisory reporting and capital planning, accounting and taxes, group treasury and group funding. In September 2019, he also took over investor relations, group communications, administration and translation. He is the personally liable managing partner of ProCredit AG & Co KGaA.
Sandrine joined PCB in 2007 and initially worked as regional coordinator in Africa. She became a coordinator of the group human resources in 2011 and a manager of human resources and IT in 2015. She was appointed to the management board in 2017 and has overseen human resources, internal audit, risk management, IT, business support and compliance. Since September 2019, she has also been responsible for credit risk, group environmental management, legal, group anti-money laundering and fraud prevention. Before Sandrine Massiani joined PCB, she worked at BNP Paribas and Development Finance International (an international advisory firm focused on emerging markets) and was a project coordinator and short-term expert at IPC.
Principal shareholders (%)
Zeitinger Invest 17.0
KfW 13.2
DOEN Paticipaties 12.5
International Finance Corporation 10.0
TIAA 8.6
ProCredit Staff Invest Beteiligungs 3.0
Free float 35.7
Companies named in this report
BNP Paribas, BRD, Banca Transilvania, Bulgarian American Credit Bank, TBC Bank, Bank of Georgia, Ferratum, Kapilendo, Creditshelf, Funding Circle, Erste Group, Moneta Bank, OTP Bank.
71% 22% 6% 1%%
South Eastern Europe Eastern Europe Ecuador Germany

ProCredit | 4 June 2020 27
General disclaimer and copyright
This report has been commissioned by ProCredit and prepared and issued by Edison, in consideration of a fee payable by ProCredit. Edison Investment Research standard fees are £49,500 pa for the production and
broad dissemination of a detailed note (Outlook) following by regular (typically quarterly) update notes. Fees are paid upfront in cash without recourse. Edison may seek additional fees for the provision of roadshows and
related IR services for the client but does not get remunerated for any investment banking services. We never take payment in stock, options or warrants for any of our services.
Accuracy of content: All information used in the publication of this report has been compiled from publicly available sources that are believed to be reliable, however we do not guarantee the accuracy or completeness of
this report and have not sought for this information to be independently verified. Opinions contained in this report represent those of the research department of Edison at the time of publication. Forward-looking information
or statements in this report contain information that is based on assumptions, forecasts of future results, estimates of amounts not yet determinable, and therefore involve known and unknown risks, uncertainties and other
factors which may cause the actual results, performance or achievements of their subject matter to be materially different from current expectations.
Exclusion of Liability: To the fullest extent allowed by law, Edison shall not be liable for any direct, indirect or consequential losses, loss of profits, damages, costs or expenses incurred or suffered by you arising out or in
connection with the access to, use of or reliance on any information contained on this note.
No personalised advice: The information that we provide should not be construed in any manner whatsoever as, personalised advice. Also, the information provided by us should not be construed by any subscriber or
prospective subscriber as Edison’s solicitation to effect, or attempt to effect, any transaction in a security. The securities described in the report may not be eligible for sale in all jurisdictions or to certain categories of
investors.
Investment in securities mentioned: Edison has a restrictive policy relating to personal dealing and conflicts of interest. Edison Group does not conduct any investment business and, accordingly, does not itself hold any
positions in the securities mentioned in this report. However, the respective directors, officers, employees and contractors of Edison may have a position in any or related securities mentioned in this report, subject to
Edison's policies on personal dealing and conflicts of interest.
Copyright: Copyright 2020 Edison Investment Research Limited (Edison).
Australia
Edison Investment Research Pty Ltd (Edison AU) is the Australian subsidiary of Edison. Edison AU is a Corporate Authorised Representative (1252501) of Crown Wealth Group Pty Ltd who holds an Australian Financial
Services Licence (Number: 494274). This research is issued in Australia by Edison AU and any access to it, is intended only for "wholesale clients" within the meaning of the Corporations Act 2001 of Australia. Any advice
given by Edison AU is general advice only and does not take into account your personal circumstances, needs or objectives. You should, before acting on this advice, consider the appropriateness of the advice, having
regard to your objectives, financial situation and needs. If our advice relates to the acquisition, or possible acquisition, of a particular financial product you should read any relevant Product Disclosure Statement or like
instrument.
New Zealand
The research in this document is intended for New Zealand resident professional financial advisers or brokers (for use in their roles as financial advisers or brokers) and habitual investors who are “wholesale clients” for the
purpose of the Financial Advisers Act 2008 (FAA) (as described in sections 5(c) (1)(a), (b) and (c) of the FAA). This is not a solicitation or inducement to buy, sell, subscribe, or underwrite any securities mentioned or in the
topic of this document. For the purpose of the FAA, the content of this report is of a general nature, is intended as a source of general information only and is not intended to constitute a recommendation or opinion in
relation to acquiring or disposing (including refraining from acquiring or disposing) of securities. The distribution of this document is not a “personalised service” and, to the extent that it contains any financial advice, is
intended only as a “class service” provided by Edison within the meaning of the FAA (i.e. without taking into account the par ticular financial situation or goals of any person). As such, it should not be relied upon in making
an investment decision.
United Kingdom
This document is prepared and provided by Edison for information purposes only and should not be construed as an offer or sol icitation for investment in any securities mentioned or in the topic of this document. A
marketing communication under FCA Rules, this document has not been prepared in accordance with the legal requirements designed to promote the independence of investment research and is not subject to any
prohibition on dealing ahead of the dissemination of investment research.
This Communication is being distributed in the United Kingdom and is directed only at (i) persons having professional experience in matters relating to investments, i.e. investment professionals within the meaning of Article
19(5) of the Financial Services and Markets Act 2000 (Financial Promotion) Order 2005, as amended (the "FPO") (ii) high net-worth companies, unincorporated associations or other bodies within the meaning of Article 49
of the FPO and (iii) persons to whom it is otherwise lawful to distribute it. The investment or investment activity to which this document relates is available only to such persons. It is not intended that this document be
distributed or passed on, directly or indirectly, to any other class of persons and in any event and under no circumstances should persons of any other description rely on or act upon the contents of this document.
This Communication is being supplied to you solely for your information and may not be reproduced by, further distributed to or published in whole or in part by, any other person.
United States
Edison relies upon the "publishers' exclusion" from the definition of investment adviser under Section 202(a)(11) of the Investment Advisers Act of 1940 and corresponding state securities laws. This report is a bona fide
publication of general and regular circulation offering impersonal investment-related advice, not tailored to a specific investment portfolio or the needs of current and/or prospective subscribers. As such, Edison does not
offer or provide personal advice and the research provided is for informational purposes only. No mention of a particular security in this report constitutes a recommendation to buy, sell or hold that or any security, or that
any particular security, portfolio of securities, transaction or investment strategy is suitable for any specific person. Frankfurt +49 (0)69 78 8076 960
Schumannstrasse 34b
60325 Frankfurt
Germany
London +44 (0)20 3077 5700
280 High Holborn
London, WC1V 7EE
United Kingdom
New York +1 646 653 7026
1,185 Avenue of the Americas
3rd Floor, New York, NY 10036
United States of America
Sydney +61 (0)2 8249 8342
Level 4, Office 1205
95 Pitt Street, Sydney
NSW 2000, Australia