process simulation of ethanol production from oil palm trunk
TRANSCRIPT
*Corresponding author
Email address: [email protected]
Songklanakarin J. Sci. Technol.
43 (4), 927-935, Jul. - Aug. 2021
Original Article
Process simulation of ethanol production from oil palm trunk
Opor Laosiriwut1, Penjit Srinophakun1, Pramuk Parakulsuksatid2,
and Thongchai Rohitatisha Srinophakun1
1 Department of Chemical Engineering, Faculty of Engineering,
Kasetsart University, Chatuchak, Bangkok, 10900 Thailand
2 Department of Biotechnology, Faculty of Agro-Industry,
Kasetsart University, Chatuchak, Bangkok, 10900 Thailand
Received: 18 February 2020; Revised: 1 June 2020; Accepted: 26 June 2020
Abstract
Oil palm trunk (OPT) is lignocellulosic biomass and renewable waste obtained from palm oil production, and it can be
used to produce ethanol. In this study, the ethanol plant was analyzed using Aspen Plus software for process simulation and
modeling, based on of 60,000 kg of OPT, while the model inputs were based on data recently obtained in the laboratory. Various
pretreatments of OPT are used such as steam explosion, hot water, alkaline hydrogen peroxide, and simultaneous saccharification
and fermentation (SSF). All these pretreatments are used to increase the cellulose content and efficiency of getting fermentable
sugars from cellulose for conversion to ethanol. The cellulose content was 73.96% by dry wt after treatment, from 38.67% in the
original OPT. For the SSF step in a laboratory, treated OPT was used to ferment ethanol for about 60 h, producing an ethanol
yield of 0.469 g EtOH g-1 cellulose. This information was used to simulate the SSF unit. Ethanol was purified by extractive
distillation using ethylene glycol as a solvent. The simulation of the distillation column comprised 15 stages, the distillate for
feeding had mass ratio 0.65, and the reflux mass ratio was 1.4, potentially producing 9,531 kg of ethanol.
Keywords: oil palm trunk, steam explosion, extractive distillation, Aspen Plus, ethanol simulation
1. Introduction
Bioethanol is a form of renewable clean energy for
solving global environmental problems (Bungay, 2004;
Gavrilescu & Chisti, 2005; Hamelinck, Hooijdonk, & Faaij,
2005). It can be produced by fermentation using micro
organisms. Saccharomyces cerevisiae (S. cerevisiae) is a
commonly used microorganism in fermentation. Although
bioethanol can be produced using sugar from starch and
sugar-based feedstock (e.g., cassava and sugarcane) (Balat,
Balat, & Öz, 2008) such processes are of limited benefit
because these feedstocks are sources of human food.
Lignocellulosic materials are interesting feedstocks because of
their low cost and them not have food applications, like rice
straw (Yoswathana, Phuriphipat, Treyawutthiwat, &
Eshtiaghi, 2010), sugarcane bagasse (Wong, & Sanggari,
2014), oil palm residue, or corn stover (Banerjee et al., 2012).
Palm residue is agro-industrial waste from the palm
oil industry. Such waste is a renewable resource for the
production of bioethanol. In the global market, Thailand is
among the top three producers of palm oil. Most of Thailand’s
palm oil is produced in the southern peninsular part of the
country. The palm oil extraction generates a lot of waste in the
forms of fiber, fruit bunch shells, oil palm trunk (OPT), and an
empty fruit bunches. OPT is an interesting waste composed
mainly of cellulose, hemicellulose, and lignin (Akmar, &
Kennedy, 2001). Cellulose is the main component for
conversion to sugar by hydrolysis in a bioethanol process.
Bioethanol production from lignocellulosic
materials comprises four sections: pretreatment, hydrolysis of
recovered cellulose into sugars, fermentation of sugars to
ethanol, and purification of ethanol (Limayem & Ricke,
2012). First, OPT can be pretreated by steam explosion (SE),
hot water treatment (Lu et al., 2013), or treatment with

928 O. Laosiriwut et al. / Songklanakarin J. Sci. Technol. 43 (4), 927-935, 2021
alkaline hydrogen peroxide (AHP). SE is a technique for
increasing the potential of cellulose using high-pressure
saturated steam (160–260 °C for pressure range 0.69–4.83
MPa). As the pressure is swiftly reduced there is explosive
decompression of materials (Khunrong, Punsuvon,
Vaithanomsat, & Pomchaitaward, 2010). Recently, Songprom
(2011) studied the composition of OPT from SE pretreatment
at alternative temperatures (200 and 210 °C) for some time
periods (2, 4, and 6 mins). The experimental data revealed that
the optimum conditions at 210 °C for 4 mins produced
58.83% of cellulose, 4.03% of pentosan, and 27.12% of
lignin. After that, the treated OPT was used for fermentation,
producing an ethanol concentration of 16.42 g/l. Hot water
treatment can effectively remove monosaccharides,
oligosaccharides, toxic substances, and acids. The optimum is
at 80 °C and 30 mins. Hot water pretreatment is introduced
because of it solubilizing hemicellulose. At the same time, the
use of AHP to produce a hydrogen peroxide decomposition
reaction can reduce the solid lignin content. Cao, Sun, Liu,
Yin, and Wu (2012) studied ethanol production using sweet
sorghum bagasse and compared five pretreatments: (1) diluted
NaOH solution; (2) a high concentration NaOH solution; (3)
diluted NaOH solution and H2O2; (4) alkaline peroxide; and
(5) autoclaving. The experimental data revealed that the
diluted NaOH solution and H2O2 pretreatment was the most
suitable for sweet sorghum bagasse pretreatment.
Aspen Tech is a process simulation software
package used in chemical engineering. Aspen Plus is the main
application used to simulate the overall ethanol plant,
consisting of pretreatment, hydrolysis, fermentation, and
purification. The Aspen Custom Modeler (ACM) can be used
to create a unit operation that does not already exist in Aspen
Plus. The new units are then exported to Aspen Plus for
assembly with others. Recently, Chuenbubpar, Srinophakhun,
and Tohsakul (2018) studied the plant-wide process
simulation of ethanol production using EFB pretreatment with
hot compressed water (HCW) to create a mathematical model
from the experimental data. The ACM was used to develop an
HCW-unit for export into Aspen Plus. Both hydrolysis and
fermentation can be represented by these standard reaction
operations in Aspen Plus. From purification the industry
provides ethanol concentrations exceeding 99%. Extractive
distillation is the dehydration of ethanol using ethylene glycol
as a solvent to break up the azeotrope mixture in the
distillation column (Lee & Pahl, 1985). Also, a molecular
sieve using the adsorption phenomenon can catch water
molecules, while it cannot catch ethanol molecules (Onuki,
2006). Kaewklam (2018) studied ethanol production using
EFB. This article compared two pretreatments: HCW and SE
using Aspen as well as purification, extractive distillation, and
molecular sieves. Four models were studied: 1) hot
compressed water (HCW) with extractive distillation; 2) hot
compressed water (HCW) with molecular sieves distillation;
3) steam explosion with extractive distillation; and 4) steam
explosion with molecular sieve distillation. The results
suggest that EFB-treated with SE and purified by extractive
distillation can produce the most ethanol.
This paper studies the potential for producing
ethanol by simulations using Aspen Plus and creates models
of the various operating units using the Aspen Custom
Modeler (ACM). Information from the Faculty of Agro-
Industry, Kasetsart University was used to create a simulation
model, including three alternative pretreatment methods (SE,
hot water, and AHP) and simultaneous saccharification and
fermentation (SSF). Extractive distillation was the purification
step used by the sensitivity analysis tool in Aspen Plus to find
the optimal operating point for producing ethanol.
2. Materials and Methods
2.1 Feedstock, microorganism, and culture mediums
The oil palm trunk (OPT) was supplied by local
farmers in the Plai Phraya District of Krabi. Commercial
enzymes Cellic® Ctec2 were purchased from Novozymes.
Enzyme activity was analyzed as 178.5 filter paper units
(FPU) following the protocols of NERL. Standard sugars
(glucose, xylose, arabinose, and cellobiose) for the calibration
of high-performance liquid chromatography (HPLC) were
purchased from Sigma-Aldrich, while standard ethanol was
purchased from DaeJung Chemicals & Metals. The Liquor
Distillery Organization provided the yeast, namely S.
cerevisiae Sc90. Two-loops of cells from a YPD-agar plate
were inoculated into the liquid YPD medium (glucose 20 g L-
1, yeast extract 10 g L-1, and peptone 20 g L-1) in a flask,
during the preparation stage. The inoculated flasks were
incubated at 30 ˚C on a rotary shaker (150 rpm) for 18 hours.
The culture was then transferred to the fermentation medium.
2.2 Experimental description
Overall the ethanol production in the laboratory
comprised three pretreatment methods of OPT and subsequent
SSF (hydrolysis and fermentation). The OPT was sun-dried
and chopped by a wood chipper into pieces measuring
20×20×5 mm3. Prior to use, mashed OPT samples were dried
in an oven at 105 °C for 24 hours. The samples were divided
into two sections, the first of which was used to find the dry
weight. Then 150 g of OPT was added to a 2.5 L SE reactor to
study the effects of two variables: temperature (200–220 °C)
and time (3–5 mins) at a pressure of 19 kgf/cm2. The valve
was opened to achieve a rapid pressure drop. In the next
method, hot water pretreatment was used to remove the
hemicellulose in the solids using a liquid ratio of 1:8 and
operating at 80 ºC for 30 mins. In the last method, the AHP
pretreatment was used with fixed ratio between the pretreated
OPT and H2O2 solution, namely 1:10 (g dry wt: mL). Three
variables were studied: the concentration of H2O2 (1, 3, and 5
% w/w), temperature (50, 70, and 90 °C), and time (30, 60,
and 90 mins). Following pretreatment, the composition of raw
material and residual solids was measured.
Treated OPT solids were subjected to SSF in a 500
mL Erlenmeyer flask containing 300 mL, with 10% (w/v) of
treated OPT and YP medium (10 g L-1 yeast extract and 20 g
L-1 peptone). The medium was adjusted to pH 4.8 using a 50
mM sodium citrate buffer, followed by sterilization at 121 ˚C
for 15 mins. A 10% starter culture was then simultaneously
added to the Erlenmeyer flask with 10 FPU g-1 of the enzyme
Cellic Ctec 2 . The SSF process was conducted at 40 ˚C for 72
hours at 150 rpm on a rotary shaker.

O. Laosiriwut et al. / Songklanakarin J. Sci. Technol. 43 (4), 927-935, 2021 929
2.3 Process simulation
2.3.1 Physical property method
The entire ethanol production process was simulated
using Aspen Plus V8.8. The physical property method consists
of a set of equations to predict the properties of the chemical
system during the process. The simulation used NRTL and
Henry’s law for the thermodynamic model since the ethanol-
water system is not ideal, having azeotropic behavior.
Sensitivity analysis was used to examine the effects of the
main operational variables, including the reflux ratio (RR) and
distillate to feed ratio (D/F) during the ethanol recovery
process. The pretreatment, SSF, and downstream recovery
operations were simulated.
2.3.2 Process description
The complete flowsheet for ethanol production from
the OPT is shown in Figure 1. This flowsheet was used in
simulations containing data obtained from laboratory
experiments. An OPT processing batch of 60,000 kg was used
in the simulations.
Firstly, OPT biomass (stream-OPT) with an initial
composition of 38.67% cellulose, 11.60% hemicellulose,
30.22% lignin, and 1.62% ash was fed into a multiple roll
crusher (CRUSHER) in which the particle size could be
reduced to a range of 1–10 mm before pretreatment. The
pretreatment unit consisted of three steps and was created in
the ACM. The first step (SE-PRET) of pretreatment involved
SE. Next, the SE-treated OPT solids (stream-REC-SE) passed
through a hot water unit (HOT-PRET), where they made
contact with the hot feed water in the stream-HOT-H2O.
Finally, the hot-treated OPT solids were subjected to the AHP
unit (AHP-PRET), making contact with the fed hydrogen
peroxide solution in the stream-H2O2-SOL. Following
completion of pretreatment, the treated OPT solids (stream-
RECV-AHP) passed through the batch SSF unit (SSF) to
convert cellulose into glucose and ferment the glucose into
ethanol in a single step.
The waste products (hemicellulose, lignin, ash, and
others) were vented out of the process (stream-SOLIDWAS).
The main product (stream-IN-P05); the aqueous broth
containing ethanol was sent to the first distillation column
(BEER-CO) prior to further processing in the extractive
distillation column (PRODU-CO). This extractive distillation
column employed a solvent (stream-solvent) to split the
ethanol-water azeotrope, namely ethylene glycol. Ethanol was
recovered as the top product of the column (stream-EtOH),
while water and solvent were recovered as the bottom product
(stream-IN-P08). The final column (SEP-SOL) represents the
solvent recovered for recycling.
3. Results and Discussion
3.1 Steam explosion pretreatment
The chemical compositions of SE treated and
untreated OPT are shown in Table 1. According to the results,
the untreated OPT consists of 38.67% cellulose, 11.60%
hemicellulose, and 30.22% lignin, while the treated OPT
using SE at 200–220 ºC for 3–5 mins had a significant
increase in cellulose content. The optimal temperature and
time were 210 °C and 4 mins. This condition provided the
Figure 1. Ethanol process flowsheet in Aspen Plus
930 O. Laosiriwut et al. / Songklanakarin J. Sci. Technol. 43 (4), 927-935, 2021
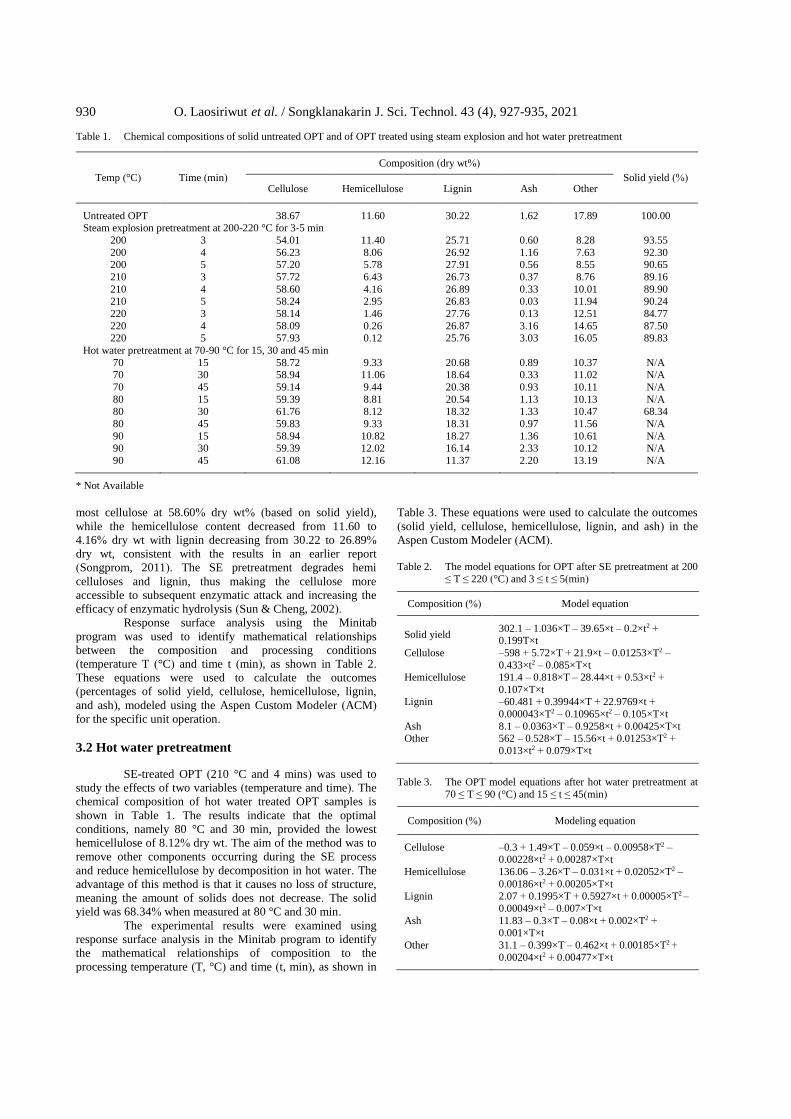
Table 1. Chemical compositions of solid untreated OPT and of OPT treated using steam explosion and hot water pretreatment
Temp (°C) Time (min)
Composition (dry wt%)
Solid yield (%) Cellulose Hemicellulose Lignin Ash Other
Untreated OPT 38.67 11.60 30.22 1.62 17.89 100.00 Steam explosion pretreatment at 200-220 °C for 3-5 min
200 3 54.01 11.40 25.71 0.60 8.28 93.55
200 4 56.23 8.06 26.92 1.16 7.63 92.30 200 5 57.20 5.78 27.91 0.56 8.55 90.65
210 3 57.72 6.43 26.73 0.37 8.76 89.16
210 4 58.60 4.16 26.89 0.33 10.01 89.90 210 5 58.24 2.95 26.83 0.03 11.94 90.24
220 3 58.14 1.46 27.76 0.13 12.51 84.77
220 4 58.09 0.26 26.87 3.16 14.65 87.50 220 5 57.93 0.12 25.76 3.03 16.05 89.83
Hot water pretreatment at 70-90 °C for 15, 30 and 45 min
70 15 58.72 9.33 20.68 0.89 10.37 N/A 70 30 58.94 11.06 18.64 0.33 11.02 N/A
70 45 59.14 9.44 20.38 0.93 10.11 N/A
80 15 59.39 8.81 20.54 1.13 10.13 N/A 80 30 61.76 8.12 18.32 1.33 10.47 68.34
80 45 59.83 9.33 18.31 0.97 11.56 N/A
90 15 58.94 10.82 18.27 1.36 10.61 N/A 90 30 59.39 12.02 16.14 2.33 10.12 N/A
90 45 61.08 12.16 11.37 2.20 13.19 N/A
* Not Available
most cellulose at 58.60% dry wt% (based on solid yield),
while the hemicellulose content decreased from 11.60 to
4.16% dry wt with lignin decreasing from 30.22 to 26.89%
dry wt, consistent with the results in an earlier report
(Songprom, 2011). The SE pretreatment degrades hemi
celluloses and lignin, thus making the cellulose more
accessible to subsequent enzymatic attack and increasing the
efficacy of enzymatic hydrolysis (Sun & Cheng, 2002).
Response surface analysis using the Minitab
program was used to identify mathematical relationships
between the composition and processing conditions
(temperature T (°C) and time t (min), as shown in Table 2.
These equations were used to calculate the outcomes
(percentages of solid yield, cellulose, hemicellulose, lignin,
and ash), modeled using the Aspen Custom Modeler (ACM)
for the specific unit operation.
3.2 Hot water pretreatment
SE-treated OPT (210 °C and 4 mins) was used to
study the effects of two variables (temperature and time). The
chemical composition of hot water treated OPT samples is
shown in Table 1. The results indicate that the optimal
conditions, namely 80 °C and 30 min, provided the lowest
hemicellulose of 8.12% dry wt. The aim of the method was to
remove other components occurring during the SE process
and reduce hemicellulose by decomposition in hot water. The
advantage of this method is that it causes no loss of structure,
meaning the amount of solids does not decrease. The solid
yield was 68.34% when measured at 80 °C and 30 min.
The experimental results were examined using
response surface analysis in the Minitab program to identify
the mathematical relationships of composition to the
processing temperature (T, °C) and time (t, min), as shown in
Table 3. These equations were used to calculate the outcomes
(solid yield, cellulose, hemicellulose, lignin, and ash) in the
Aspen Custom Modeler (ACM).
Table 2. The model equations for OPT after SE pretreatment at 200
≤ T ≤ 220 (°C) and 3 ≤ t ≤ 5(min)
Composition (%) Model equation
Solid yield 302.1 – 1.036×T – 39.65×t – 0.2×t2 + 0.199T×t
Cellulose –598 + 5.72×T + 21.9×t – 0.01253×T2 –
0.433×t2 – 0.085×T×t Hemicellulose 191.4 – 0.818×T – 28.44×t + 0.53×t2 +
0.107×T×t Lignin –60.481 + 0.39944×T + 22.9769×t +
0.000043×T2 – 0.10965×t2 – 0.105×T×t
Ash 8.1 – 0.0363×T – 0.9258×t + 0.00425×T×t Other 562 – 0.528×T – 15.56×t + 0.01253×T2 +
0.013×t2 + 0.079×T×t
Table 3. The OPT model equations after hot water pretreatment at
70 ≤ T ≤ 90 (°C) and 15 ≤ t ≤ 45(min)
Composition (%) Modeling equation
Cellulose –0.3 + 1.49×T – 0.059×t – 0.00958×T2 – 0.00228×t2 + 0.00287×T×t
Hemicellulose 136.06 – 3.26×T – 0.031×t + 0.02052×T2 –
0.00186×t2 + 0.00205×T×t Lignin 2.07 + 0.1995×T + 0.5927×t + 0.00005×T2 –
0.00049×t2 – 0.007×T×t
Ash 11.83 – 0.3×T – 0.08×t + 0.002×T2 + 0.001×T×t
Other 31.1 – 0.399×T – 0.462×t + 0.00185×T2 +
0.00204×t2 + 0.00477×T×t

O. Laosiriwut et al. / Songklanakarin J. Sci. Technol. 43 (4), 927-935, 2021 931
3.3 Alkaline hydrogen peroxide (AHP) pretreatment
The AHP pretreatment was operatee at a fixed ratio
between hot water treated OPT (80 °C and 30 mins) and the
H2O2 solution, which was 1:10 (g dry wt: mL). The chemical
composition of AHP-treated OPT samples is shown in Table 4
on studying the effects of three variables: the concentration of
H2O2 (1, 3 and 5 % w/w), temperature (50, 70 and 90 °C), and
time (30, 60, and 90 mins). In the laboratory, the antioxidant
properties of lignin aliquots from OPT were studied after
pretreatment; the solids must contain the least amount of
lignin following pretreatment. The evidence reveals that the
optimal condition was at 3 % w/w of H2O2, 70 °C and 30
mins, producing the lowest dry weight percentage of lignin.
The AHP effectively removed the lignin at a moderate
temperature, and it dissolved well in the alkaline solution
(Banerjee et al., 2012). However, the solid yield was
stationary at 82.00% when measured at the optimal condition
because this method causes no loss of structure.
The response surface models express the effects of
the process variables (temperature T (°C), time t (min), and
concentration of H2O2 (CH2O2, %w/w)) on the outcomes as
shown in Table 5. These equations were used to calculate the
outcomes (cellulose, hemicellulose, lignin, ash, and others) in
the Aspen Custom Modeler (ACM).
3.4 SSF section
From the experimental data on SSF, the incubation
temperature was 40°C throughout and the enzyme (10 FPU
Cellic Ctec2 g-1-substrate) and yeast (10% w/v) were added
together at the beginning of the process. The treated OPT at
10 %w/v (after all pretreatments) is the substrate of this
section containing 73.96 % cellulose, 12.90% hemicellulose,
and 11.68% lignin after the optimal AHP.
Table 4. The composition of hot water-treated OPT (at 80 °C and 30 mins) and treated OPT after AHP pretreatment
Temp (°C) Time (min) CH2O2 (%)
Composition (dry wt%)
Cellulose Hemicellulose Lignin Ash Other
Hot water-treated 61.76 8.12 18.32 1.33 10.47
50 30 1 66.56 11.05 18.02 0.89 3.48 50 30 3 67.61 11.02 17.96 0.81 2.60
50 30 5 69.77 9.93 17.11 0.77 2.42
50 60 1 67.86 5.80 19.22 1.12 6.00 50 60 3 64.92 10.73 17.51 1.11 5.73
50 60 5 63.39 9.57 15.71 1.11 10.22
50 90 1 62.54 3.64 19.11 1.08 13.63 50 90 3 64.38 9.17 18.91 1.11 6.43
50 90 5 67.23 9.88 18.31 0.91 3.67
70 30 1 69.83 12.85 16.11 0.96 0.25 70 30 3 73.96 12.90 11.68 0.95 0.51
70 30 5 73.66 12.45 12.11 0.94 0.84
70 60 1 69.91 12.24 17.75 0.90 0.20 70 60 3 66.24 11.62 17.21 0.91 4.02
70 60 5 70.74 7.27 17.12 0.90 3.97 70 90 1 65.60 10.05 16.87 1.07 6.41
70 90 3 68.18 9.91 16.66 1.05 4.20
70 90 5 68.74 4.80 16.32 1.02 9.12 90 30 1 64.37 10.83 19.21 1.02 4.57
90 30 3 69.59 4.21 19.65 1.01 5.54
90 30 5 70.13 8.65 19.54 0.94 0.74 90 60 1 63.33 9.90 19.63 1.09 6.05
90 60 3 70.22 7.57 19.00 1.08 2.13
90 60 5 70.41 5.70 18.87 1.08 3.94 90 90 1 64.48 10.01 18.44 1.10 5.97
90 90 3 67.14 7.73 18.09 1.04 6.00
90 90 5 70.17 8.61 17.89 1.01 2.32
Table 5. The model equations for pretreated OPT using AHP pretreatment at 1 ≤ CH2O2 ≤ 5 (%w/w), 50 ≤ T ≤ 90 (°C), and 30 ≤ t ≤ 90(min)
Component (%) Model equation
Cellulose 45.9 + (0.851×T) – (0.199×t) – (0.96× CH2O2) – (0.00689×T2) + (0.000611×t2) – (0.08× CH2O22) + (0.00104×T×t) +
(0.0315×T× CH2O2) Hemicellulose 7.1 + (0.325×T) – (0.151×t) – (0.46× CH2O2) – (0.00277×T2) + (0.00081×t2) + (0.191× CH2O2
2) + (0.00069×T×t) –
(0.0119× T× CH2O2)
Lignin 43.94 – (0.898×T) + (0.1607 ×t) – (1.46× CH2O2) + (0.00683×T2) – (0.000706×t2) + (0.051× CH2O22) – (0.001×T×t) +
(0.00883× T× CH2O2)
Ash 1.402 – (0.0244×T) + (0.013×t) – (0.0153× CH2O2) + (0.000192×T2) – (0.0042× CH2O22) + (0.000417× T× CH2O2)

932 O. Laosiriwut et al. / Songklanakarin J. Sci. Technol. 43 (4), 927-935, 2021
From the results, the glucose concentration rose
rapidly initially to peak at 6 h (Figure 2). This was because
there was insufficient yeast to consume the glucose. As
glucose became available, the yeast population grew, and the
concentration of glucose rapidly declined to a low level.
Subsequently, the glucose concentration remained low as a
consequence of ongoing consumption by the yeast.
The maximum ethanol concentration (33.11 g L1)
was observed at 60 h. At 72 h, the ethanol productivity was
0.44 g L1⋅h1 while the ethanol yield was 0.442 g EtOH g-1
dry cellulose.
The SSF was simulated in Aspen Plus as an RYield
(nonstoichiometric) reactor unit. This reactor used the ethanol
yield at 60 hours to produce the maximum ethanol from
pretreated OPT. The suitable condition for SSF was 40 °C
with an ethanol yield of 0.469 g EtOH g-1 dry cellulose.
Pretreated OPT (stream-RECV-AHP) of 30,227.27 kg was fed
into the fermentation reactor. Enzymes, yeast, and medium in
amounts 1,693.41, 34,459.15, and 9,068.2 kg, respectively,
were fed into the fermentation reactor. The solid waste was
then vented out of the system (steam-SOLIDWAS). Due to
the constraints of Aspen Plus, steady-state simulation was
used, although the actual fermentation was conducted as a
batch operation. The fermentation broth was sent to a storage
tank (STORAGE) before further processing in the
downstream recovery section.
Around 60,000 kg of OPT produced 10,134.57 kg of
ethanol per batch. The process simulation contained four
fermenters, operated in parallel. The duration of fermentation
was about three days. The fermentation broth was stored in a
beer well before being sent to the purification section. The
purification process required one day for each fermenter
batch.
3.5 Purification section
The ethanol purification section in Figure 1
consisted of three distillation columns. The first column
(BEER-CO) was an atmospheric distillation column that
simply boiled the ethanol-water mixture, with the boiling
point of water (100 °C) being higher than that of the ethanol
(78.3 °C) (Limayem & Ricke, 2012). This column had 13
stages, feed input (Stream-Broth) at stage 2, pressure 1 bar, a
feed molar ratio (D/F) of 0.1, and a reflux molar ratio (RR) of
1.5. Most of the ethanol is distilled at the top of the tower with
a concentration of 79.59% wt and unfermented glucose and
xylose are in the bottom product (Stream-DE-BEER).
The ethanol flow from BEER-CO was passed to the
extractive distillation column (PRODU-CO), with ethylene
glycol as the solvent. This column purified to more than 95%
wt of ethanol at the top of the column (Stream-ETHANOL),
while the bottom product was a mixture of water and solvent
(Stream-IN-P08). This column had 15 stages, a distillate to
feed mass ratio (D/F) of 0.65, and a reflux mass ratio (R/R) of
1.4. Sensitivity analysis was used to investigate the effects of
the feed and solvent stage on ethanol purification.
The effects of feed stage for broth feeding (fixed
stage of solvent as 7) shown in Figure 3 (A) gave the feed
stage for broth feeding as 11. Regarding the effect of the
solvent stage (fixed stage of feed from Figure 3 (A) as 11),
the appropriate solvent stage is 3 to obtain ethanol purity
exceeding 96.50 wt%, shown in Figure 3 (B). The makeup
solvent flow was 1,440 kg (stream-SOLVENT), and the
temperature was 25 °C.
The mixture stream (stream-IN-SEP) was fed into
the last column (SEP-SOL) and the solvent needs to be
recovered back into the system (Stream-SEP-SOLV). The
recycled stream was mixed with makeup solvent and returned
to the extractive column.
The configuration and operating conditions of each
column in the purification section are shown in Table 6. These
conditions will produce 60,000 kg of ethanol from OPT.
The results were in good agreement with previous
reports on the use of distillation with mixed glycerol for
separating ethanol and water. As in earlier work (Gil, Gracia,
& Rodriguez, 2013), the distillation process was stimulated
using a distillation column (RadFrac), consisting of two
columns (extractive and solvent recovery).
3.6 Overall mass balance
Table 7 shows the overall mass balance from
process simulation. The OPT material loss in the pretreatment
step was inevitable, and 49.62% (29,772 from 60,000 kg) of
OPT solids were removed from the raw OPT during the
pretreatment steps (SE, hot water, and AHP). The cellulose
loss was much lower, and its recovery was as high as 93.13%
(21,608.88 from 23,202.00 kg). The mass recoveries of
hemicelluloses and lignin were only 39.46 and 30.89%,
respectively.
Figure 2. Concentration of glucose and ethanol from SSF at 40 °C. The substrate was pretreated OPT solids

O. Laosiriwut et al. / Songklanakarin J. Sci. Technol. 43 (4), 927-935, 2021 933
Figure 3. Sensitivity analysis (A) feed stage and (B) solvent stage, mass fraction, and mass flow of ethanol in the extractive distillation column
Table 6. Operating conditions and configuration of each column in the purification section
Unit Equipment Model in Aspen Plus Operating condition and configuration
BEER-CO Distillation Column RadFrac Number of stages 13
Condenser Total Reflux ratio (mole) 1.5
Distillate to feed ratio (D/F, mole) 0.1
Feed stage 2 Top/Bottom pressure (bar) 1
PRODU-CO Distillation Column RadFrac Number of stages 15
Condenser Total Reflux ratio (mass) 1.4
Distillate to feed ratio (D/F, mass) 0.65
Feed stage (solvent) 3 Feed stage (Mixed feed) 11
Condenser pressure (bar) 1.4
Stage 2 pressure (bar) 1.41 Column pressure drop (bar) 0.2
SEP-SOL Distillation Column RadFrac Number of stages 10
Condenser Total Reflux ratio (mole) 1.5
Distillate to feed ratio (D/F, mass) 0.4
Feed stage 4 Condenser pressure (bar) 1.5
Stage 2 pressure (bar) 1.51
Column pressure drop (bar) 0.2

934 O. Laosiriwut et al. / Songklanakarin J. Sci. Technol. 43 (4), 927-935, 2021
Table 7. Overall mass balance of ethanol simulation using Aspen Plus
Component
Stream
OPT STEAM HOT-H2O H2O2-SOL TREAT-
SO
BUFFER,
PEPTONE &
YEASTEX
YEAST &
CTEC2 BROTH SOLVENT ETHANOL
Mass Flow kg
Ethanol 0 0 0 0 0 0 0 10,134.57 0 9531.04 Cellulose 23,202.00 0 0 0 21,608.88 0 0 0 0 0
Hemicellulose 9,012.00 0 0 0 3,556.25 0 0 0 0 0
Lignin 14,256.00 0 0 0 4,402.88 0 0 0 0 0
Water 0 6,676.00 431,520.00 368,625.96 0 0 0 304,702.89 0 341.02
Ash 972.00 0 0 0 310.94 0 0 0 0 0
Other 12,558.00 0 0 0 348.38 0 0 0 0 0
Cellic Ctec2 0 0 0 0 0 0 1,693.41 0 0 0 Ethylene
glycol
0 0 0 0 0 0 0 0 1,440.00 0
Hydrogen
peroxide
0 0 0 1,105.88 0 0 0 0 0 0
Buffer 0 0 0 0 0 302,273.39 0 0 0 0
Yeast extract 0 0 0 0 0 3,022.73 0 0 0 0
Peptone 0 0 0 0 6,045.47 0 0 0 0
S. cerevisiae Sc90
0 0 0 0 0 0 34,459.15 0 0 0
The SSF step produced 9,531.04 kg ethanol. The
ethanol yield based on kg of cellulose was 0.469 g g1. The
purification step produced more than 96.5% wt purity ethanol.
4. Conclusions
Ethanol is a potentially promising renewable energy
source and can be used in transport fuel applications as well as
for feedstock in the production of diverse chemicals. Starch
and sugar based feedstocks for producing ethanol are limited
and, therefore, lignocellulosic materials are of interest since
they are available in abundance and are inexpensive
alternatives.
This article presents the results of simulated ethanol
production using the lignocellulosic biomass of the oil palm
trunk. Experimental data from the laboratories of the Faculty
of Agro-Industry, Kasetsart University, were used as the basis
for simulating the OPT pretreatment steps. The mathematical
models of pretreatment steps were formulated using the Aspen
Custom Modeler (ACM). The optimal conditions of SE
pretreatment were 210 °C and 4 mins, while the optimal hot
water pretreatment required 30 min at 80 °C. The optimal
AHP pretreatment used 3% w/w of H2O2 at 70 °C for a
duration of 30 min. This custom model was used together with
the built-in models in Aspen Plus. The non-random two liquid
(NRTL) thermodynamic method was used. For the SSF step,
the process was operated at 40 °C for 60 hours using the
Cellic Ctec2 enzyme and S. cerevisiae Sc90 yeast. This step
was modeled as a yield reactor with an ethanol yield of 0.469
g EtOH g-1 dry cellulose. The recovery process employed
extractive distillation with ethylene glycol as the solvent.
Based on the simulation results, 9,531.04 kg of ethanol could
be produced from 60,000 kg of OPT with a product purity
greater than 96.5% wt. in a process that took three days.
Acknowledgements
Funding for this work was provided jointly by the
NRCT (The office of the National Research Council of
Thailand), in collaboration with NSFC (The National Natural
Science Foundation of China) under the topic of Renewable
Energy, and Kasetsart University.
References
Abdallah, M. A. M. (2012). Seaweeds, food, and industrial
products and nutrition. In V. H. Pomin, (Ed.)
Seaweed ecology, nutrient composition and medical
uses (pp. 99-118). New York, NY. Nova Science.
Akmar, P. F., & Kennedy, J. K. (2001). The potential of oil
and sago palm trunk wastes as carbohydrate
resources. Wood Science and Technology, 35, 467–
473.
Balat, M., Balat, H., & Öz, C. (2008). Progress in bioethanol
processing. Progress in Energy and Combustion
Science, 34(5), 551–573.
Banerjee, G., Car, S., Liu, T., Williams, D. L., Meza, S. L.,
Walton, J. D., & Hodge, D. B. (2012). Scale-up and
integration of alkaline hydrogen peroxide
pretreatment, enzymatic hydrolysis, and ethanolic
fermentation. Biotechnology and Bioengineering,
109(4), 922–931.
Bungay, H. R. (2004). Confession of a bioenergy advocate.
Trends in Biotechnology, 22(2), 67–71.
Cao, W., Sun, C., Liu, R., Yin, R., & Wu, X. (2012).
Comparison of the effects of five pretreatment
methods on enhancing the enzymatic digestibility
and ethanol production from sweet sorghum
bagasse. Bioresource Technology, 111, 215–221.
Chuenbubpar, D., Srinophakhun, T., Tohsakul, P. (2018).
Plant-wide Process Simulation of Ethanol
Production from Empty Fruit Bunch. KMUTNB
Applied Science and Engineering Progress, 11(1),
53–61.
Gavrilescu, M., & Chisti, Y. (2005). Biotechnology – a
sustainable alternative for the chemical industry.
Biotechnology Advances, 23(7–8), 471–499.
Gil, I. D., Gracia, L. C., & Rodriguez, G. (2013). Simulation

O. Laosiriwut et al. / Songklanakarin J. Sci. Technol. 43 (4), 927-935, 2021 935
of ethanol extractive distillation with mixed glycols
as a separating agent. Brazilian Journal of Chemical
Engineering, 31, 259–270.
Hamelinck, C. N., Hooijdonk, G. V., & Faaij, A. P. C. (2005).
Ethanol from lignocellulosic biomass: Techno-
economic performance in short-, middle-and long-
term. Biomass and Bioenergy, 28, 384–410.
Jeon, H., Kang, K. E., Jeong, J. S., Gong, G., Choi, J. W.,
Abimanyu, H., . . . Choi, G. W. (2014). Production
of anhydrous ethanol using oil palm empty fruit
bunch in a pilot plant. Biomass and Bioenergy, 67,
99–107.
Jung, Y. H., Kim I. J., Han, J. I., Choi, I. G., & Kim, K. H.
(2011). Aqueous ammonia pretreatment of oil palm
empty fruit bunches for ethanol production.
Bioresource Technology, 102(20), 9806–9809.
Kaewklam, S. (2018). Comparison of techno-economic for
ethanol production plant from empty fruit bunch in
Thailand (Master’s thesis, Kasetsart University,
Bangkok, Thailand). Retrieved from https://
research.ku.ac.th/forest/Project.aspx?ProjectNumber
=164000500 6&BudgetYear=2016.
Khunrong, T., Punsuvon, V., Vaithanomsat, P., &
Pomchaitaward, C. (2010). Production of ethanol
from pulp obtained by steam explosion pretreatment
of the oil palm trunk. Energy Sources, Part A:
Recovery, Utilization, and Environmental Effects,
33(3), 221–228.
Lee, F. M., & Pahl, R. H. (1985). Solvent screening and
conceptual extractive distillation process to produce
anhydrous ethanol from fermentation broth.
Industrial Engineering Chemical Process Design
and Development, 24, 168.
Limayem, A., & Ricke, S. C. (2012). Lignocellulosic biomass
for bioethanol production: Current perspectives,
potential issues, and future prospects. Progress in
Energy and Combustion Science, 38, 449–467.
Lu, J., Li, X., Yang, R., Yang, L., Zhao, J., Liu, Y., & Qu, Y.
(2013). Fed-batch semi-simultaneous saccharifi
cation and fermentation of reed pretreated with
liquid hot water for bio-ethanol production using
Saccharomyces cerevisiae. Bioresource Technology,
144, 539–547.
Onuki, S. (2006). Bioethanol production from empty fruit
bunch (EFB) of oil palm. Pahang, Malaysia: Faculty
of Chemical and Natural Resources Engineering,
Universiti Malaysia Pahang.
Songprom, K. (2011) Bioethanol production from oil palm
trunk pretreated by steam explosion (Master’s
thesis, Kasetsart University, Bangkok, Thailand).
Retrieved from http://newtdc.thailis.or.th/docview.
aspx?tdcid=202623.
Sun, Y., & Cheng, J. (2002). Hydrolysis of lignocellulosic
materials for ethanol production: a review.
Bioresource Technology, 83, 1–11.
Wong, Y. C., & Sanggari, V. (2014). Bioethanol production
from sugarcane bagasse using a fermentation
process. Oriental Journal of Chemistry, 30, 507–
513.
Yoswathana, N., Phuriphipat, P., Treyawutthiwat, P., &
Eshtiaghi, M.N. (2010). Bioethanol production from
rice straw. Energy Research Journal, 1, 26–31.