process parameters for fermentation in a rotary disc ... for optimum microbial ... the results from...
TRANSCRIPT

PEER-REVIEWED ARTICLE bioresources.com
Zahan et al. (2014). “Fermentation with rotary disc,” BioResources 9(2), 1858-1872. 1858
Process Parameters for Fermentation in a Rotary Disc Reactor for Optimum Microbial Cellulose Production using Response Surface Methodology
Khairul Azly Zahan, a, c
Norhayati Pa’e,ª and Ida Idayu Muhamad a,b,
*
In this study, microbial cellulose production by Acetobacter xylinum 0416 using standardized liquid pineapple waste was carried out in a 4-L rotary disc reactor (RDR). The objective of this study was to optimize the process parameters for production of microbial cellulose in the RDR. The effects of the disc rotation speed (5 to 12 rpm), pH (3.5 to 7.5), fermentation period (3 to 6 days), and inoculum concentration (3 to 20% v/v) on the microbial cellulose production were investigated. The optimum microbial cellulose yield was obtained using 10% (v/v) of inoculum concentration, whereby four days’ duration gave the most productive yield. In addition, the highest production of microbial cellulose was obtained at a low disc rotation speed of 7 rpm and a pH of 5.0. Analysis of data performed a high coefficient of determination value (R
2=0.875) represented by a mathematical model of optimized microbial
cellulose production, Y = -200.437 + 7.180X1 + 69.869X2 + 4.369X3 + 1.867X4 – 0.512X1
2 – 6.766X2
2 – 0.585X3
2 – 0.079X4
2. From the results, it
can be concluded that the foremost factors that affect the production of microbial cellulose in RDR were pH followed by inoculum concentration, disc rotation speed (rpm), and fermentation period.
Keywords: Microbial cellulose; Rotary disc reactor; Process parameters; Optimization; Response surface
methodology; Pineapple waste; Acetobacter xylinum 0416
Contact information: a: Bioprocess Engineering Department, Faculty of Chemical Engineering,
Univerisiti Teknologi Malaysia, 81310 Skudai, Johor, Malaysia; b: Cardio Engineering Centre IJN-UTM,
Universiti Teknologi Malaysia, 81310 UTM Skudai, Johor, Malaysia; c: Section of Bioengineering
Technology, Malaysian Institute of Chemical and Bioengineering Technology, Universiti Kuala Lumpur,
Lot 1988, Bandar Vendor Tabuh Naning, 78000 Alor Gajah, Melaka, Malaysia;
* Corresponding author: [email protected]
INTRODUCTION
Microbial cellulose, also known as Nata, is very pure. It has a higher degree of
polymerization and crystallinity compared to cellulose obtained from plants. This is
because the cellulose fibrils in plants are embedded with hemicelluloses, lignin, and waxy
aromatic substances (Ross et al. 1991). Because of its high water holding capacity and
tensile strength, microbial cellulose has become an important raw material for products
such as high fidelity acoustic speakers, paper, and desert foods (Iguchi et al. 2000; Ross
et al. 1991; Norhayati et al. 2011). In addition, it also has been used in the production of
pharmaceutical and beauty products (Czaja et al. 2006). Microbial cellulose can also be
used in the production of industrial materials such as ultrafiltration membranes, binders
for powders, thickeners for ink, adhesives, paint, and cement (Iguchi et al. 2000).
There are few different methods used for the production of microbial cellulose
that have been previously reported. For the static culture method, a long fermentation
PEER-REVIEWED ARTICLE bioresources.com
Zahan et al. (2014). “Fermentation with rotary disc,” BioResources 9(2), 1858-1872. 1859
period and intensive manpower are required, thus resulting in a low production yield and
high labour cost (Norhayati et al. 2011). The agitated culture method might convert
microbial cellulose production strains into cellulose negative mutants. Because of their
rapid growth, it becomes more enriched than the wild type strain, thus reducing the
production of microbial cellulose (Kim et al. 2007). In airlift and stirred tank reactors,
microbial cellulose production is decreased due to the adhesion of the culture broth to the
reactor wall and the upper part of the equipment (Krystynowicz et al. 2002).
Critical factors that affect the production of microbial cellulose by Acetobacter
xylinum 0416 can be divided into two major groups. Firstly, the fermentation
composition, including the carbon, mineral, and nitrogen sources used in the medium
(Keshk and Sameshima 2005). Traditional sources of carbon for microbial fermentation
are sugars such as glucose, fructose, and sucrose (Bae and Shoda 2005). More recently,
unconventional feedstocks from renewable resources and waste streams have been
investigated (Zeng et al. 2011). These include fruit juices (Kurosumi et al. 2009), sugar
cane molasses (Keshk and Sameshima 2006), sweet potato pulp (Shigematsu et al. 2005),
rotten apples (Gupta et al. 2010), and maple syrup (Zeng et al. 2011). The second factor
is operating conditions such as dissolved oxygen (Kouda et al. 1997), temperature, pH of
the growth medium (Noro et al. 2004), inoculation ratio (Hutchens et al. 2007), and
inoculum age. Both groups of factors must be at optimized levels to ensure optimum
production of microbial cellulose.
Response surface methodology (RSM) is widely used for multivariable
optimization studies in several biotechnological processes such as optimization of media,
process conditions, catalyzed reactions conditions, oxidation, production, fermentation,
and biosorption of metals (Chang et al. 2006; Preetha and Viruthagiri 2007; Soo et al.
2006; Wang and Lu 2005).
This research aimed to study and optimize the process parameters of fermentation
in a designed rotary disc reactor (RDR) so that the production yield could be increased
and fermentation time could be reduced. The RDR uses the concept of a rotating
biological contactor that exposes bacteria to the air for better aeration. The use of RDR
can reduce the problems faced using the traditional method in static tray such as low
volumetric yields, lack of large scale production capacity, long fermentation period,
manpower, and large spatial demands to produce the microbial cellulose. In previous
research (Norhayati et al. 2011), fermentation of microbial cellulose in RDR achieved
85% greater yield compared to that under stationary conditions of growth.
Table 1. Characteristics of Liquid Pineapple Waste
Composition Liquid Waste
Before sterilization After sterilization COD (g/L) 100.8 103.7 Reducing sugar (g/L) 39.20 41.20 Total sugar (g/L) 100.0 100.9 Dextran (g/L) 1.50 1.50 Raffinose (g/L) 2.60 1.50 Sucrose (g/L) 40.1 40.1 Glucose (g/L) 23.6 23.6 Galactose (g/L) 1.70 2.10 Fructose (g/L) 14.0 15.6 pH 4.00 4.00
Source: Sasaki et al. 1991

PEER-REVIEWED ARTICLE bioresources.com
Zahan et al. (2014). “Fermentation with rotary disc,” BioResources 9(2), 1858-1872. 1860
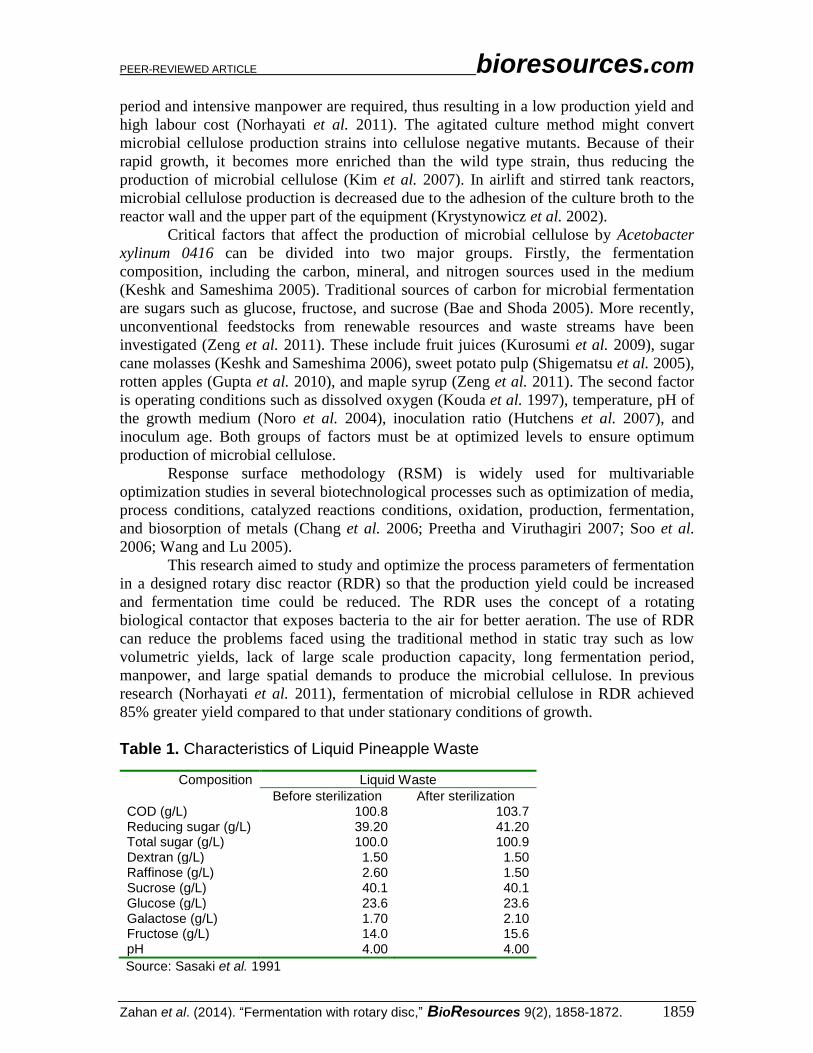
Pineapple waste is a good source of nutrients for microorganisms because it
consists of high carbon levels and other elements important for survival of the
microorganism (Sasaki et al. 1991). Table 1 shows the chemical composition of liquid
pineapple wastes. In addition, pineapple industries produce large quantities of solid and
liquid wastes. Thus, the use of pineapple waste as fermentation medium in RDR for
microbial cellulose production is a beneficial waste to wealth program.
Currently, there is little information on the optimum process parameters of
fermentation in RDR. Therefore, the objective of this study was to evaluate the major
factors that can influence the microbial cellulose production yield in order to determine
the optimum process parameters of fermentation in RDR. Data from this work will
provide valuable information and better understanding on the production of microbial
cellulose in RDR, thus increasing production capacity and helping to fulfil the world
demand of microbial cellulose.
EXPERIMENTAL
Experimental Setup using RDR Preparation and set up for fermentation using the rotary disc reactor (RDR) was in
accordance with the work of Norhayati et al. (2011). The RDR consists of a series of
discs, which are mounted on a shaft. The shaft is connected to a driven motor so that it
could rotate the shaft together with the discs. The discs were put in a horizontally
designed trough that contained a biological medium in which at least a portion of the
contained discs were submerged. A driven motor was used in order to give rotational
force to the shaft and discs. The discs would alternately soak the organisms in nutrient
medium and expose them to air during each rotation. Figure 1 shows a schematic diagram
of RDR, while Table 2 shows the specifications of RDR used in this study.
Fig. 1. Schematic diagram of RDR (Pa’e 2009)
Table 2. Specifications of RDR Used in this Study
Parameter Unit Specifications
Disc diameter cm 13 Disc submergence % 30 Total surface area for discs cm
2 2124
Total volume cm3 10000
Working volume cm3 4000
Number of discs - 8
Source: Pa’e 2009

PEER-REVIEWED ARTICLE bioresources.com
Zahan et al. (2014). “Fermentation with rotary disc,” BioResources 9(2), 1858-1872. 1861
Preparation of Inoculum Acetobacter xylinum 0416 (Pa’e et al. 2007) Four hundred millilitres of pineapple waste were sieved into a beaker. Then, 6.00
g/L of yeast extract, 1.49 g/L of bactopepton, 1.08 g/L of KH2PO4, and 0.06 g/L of
MgSO4 were added to the medium. The medium was stirred until all ingredients were
completely dissolved. The pH of the medium was adjusted with 2 M NaOH to pH 5.0
using a pH meter. Then, the medium was poured into a Schott bottle and then autoclaved
at 121 °C for 15 min. After being cooled to 28±1 °C, about 10 mL of Acetobacter
xylinum 0416 (obtained from Biotechnology Research Centre, MARDI, Serdang) was
added to the medium using aseptic technique. The medium was mixed apparently by
manually shaking the bottle gently and slowly using hand. Then, the Schott bottle was
kept at 28±1 °C for 3 days before further use.
Preparation of Fermentation Medium (Pa’e et al. 2007) Four litres of pineapple waste were sieved into a 4-L tray. Then, 6.00 g/L of yeast
extract, 1.49 g/L of bactopepton, 1.08 g/L of KH2PO4, and 0.06 g/L of MgSO4 were
added to the medium. The medium was stirred until all ingredients were completely
dissolved. The pH of the medium was adjusted with 2 M NaOH to pH 5.0 using a pH
meter. Then, the medium was transferred into a Schott bottle and autoclaved at 121 °C
for 15 min. After being cooled to 28±1 °C, the medium was ready for the fermentation
process. The medium with inoculum was poured into the RDR. The RDR was covered
and left for fermentation at 28±1 °C with various ranges of disc rotation speed (5, 7, 9,
and 12 rpm), pH (3.5, 4.5, 5.0, 5.5, 6.0, 6.5, and 7.5), fermentation period (3, 4, 5, and 6
days), and inoculum concentration (3, 5, 10, and 20% v/v).
Optimization using Response Surface Methodology (RSM) Response surface methodology (RSM) is a collection of mathematical and
statistical approaches that are useful for the modelling and analysis of data in which a
response of interest will be affected by more than one factor and the main target is to
determine the optimum conditions of factors to predict desired responses (Myers and
Montgomery 2002). In this study, culture conditions were initially determined using
experiments based on one-factor-at-a-time (OFAT) variations. In order to optimize the
fermentation process in RDR, central composite design (CCD) was selected. With four
variables, 17 experiments were carried out. The variables (independent factors) used in
this study were: disc rotation speed (rpm), pH, fermentation period (days), and inoculum
concentration (% v/v), where X1 is the disc rotation speed (rpm), X2 is pH, X3 is the
fermentation period (days), and X4 is inoculum concentration (% v/v), as shown in Tables
3 and 4. The results from OFAT were then entered into the design experiment
spreadsheet in Statistica 8.0 to evaluate the production performance and obtain the
equation for microbial cellulose production in RDR based on the variables purposed. In
order to evaluate the experimental results, the response factors were fitted with a second-
order model in the form of quadratic polynomial equation given below,
Y = β0 ± βiXi ± βiiX2
i ± βijXiXj (1)
where Y is the predicted response (microbial cellulose production in RDR) used as
dependent factor; Xi (i = 1, 2, 3, and 4) are the independent factors, β0 is the intercept
coefficient, βi, βii and βij (i = 1, 2, 3, and 4; j = 1, 2, 3, and 4) are the model coefficients,
respectively.

PEER-REVIEWED ARTICLE bioresources.com
Zahan et al. (2014). “Fermentation with rotary disc,” BioResources 9(2), 1858-1872. 1862
Table 3. Variables Study
Variable Symbol Coded Levels
-1.0 0 +1.0 Disc Rotation speed (rpm) X1 5 7 12 pH X2 5.0 6.0 6.5 Fermentation period (day) X3 3 5 6 Inoculum concentration (% v/v) X4 3 10 20
Table 4. Coded Factor Levels for Central Composite Design
Run Disc Rotation Speed (rpm)
pH Fermentation Period (day)
Inoculum Concentration (% v/v)
1 5.00 5.50 4.00 10.00 2 7.00 5.50 4.00 10.00 3 9.00 5.50 4.00 10.00 4 12.00 5.50 4.00 10.00 5 7.00 3.50 4.00 10.00 6 7.00 5.00 4.00 10.00 7 7.00 5.50 4.00 10.00 8 7.00 6.00 4.00 10.00 9 7.00 6.50 4.00 10.00
10 7.00 5.00 3.00 10.00 11 7.00 5.00 4.00 10.00 12 7.00 5.00 5.00 10.00 13 7.00 5.00 6.00 10.00 14 7.00 5.00 4.00 10.00 15 7.00 5.00 4.00 3.00 16 7.00 5.00 4.00 5.00 17 7.00 5.00 4.00 20.00
The model was evaluated using the Fisher’s statistical test for analysis of variance
(ANOVA). The F-value is the ratio of the mean square due to regression to the mean
square due to error. The value of F is compared to the table value F (p-1, n-p, α). If the
value of F is smaller than F (p-1, n-p, α), then the null hypothesis is accepted at the α
level of significance. Therefore, if the null hypothesis is true, it means that the model is a
good predictor of the experimental data. Finally, two-dimensional contour plots and
three-dimensional curves of the response surfaces were generated using the same
statistical approach.
RESULTS AND DISCUSSION
Optimization of Process Parameters based on OFAT Approach Four experimental factors, i.e., disc rotation speed, pH, fermentation period, and
inoculum concentration, were considered to have the most significant effect on the
microbial cellulose production by Acetobacter xylinum 0416 in RDR. The effect of these
four factors was obtained in optimization by the OFAT approach. In this approach, when
the effect of one factor was investigated, the other three factors were fixed at the
presumptive optimum values as follows: disc rotation speed of 7 rpm, pH of 5.5,
fermentation period of 4 days, and 10% (v/v) of inoculum concentration. These factors
were examined in the range of parameters, i.e., disc rotation speed (5, 7, 9, and 12 rpm),

PEER-REVIEWED ARTICLE bioresources.com
Zahan et al. (2014). “Fermentation with rotary disc,” BioResources 9(2), 1858-1872. 1863
pH (3.5, 4.5, 5.0, 5.5, 6.0, 6.5, and 7.5), fermentation period (3, 4, 5, and 6 days), and
inoculum concentration (3, 5, 10, and 20% v/v). Microbial cellulose production was
considerably affected by changes in these factors. These approximately optimized values
(disc rotation speed of 7 rpm, pH of 5.0, fermentation period of 4 days, and inoculum
concentration of 10% v/v) were set at the middle level in CCD for further optimization.
Statistical Analysis of Results Obtained using Response Surface Methodology (RSM) through Central Composite Design
The effect of process parameters (disc rotation speed, pH, fermentation period,
and inoculum concentration) was investigated using response surface methodology
(RSM) through central composite design (CCD). The results were analysed in RSM to
visualize the effect of independent factors on responses. Table 5 shows the results of each
experiment performed. An empirical relationship between the response and the
independent variables has been expressed by the following quadratic model,
Y = -200.437 + 7.180X1 + 69.869X2 + 4.369X3 + 1.867X4 – 0.512X12
– 6.766X22 – 0.585X3
2 – 0.079X4
2 (2)
where Y is the dried mass of microbial cellulose produced in RDR, X1 is the disc rotation
speed (rpm), X2 is the pH of fermentation medium, X3 is the fermentation period, and X4
is the inoculum concentration.
Table 5. RSM Result of Process Parameters for RDR
Disc Rotation Speed (rpm)
pH Fermentation Period (day)
Inoculum Concentration (% v/v)
Dried Mass of Cellulose (g)
1 5.00 5.50 4.00 10.00 20.75 2 7.00 5.50 4.00 10.00 20.75 3 9.00 5.50 4.00 10.00 20.25 4 12.00 5.50 4.00 10.00 10.75 5 7.00 3.50 4.00 10.00 4.70 6 7.00 5.00 4.00 10.00 28.30 7 7.00 5.50 4.00 10.00 22.80 8 7.00 6.00 4.00 10.00 18.10 9 7.00 6.50 4.00 10.00 13.50
10 7.00 5.00 3.00 10.00 23.34 11 7.00 5.00 4.00 10.00 28.30 12 7.00 5.00 5.00 10.00 22.29 13 7.00 5.00 6.00 10.00 21.09 14 7.00 5.00 4.00 10.00 20.34 15 7.00 5.00 4.00 3.00 18.67 16 7.00 5.00 4.00 5.00 19.31 17 7.00 5.00 4.00 20.00 18.70
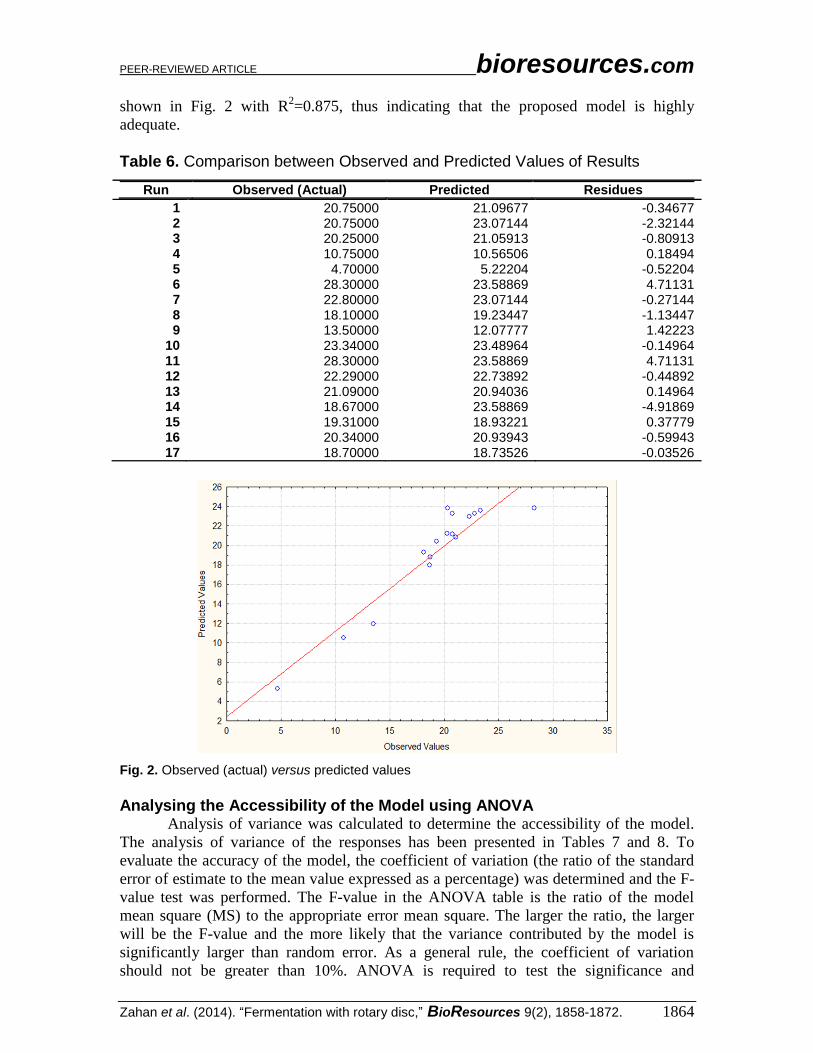
The actual (observed) values for the combined effects of all factors (disc rotation
speed, pH, fermentation period, and inoculum concentration) were used to assess the
model responses in terms of specific numerical values in addition to the statistical
evaluation of the model. The comparisons of actual and predicted values of microbial
cellulose production by Acetobacter xylinum 0416 in RDR are shown in Table 6 and Fig.
2. The plot of predicted values versus experimental dry weight of microbial cellulose is
PEER-REVIEWED ARTICLE bioresources.com
Zahan et al. (2014). “Fermentation with rotary disc,” BioResources 9(2), 1858-1872. 1864
shown in Fig. 2 with R2=0.875, thus indicating that the proposed model is highly
adequate.
Table 6. Comparison between Observed and Predicted Values of Results
Run Observed (Actual) Predicted Residues
1 20.75000 21.09677 -0.34677 2 20.75000 23.07144 -2.32144 3 20.25000 21.05913 -0.80913 4 10.75000 10.56506 0.18494 5 4.70000 5.22204 -0.52204 6 28.30000 23.58869 4.71131 7 22.80000 23.07144 -0.27144 8 18.10000 19.23447 -1.13447 9 13.50000 12.07777 1.42223
10 23.34000 23.48964 -0.14964 11 28.30000 23.58869 4.71131 12 22.29000 22.73892 -0.44892 13 21.09000 20.94036 0.14964 14 18.67000 23.58869 -4.91869 15 19.31000 18.93221 0.37779 16 20.34000 20.93943 -0.59943 17 18.70000 18.73526 -0.03526
Fig. 2. Observed (actual) versus predicted values
Analysing the Accessibility of the Model using ANOVA
Analysis of variance was calculated to determine the accessibility of the model.
The analysis of variance of the responses has been presented in Tables 7 and 8. To
evaluate the accuracy of the model, the coefficient of variation (the ratio of the standard
error of estimate to the mean value expressed as a percentage) was determined and the F-
value test was performed. The F-value in the ANOVA table is the ratio of the model
mean square (MS) to the appropriate error mean square. The larger the ratio, the larger
will be the F-value and the more likely that the variance contributed by the model is
significantly larger than random error. As a general rule, the coefficient of variation
should not be greater than 10%. ANOVA is required to test the significance and

PEER-REVIEWED ARTICLE bioresources.com
Zahan et al. (2014). “Fermentation with rotary disc,” BioResources 9(2), 1858-1872. 1865
adequacy of the model. The Fishers variance ratio F-value
=MSregression/MSresidual=(SSR/DFregression)/(SSE/DFresidual) is the ratio of the mean square
owing to regression to the mean square owing to an error. It is the measure of variation in
the data about the mean.
Table 7. Analysis of Variance
Sources Sum of Squares (SS)
Degree of Freedom
(DF)
Mean Squares
(MS)
F-value F0.05
Regression (SSR) 463.9138 8 57.9892 7.00 3.44 Residual 66.2232 8 8.2779 Total (SST) 530.1370 16
Table 8. ANOVA Results
Factor SS df MS F p
(1) RPM (L) 66.5458 1 66.5458 8.03897 0.021970 RPM (Q) 42.2767 1 42.2767 5.10718 0.053730 (2) pH (L) 64.1602 1 64.1602 7.75078 0.023777 pH (Q) 338.7998 1 338.7998 40.92822 0.000210 (3) Fermentation Period (L) 4.2676 1 4.2676 0.51554 0.493182 Fermentation Period (Q) 2.0081 1 2.0081 0.24259 0.635573 (4) Inoculum conc. (L) 0.3861 1 0.3861 0.04664 0.834423 Inoculum conc. (Q) 48.6098 1 48.6098 5.87224 0.041637 Error 66.2232 8 8.2779 Total SS 530.1370 16
From the results, the ANOVA of the regression model demonstrates that the
model is significant as evident from the calculated F-value (7.00) and a very low
probability value (P≤0.002693). The P values are used as a tool to check the significance
of each of the coefficients, which in turn may indicate the patterns of the interaction
among the variables. Values greater than 0.10 indicate the model terms are not
significant. This implies that the quadratic effects of disc rotation speed (p = 0.053730),
pH (p = 0.000210), and inoculum concentration (p = 0.041637) are more significant.
Table 9 shows the analysis of variance (ANOVA) of regression parameters for the
predicted response surface quadratic model for the production of microbial cellulose in
RDR using the results of all experiments performed.
Table 9. Regression Coefficients
Factor Regr. Coeff.
Std Error t(8) p -95% Cnf.Limt
+95% Cnf.Limt
Mean/Interc. -200.437 46.84635 -4.27860 0.002693 -308.465 -92.4090
(1) RPM (L) 7.180 4.00866 1.79123 0.111030 -2.064 16.4244
RPM (Q) -0.512 0.22648 -2.25991 0.053730 -1.034 0.0104
(2) pH (L) 69.869 10.60530 6.58816 0.000171 45.414 94.3253
pH (Q) -6.766 1.05753 -6.39752 0.000210 -9.204 -4.3269
(3)Ferm. Period (L) 4.369 10.97718 0.39805 0.701003 -20.944 29.6829
Ferm. Period (Q) -0.585 1.18738 -0.49253 0.635573 -3.323 2.1533
(4)Inoculum conc. (L) 1.867 0.79105 2.35984 0.045970 0.043 3.6909
Inoculum conc. (Q) -0.079 0.03265 -2.42327 0.041637 -0.154 -0.0038

PEER-REVIEWED ARTICLE bioresources.com
Zahan et al. (2014). “Fermentation with rotary disc,” BioResources 9(2), 1858-1872. 1866
From Table 9, the value of coefficient of determination (R2 = 0.875) indicates that
only 12.49% of the total variation could not be explained by the empirical model and
expresses good enough quadratic fits to navigate the design space. Joglekar and May
(1987) suggested that the R2 value should be at least 0.80 for a good fit of a model. The
R2 value (0.875) obtained indicated that the regression models explained the reaction
well. Thus the response surface model developed in this study for predicting the
production of microbial cellulose was considered to be satisfactory.
Effect of Factors for Responses The response surface curves were plotted to understand the interaction of the
variables and to determine the optimum level of each variable for maximum response.
The elliptical nature of the contour signifies that the interactive effects between the
variables were significant and that optimum values of the test variables could be
obtained. The response surface curves for the production of microbial cellulose are
shown in Figs. 3 through 8. Each 3-D plot represents the number of combinations of two-
test variables. The figures also show the optimal values for the process conditions.
Figure 3 shows the combined effect of disc rotation speed and pH in the RDR
where maximum production of microbial cellulose was recorded at a pH of 5.0 and a disc
rotation speed of 7 rpm. Clearly, it can also be seen that the high speed of disc rotation
and low value of pH had a significant effect on the production of microbial cellulose.
From the interrelation between these two factors, pH had a more significant effect
compared to the disc rotation speed in the RDR.
Fig. 3. (a) Composite graph for disc rotation speed (rpm) and pH versus microbial cellulose production. (b) Surface response for disc rotation speed (rpm) and pH versus microbial cellulose production
The mutual effects of disc rotation speed (rpm) and fermentation period are
illustrated in Fig. 4. The highest production of microbial cellulose was obtained at 7 rpm
and four days of fermentation period. The disc rotation speed evidently had a more
significant effect to the production of microbial cellulose in RDR compared to the
fermentation period.

PEER-REVIEWED ARTICLE bioresources.com
Zahan et al. (2014). “Fermentation with rotary disc,” BioResources 9(2), 1858-1872. 1867
Fig. 4. (a) Composite graph for disc rotation speed (rpm) and fermentation period versus microbial cellulose production. (b) Surface response for disc rotation speed (rpm) and fermentation period versus microbial cellulose production
The effect of disc rotation speed (rpm) and inoculum concentration on the
production of microbial cellulose can be observed in Fig. 5. The optimum conditions
were recorded at 7 rpm and 10% (v/v) of inoculum concentration. At high disc rotation
speeds (above 10 rpm), the production of microbial cellulose was decreased dramatically.
Meanwhile, only a slight effect was observed in production if the inoculum concentration
was too low (below 3% v/v) or too high (above 20% v/v). Hence, disc rotation speed had
more significant effects when compared to the inoculum concentration.
Fig. 5. (a) Composite graph for disc rotation speed (rpm) and inoculum concentration versus microbial cellulose production. (b) Surface response for disc rotation speed (rpm) and inoculum concentration versus microbial cellulose production
The effects of pH and fermentation period are presented in Fig. 6. The optimum
conditions for production of microbial cellulose were noted at a pH of 5.0 and a
fermentation period of four days. However, the fermentation period did not have a huge
effect on the production of microbial cellulose compared to pH, since a pH value that was
too low (below 4.0) or too high (above 6.5) can cause dramatic decrease in microbial

PEER-REVIEWED ARTICLE bioresources.com
Zahan et al. (2014). “Fermentation with rotary disc,” BioResources 9(2), 1858-1872. 1868
cellulose production because Acetobacter xylinum 0416 is highly sensitive to pH changes.
As a consequence, pH had a more significant effect over the fermentation period.
Fig. 6. (a) Composite graph for pH and fermentation period versus microbial cellulose production; (b) Surface response for pH and fermentation period versus microbial cellulose production
As shown in Fig. 7, the maximum production of microbial cellulose was recorded
at a pH of 5.0 and 10% (v/v) of inoculum concentration. As can be seen in the graph,
changes in pH values also had a significant effect on production where the desired
production yield could only be achieved between a pH of 4.5 and 6.0 (more than 15
grams per litre), whereas the inoculum concentration did not show much effect on the
production process. Thus pH gives a more significant effect compared to the inoculum
concentration in the RDR.
Fig. 7. (a) Composite graph for pH and inoculum concentration versus microbial cellulose production; (b) Surface response for pH and inoculum concentration versus microbial cellulose production.
The effects of fermentation period and inoculum concentration are illustrated in
Fig. 8. The production of microbial cellulose had optimal conditions of a fermentation
period of four days and 10% (v/v) of inoculum concentration. If the concentration of
inoculum was too low (below 3% v/v) or too high (above 20% v/v) the production

PEER-REVIEWED ARTICLE bioresources.com
Zahan et al. (2014). “Fermentation with rotary disc,” BioResources 9(2), 1858-1872. 1869
process decreased significantly while changes in fermentation period did not show much
effect on the production yield.
Fig. 8. (a) Composite graph for fermentation period and inoculum concentration versus microbial cellulose production. (b) Surface response for fermentation period and inoculum concentration versus microbial cellulose production
Pareto Chart of Optimized Parameters for Microbial Cellulose Fermentation in RDR A Pareto chart highlights the category with the highest frequency of all the
variables which have been discussed previously in the production of microbial cellulose
in the RDR. From the Pareto chart in Fig. 9, pH showed the highest frequency among
other factors that had an impact on the production of microbial cellulose in the RDR. This
means the foremost factors that affect the production of microbial cellulose in RDR were
pH, followed by inoculum concentration, disc rotation speed (rpm), and fermentation
period. Finally, it is also worth to note that since the values for pH, disc rotation speed,
and inoculum concentration were above p=0.05, only these three factors would give
significant effect to the production process in RDR.
Fig. 9. Pareto chart

PEER-REVIEWED ARTICLE bioresources.com
Zahan et al. (2014). “Fermentation with rotary disc,” BioResources 9(2), 1858-1872. 1870
CONCLUSIONS
1. An empirical relationship between the response and independent variables can be
expressed by the following quadratic model: Y = -200.437 + 7.180X1 + 69.869X2 +
4.369X3 + 1.867X4 – 0.512X12 – 6.766X2
2 – 0.585X3
2 – 0.079X4
2, where Y is the dried
mass of microbial cellulose produced in the RDR, X1 is the disc rotation speed (rpm),
X2 is the pH of the fermentation medium, X3 is the fermentation period, and X4 is the
inoculum concentration (% v/v).
2. ANOVA of the regression model demonstrated that the model was significant, as
evidenced by the calculated F-value (7.00) and a very low probability value (P ≤
0.002693). In addition, the value of the coefficient of determination (R2 = 0.875)
signified that only 12.49% of the total variation could not be explained by the
empirical model and expressed a sufficient quadratic fit to navigate the design space.
3. Finally, pH showed the highest frequency among other factors that had an effect on
the production of microbial cellulose in RDR. This means the main factors that
affected the production of microbial cellulose in RDR were pH, followed by
inoculum concentration, disc rotation speed (rpm), and fermentation period.
ACKNOWLEDGMENTS
The authors would like to thank the Ministry of Science and Innovation (MOSTI)
Malaysia, the Ministry of Higher Education (MOHE), and Research Grant
(QJ130000.2544.03H98) from Research Management Centre UTM for their support of
this study.
REFERENCES CITED
Bae, S., and Shoda, M. (2005). “Statistical optimization of culture conditions for bacterial
cellulose production using Box-Behnken design,” Biotechnology and Bioengineering
90(1), 20-28.
Chang, Y. C., Lee, C. I., and Pan, T. M. (2006). “Statistical optimization of media
components for the production of Antrodia cinnamomea AC0623 submerged
cultures,” Applied and Microbiology Biotechnology 72(4), 654-661.
Czaja, W., Krystynowicz, A., Bielecki, B., and Brown Jr., R. M. (2006). “Microbial
cellulose - The natural power to heal wounds,” Journal of Biomaterials 27(2), 145-
151.
Gupta, G., Basavaraj, S., and Hungund, S. (2010). “Production of bacterial cellulose from
Enterobacter amnigenus GH-1 isolated from rotten apple,” World Journal
Microbiology and Biotechnology 26(10), 1823-1828.
Hutchens, S. A., Leon, R. V., O'Neill, H. M., and Evans, B. R. (2007). “Statistical
analysis of optimal culture conditions for Gluconacetobacter hansenii cellulose
production,” Letters in Applied Microbiology 44(2), 175-180.
Iguchi, M., Yamanaka, S., and Budhiono, A. (2000). “Bacterial cellulose: A masterpiece
of nature’s art,” Journal of Material Sciences 35(2), 261-270.

PEER-REVIEWED ARTICLE bioresources.com
Zahan et al. (2014). “Fermentation with rotary disc,” BioResources 9(2), 1858-1872. 1871
Joglekar, A. M., and May, A. T. (1987). “Product excellence through design of
experiments,” Cereal Food World 32(12), 857-868.
Keshk, S., and Sameshima, K. (2006). “Influence of lignosulfonate on crystal structure
and productivity of bacterial cellulose in a static culture,” Journal of Enzyme and
Microbial Technology 40(1), 4-8.
Keshk, S. M. A. S., and Sameshima, K. (2005). “Evaluation of different carbon sources
for bacteria cellulose production,” Article Journal of Biotechnology 4(6), 478.
Kim, J. Y., Kim, J. N., Wee, Y. J., Park, D. H., and Ryu, H. W. (2007). “Bacterial
cellulose production by Gluconacetobacter sp. RKY5 in a rotary biofilm contactor,”
Applied Biochemistry and Biotechnology 137(1), 529-537.
Kouda, T., Yano, H., and Yoshinaga, F. (1997). “Effect of agitator configuration on
bacterial cellulose productivity in aerated and agitated culture,” Journal of
Fermentation and Bioengineering 83(4), 371-376.
Krystynowicz, A., Czaja, W., Wiktorowska-Jezierska, A., Goncalves-Miskiewicz, M.,
Turkiewicz, M., and Bielecki, S. (2002). “Factors affecting the yield and properties of
bacterial cellulose,” Journal of Industrial Microbiology and Biotechnology 29(4),
189-195.
Kurosumi, A., Sasaki, C., Yamashita, Y., and Nakamura, Y. (2009). “Utilization of
various fruit juices as carbon source for production of bacterial cellulose by
Acetobacter xylinum NBRC 13693,” Carbohydrate Polymers 76(2), 333-335.
Myers, R. H., and Montgomery, D. C. (2002). “Response Surface Methodology: Process
and Product Optimization using Designed Experiments,” 2nd
Edition, John Wiley &
Sons, New York.
Norhayati, P., Khairul, A. Z., and Ida, I. M. (2011). “Production of biopolymer from
Acetobacter xylinum using different fermentation methods,” International Journal of
Engineering & Technology 11(5), 90-98.
Noro, N., Sugano, Y., and Shoda, M. (2004). “Utilization of the buffering capacity of
corn steep liquor in bacterial cellulose production by Acetobacter xylinum,” Applied
Microbiology and Biotechnology 64(2), 199-205.
Pa’e, N., Hui, C. C., and Muhamad, I. I. (2007). “Shaken culture fermentation for
production of microbial cellulose using pineapple waste,” International Conference
on Waste to Wealth. 26-28 November, Kuala Lumpur, Malaysia Nuclear Agency
(MINT).
Pa’e, N. (2009). “Rotary discs reactor for enhanced production of microbial cellulose,”
Master Degree Thesis, Faculty of Chemical Engineering, Universiti Teknologi
Malaysia, Skudai, Johor.
Preetha, B., and Viruthagiri, T. (2007). “Application of response surface methodology for
the biosorption of copper using Rhizopus arrhizus,” Journal of Hazardous Materials
143(1-2), 506-510.
Ross, P., Mayer, R., and Benzimen, M. (1991). “Cellulose biosynthesis and function in
bacteria,” Microbiological Reviews 55(1), 35-38.
Sasaki, K., Noparatnaraphorn, N., and Nagai, S. (1991). “Use of photosynthetic bacteria
for the production of SCP and chemicals from agro industrial waste,” in:
Bioconversion of Waste Material to Industrial Product, A. M. Martin (ed.), Elsevier
Applied Science, London, pp. 225-233.
Shigematsu, T., Takamine, K., Kitazato, M., Morita, T., Naritomi, T., and Morimura, S.
(2005). “Cellulose production from glucose using a glucose dehydrogenase gene

PEER-REVIEWED ARTICLE bioresources.com
Zahan et al. (2014). “Fermentation with rotary disc,” BioResources 9(2), 1858-1872. 1872
(GDH)-deficient mutant of Gluconacetobacter xylinus and its use for bioconversion
of sweet potato pulp,” Journal of Bioscience and Bioengineering 99(4), 415-422.
Soo, Y. K., Jin, N. K., Young, J. W., Don, H. P., and Hwa, W. R. (2006). “Production of
bacterial cellulose by Gluconacetobacter sp. RKY5 isolated from persimmon
vinegar,” Applied Biochemistry and Biotechnology 131(1-3), 705-715.
Wang, Y. X., and Lu, Z. X. (2005). “Optimization of process parameters for the mycelial
growth and extracellular polysaccharide production by Boletus spp.,” Process
Biochemical 40(3-4), 1043-1051.
Zeng, X., Darcy, P. S., and Wankei, W. (2011). “Statistical optimization of culture
conditions for bacterial cellulose production by Acetobacter xylinum BPR 2001 from
maple syrup,” Carbohydrate Polymers 85(3), 506-513.
Article submitted: November 25, 2013; Peer review completed: January 19, 2014; Revised
version received and accepted: January 29, 2014; Published: February 6, 2014.